
Nationwide WWSCAN Update 3/22/24
Hi everyone,
This newsletter contains updates on the WastewaterSCAN program with wastewater samples analyzed by the lab through March 20, 2024. Below you will find information on the program in terms of participating partners, review of targets being measured, as well as current categories (low, medium, high) of the infectious disease targets.
Ali & Marlene
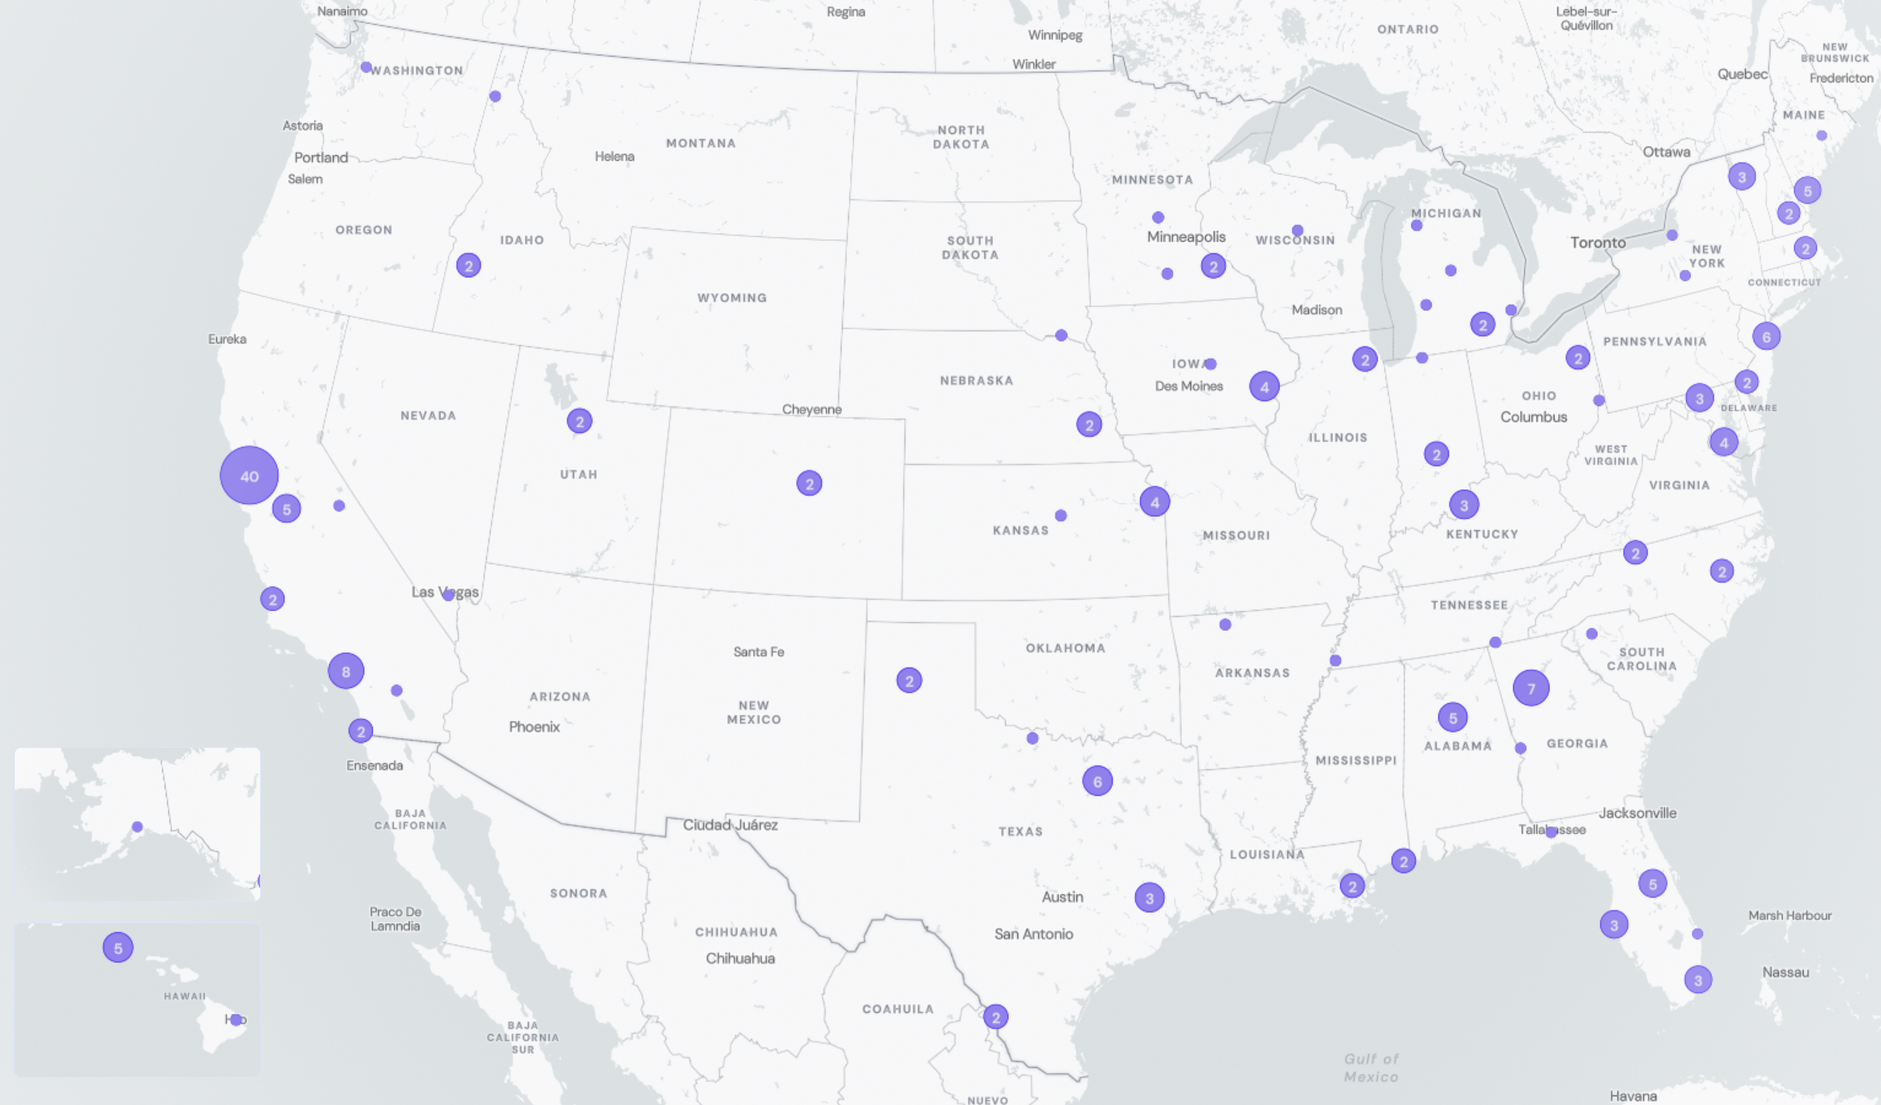
Participating Plants
191 plants from 40 states and Washington DC are sampling, which represents ~13.5% of the US population
WastewaterSCAN Participant Stats:
- 191 plants sampling
- 45,350,248 people covered through sampling efforts
- 40 states and Washington DC represented
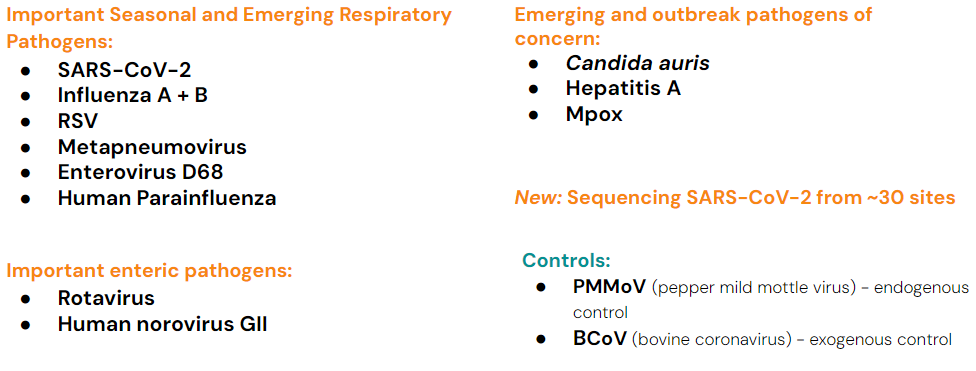
Infectious Disease Target Review
Currently monitoring a suite of Respiratory, Gastrointestinal and Outbreak Pathogens of Concern
The methods for our assays are in the public domain and links for these are provided at the end of the newsletter.
Program Updates
WWSCAN funding is secured through Spring 2024 plus new papers and fact sheets!
WastewaterSCAN currently has funding to continue monitoring until approximately June 2024.
NEW PAPERS:
- Persistence of human respiratory viral RNA in wastewater-settled solids
- Observations of Respiratory Syncytial Virus (RSV) Nucleic Acids in Wastewater Solids Across the United States in the 2022–2023 Season: Relationships with RSV Infection Positivity and Hospitalization Rates
NEW PUBLIC HEALTH FACTSHEETS:
- Influenza A Fact Sheet: Provides a summary of a November 2023 paper exploring how to analyze wastewater data to extract relevant public health insights on Influenza A. Click here to access the IAV fact sheet.
- RSV Fact Sheet: Provides a summary of a March 2024 paper exploring how to analyze wastewater data to extract relevant public health insights on RSV. Click here to access the RSV fact sheet.
COVID-19
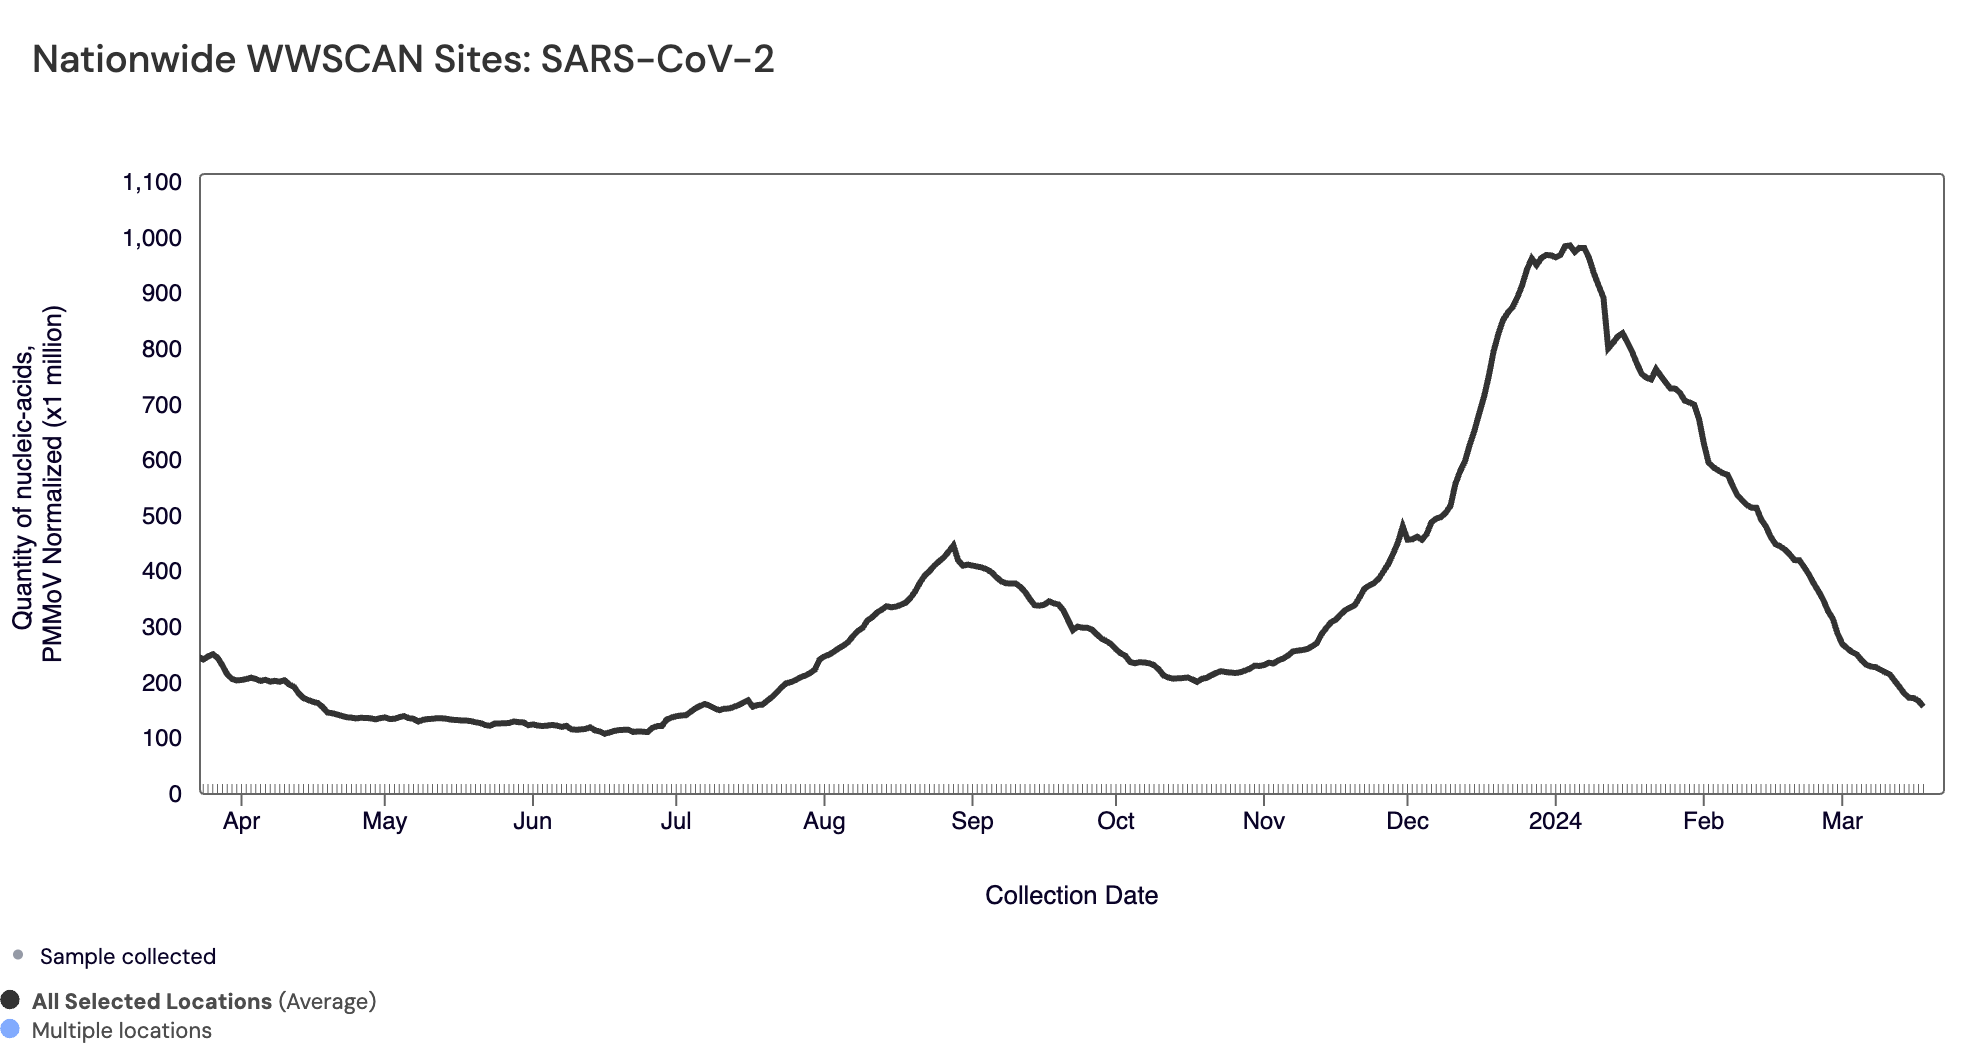
SARS-CoV-2 concentration in wastewater and sequencing for variants
SARS-CoV-2 N gene RNA median concentration across all sites over the last 21 days is 59,851 copies/gram. For reference, the median concentration in February 2024 was 143,437 copies/gram. Below is the population weighted average SARS-CoV-2 N gene concentrations (normalized by PMMoV) from all participating WWSCAN sites across the country over the last 365 days.
Nationally, SARS-CoV-2 is in the "Medium" category with aggregated measurements showing medium concentrations and a downward trend over the past 21 days.
Below are the population-weighted average SARS-CoV-2 N gene concentrations (normalized by PMMoV) from sites in the Midwest US (top left panel), Northeast US (top right panel), Southern US (bottom left panel) and Western US (bottom right panel) over the last 365 days. Raw data have been omitted from the plots for clarity of presentation but are still available in the chart settings on dashboard.
The Northeast, South, and West regions are currently in the "Medium" category, and the Midwest is in the "High" category.
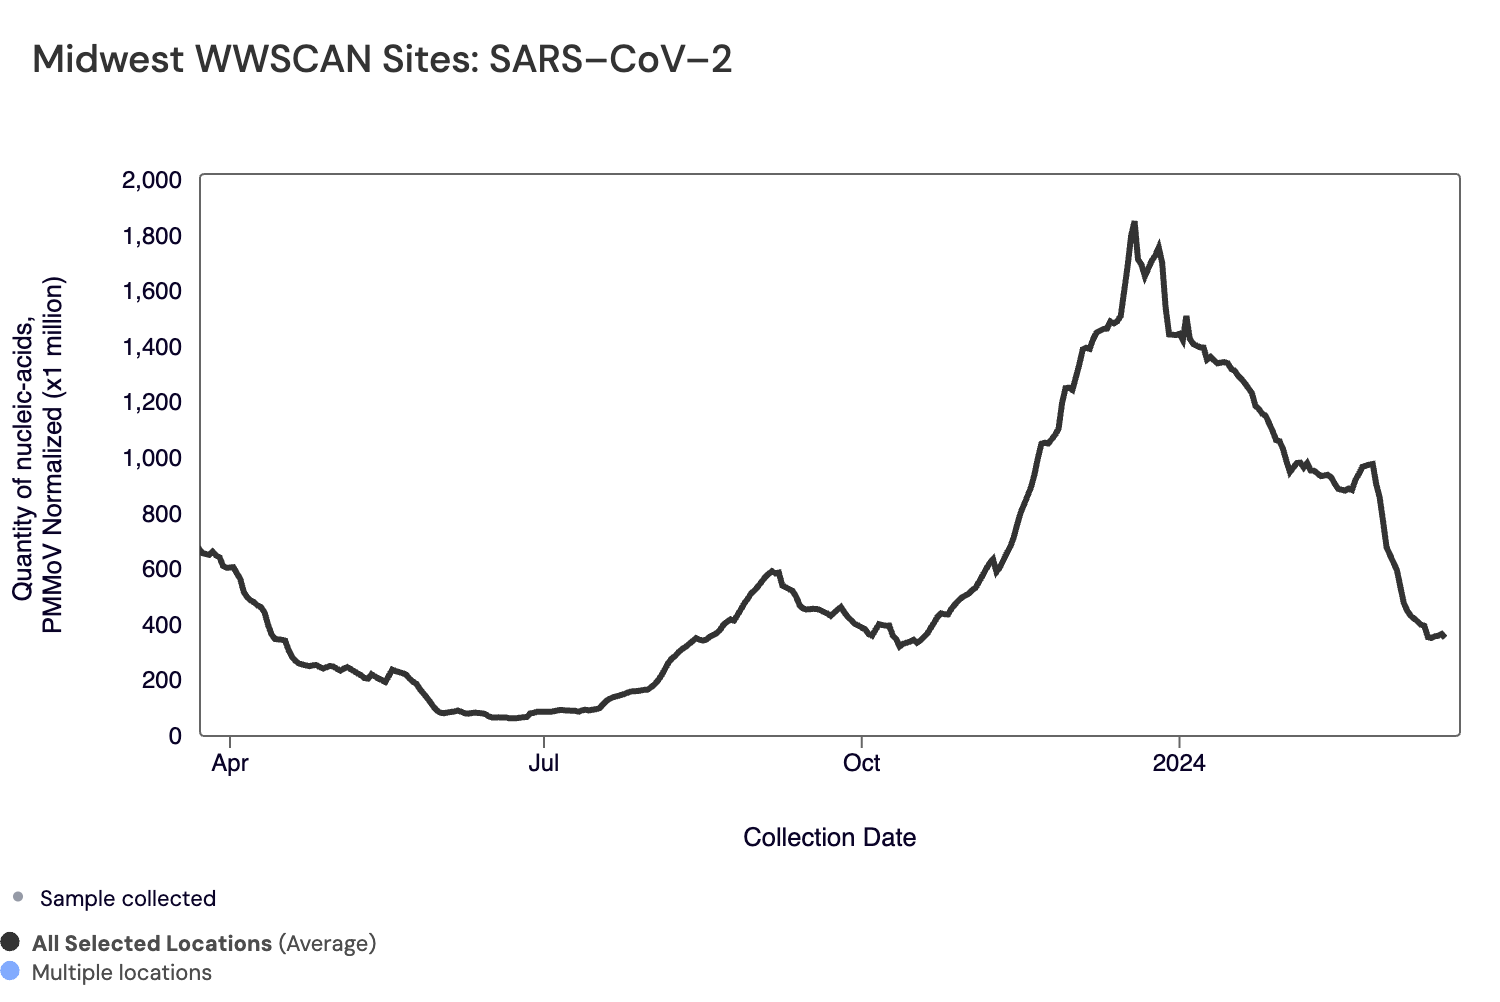
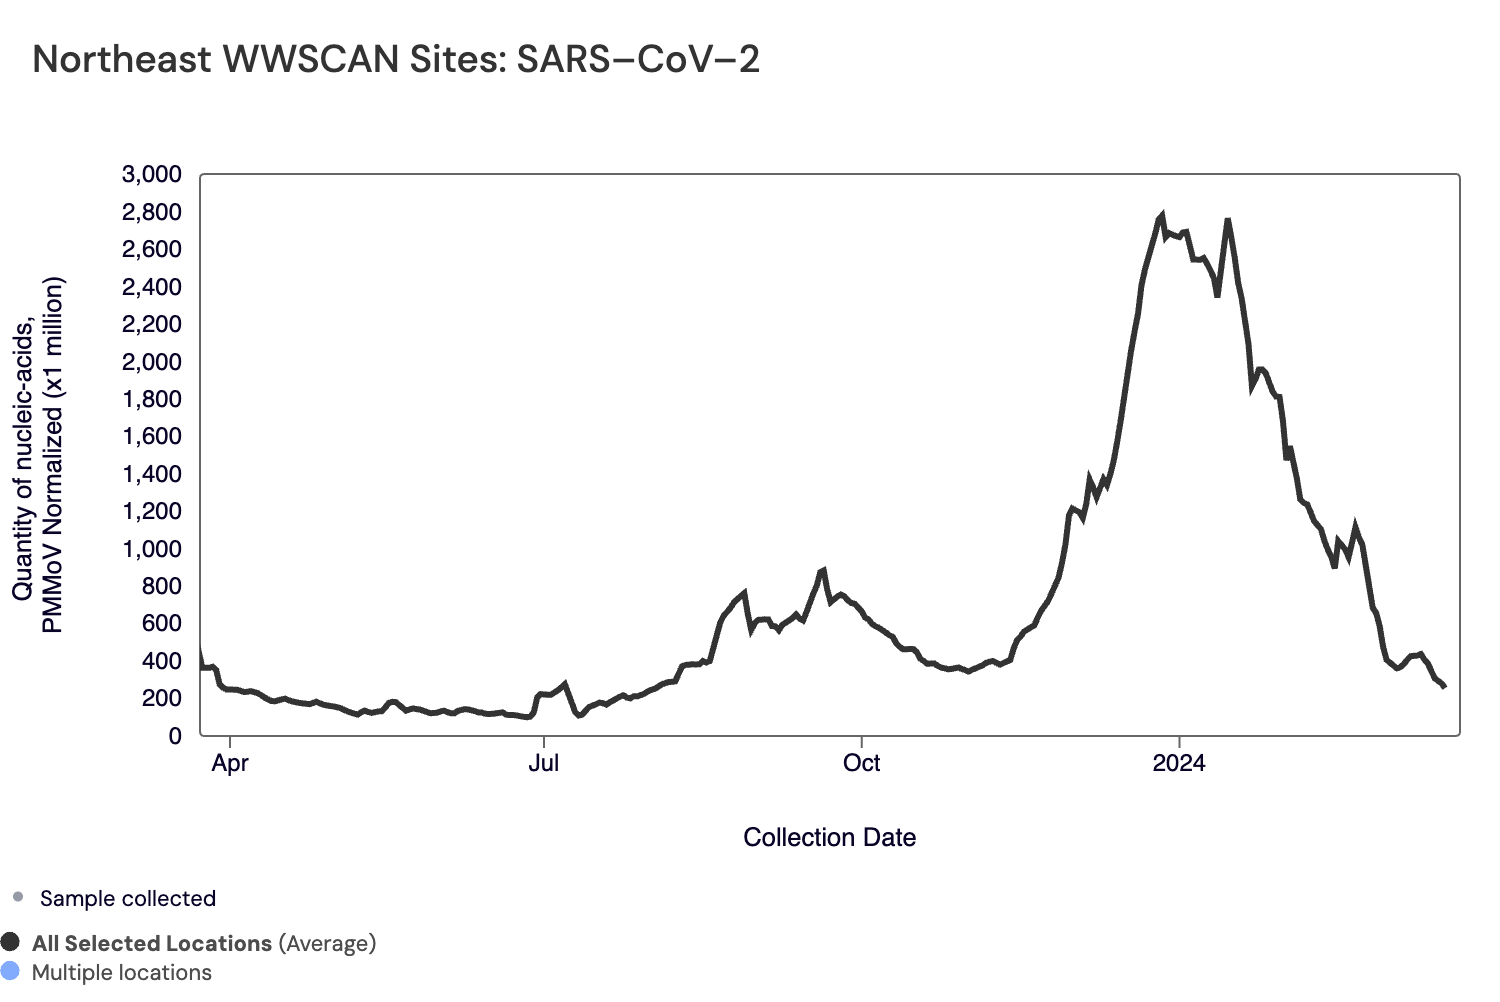
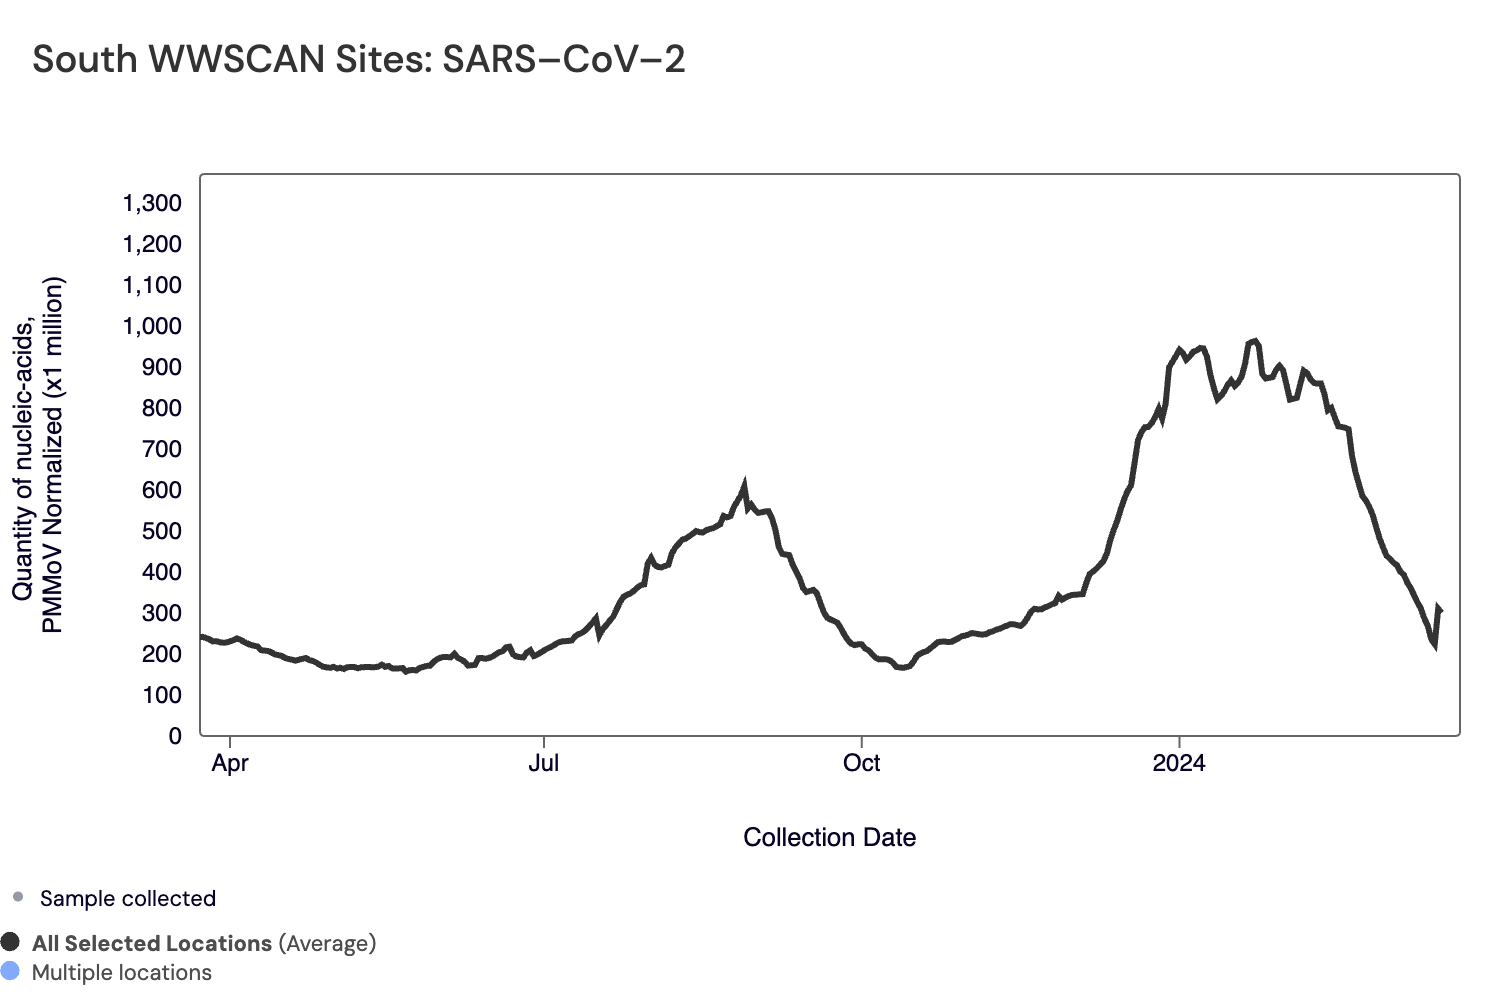
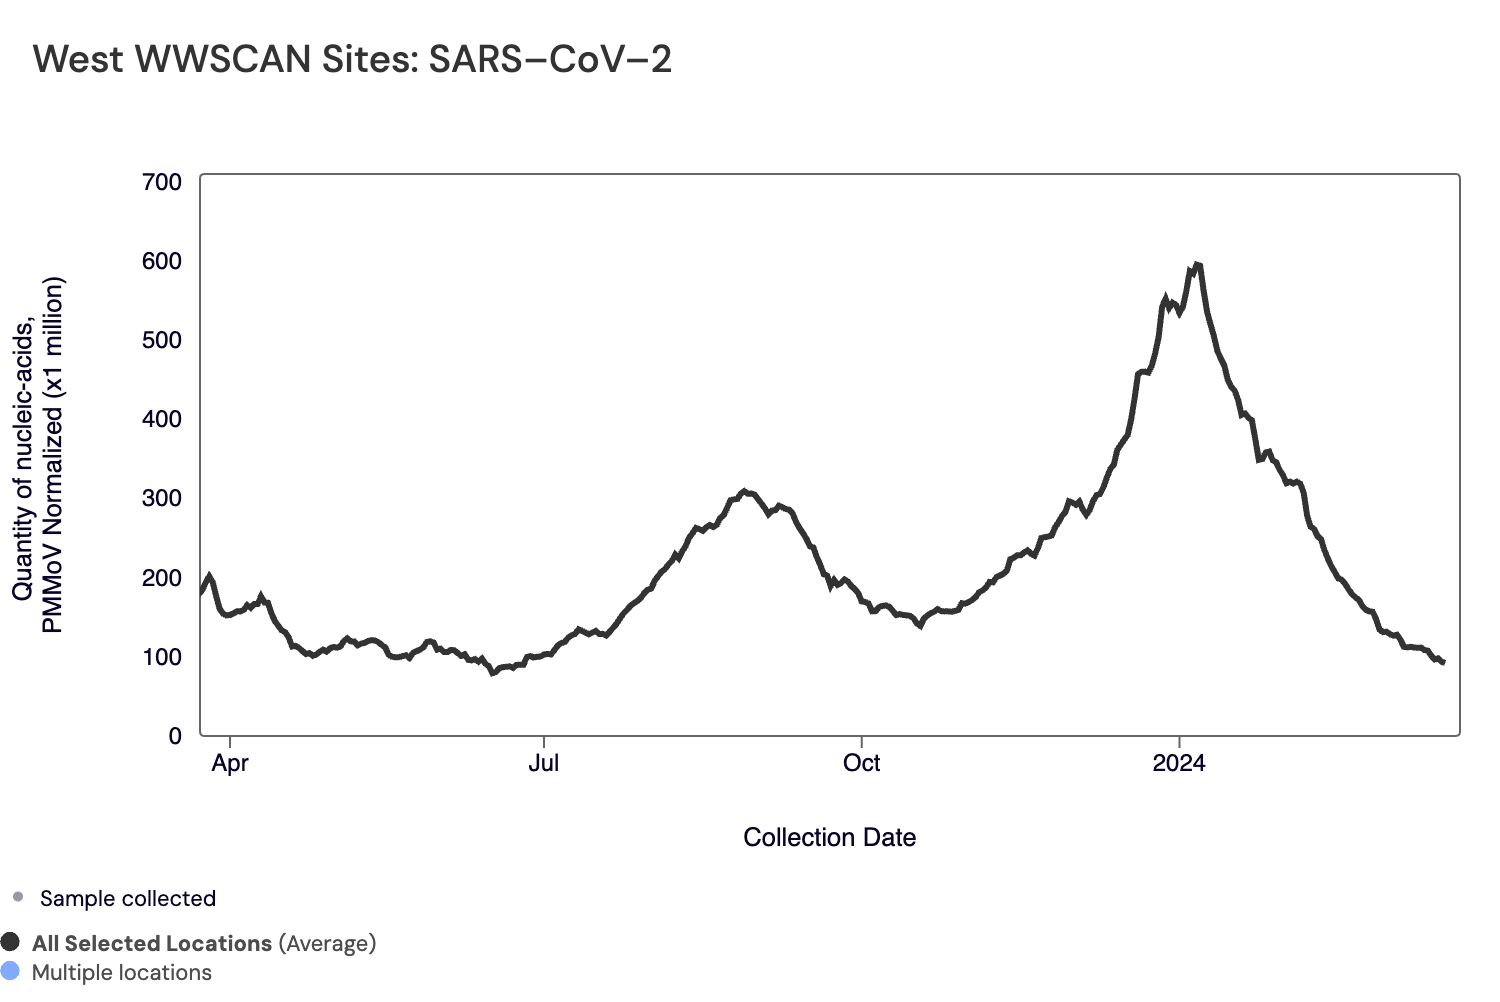
Midwest states: IA, IL, IN, KS, MI, MN, NE, OH, SD, WI. Northeast states: CT, MA, ME, NH, NJ, NY, PA, VT. Southern states: AL, AR, DE, FL, GA, KY, LA, MD, MS, NC, TN, TX, VA, WV and Washington DC. Western States: AK, CA, CO, HI, ID, NV, UT, WA.
Below are the current SARS-CoV-2 wastewater categories for all WWSCAN sites (recall the category is determined by both the trend and the level):
- 82 are in the LOW Wastewater Category
- 68 are in the MEDIUM Wastewater Category
- 28 are in the HIGH Wastewater Category
- 14 do not have enough data to calculate (Fremont, CA; Newark, CA; Pacifica, CA; Petaluma, CA; South San Diego, CA; Union City, CA; South Miami, FL; Hilo, HI; Bloomington, IN; Muscatine, IA; Louisville, KY; Portland, ME; Gautier, MS; Pascagoula Moss Point, MS; Chester, PA)
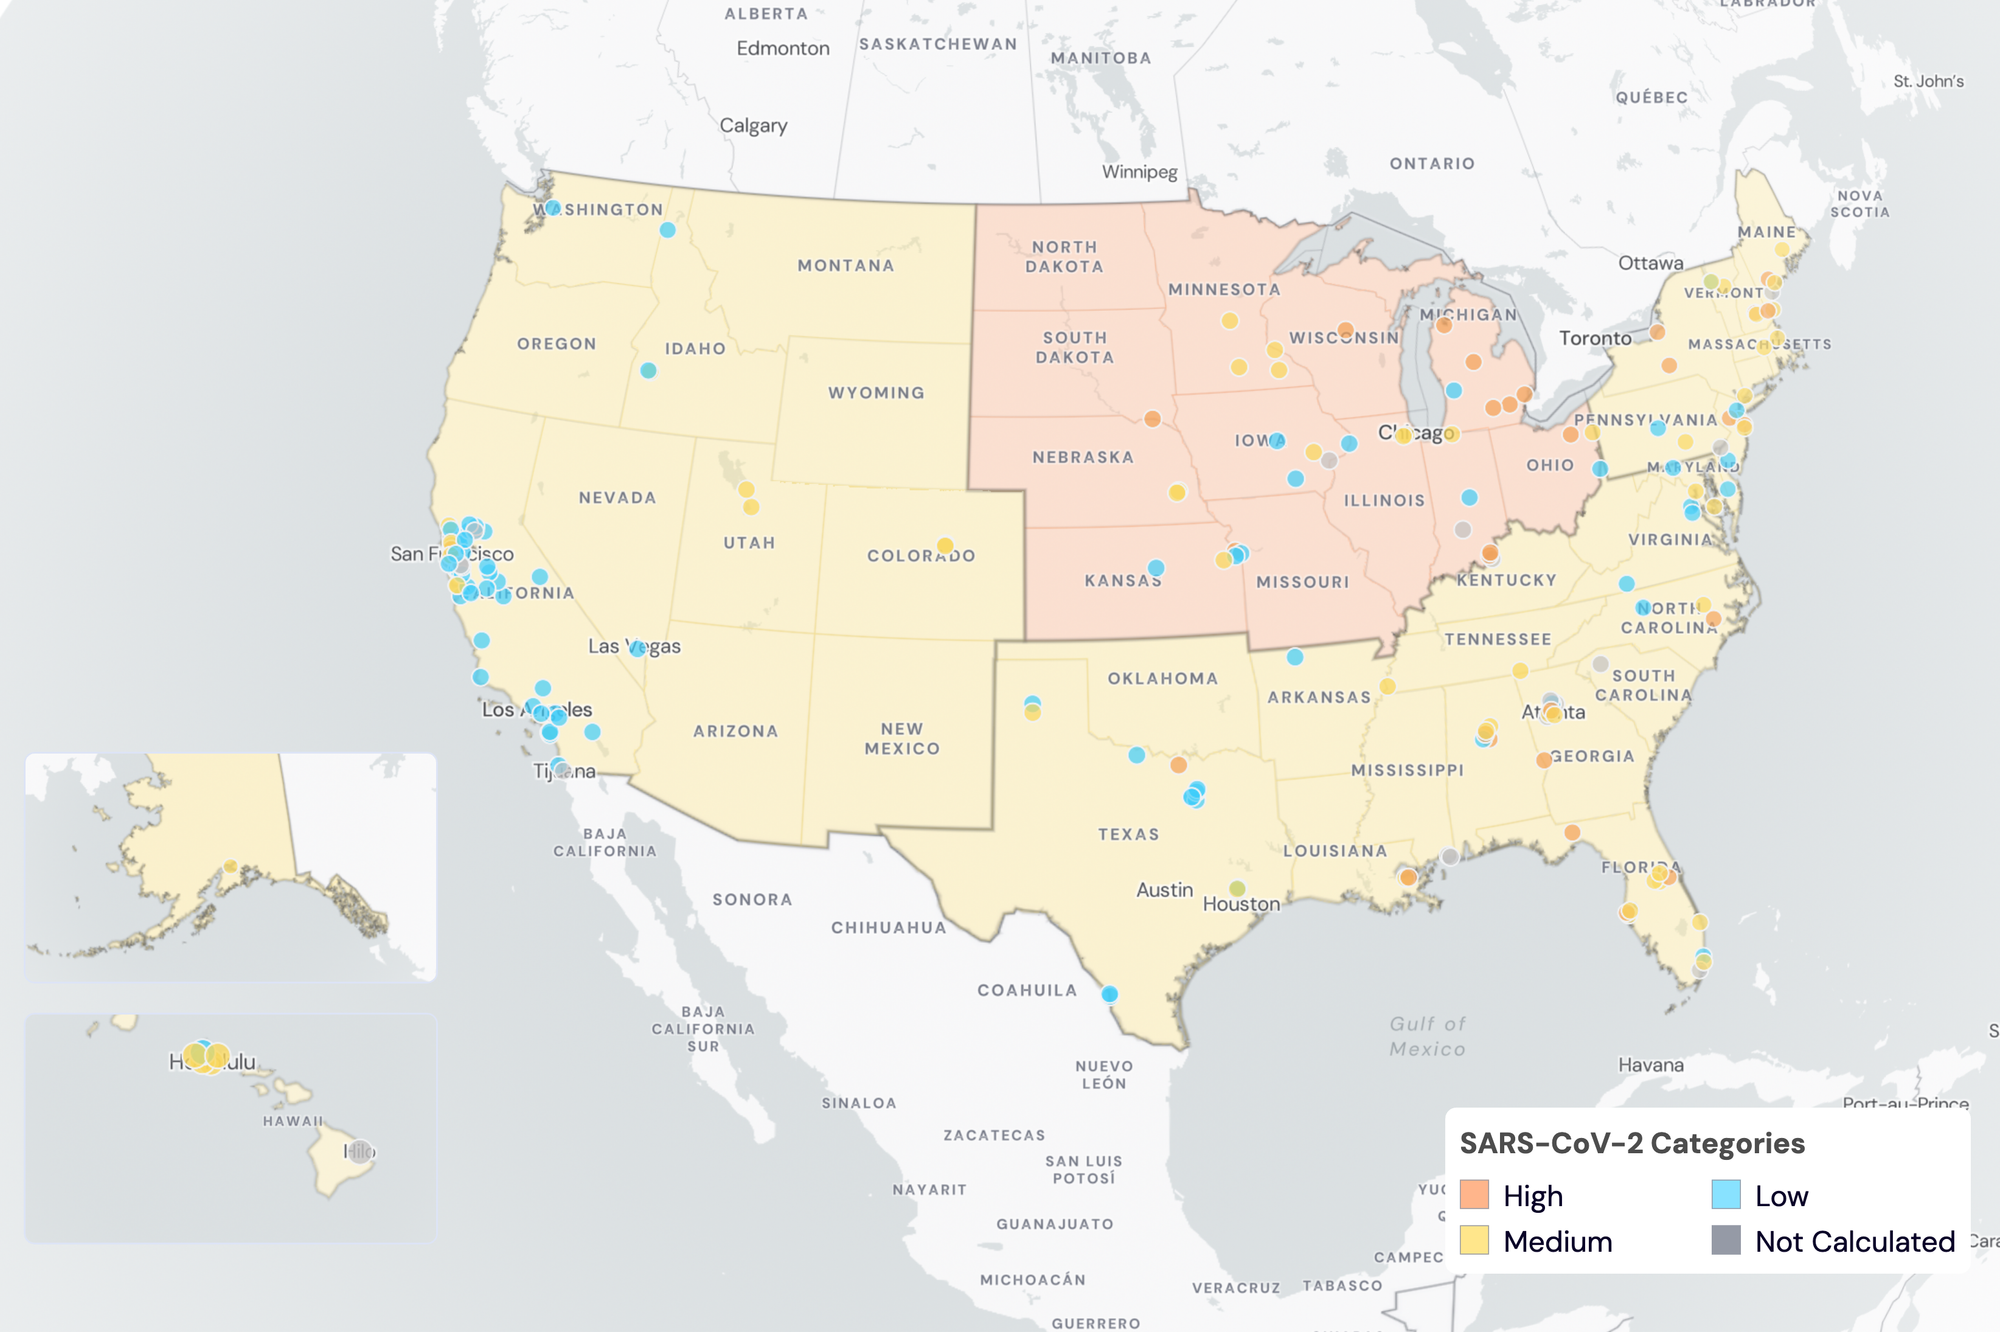
SARS-CoV-2 Wastewater Categories. This map includes sample collection data through March 20, 2024. Each dot represents a single site and the four US Census regions are outlined in gray. Midwest Region includes: IA, IL, IN, KS, MI, MN, NE, OH, SD, WI. Northeast Region includes: CT, MA, ME, NH, NJ, NY, PA, VT. Southern Region includes: AL, AR, DE, FL, GA, KY, LA, MD, MS, NC, TN, TX, VA, WV and Washington DC. Western Region includes: AK, CA, CO, HI, ID, NV, UT, WA.
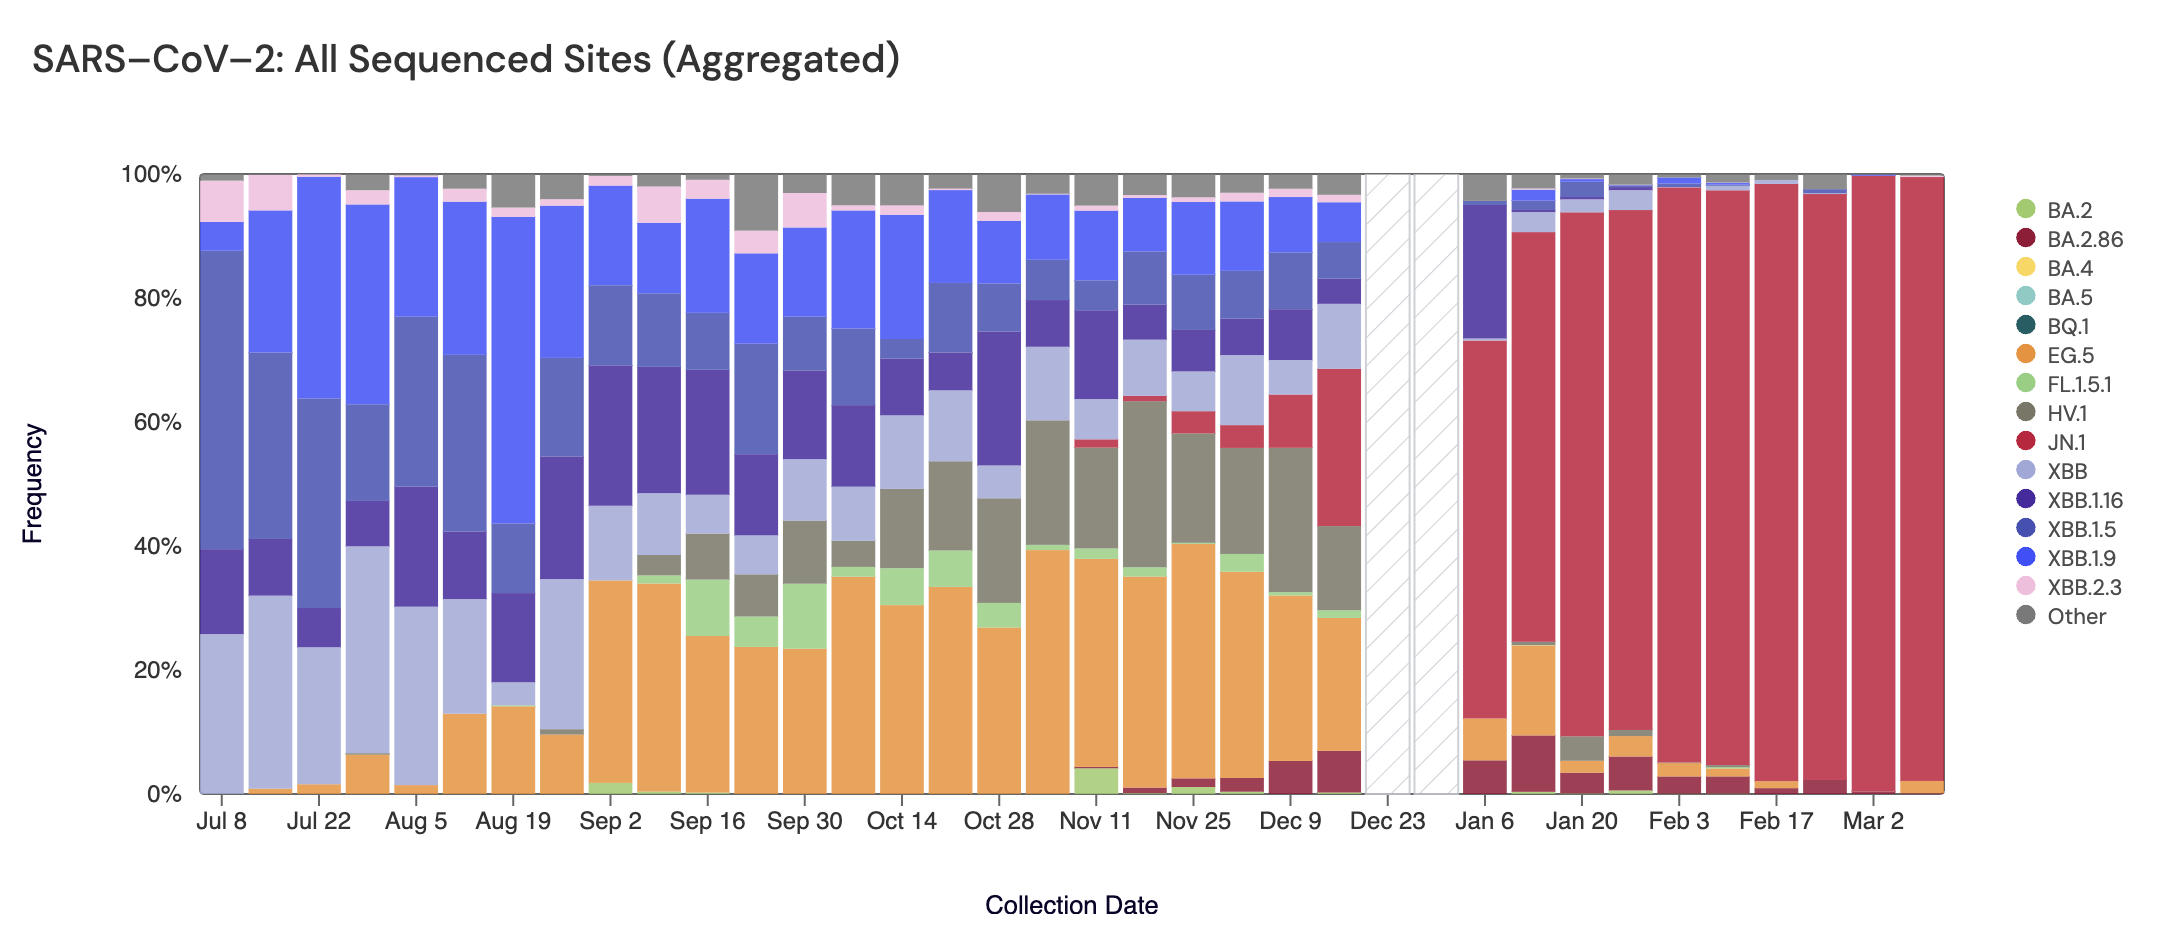
Sequencing of SARS-CoV-2 from wastewater is available for a select number of individual sites. The sequencing protocol is available on protocol.io. The plots below show the relative proportions of different variants inferred from sequencing the entire genome of SARS-CoV-2. Results are based on sequencing of 2 samples per week, combined to provide a weekly value.
Sequencing data is also available in aggregate across all sites in WWSCAN with sequencing data. That plot is shown below and also suggests that JN.1 is the most abundant variant across all sites (97.4%).
The plots show one site each from the Midwest (top left panel), Northeast (top right panel), South (bottom left panel) and West (bottom right panel). Data from the week of March 9th 2024 illustrates that JN.1 (bright red) made up the largest proportion of the lineages detected at detected at Rochester, MN (100%), Boston, MA (99.7%), Atlanta, GA (100%) and Honolulu, HI (82.4%).
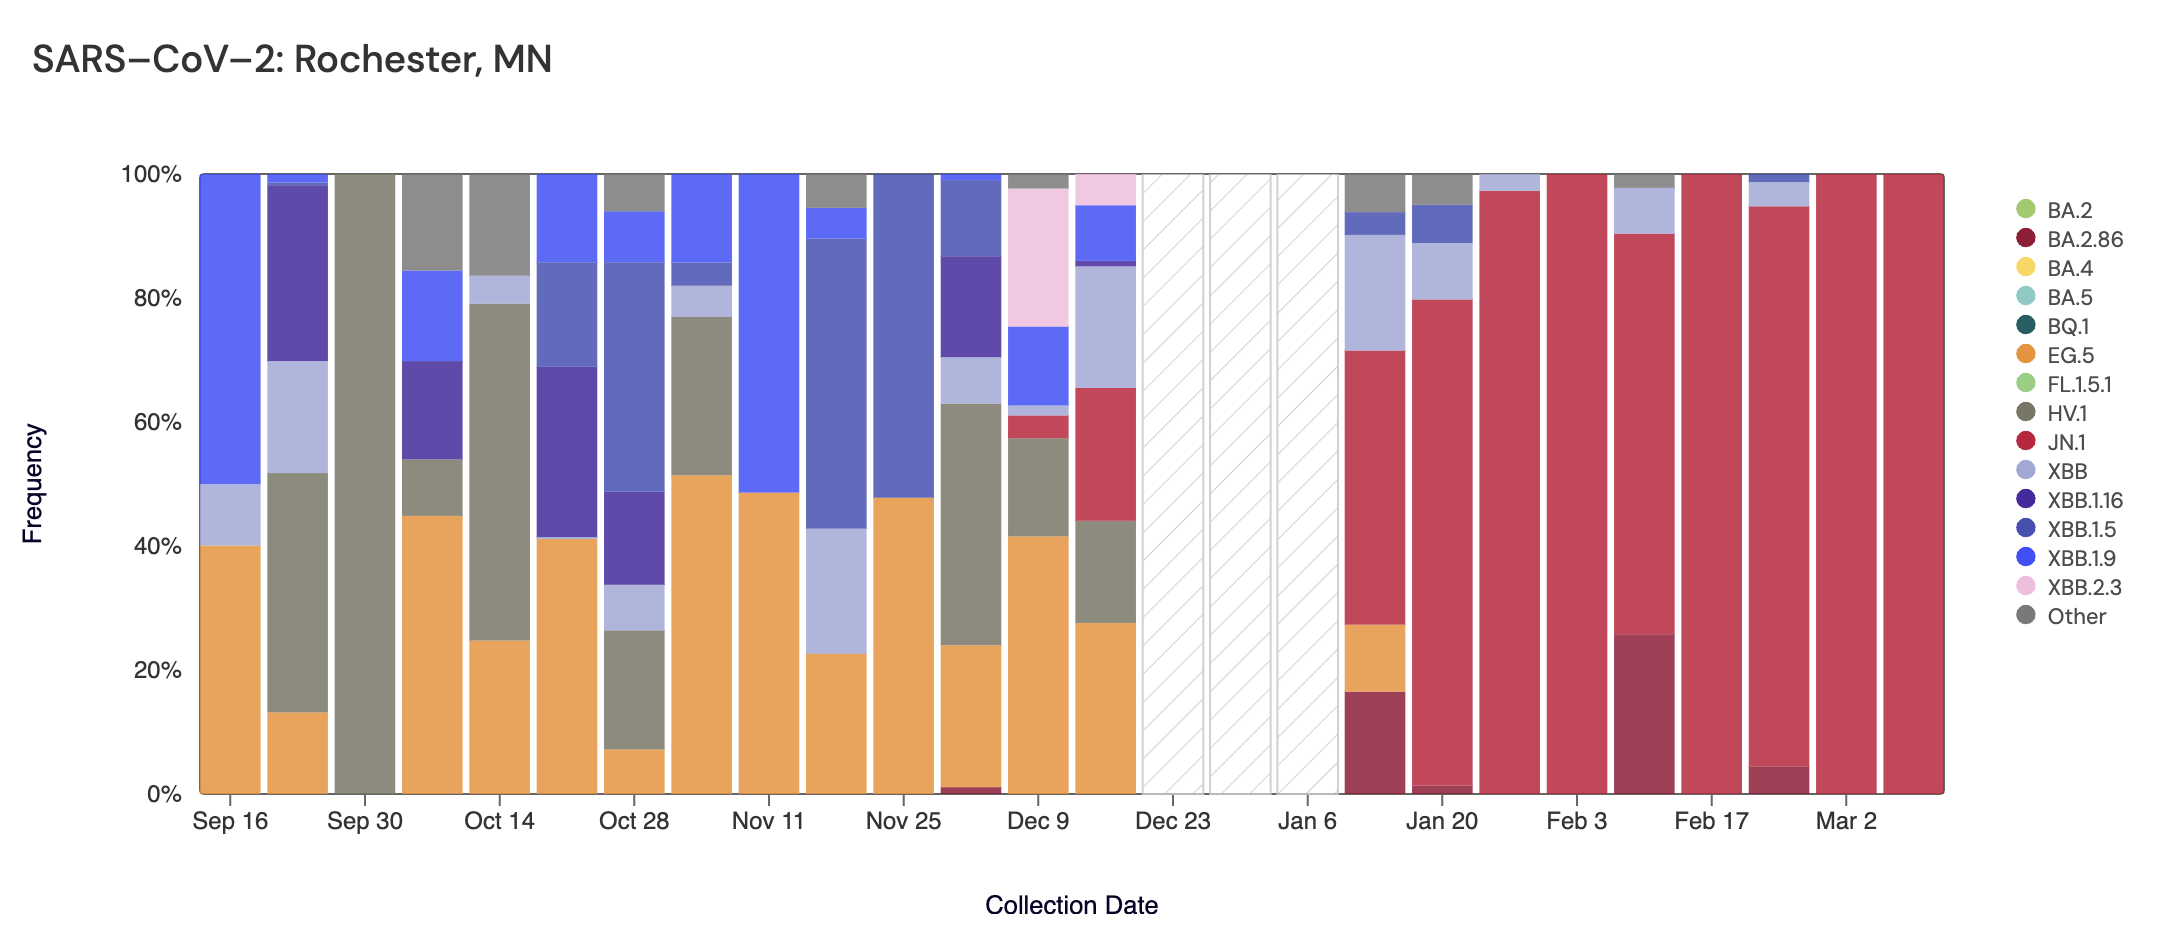
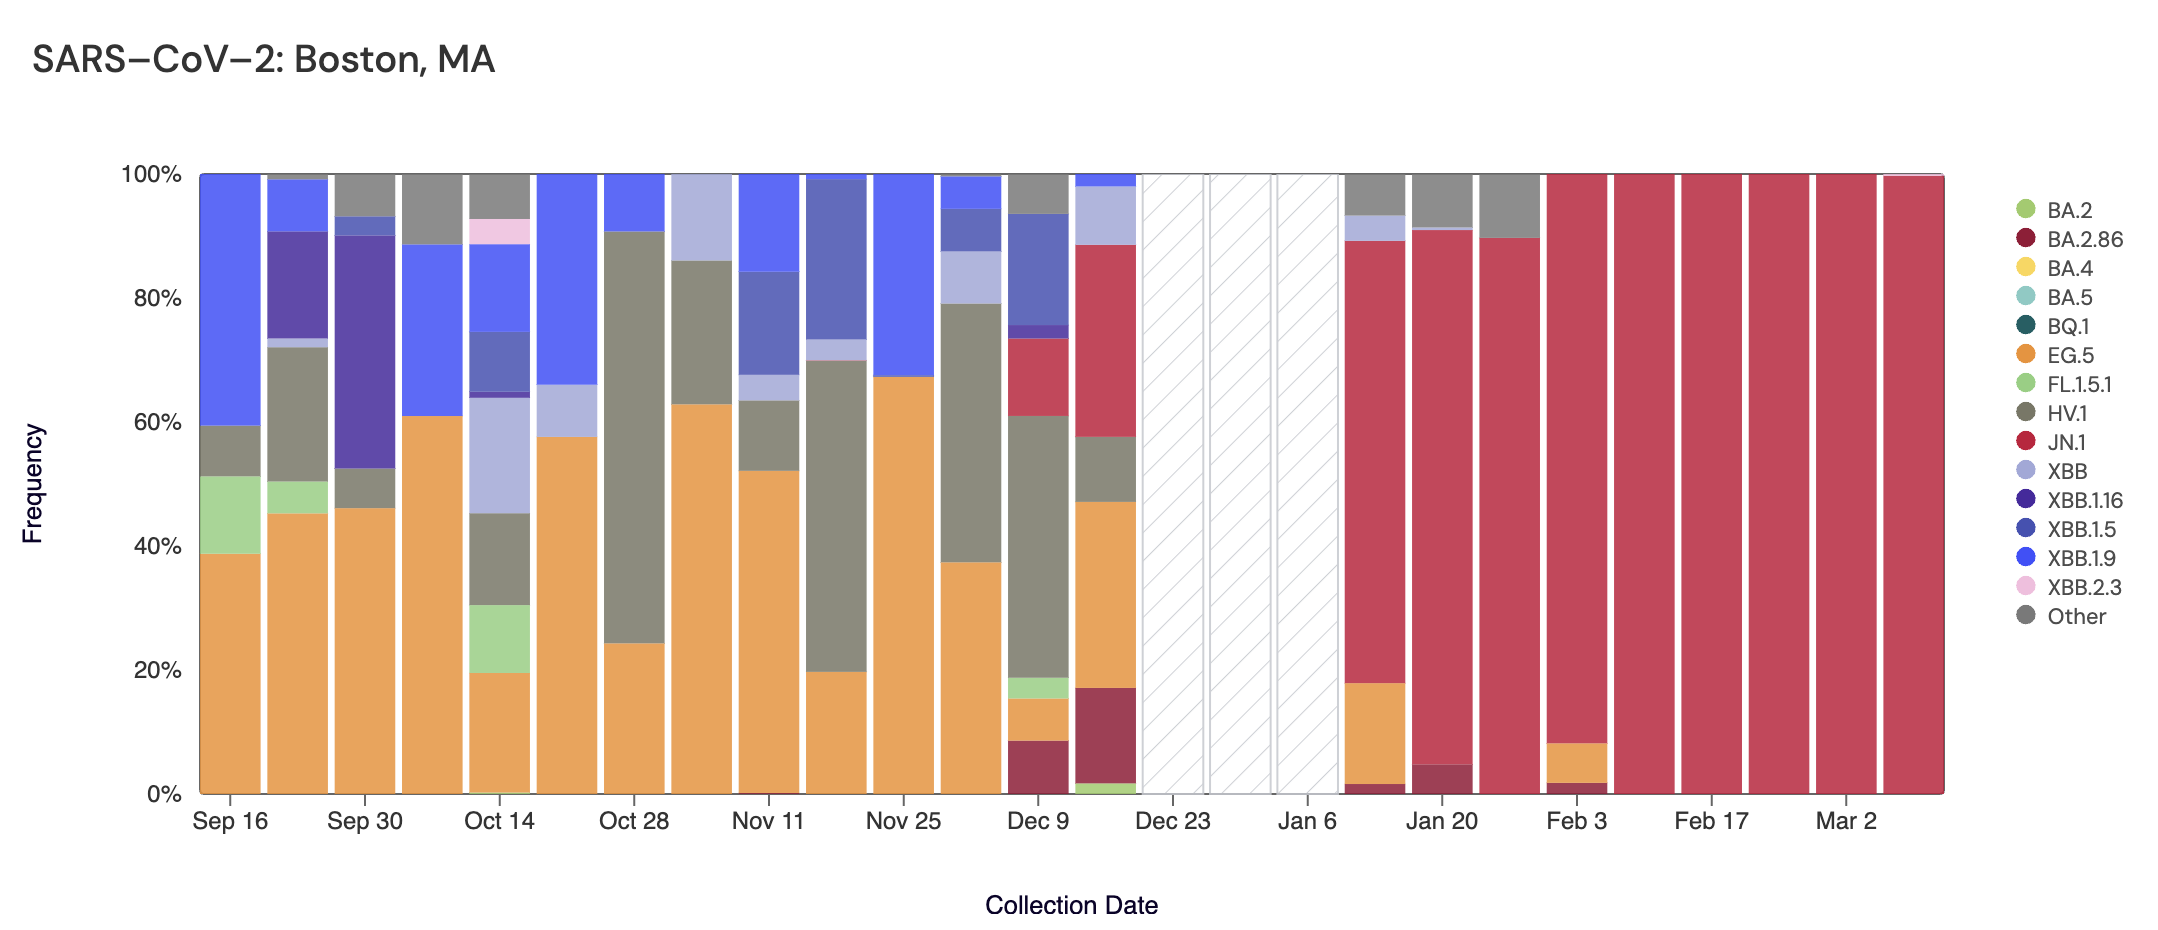
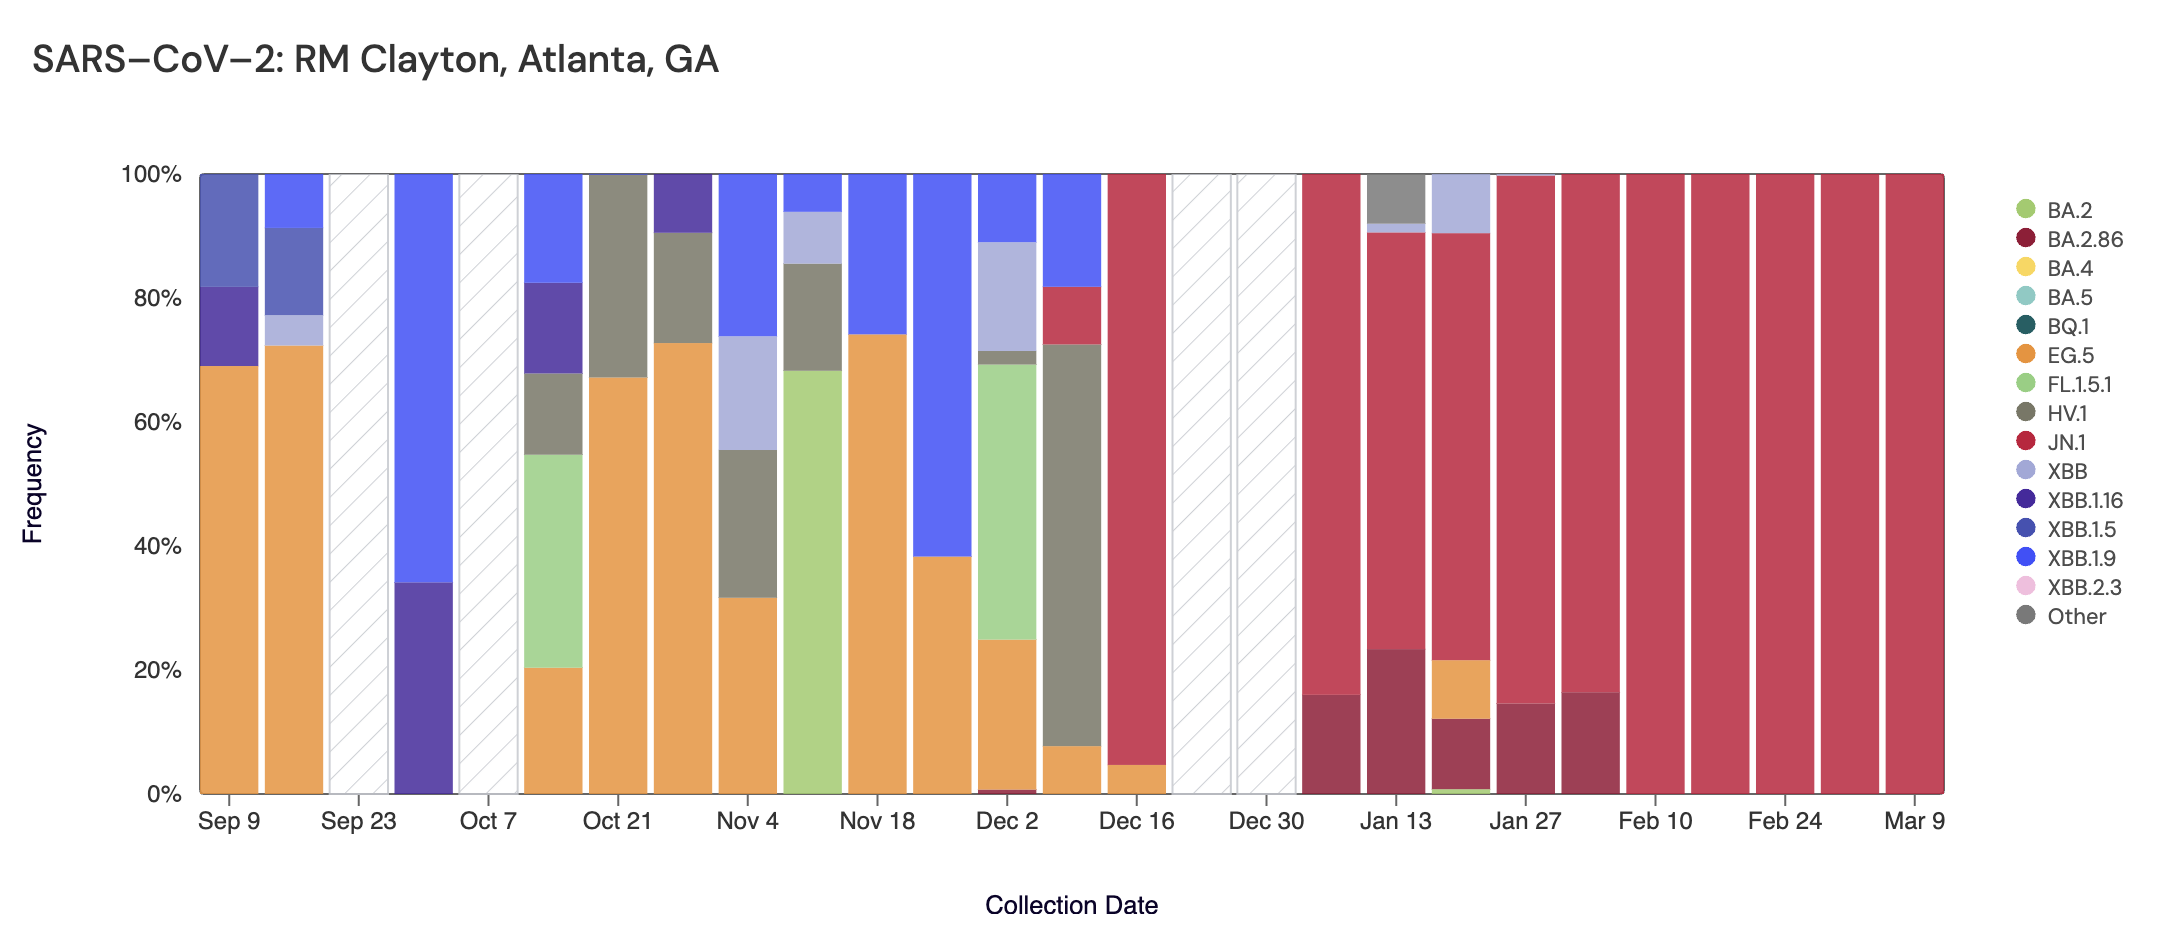
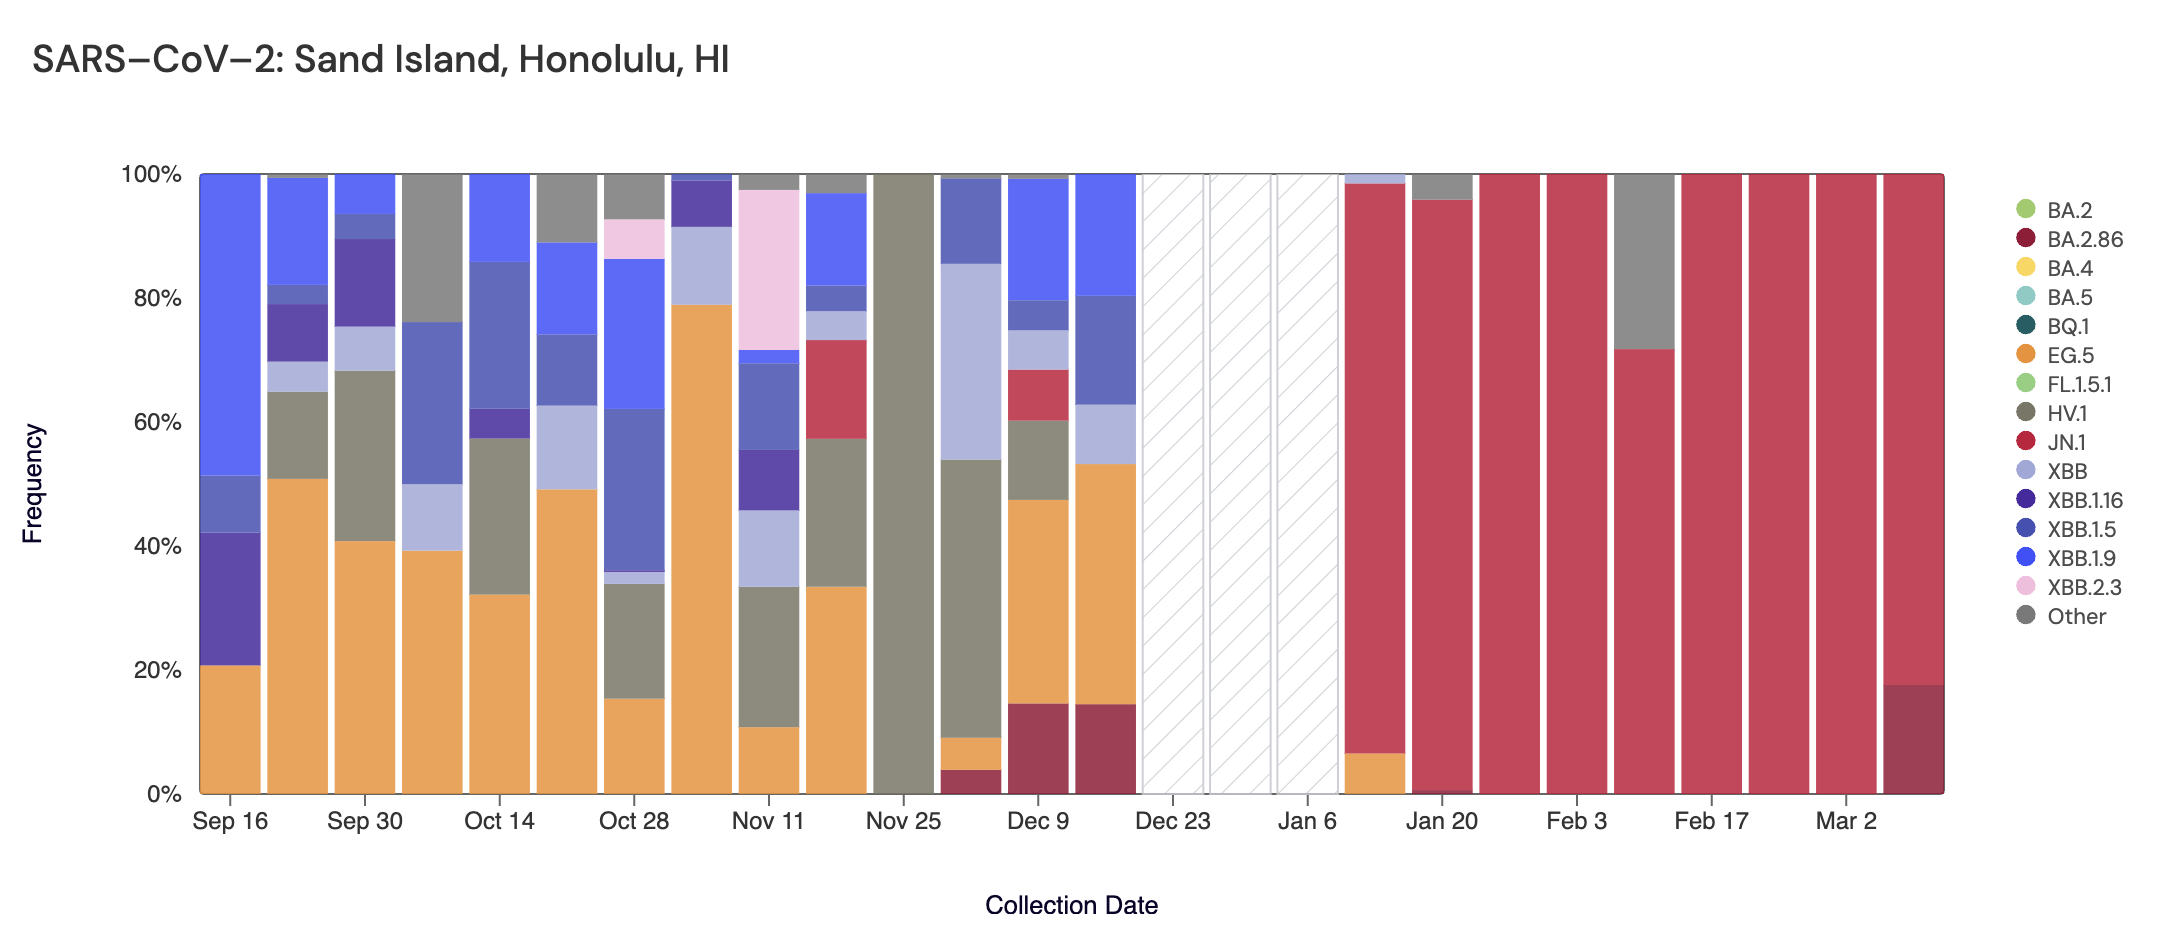
Plots show 1 site from the Midwest US (top left panel), Northeast US (top right panel), Southern US (bottom left panel) and Western US (bottom right panel)
Other Respiratory Pathogens
Influenza A & B, Respiratory Syncytial Virus, Human metapneumovirus, Human Parainfluenza & EV-D68
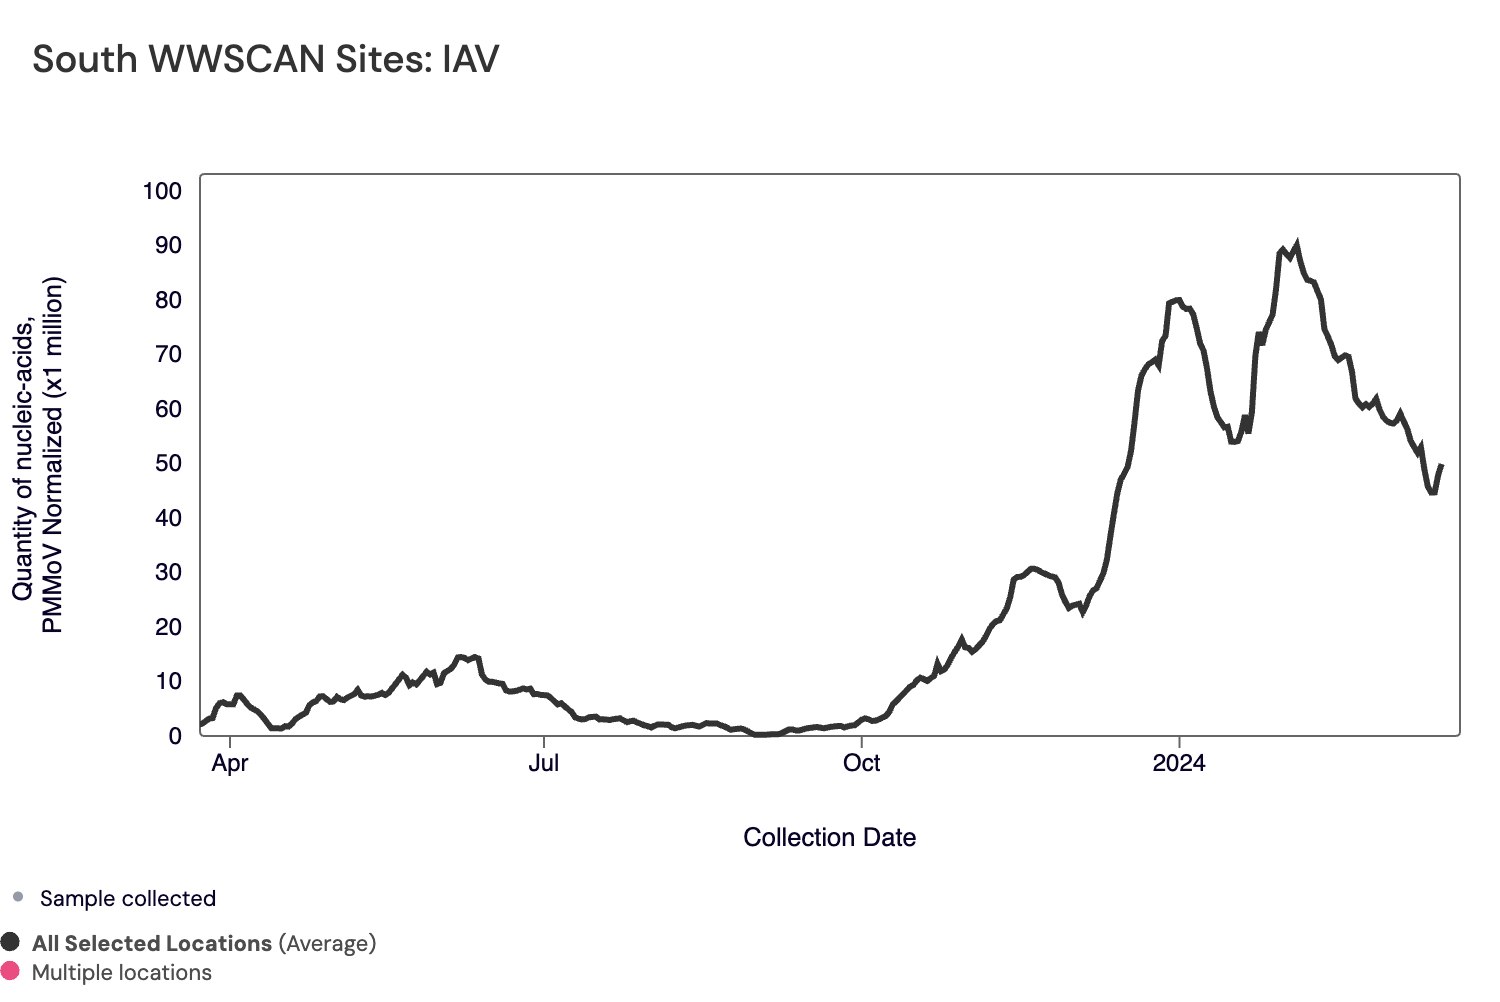
Influenza A (IAV) RNA median concentration across all sites over the last 21 days is 8,514 copies/gram. For reference, the median concentration in February 2024 was 15,400 copies/gram. Below is the population weighted average IAV concentrations (normalized by PMMoV) from all participating WWSCAN sites across the country over the last 365 days.
Nationally, IAV is in the "High" category with aggregated measurements showing high concentrations and a downward trend over the past 21 days.
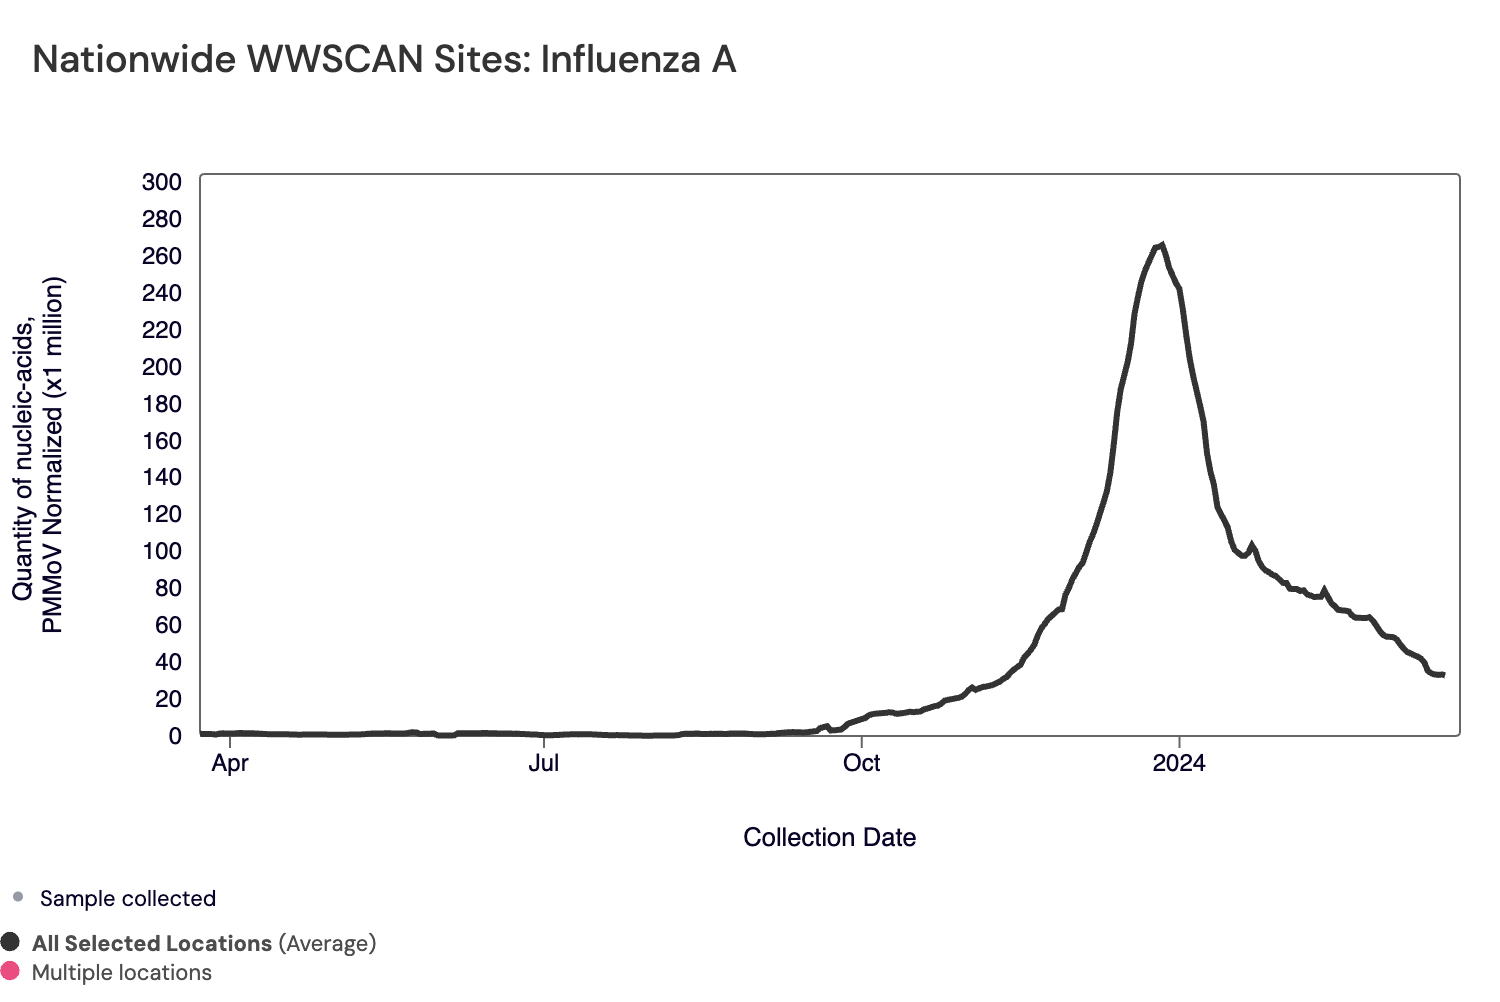
Below are the population-weighted average IAV RNA concentrations (normalized by PMMoV) from sites in the Midwest US (top left panel), Northeast US (top right panel), Southern US (bottom left panel) and Western US (bottom right panel) over the last 365 days.
The plots below show relatively high concentrations across all US regions with downward trends over the past 21 days.
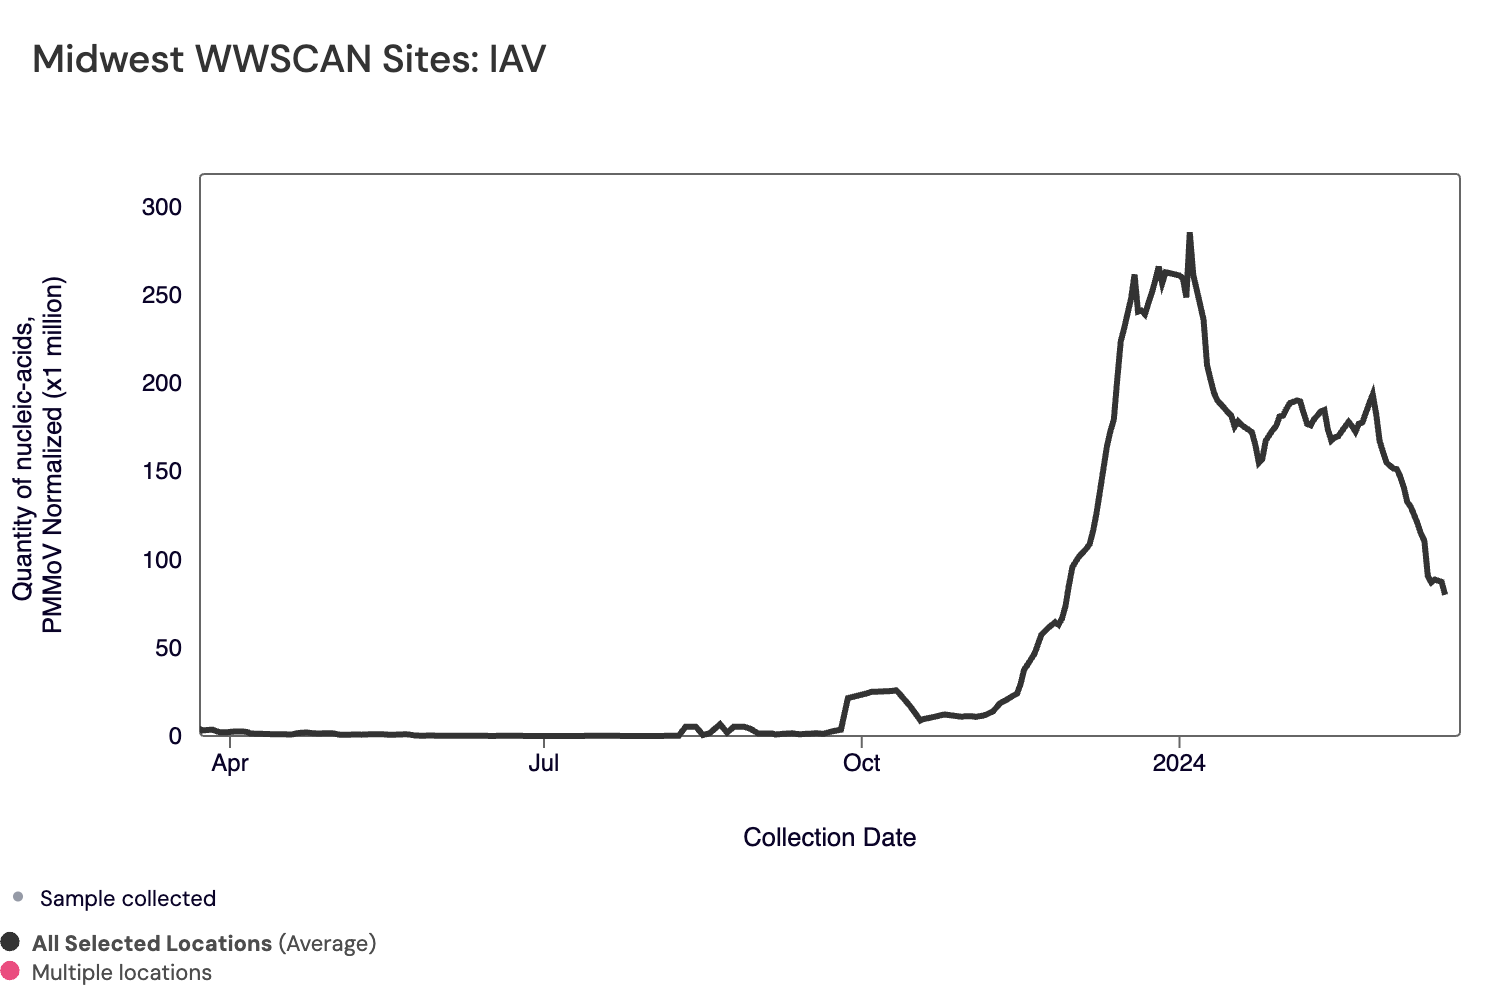
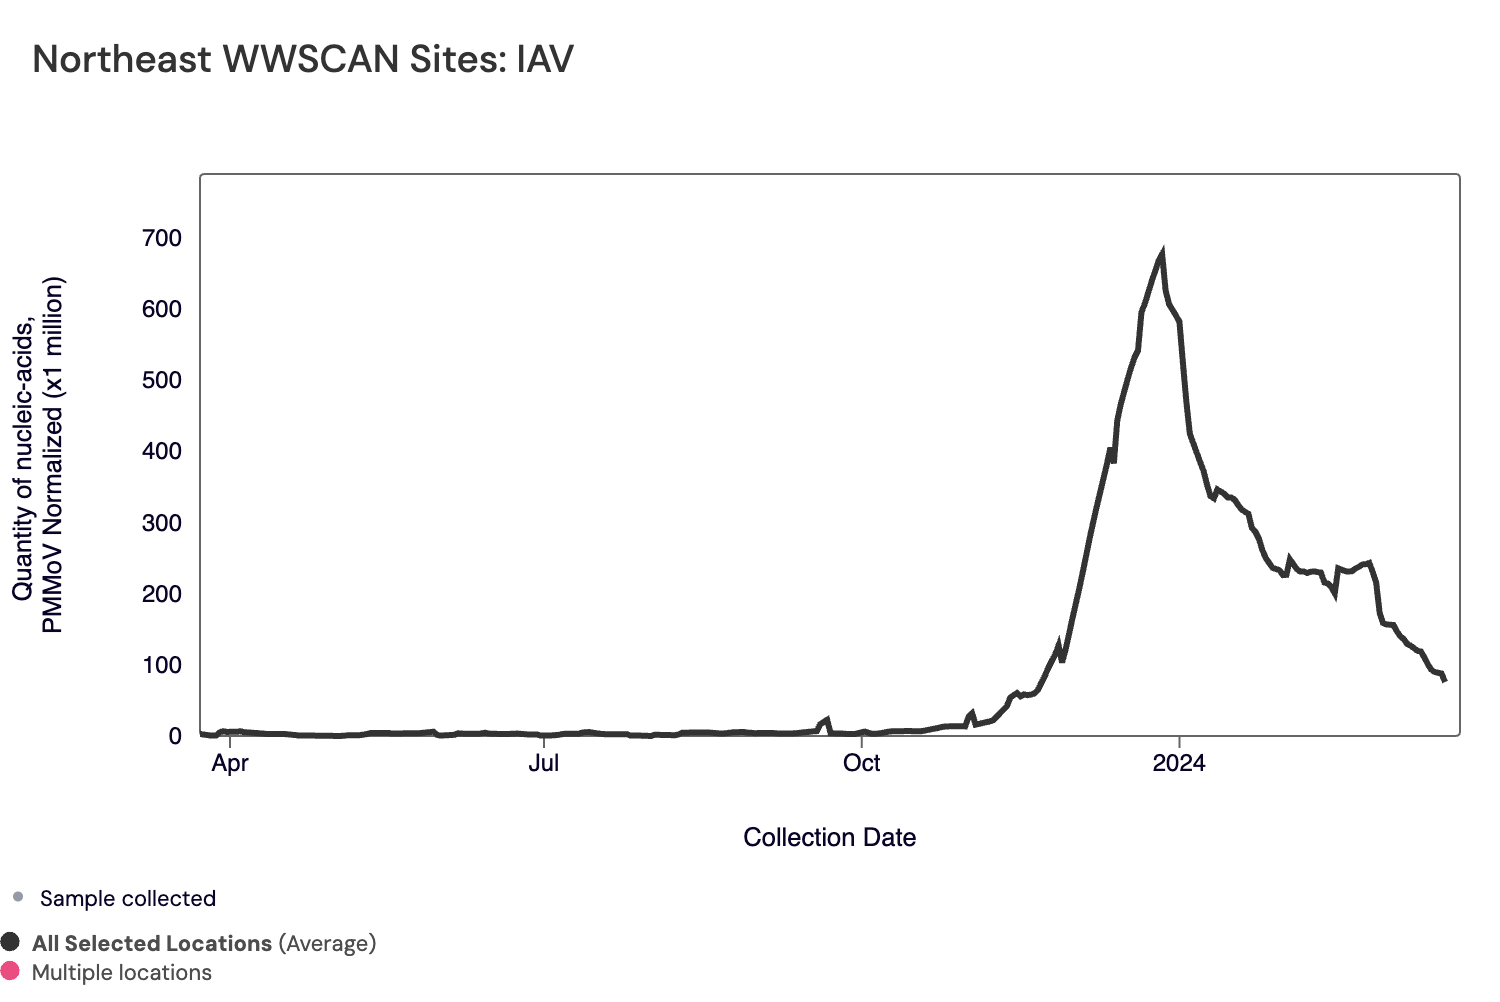
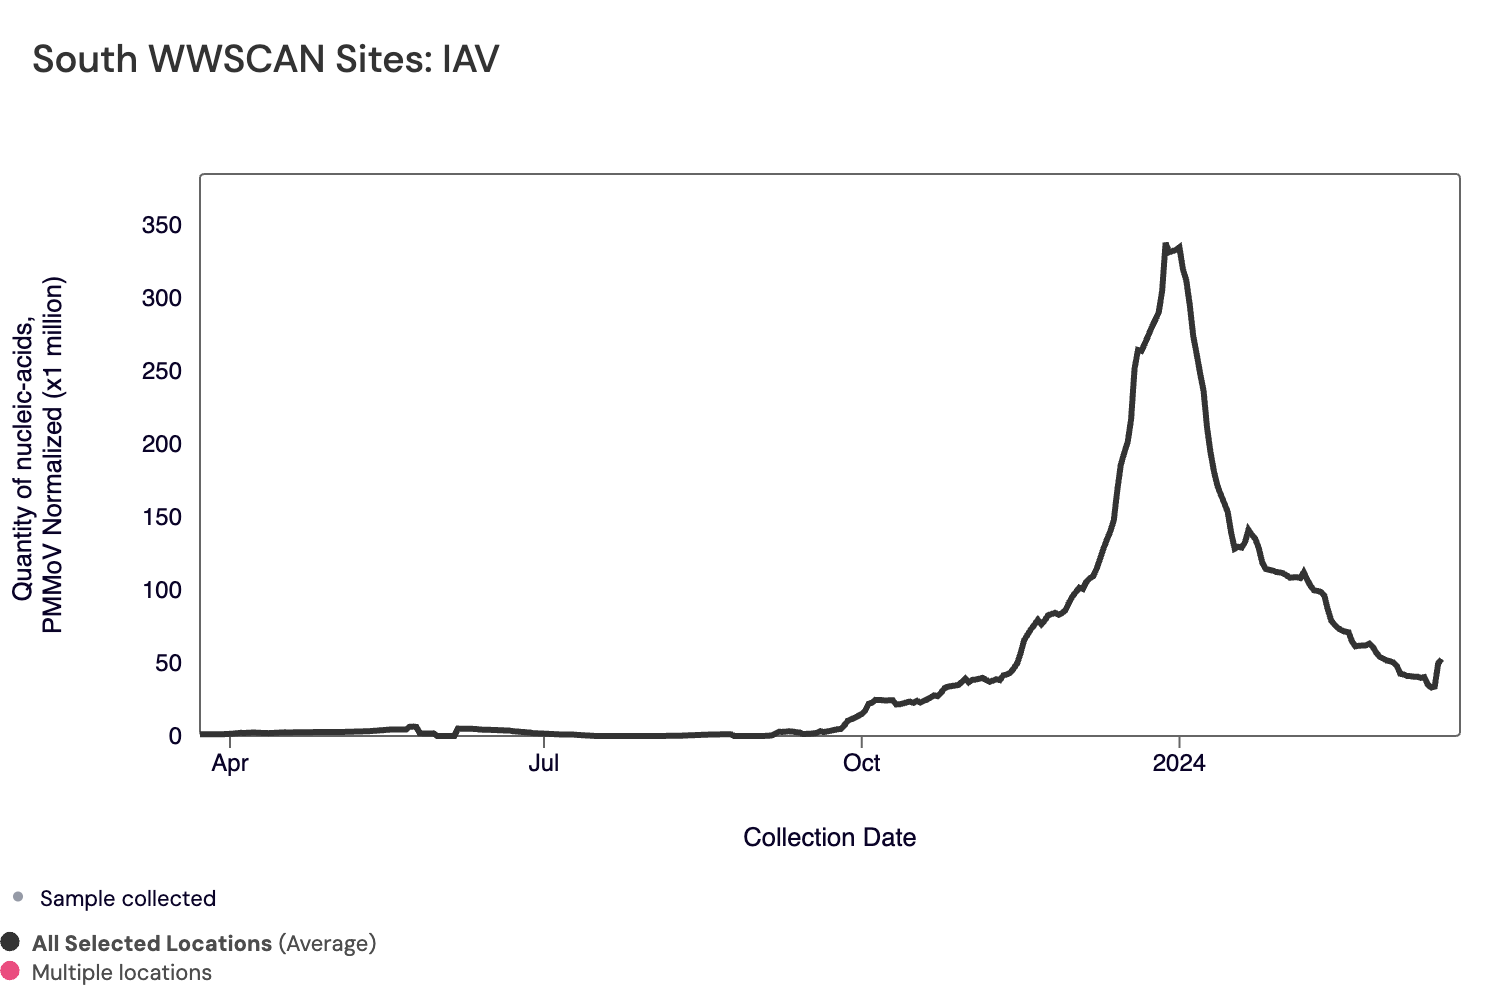
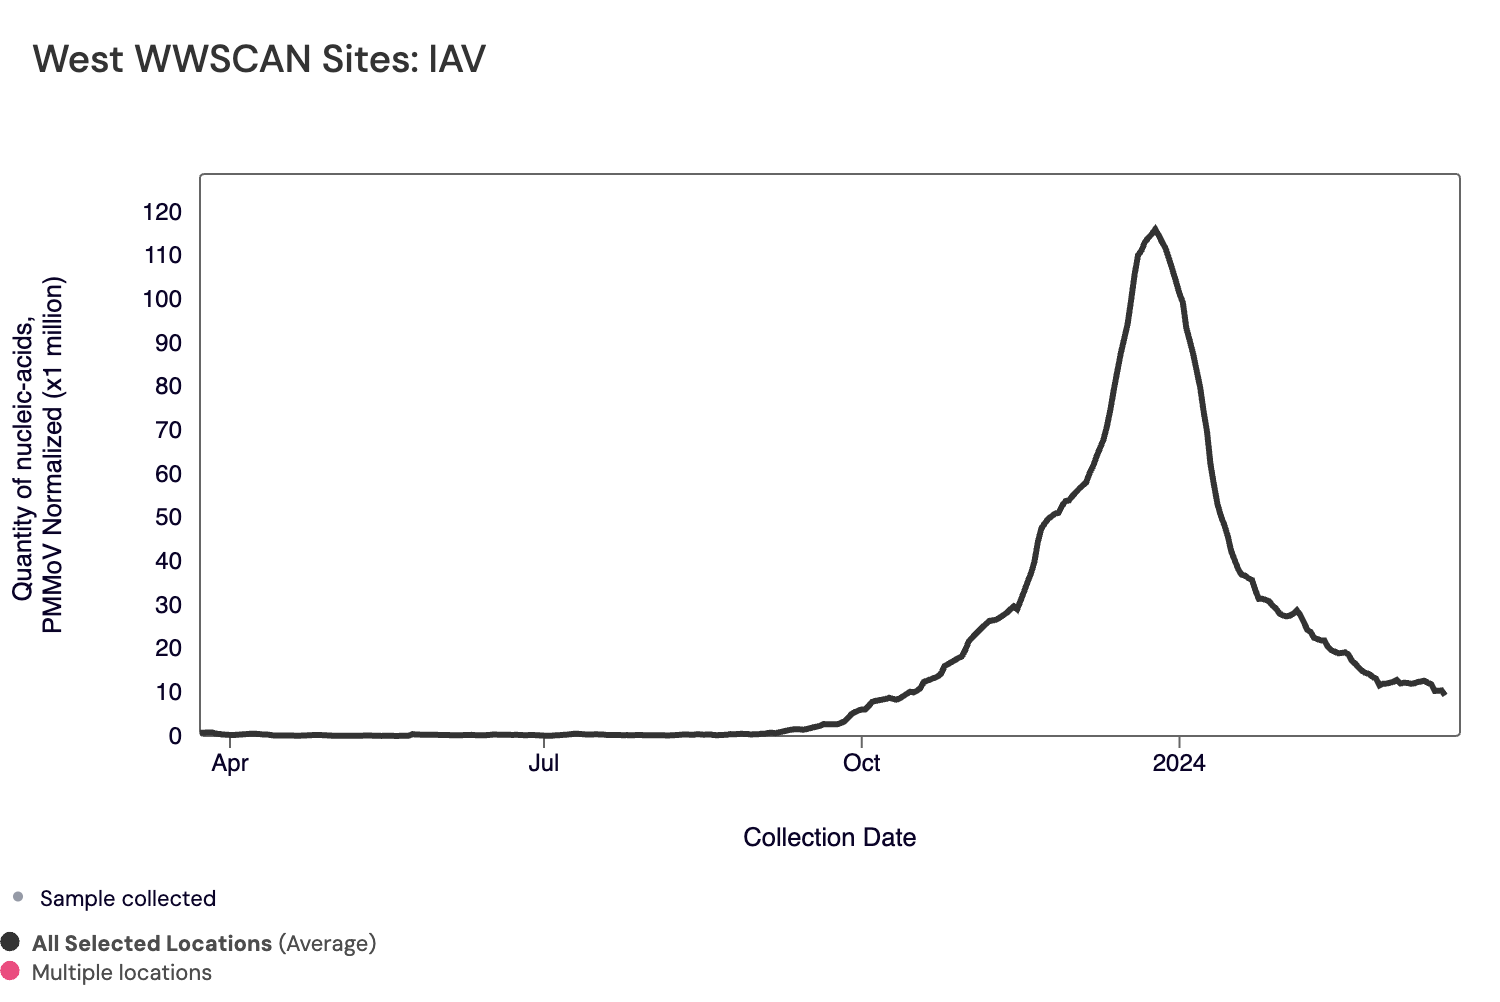
Midwest states: IA, IL, IN, KS, MI, MN, NE, OH, SD, WI. Northeast states: CT, MA, ME, NH, NJ, NY, PA, VT. Southern states: AL, AR, DE, FL, GA, KY, LA, MD, MS, NC, TN, TX, VA, WV and Washington DC. Western States: AK, CA, CO, HI, ID, NV, UT, WA.
Below are the current Influenza A wastewater categories for all WWSCAN sites, with 72% of sites showing wastewater onset for IAV (recall the category is determined by both the trend and the level when in seasonal onset):
- 54 are in the LOW Wastewater Category
- 21 are in the MEDIUM Wastewater Category
- 102 are in the HIGH Wastewater Category
- 14 do not have enough data to calculate (Fremont, CA; Newark, CA; Pacifica, CA; Petaluma, CA; South San Diego, CA; Union City, CA; South Miami, FL; Hilo, HI; Bloomington, IN; Muscatine, IA; Louisville, KY; Portland, ME; Gautier, MS; Pascagoula Moss Point, MS; Chester, PA)

IAV Wastewater Categories. This map includes sample collection data through March 20, 2024. Each dot represents a single site and the four US Census regions are outlined in gray. Midwest Region includes: IA, IL, IN, KS, MI, MN, NE, OH, SD, WI. Northeast Region includes: CT, MA, ME, NH, NJ, NY, PA, VT. Southern Region includes: AL, AR, DE, FL, GA, KY, LA, MD, MS, NC, TN, TX, VA, WV and Washington DC. Western Region includes: AK, CA, CO, HI, ID, NV, UT, WA.
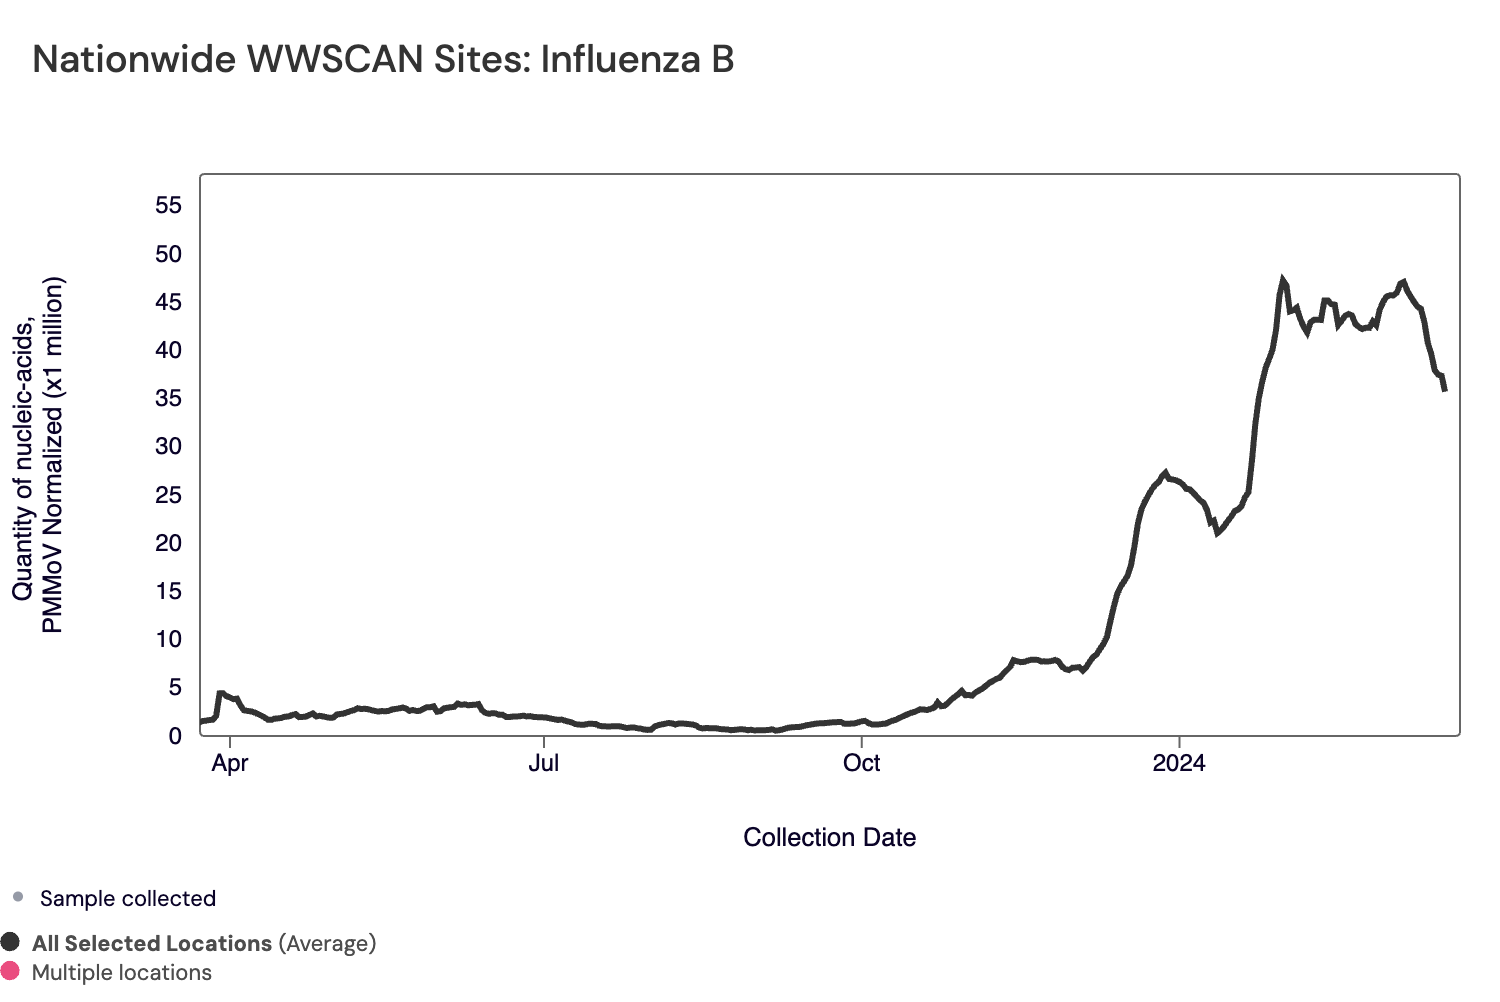
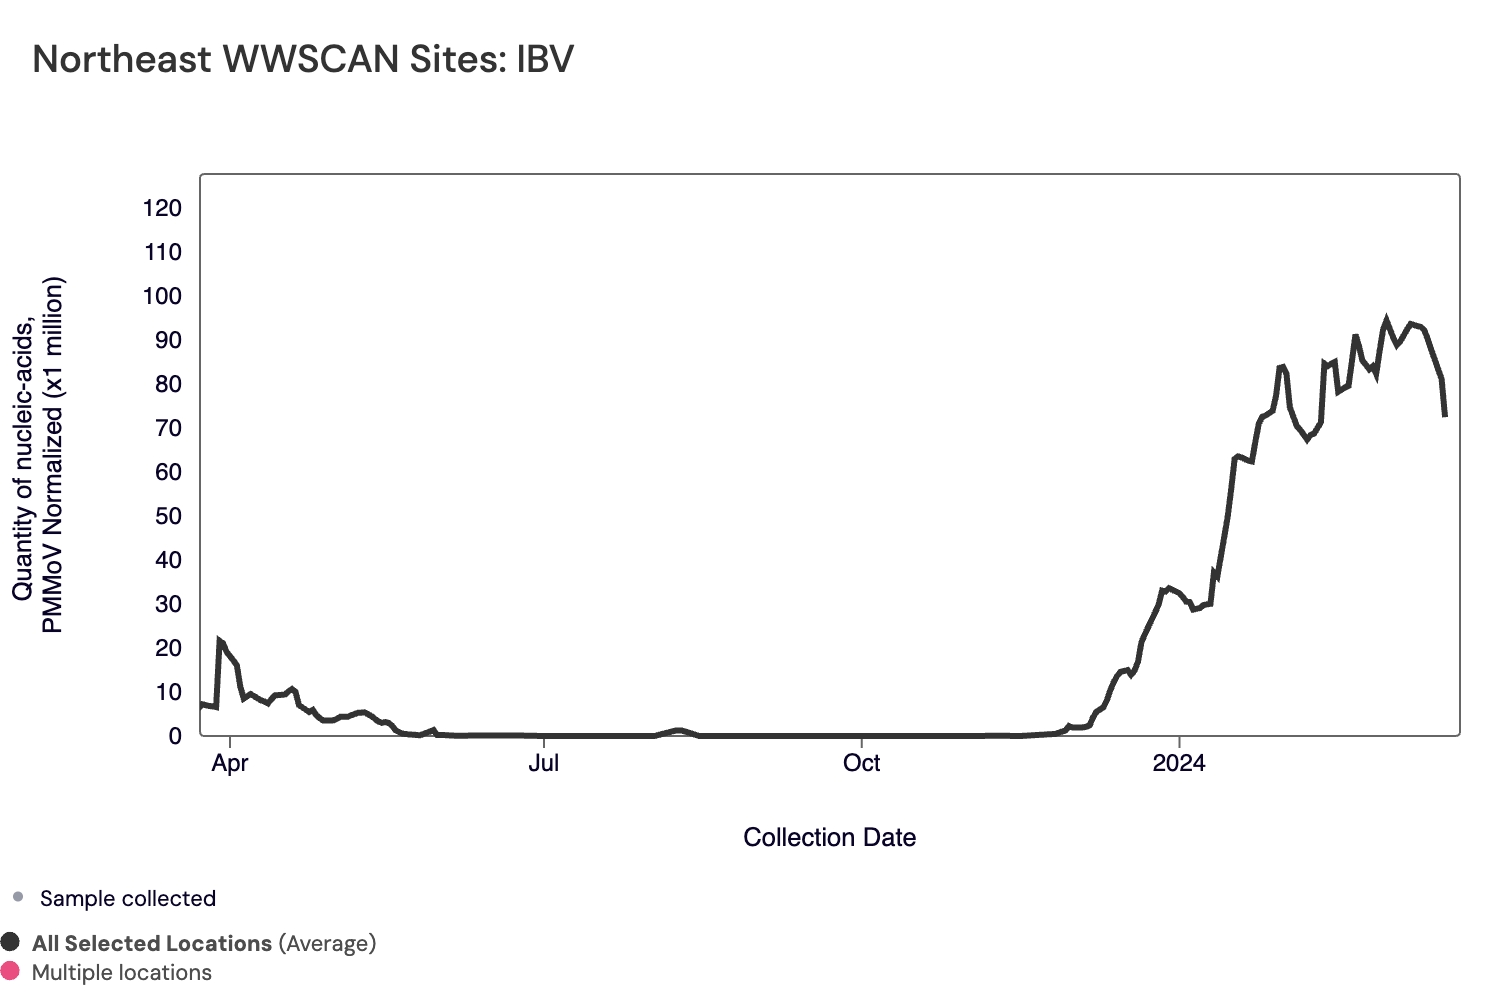
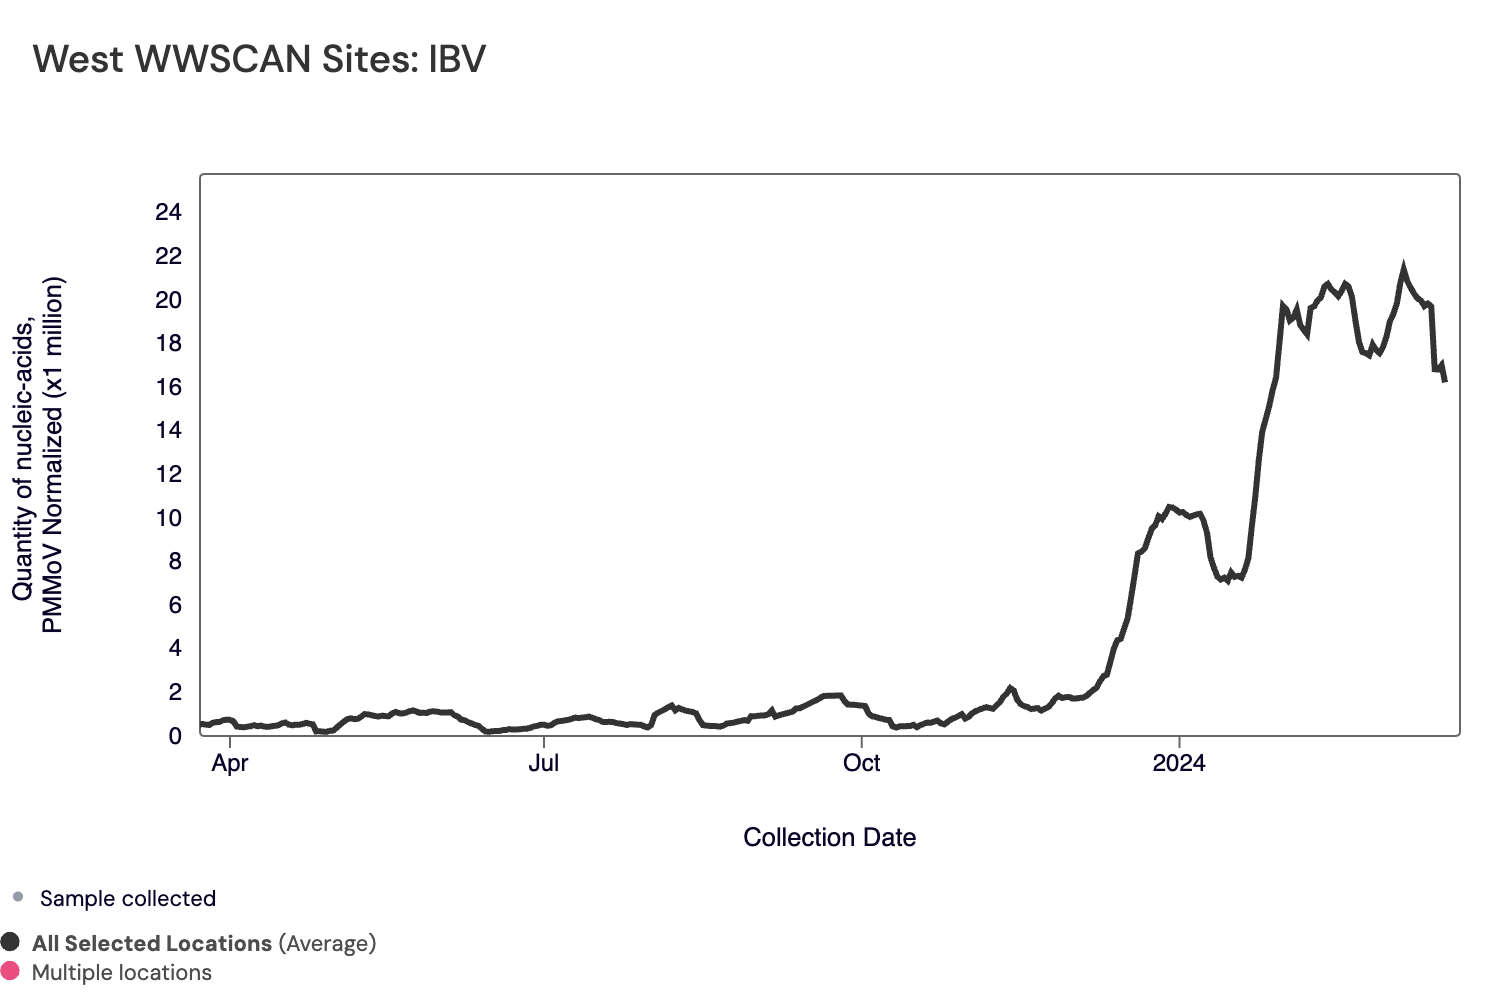
Influenza B (IBV) RNA has been detected in 1,291 out of 1,401 samples during the past 21 days (~92% detection rate). IBV RNA median concentration across all sites over the last 21 days is 11,050 copies/gram. For reference, the median concentration in February 2024 was 12,570 copies/gram. Below is the population-weighted average IBV RNA concentrations (normalized by PMMoV) from all participating WWSCAN sites across the country over the last 365 days.
Nationally, Influenza B is in the "High" category with >50% of sites showing onset of IBV in wastewater and aggregated measurements showing high concentrations but a downward over the last 21 days.
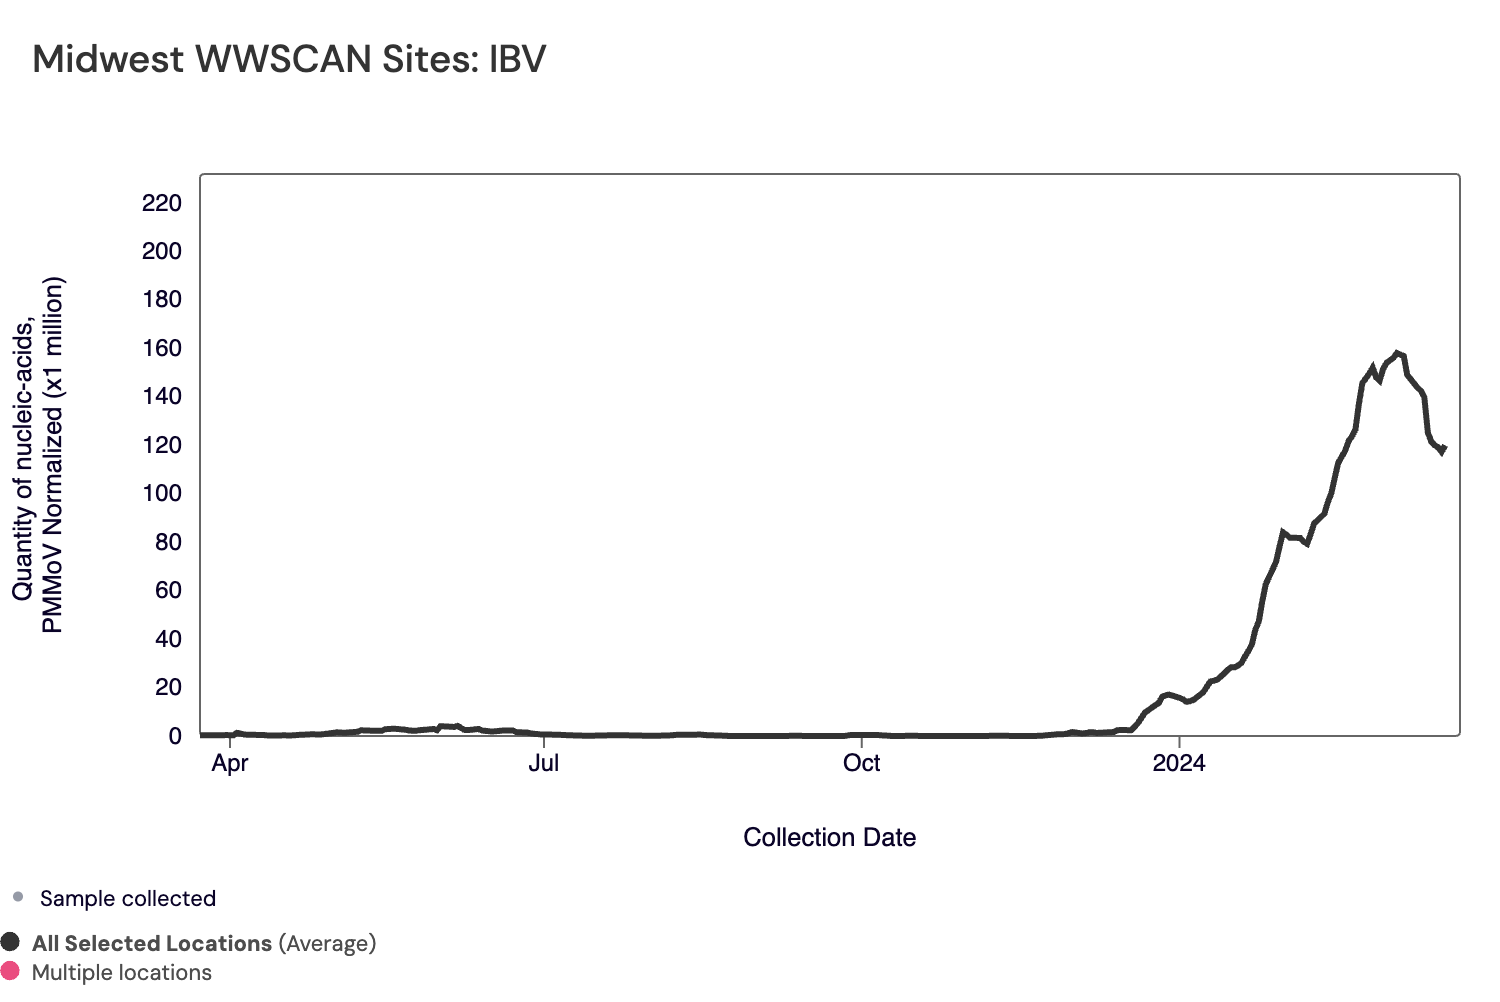
Below are the population-weighted average IBV RNA concentrations (normalized by PMMoV) from sites in the Midwest US (top left panel), Northeast US (top right panel), Southern US (bottom left panel) and Western US (bottom right panel) over the last 365 days.
The plots below show all US regions with relatively high concentrations with downward trends in the past 21 days.
Below are the current Influenza B wastewater categories for all WWSCAN sites, with 87% of sites showing wastewater onset for IBV (recall the category is determined by both the trend and the level when in seasonal onset):
- 13 are in the LOW Wastewater Category
- 0 are in the MEDIUM Wastewater Category
- 164 are in the HIGH Wastewater Category
- 14 do not have enough data to calculate (Fremont, CA; Newark, CA; Pacifica, CA; Petaluma, CA; South San Diego, CA; Union City, CA; South Miami, FL; Hilo, HI; Bloomington, IN; Muscatine, IA; Louisville, KY; Portland, ME; Gautier, MS; Pascagoula Moss Point, MS; Chester, PA)
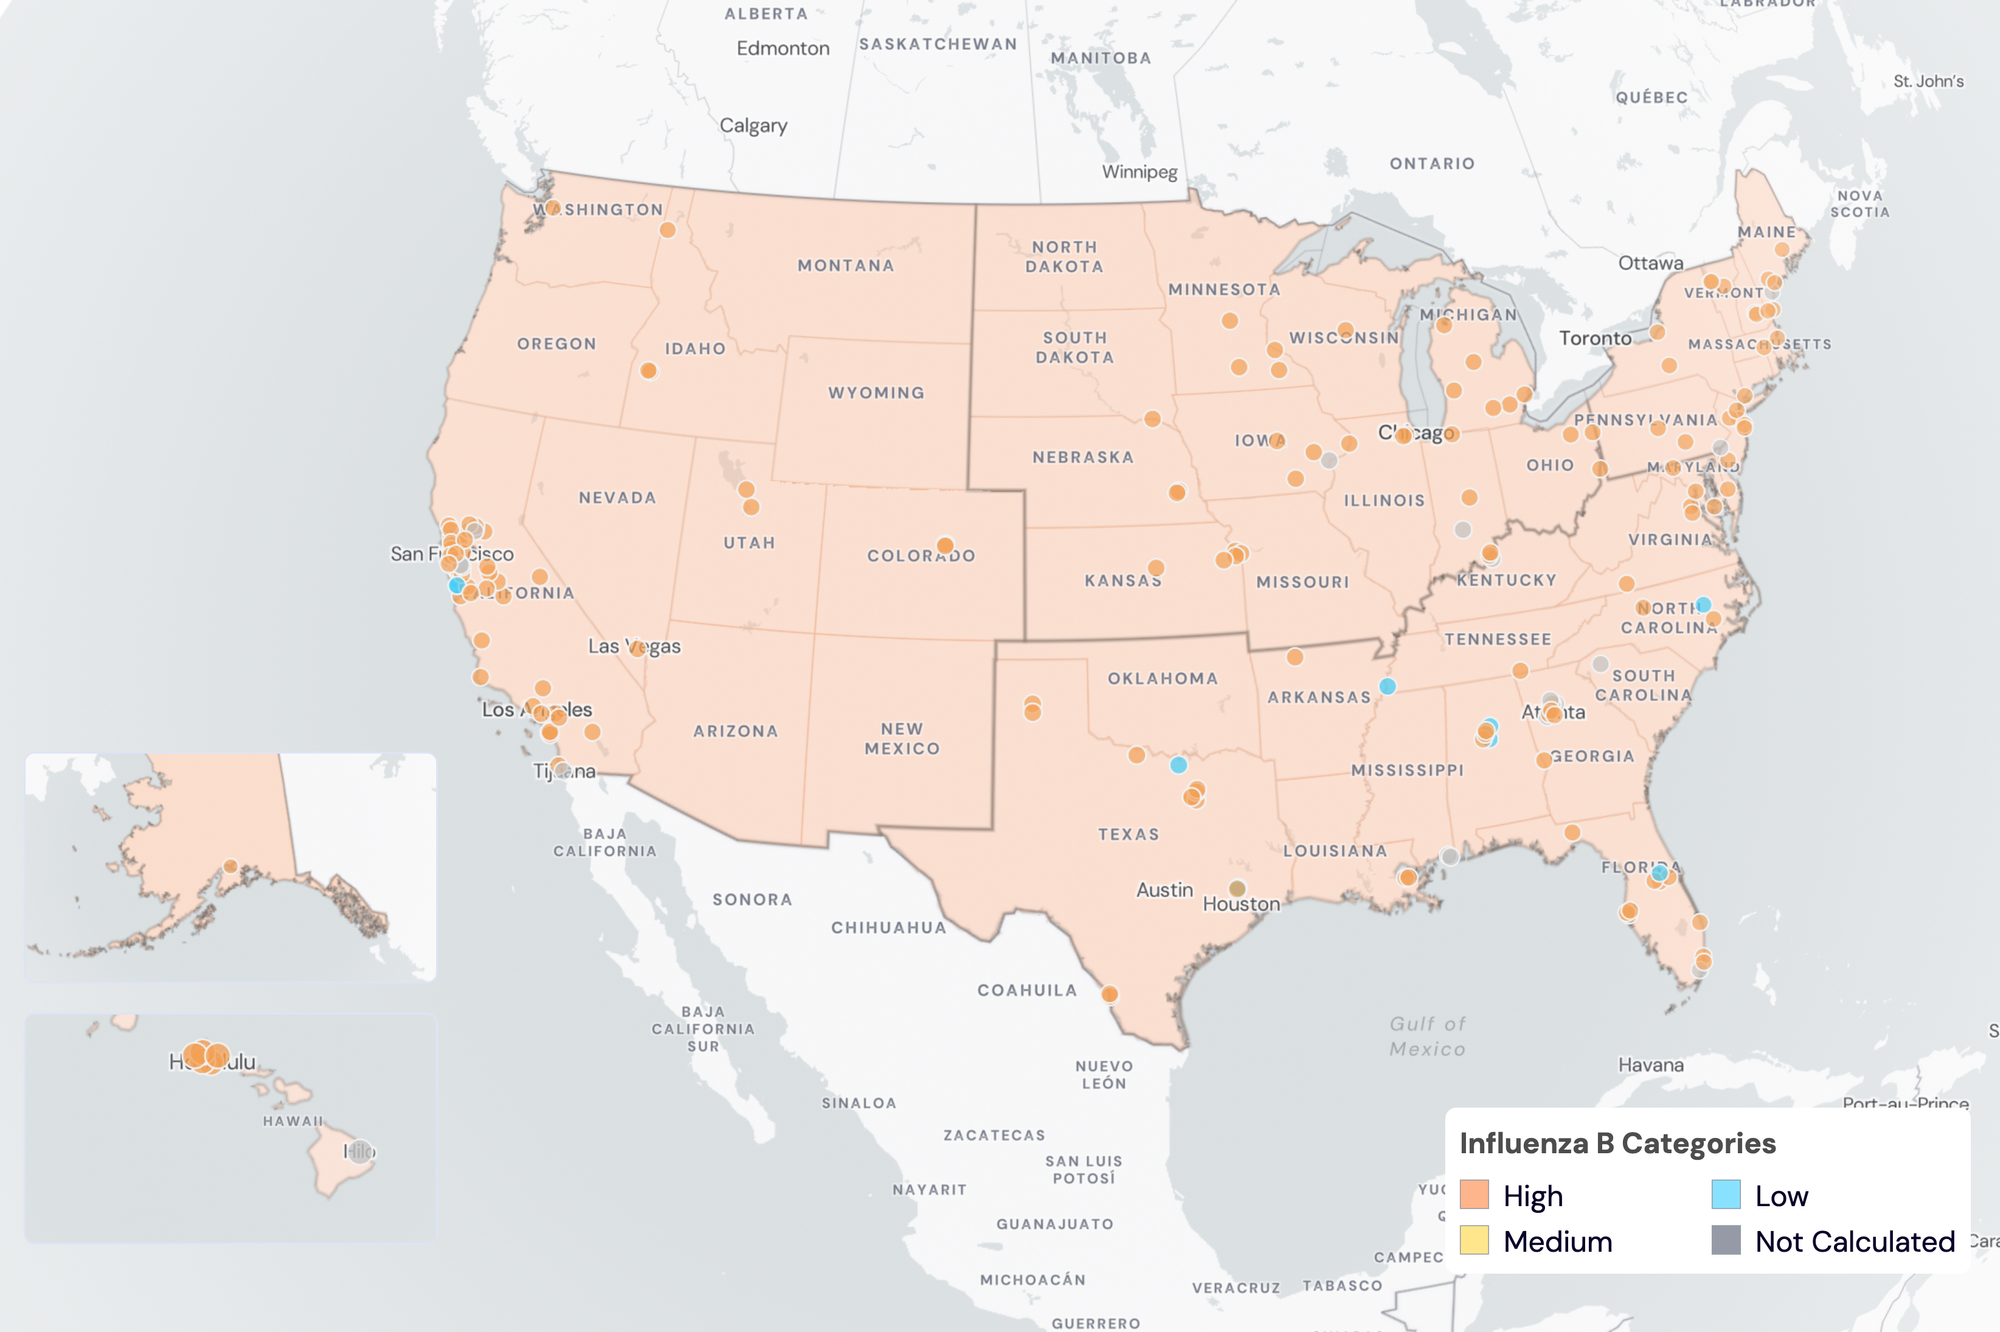
IBV Wastewater Categories. This map includes sample collection data through March 20, 2024. Each dot represents a single site and the four US Census regions are outlined in gray. Midwest Region includes: IA, IL, IN, KS, MI, MN, NE, OH, SD, WI. Northeast Region includes: CT, MA, ME, NH, NJ, NY, PA, VT. Southern Region includes: AL, AR, DE, FL, GA, KY, LA, MD, MS, NC, TN, TX, VA, WV and Washington DC. Western Region includes: AK, CA, CO, HI, ID, NV, UT, WA.
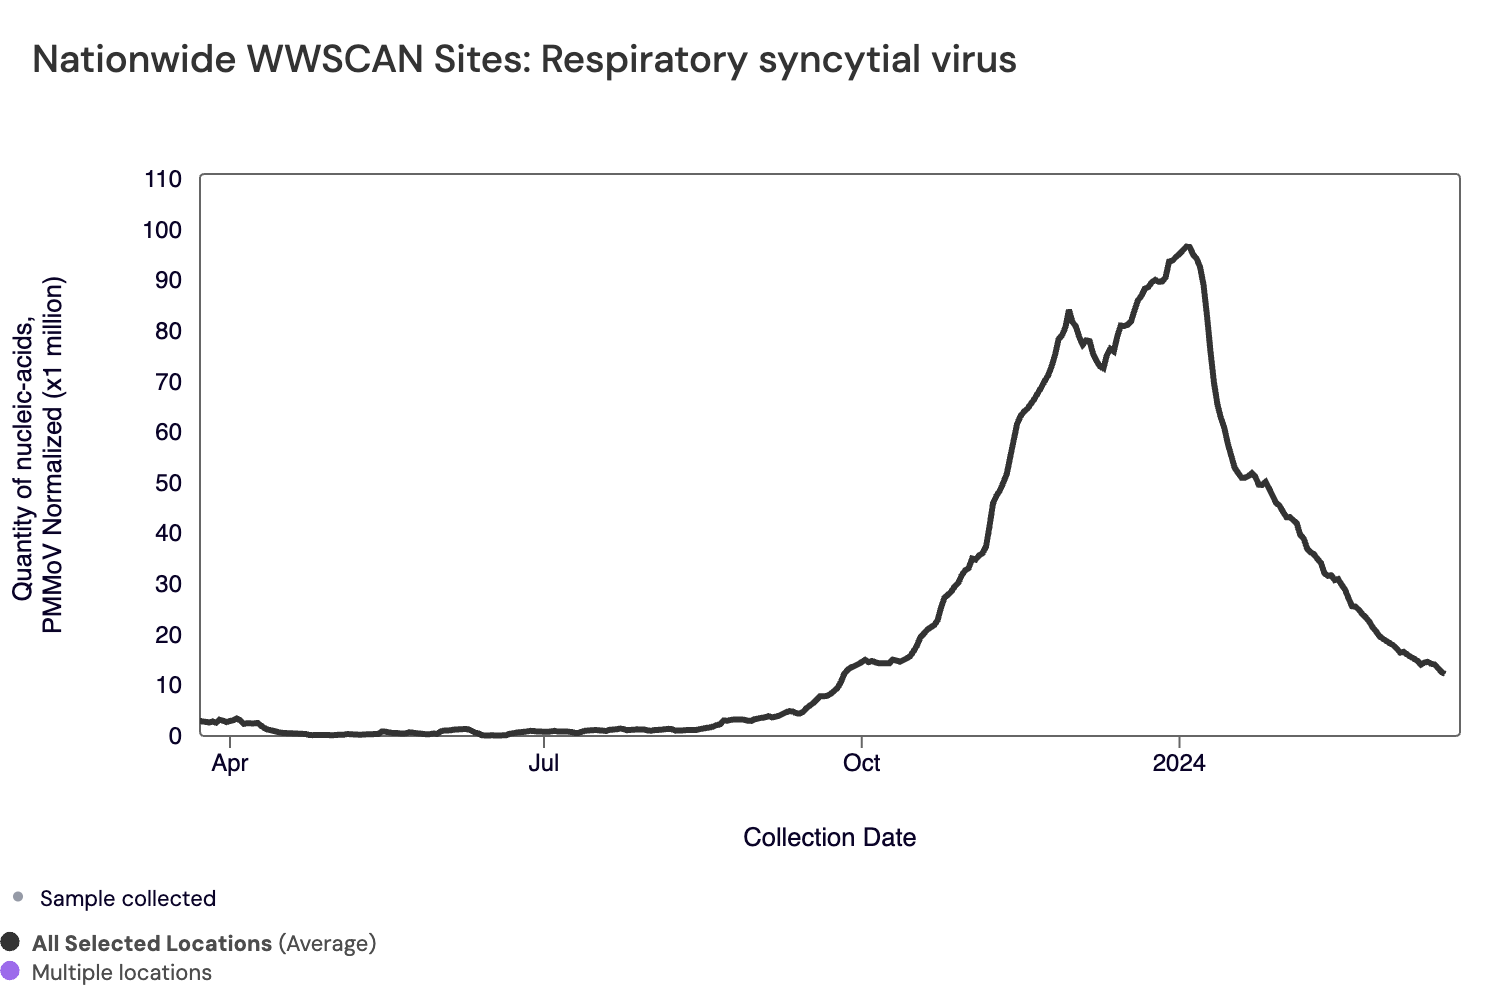
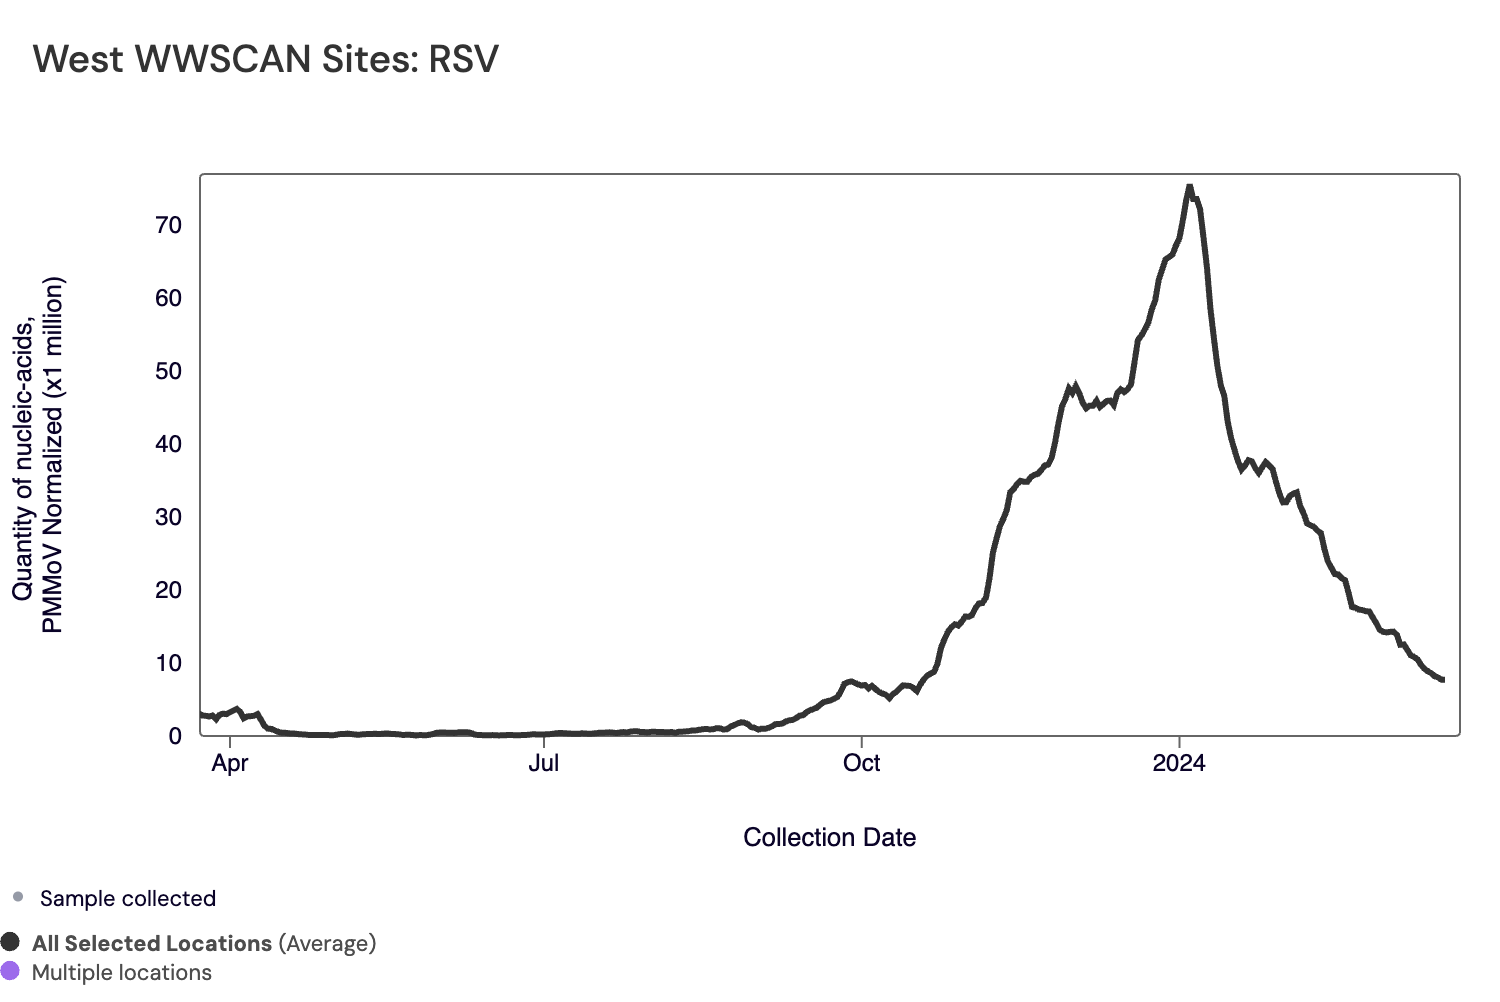
Respiratory syncytial virus (RSV) RSV RNA median concentration across all sites over the last 21 days is 3,571 copies/gram. For reference, the median concentration in February 2024 was 9,684 copies/gram. Below are the RSV RNA concentrations (normalized by PMMoV) from all participating WWSCAN sites across the country over the last 365 days shown as the population-weighted average.
Nationally, RSV is in the "Medium" category, with ~50% of sites showing onset of RSV in wastewater and aggregated measurements showing medium concentrations with a downward trend over the last 21 days.
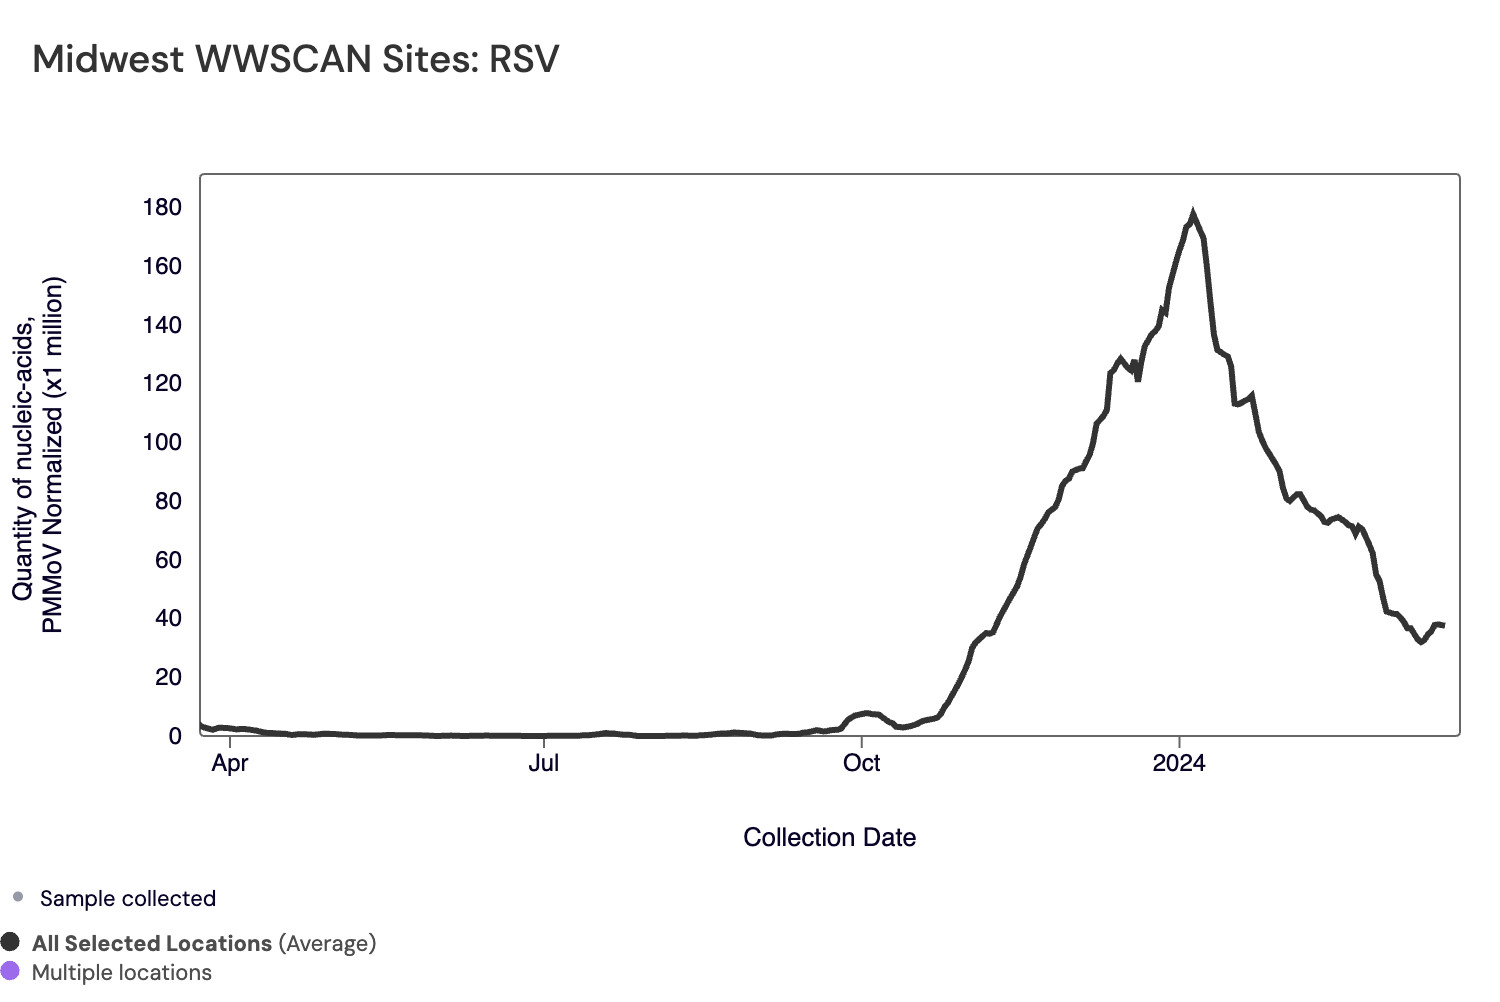
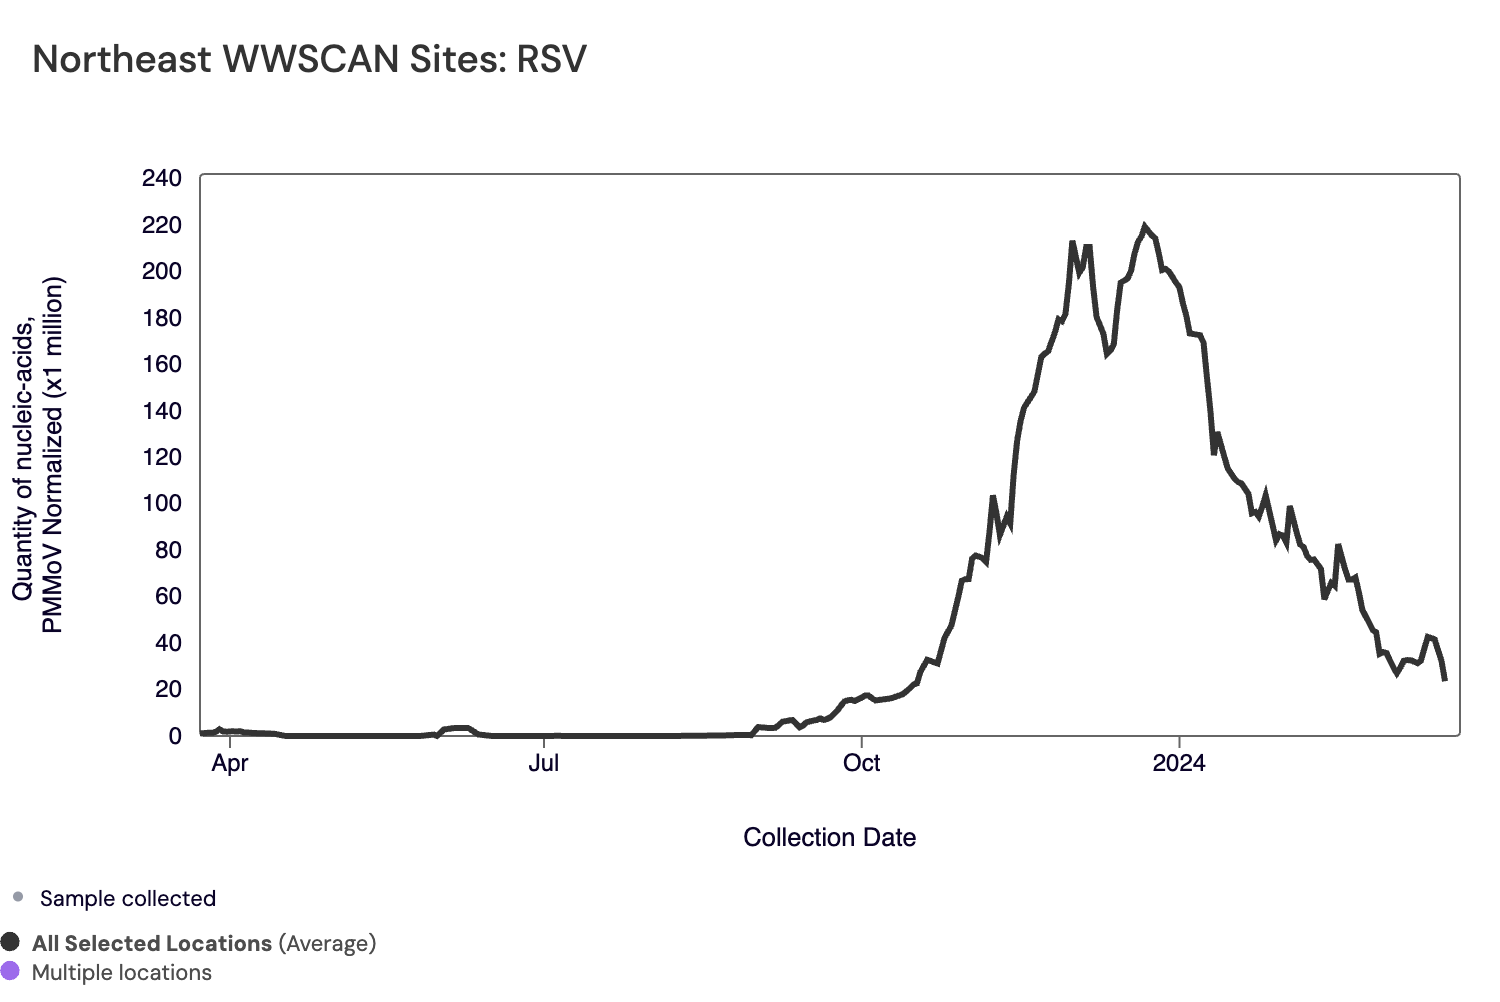
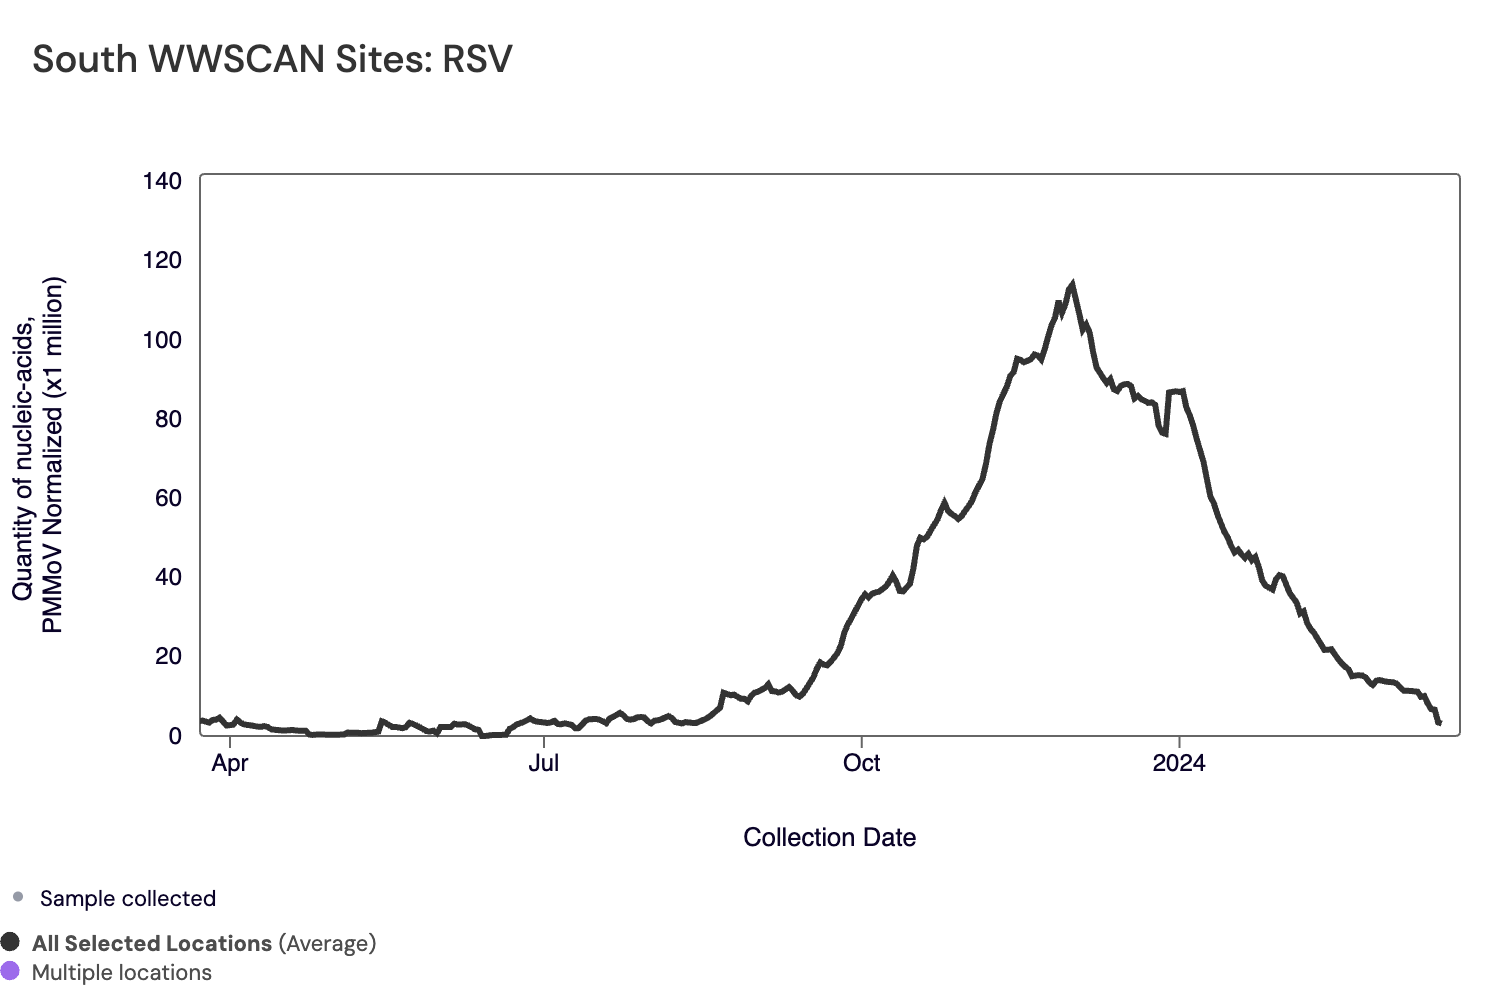
Below are the population-weighted average RSV RNA concentrations (normalized by PMMoV) from sites in the Midwest US (top left panel), Northeast US (top right panel), Southern US (bottom left panel) and Western US (bottom right panel) over the last 365 days.
The plots below show the Midwest has relatively high concentrations and a downward trend in the last 21 days. The West and Northeast shows medium concentrations and no trends in the last 21 days. The Southern region is no longer in seasonal onset for RSV.
Midwest states: IA, IL, IN, KS, MI, MN, NE, OH, SD, WI. Northeast states: CT, MA, ME, NH, NJ, NY, PA, VT. Southern states: AL, AR, DE, FL, GA, KY, LA, MD, MS, NC, TN, TX, VA, WV and Washington DC. Western States: AK, CA, CO, HI, ID, NV, UT, WA.
Below are the current RSV wastewater categories for all WWSCAN sites (recall the category is determined by both the trend and the level when in seasonal onset):
- 103 are in the LOW Wastewater Category
- 34 are in the MEDIUM Wastewater Category
- 40 are in the HIGH Wastewater Category
- 14 do not have enough data to calculate (Fremont, CA; Newark, CA; Pacifica, CA; Petaluma, CA; South San Diego, CA; Union City, CA; South Miami, FL; Hilo, HI; Bloomington, IN; Muscatine, IA; Louisville, KY; Portland, ME; Gautier, MS; Pascagoula Moss Point, MS; Chester, PA)
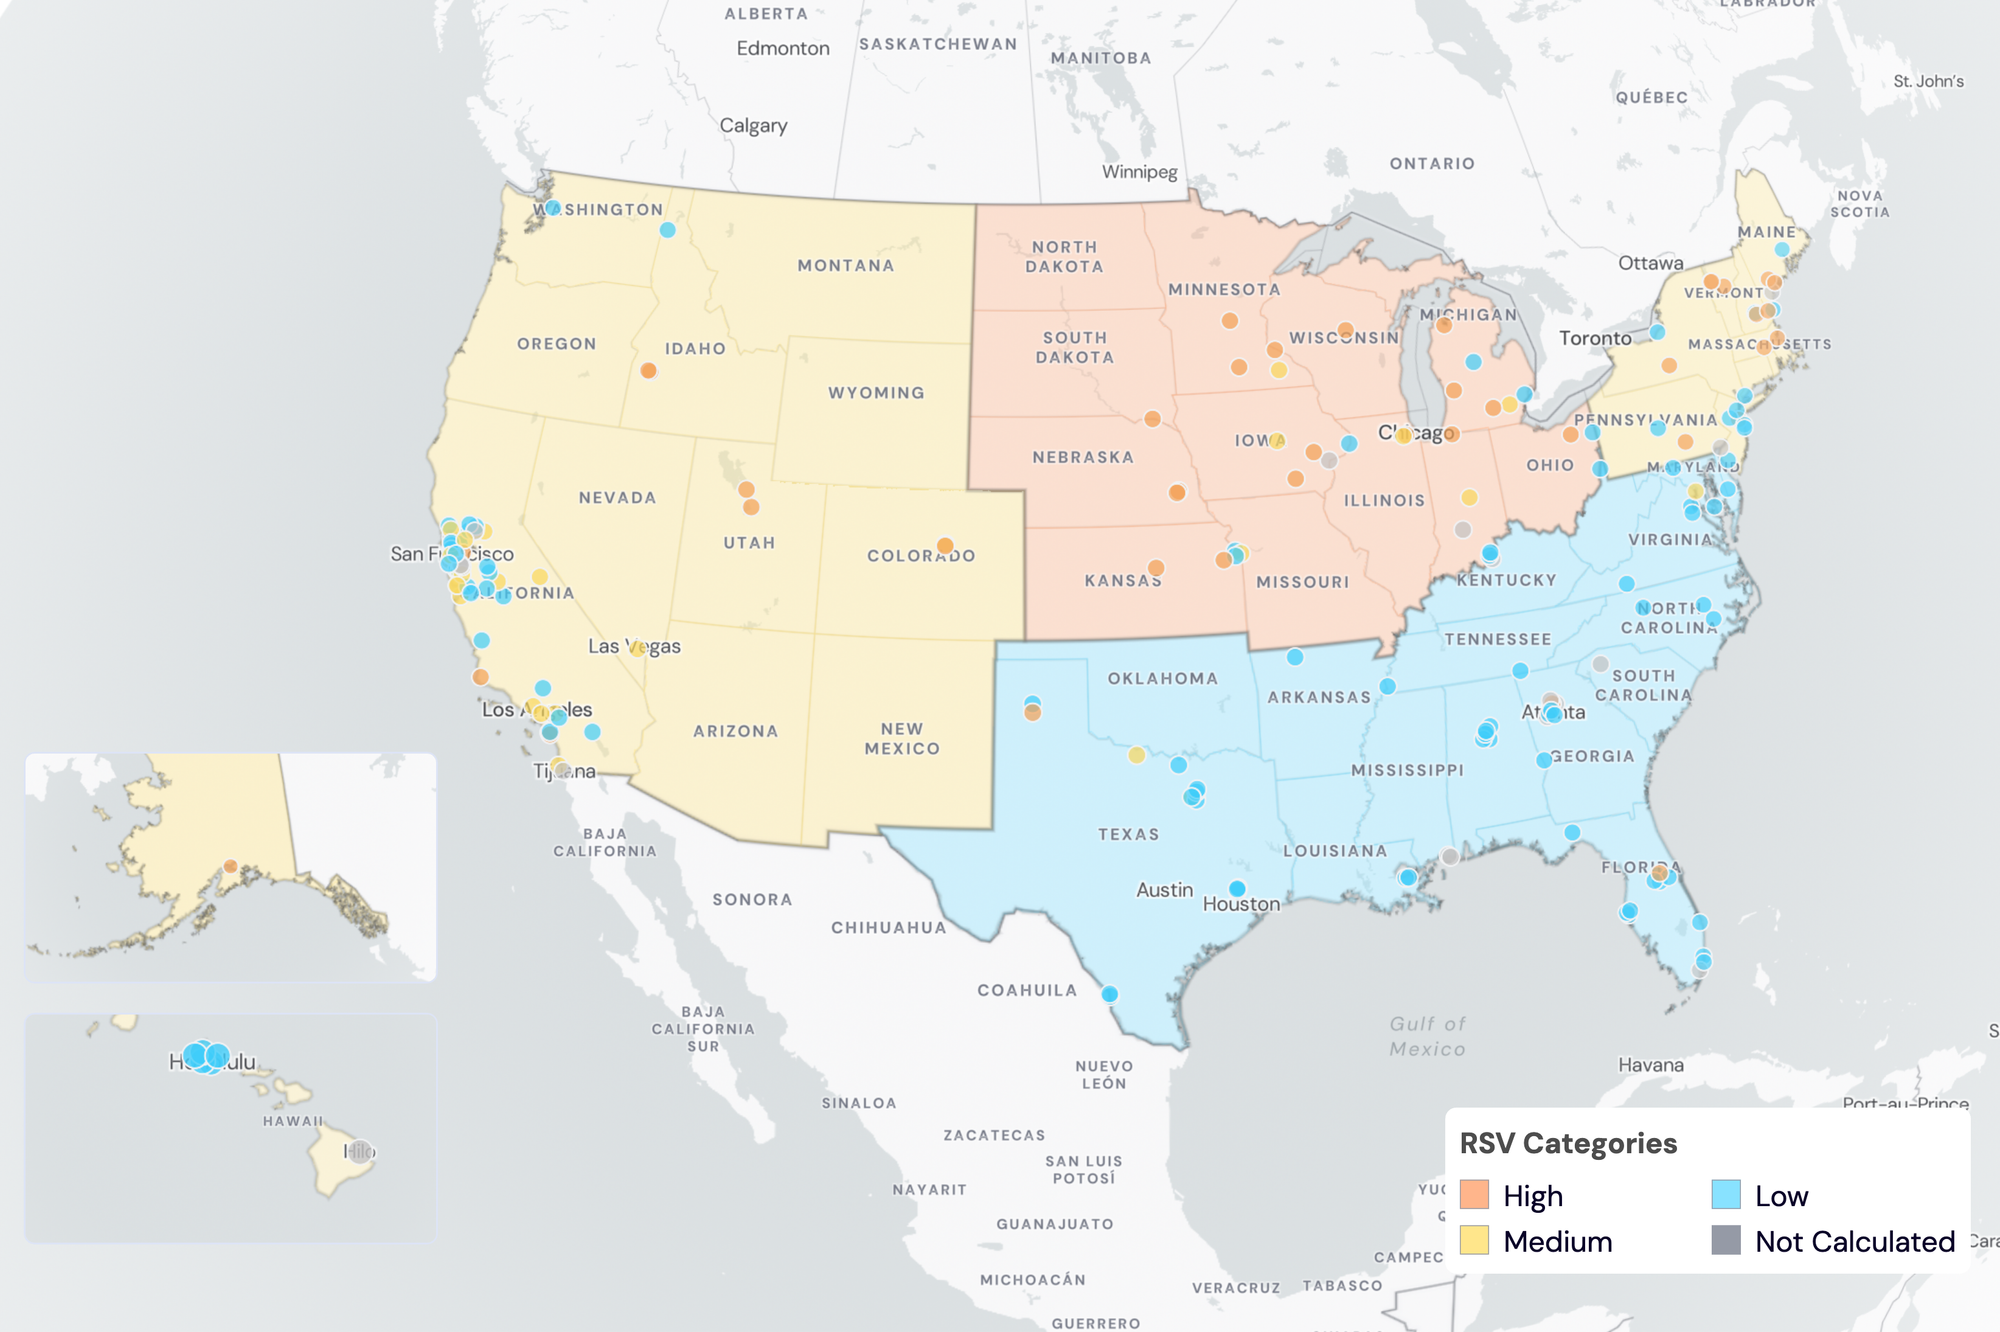
RSV Wastewater Categories. This map includes sample collection data through March 20 2024. Each dot represents a single site and the four US Census regions are outlined in gray. Midwest Region includes: IA, IL, IN, KS, MI, MN, NE, OH, SD, WI. Northeast Region includes: CT, MA, ME, NH, NJ, NY, PA, VT. Southern Region includes: AL, AR, DE, FL, GA, KY, LA, MD, MS, NC, TN, TX, VA, WV and Washington DC. Western Region includes: AK, CA, CO, HI, ID, NV, UT, WA.
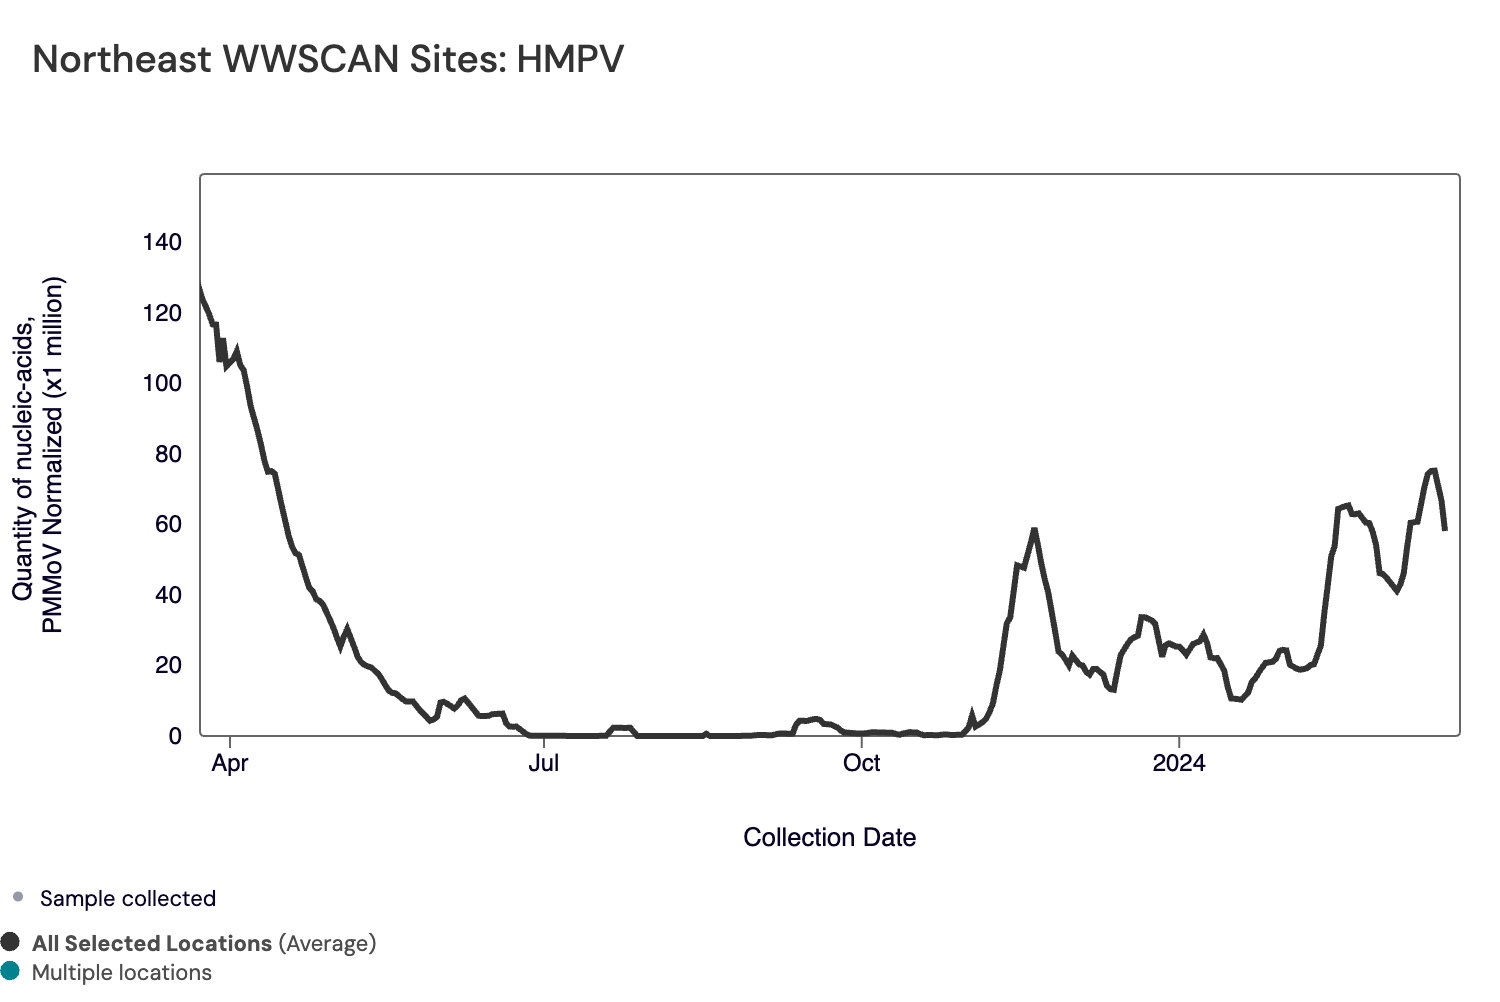
HMPV (human metapneumovirus) RNA median concentrations across all sites over the last 21 days is 6,628 copies/gram. There have been 938 positive samples out of samples during the past 21 days (66% detection rate). Below is the population weighted average HMPV RNA concentrations (normalized by PMMoV) from all participating WWSCAN sites across the country over the last 365 days.
Nationally, HMPV is in the "Low" category as less than 50% of the sites are in seasonal onset.
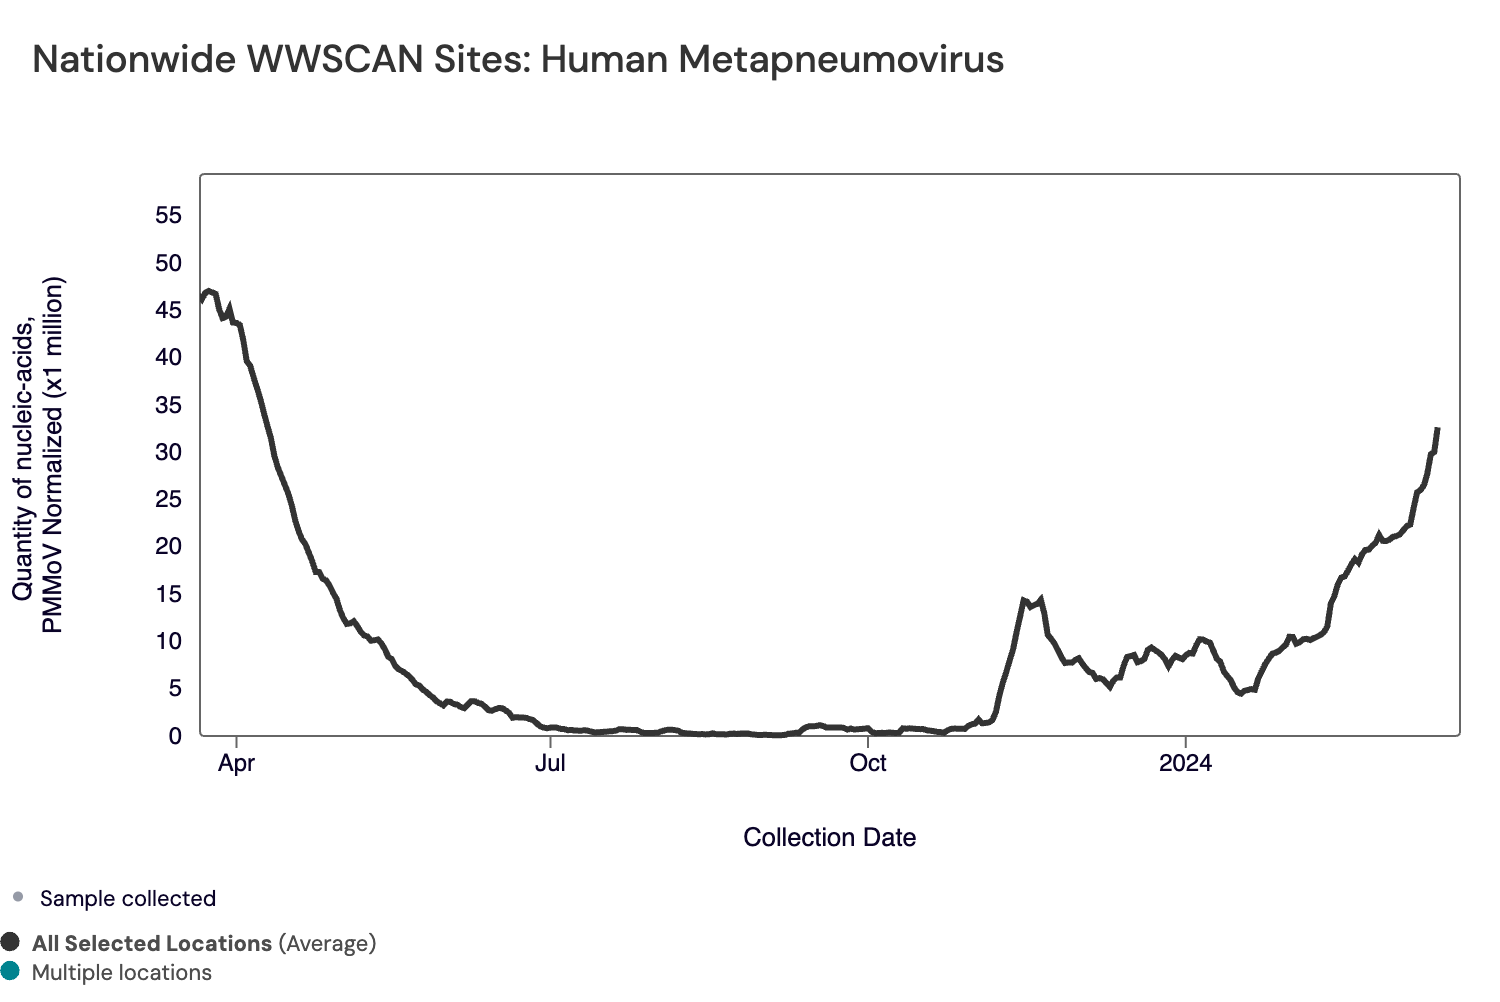
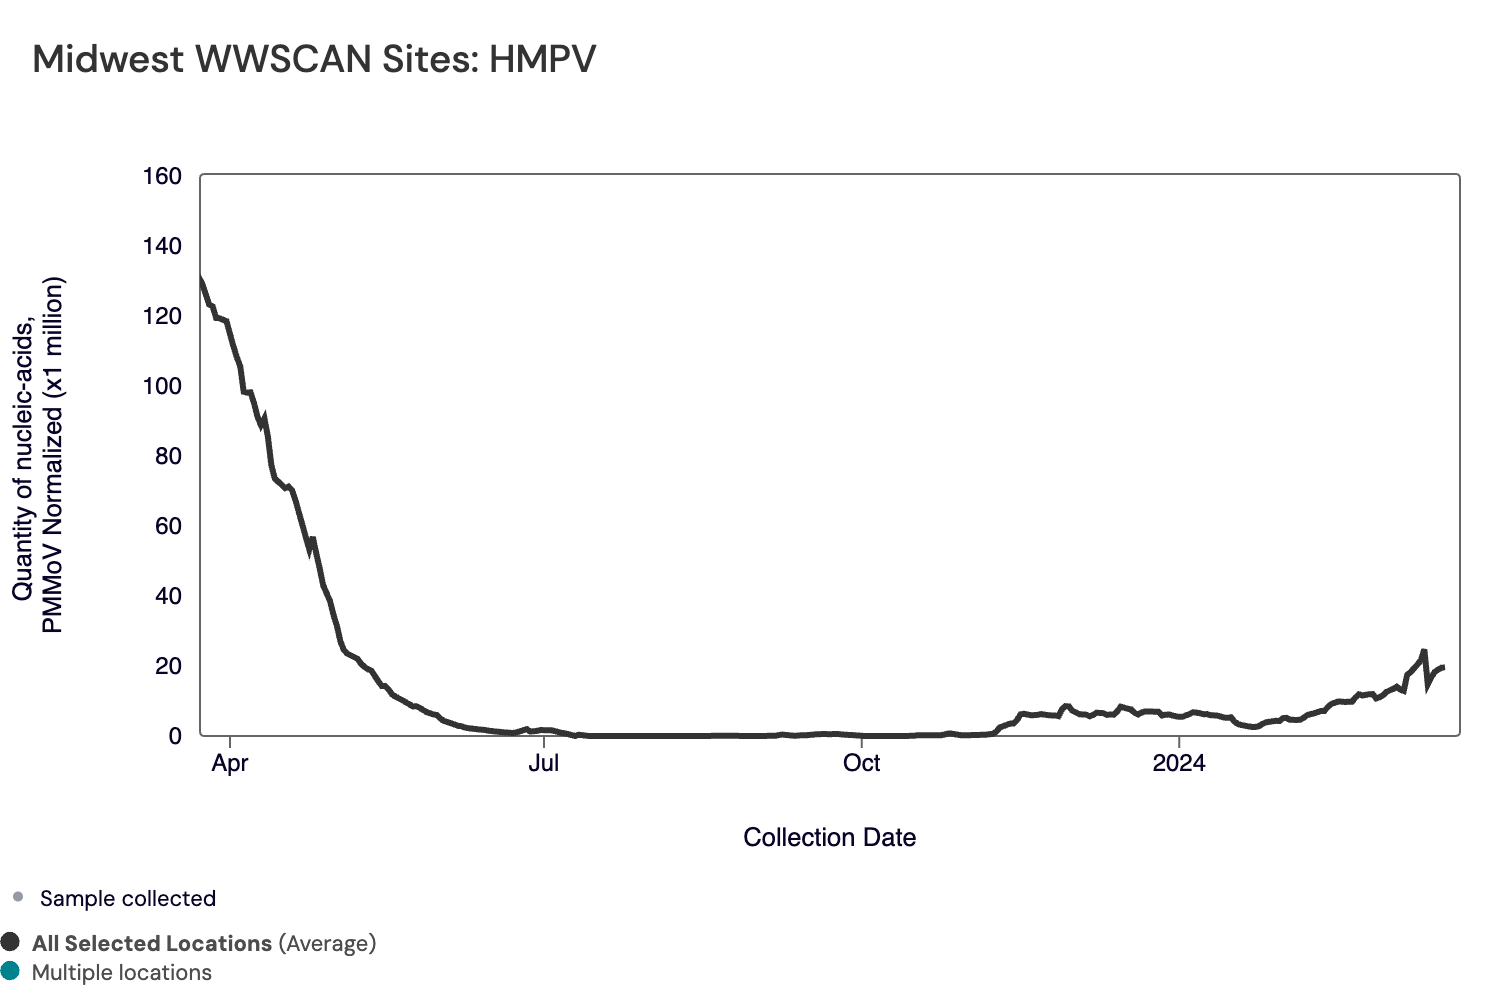
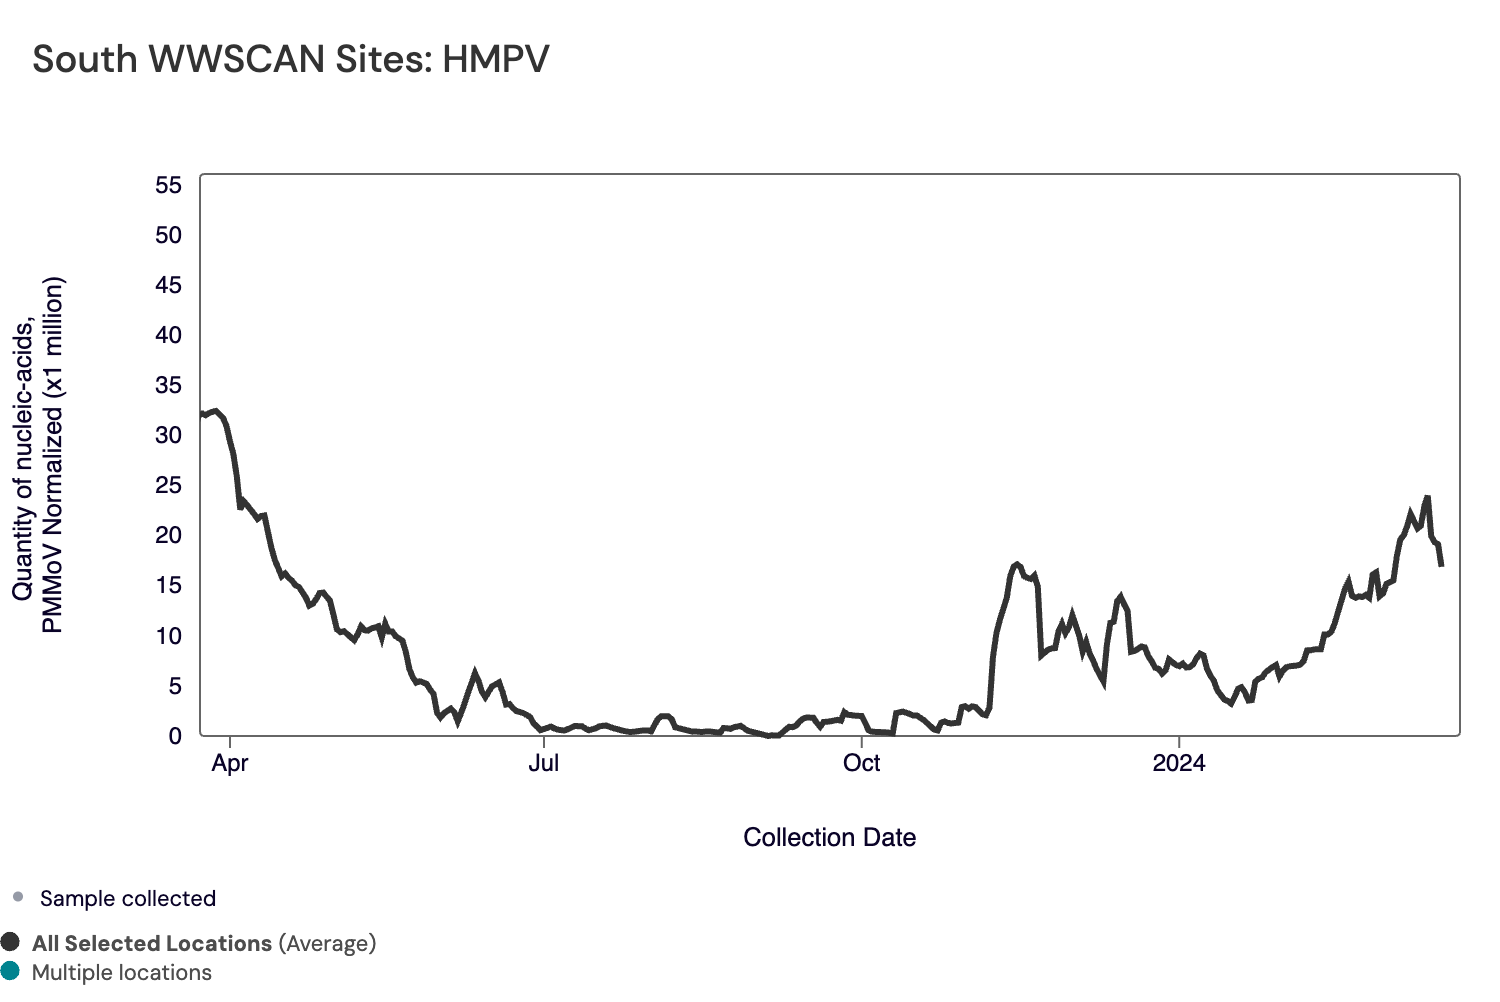
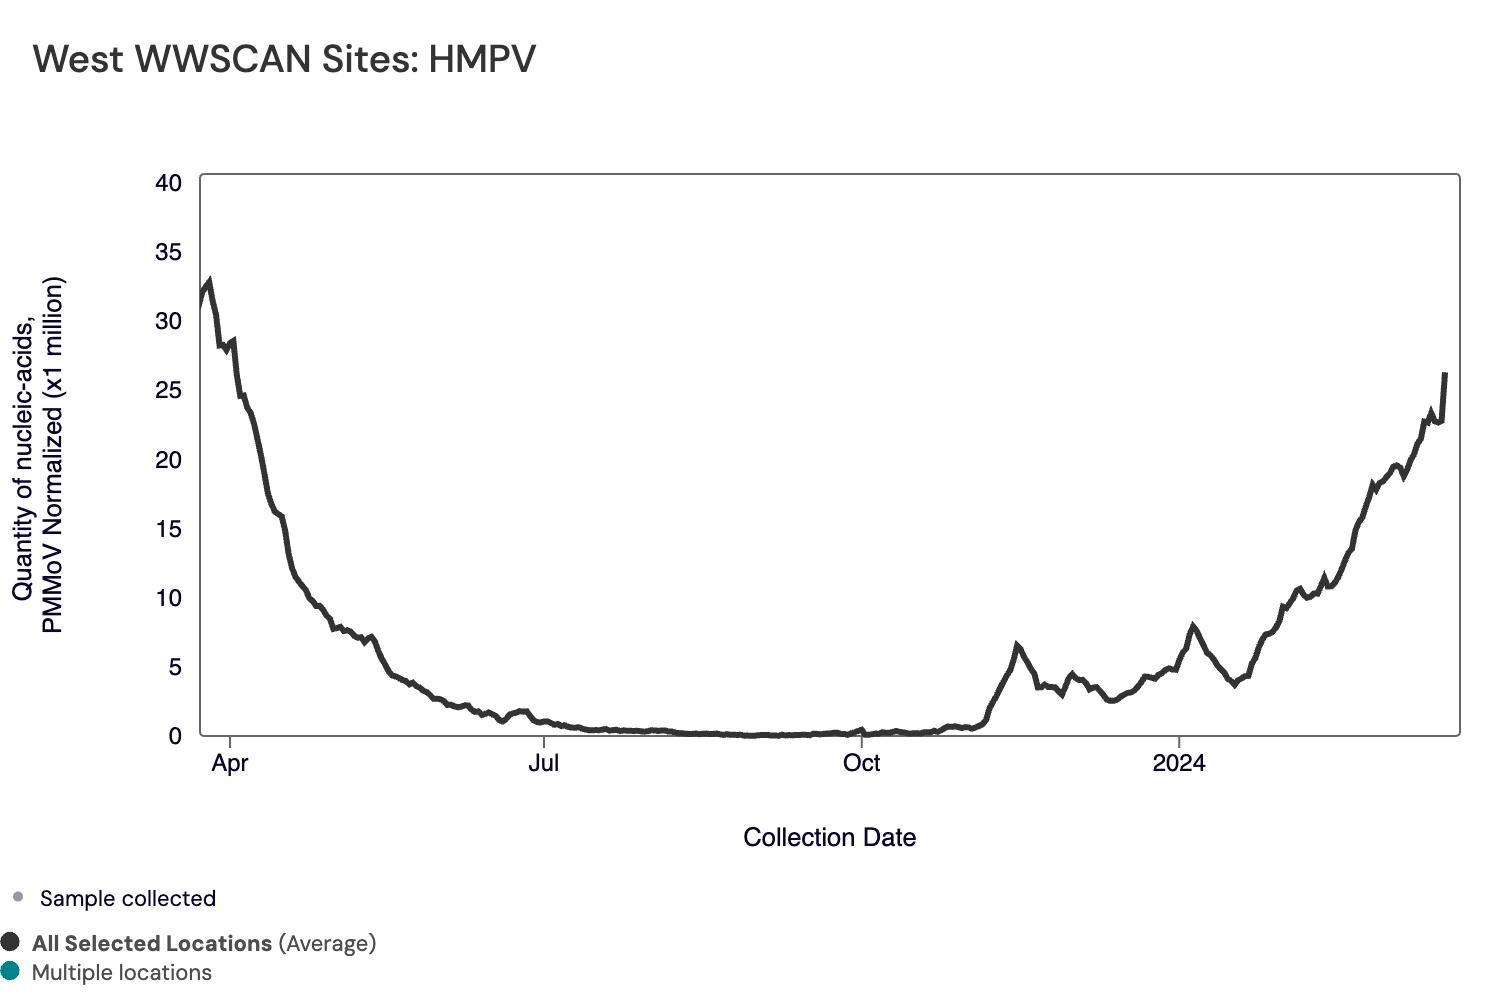
Below are the population-weighted average HMPV RNA concentrations (normalized by PMMoV) from sites in the Midwest US (top left panel), Northeast US (top right panel), Southern US (bottom left panel) and Western US (bottom right panel) over the last 365 days.
The Midwest, Northeast, and Southern regions are in the "Low" category as <50% of sites in each of these regions are not in seasonal onset for HMPV. The West is in a "High" category as >50% are in onset and showing concentrations.
Midwest states: IA, IL, IN, KS, MI, MN, NE, OH, SD, WI. Northeast states: CT, MA, ME, NH, NJ, NY, PA, VT. Southern states: AL, AR, DE, FL, GA, KY, LA, MD, MS, NC, TN, TX, VA, WV and Washington DC. Western States: AK, CA, CO, HI, ID, NV, UT, WA.
Below are the current HMPV wastewater categories for all WWSCAN sites, with only 38% of sites showing wastewater onset for HMPV (recall the category is determined by both the trend and the level):
- 100 are in the LOW Wastewater Category
- 2 are in the MEDIUM Wastewater Category
- 75 are in the HIGH Wastewater Category
- 14 do not have enough data to calculate (Fremont, CA; Newark, CA; Pacifica, CA; Petaluma, CA; South San Diego, CA; Union City, CA; South Miami, FL; Hilo, HI; Bloomington, IN; Muscatine, IA; Louisville, KY; Portland, ME; Gautier, MS; Pascagoula Moss Point, MS; Chester, PA)
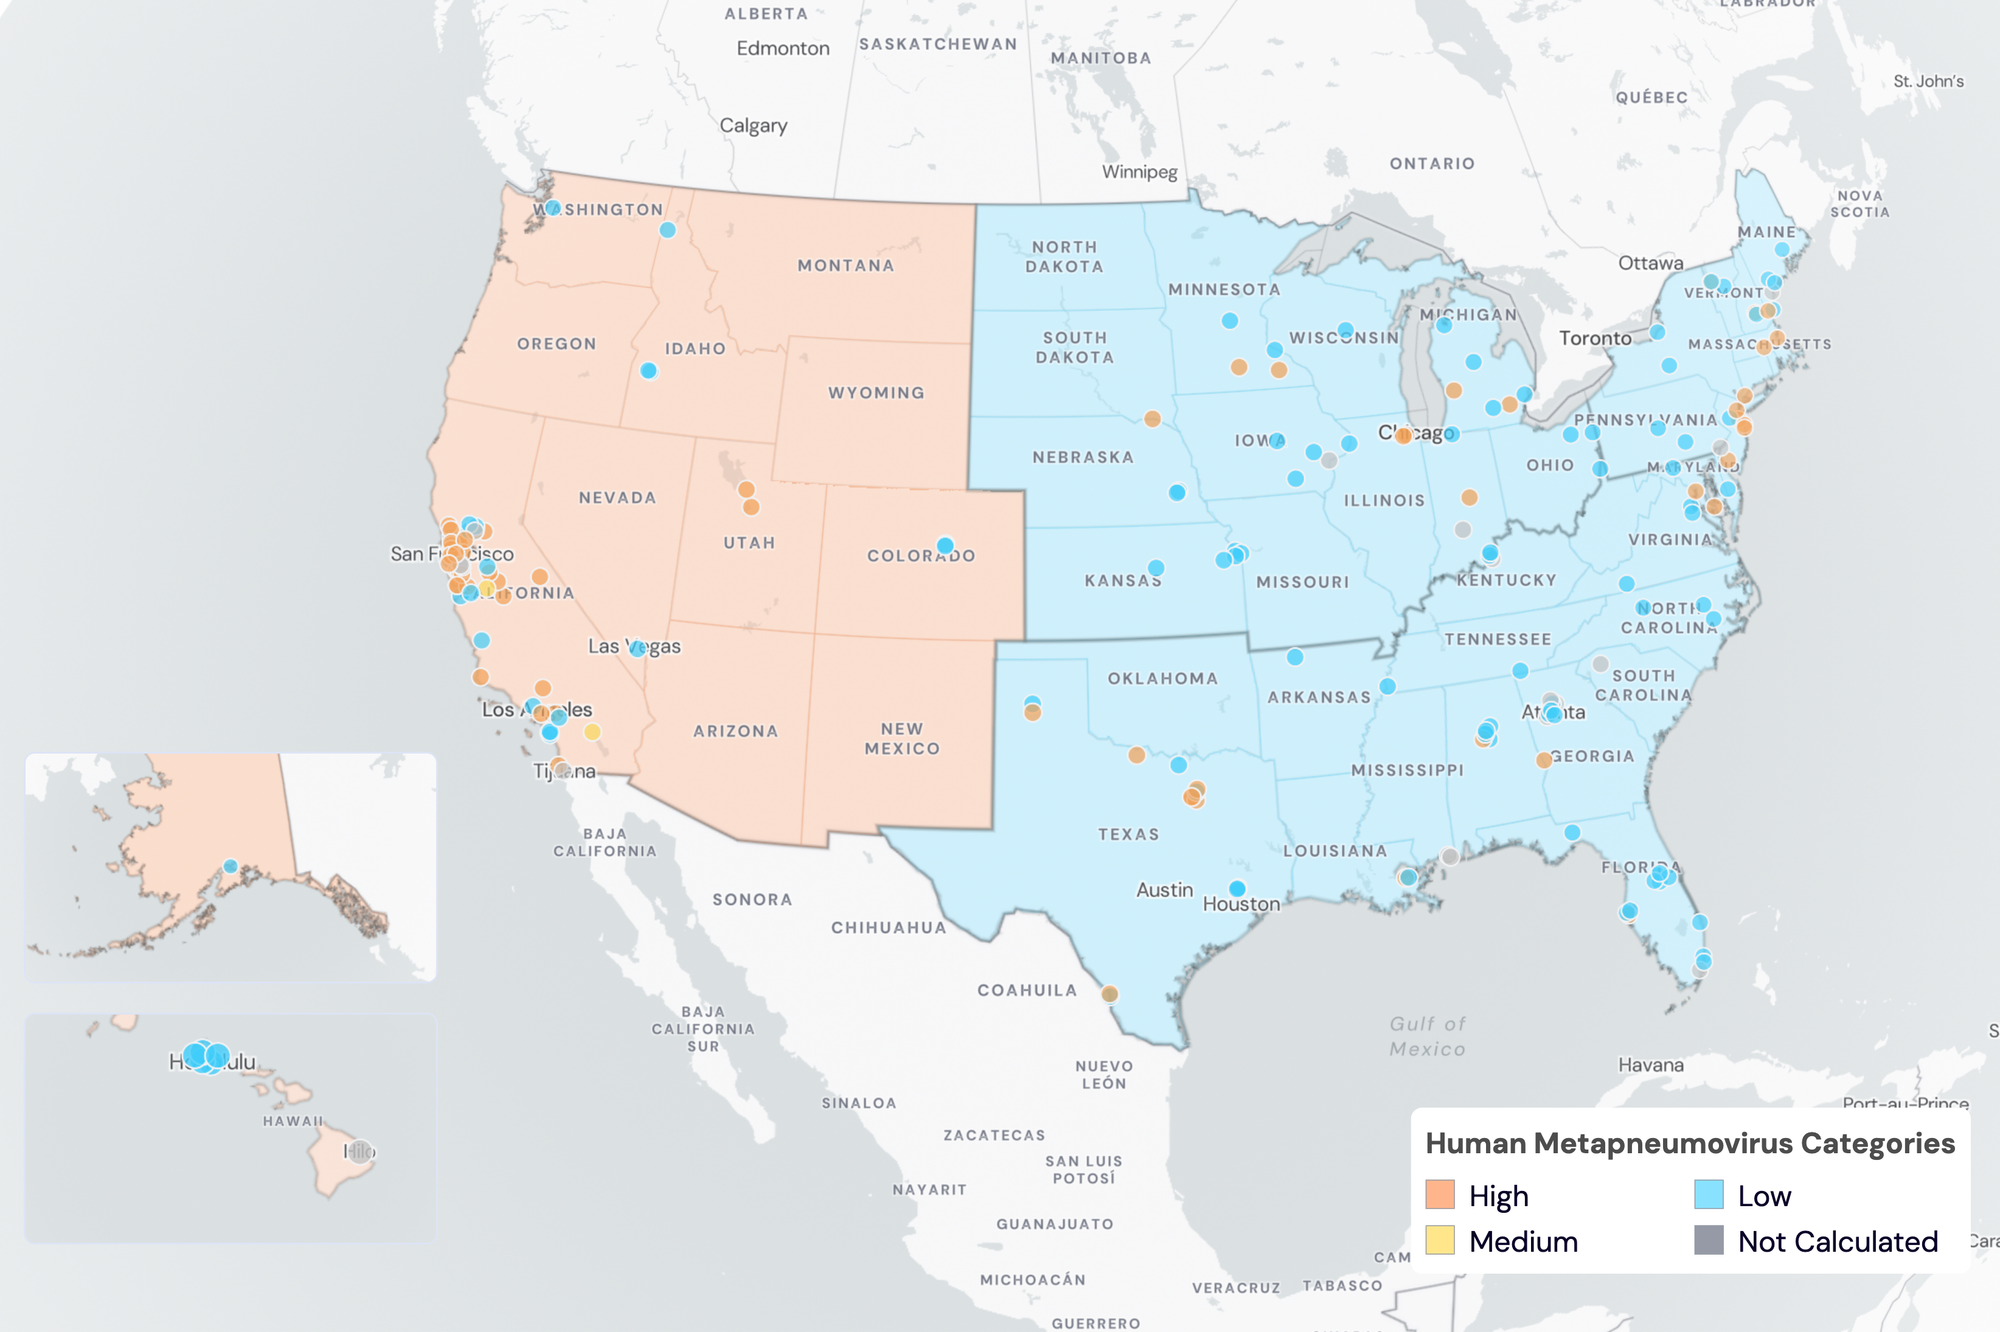
HMPV Wastewater Categories. This map includes sample collection data through March 20, 2024. Each dot represents a single site and the four US Census regions are outlined in gray. Midwest Region includes: IA, IL, IN, KS, MI, MN, NE, OH, SD, WI. Northeast Region includes: CT, MA, ME, NH, NJ, NY, PA, VT. Southern Region includes: AL, AR, DE, FL, GA, KY, LA, MD, MS, NC, TN, TX, VA, WV and Washington DC. Western Region includes: AK, CA, CO, HI, ID, NV, UT, WA.
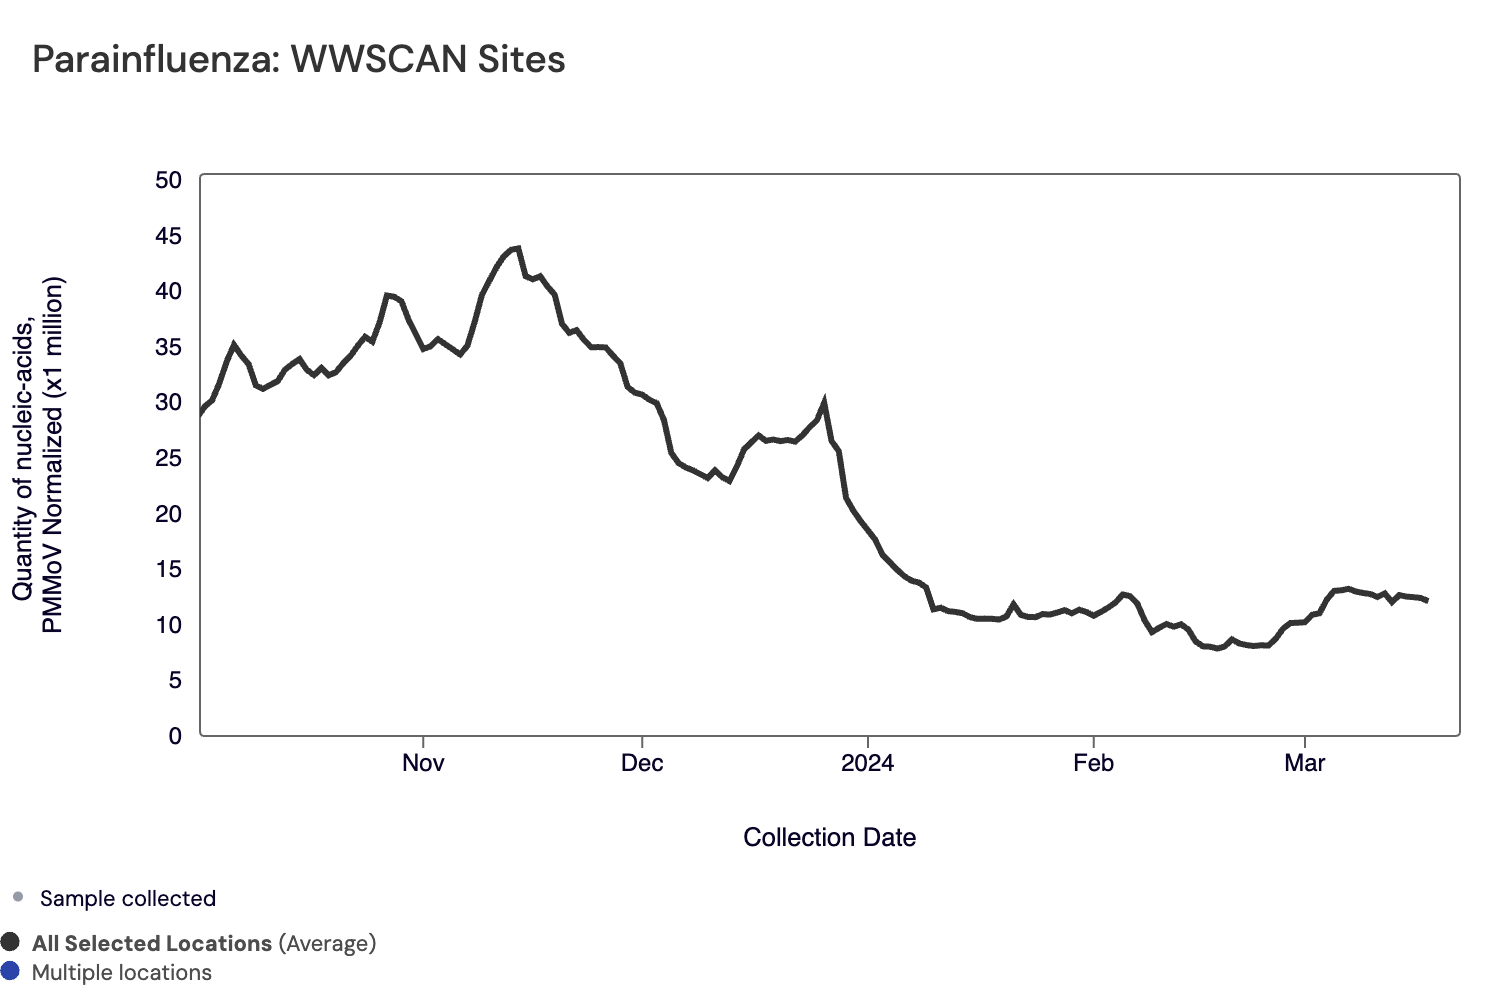
Human Parainfluenza (HPIV) RNA has been detected in ~56% of samples collected from WWSCAN sites. The HPIV median concentration across all sites over the last 21 days is 2,741 copies/gram. Below is the population weighted average HPIV RNA concentrations (normalized by PMMoV) from all participating WWSCAN sites across the country since we started monitoring in fall 2023.
Nationally, HPIV is in the "Medium" category with medium concentrations and a downward trend over the last 21 days.
Below are the current Parainfluenza wastewater categories for all WWSCAN sites (recall the category is determined by both the trend and the level):
- 99 are in the LOW Wastewater Category
- 41 are in the MEDIUM Wastewater Category
- 37 are in the HIGH Wastewater Category
- 14 do not have enough data to calculate (Fremont, CA; Newark, CA; Pacifica, CA; Petaluma, CA; South San Diego, CA; Union City, CA; South Miami, FL; Hilo, HI; Bloomington, IN; Muscatine, IA; Louisville, KY; Portland, ME; Gautier, MS; Pascagoula Moss Point, MS; Chester, PA)
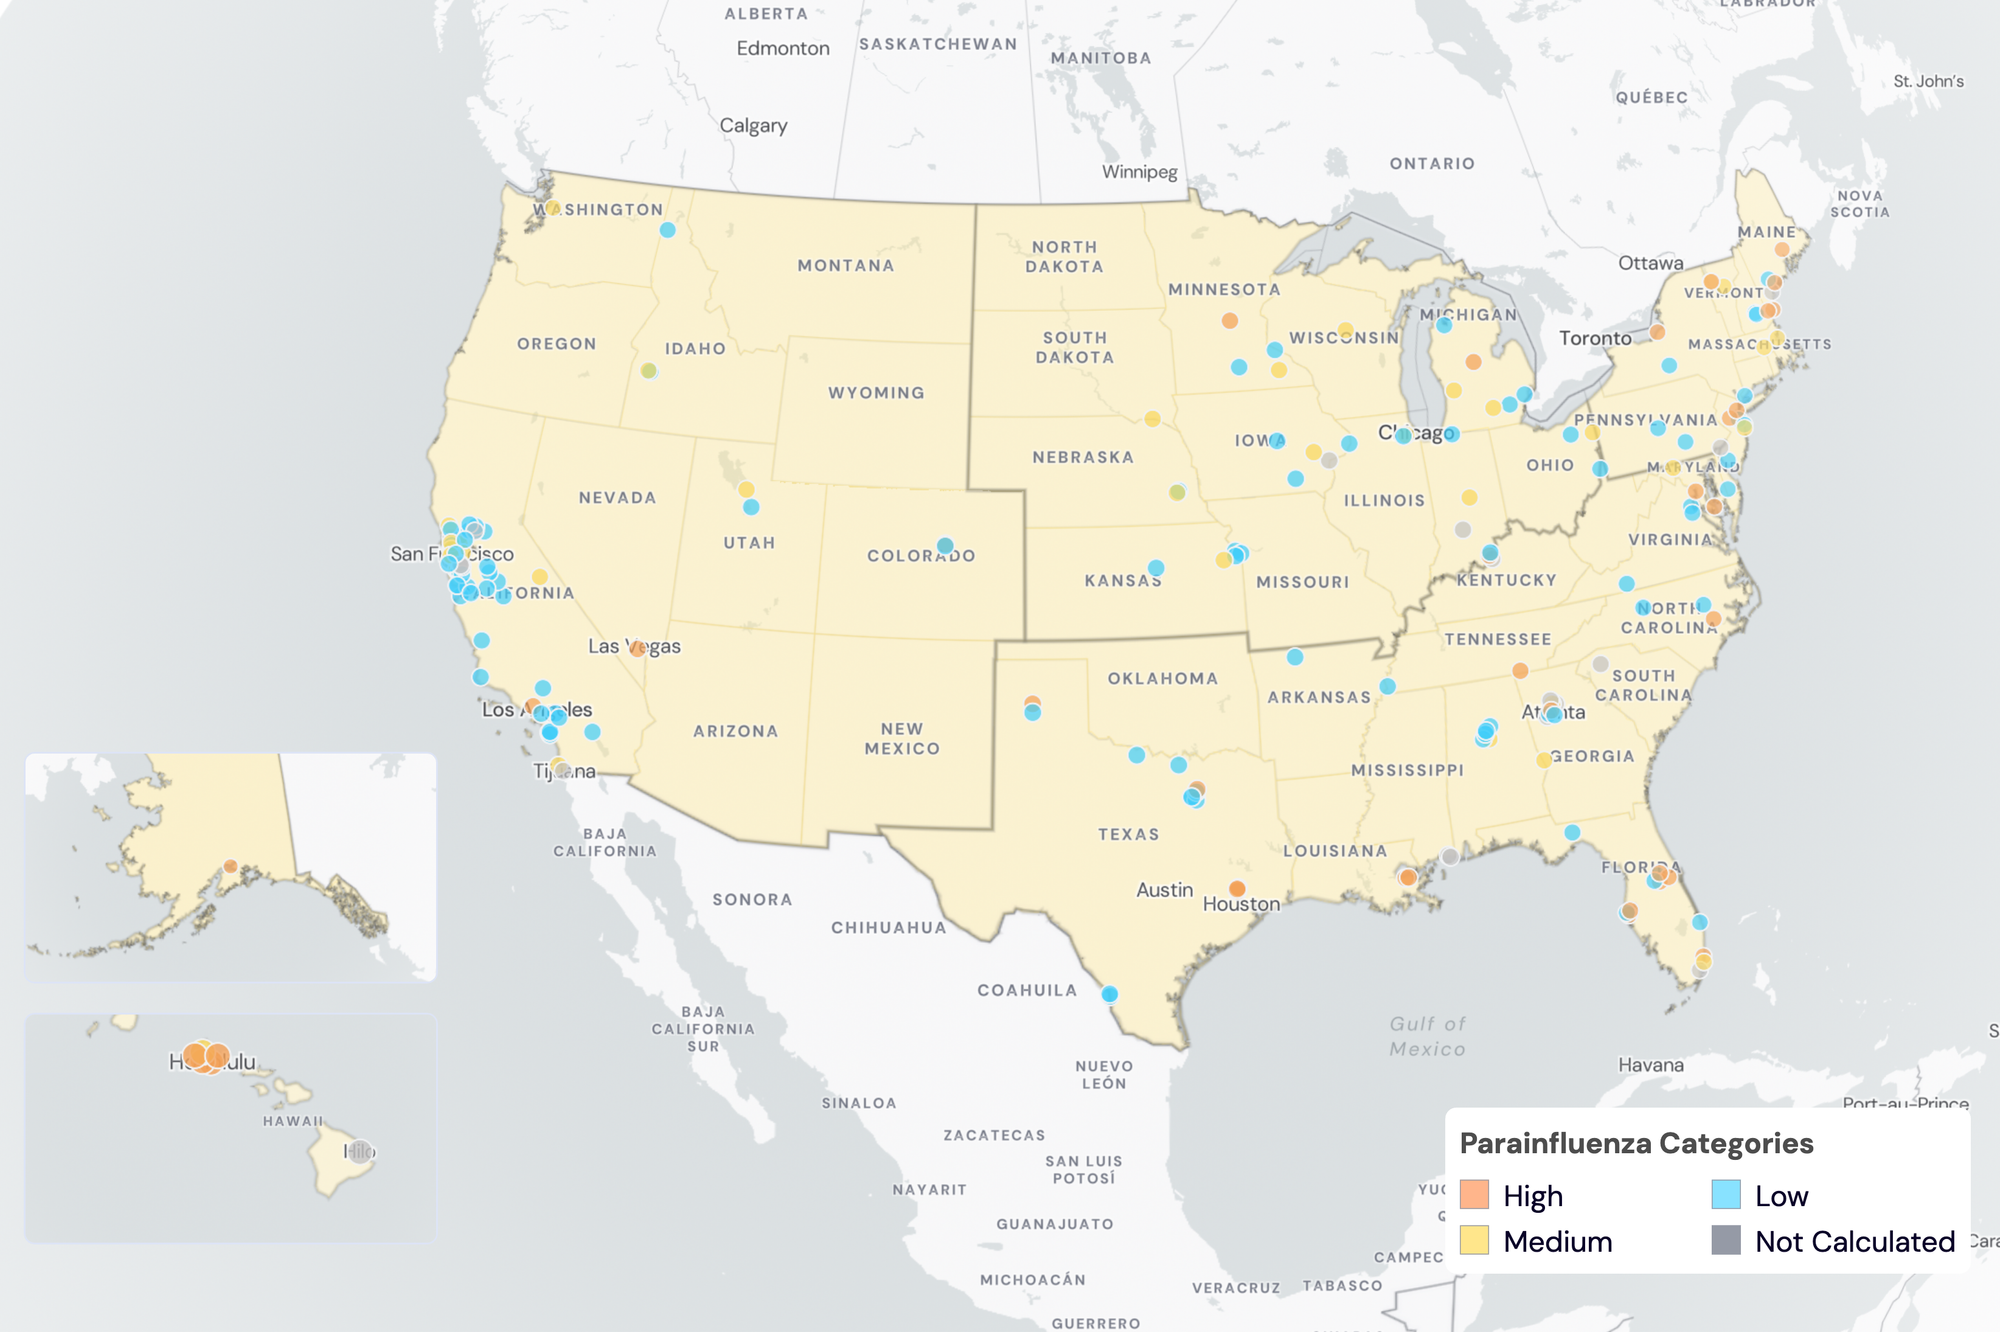
HPIV Wastewater Categories. This map includes sample collection data through March 20, 2024. Each dot represents a single site and the four US Census regions are outlined in gray. Midwest Region includes: IA, IL, IN, KS, MI, MN, NE, OH, SD, WI. Northeast Region includes: CT, MA, ME, NH, NJ, NY, PA, VT. Southern Region includes: AL, AR, DE, FL, GA, KY, LA, MD, MS, NC, TN, TX, VA, WV and Washington DC. Western Region includes: AK, CA, CO, HI, ID, NV, UT, WA.
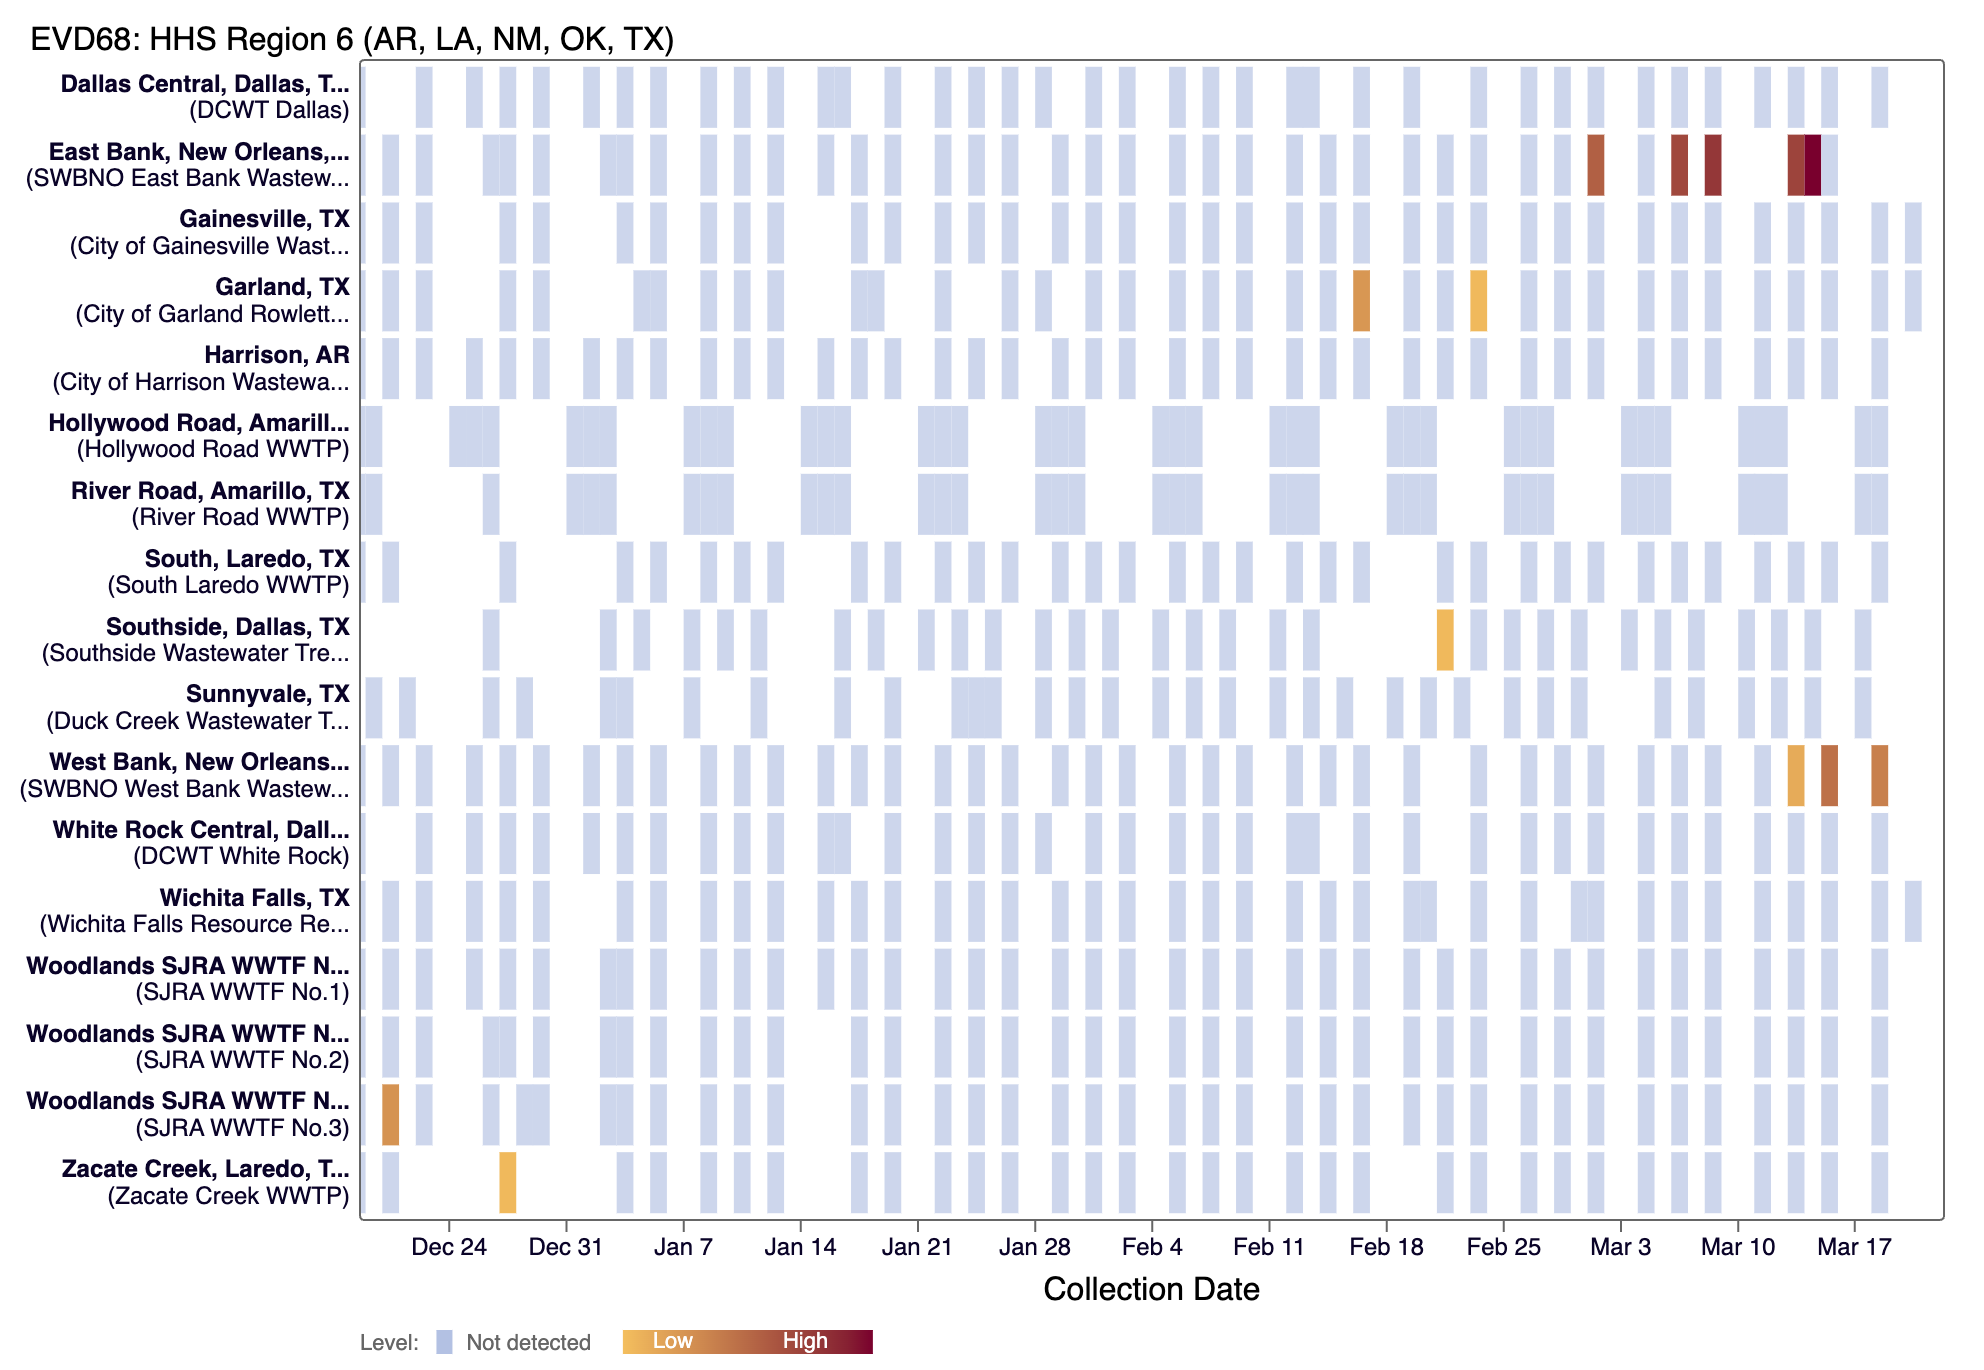
Enterovirus D68 (EV-D68) RNA was rarely detected (~9%) in samples collected in the last 21 days at most WWSCAN sites and the median concentration across all sites over the last 21 days is below the level of detection.
The chart below plants in HHS region 6 as rows, and the last 21 days as columns (labeled at the bottom axis). White indicates no samples, blue is non-detect for EV-D68 DNA and red is detect for EV-D68 RNA.
Below are the current EV-D68 wastewater categories for all WWSCAN sites (recall the category is determined by the frequency of detection):
- 163 are in the LOW Wastewater Category
- 14 are in the MEDIUM Wastewater Category
- 0 are in the HIGH Wastewater Category
- 14 do not have enough data to calculate (Fremont, CA; Newark, CA; Pacifica, CA; Petaluma, CA; South San Diego, CA; Union City, CA; South Miami, FL; Hilo, HI; Bloomington, IN; Muscatine, IA; Louisville, KY; Portland, ME; Gautier, MS; Pascagoula Moss Point, MS; Chester, PA)
Gastrointestinal Pathogens
Norovirus GII and Rotavirus
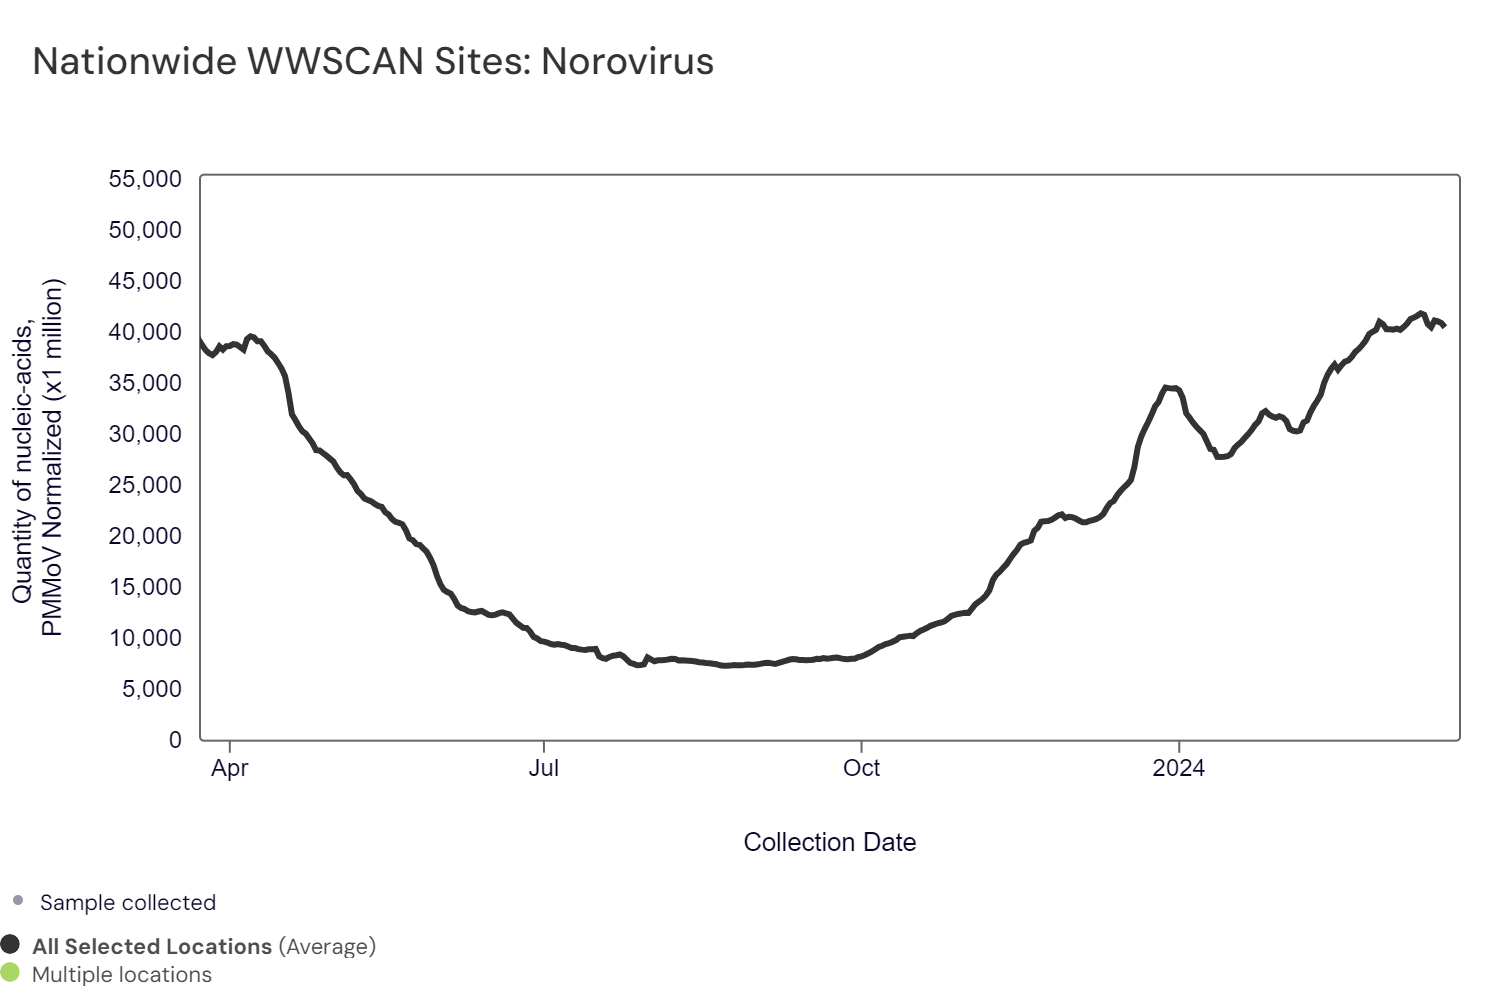
Norovirus GII (HuNoV GII) RNA has been consistently detected at the sites. The median concentration across all sites over the last 21 days is 11,135,671 copies/gram (for reference median concentration in February 2024 was 10,676,132 copies/gram). Below are the HuNoV GII RNA concentrations (normalized by PMMoV) from all participating WWSCAN sites across the country over the last 365 days. The population-weighted average is shown.
Nationally, Norovirus is in "High" category with aggregated measurements showing high concentrations and a downward trend over the past 21 days.
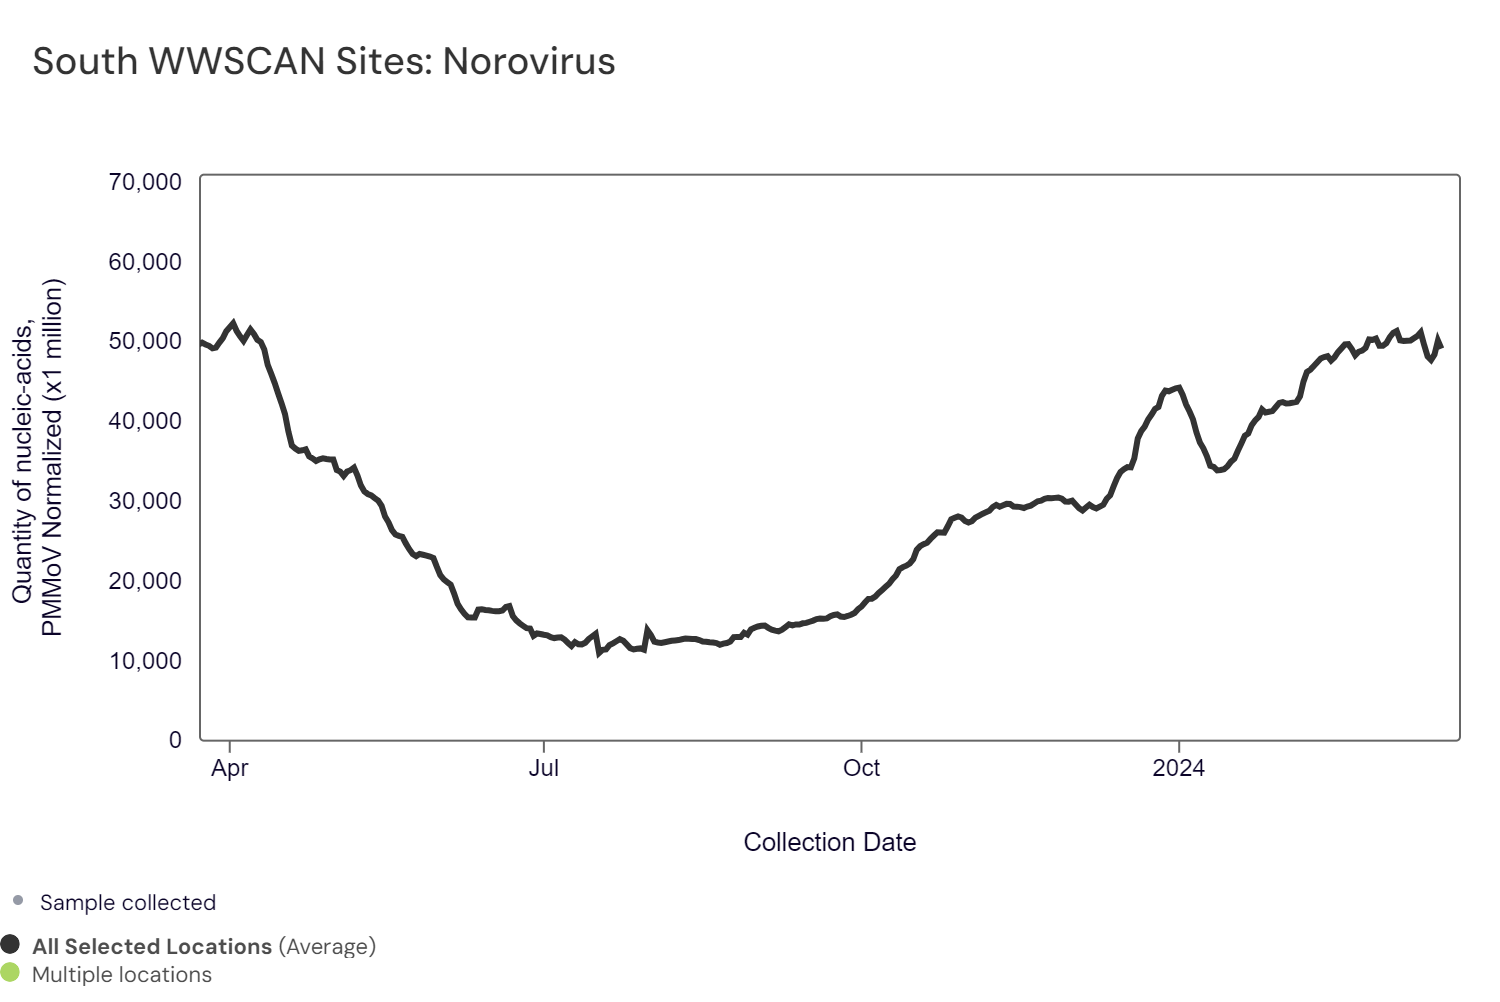
Below are the population-weighted average HuNoV GII RNA concentrations (normalized by PMMoV) from sites in the Midwest US (top left panel), Northeast US (top right panel), Southern US (bottom left panel) and Western US (bottom right panel).
All regions are in the "High" category with the aggregated measurements for most regions showing no significant trend in the Midwest, South, and West, but a downward trend in the Northeast over the last 21 days.
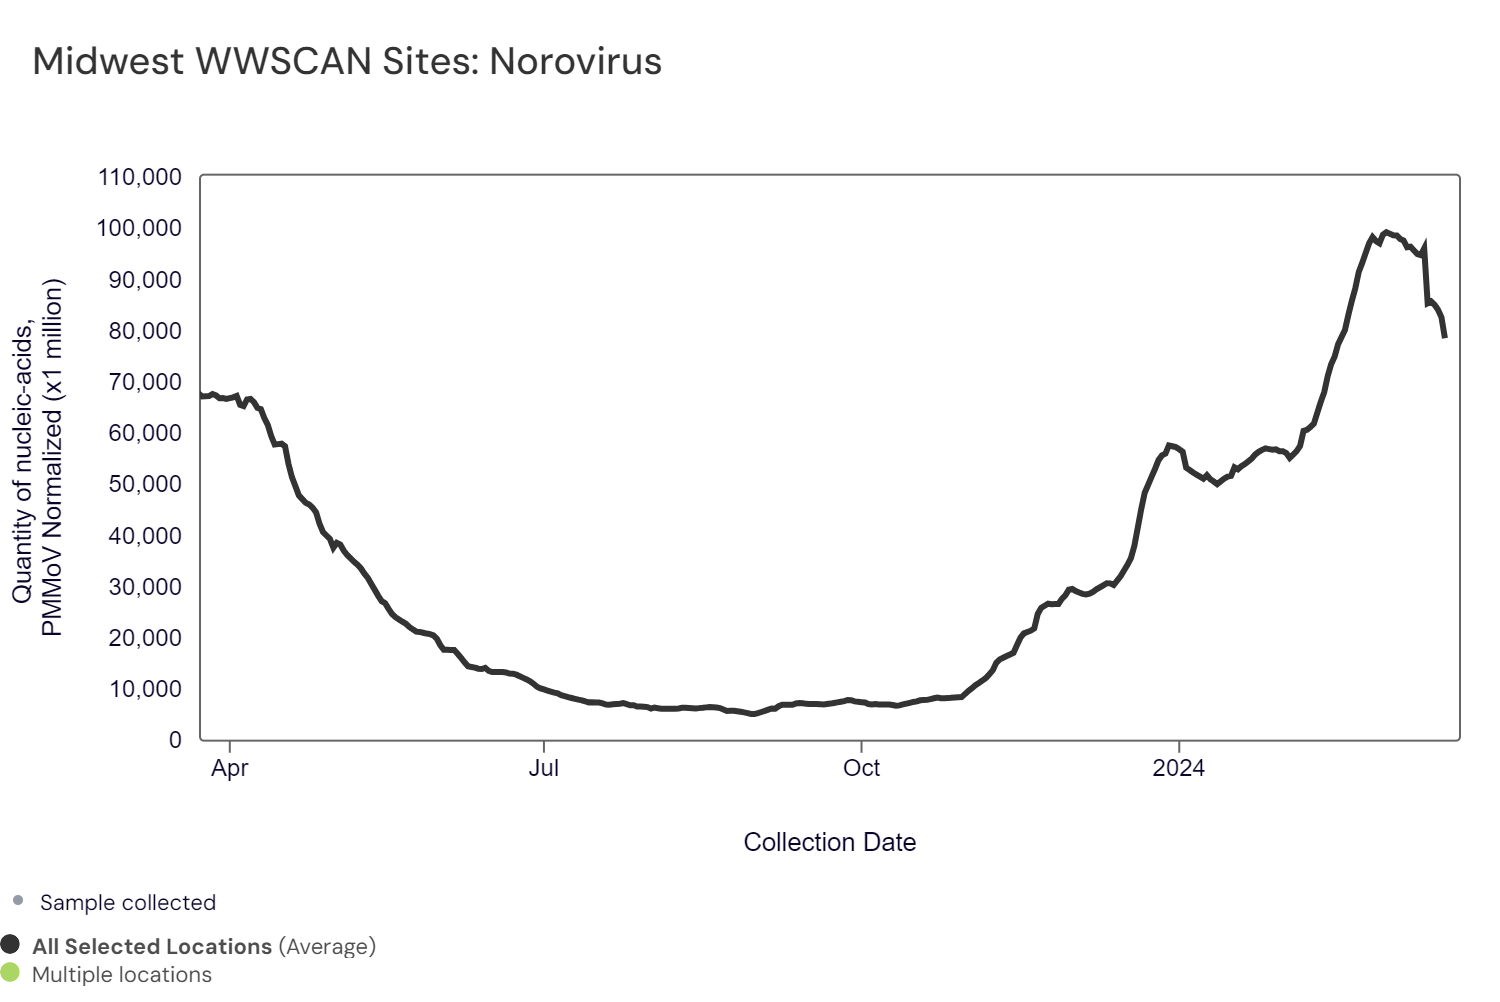
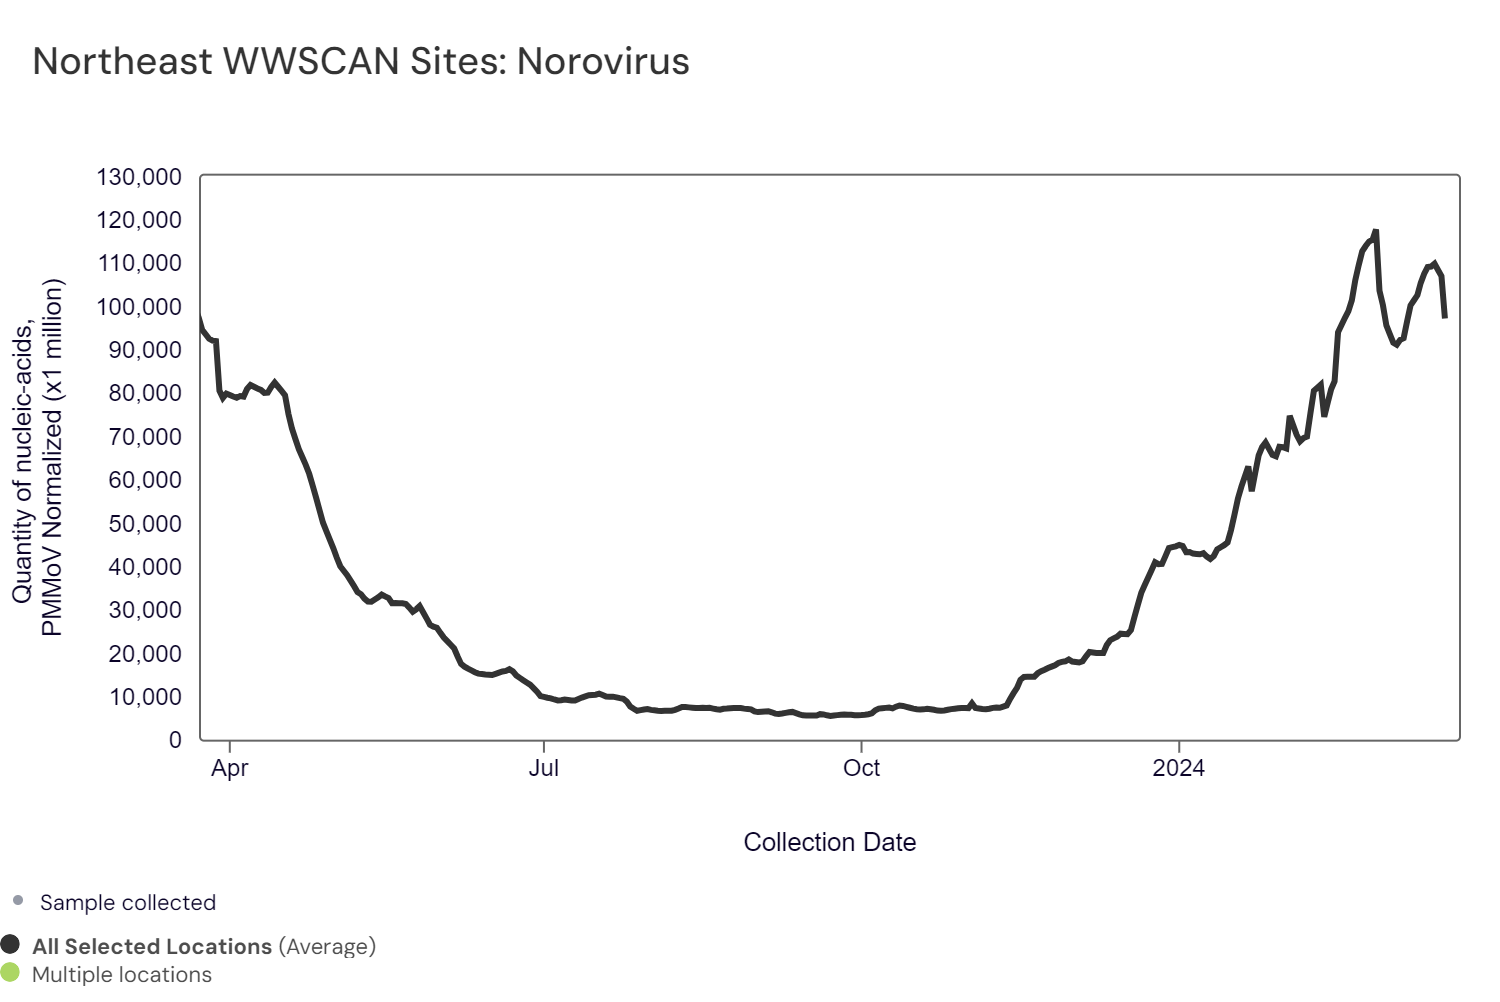

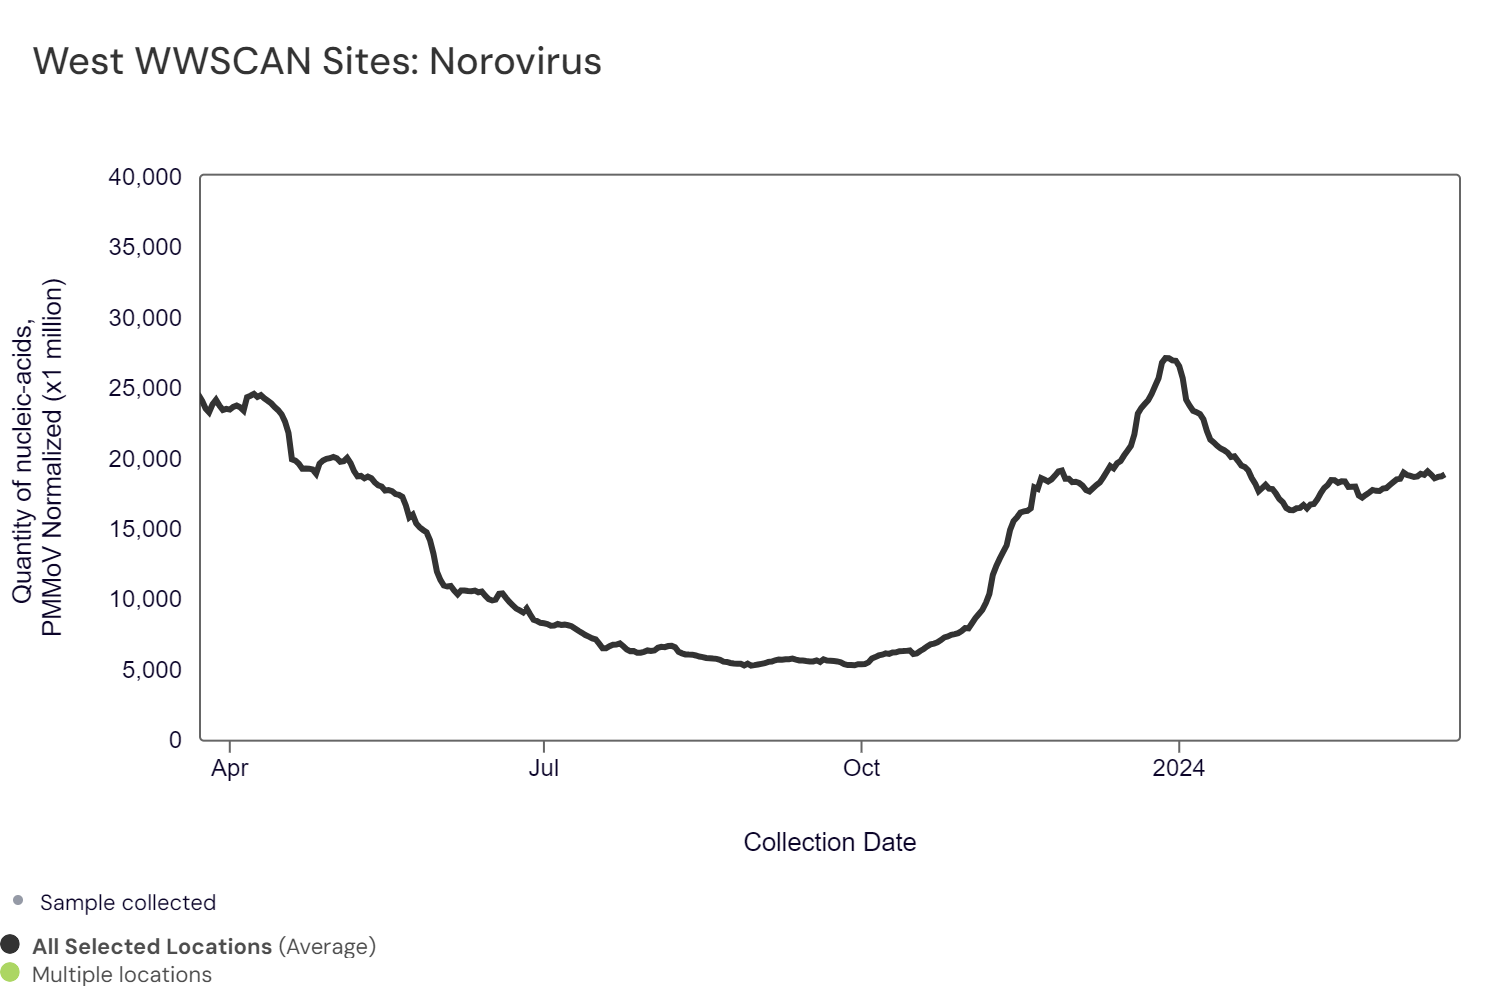
Midwest states: IA, IL, IN, KS, MI, MN, NE, OH, SD, WI. Northeast states: CT, MA, ME, NH, NJ, NY, PA, VT. Southern states: AL, AR, DE, FL, GA, KY, LA, MD, MS, NC, TN, TX, VA, WV and Washington DC. Western States: AK, CA, CO, HI, ID, NV, UT, WA.
Below are the current Norovirus wastewater categories for all WWSCAN sites (recall the category is determined by both the trend and the level):
- 18 are in the LOW Wastewater Category
- 41 are in the MEDIUM Wastewater Category
- 118 are in the HIGH Wastewater Category
- 14 do not have enough data to calculate (Fremont, CA; Newark, CA; Pacifica, CA; Petaluma, CA; South San Diego, CA; Union City, CA; South Miami, FL; Hilo, HI; Bloomington, IN; Muscatine, IA; Louisville, KY; Portland, ME; Gautier, MS; Pascagoula Moss Point, MS; Chester, PA)
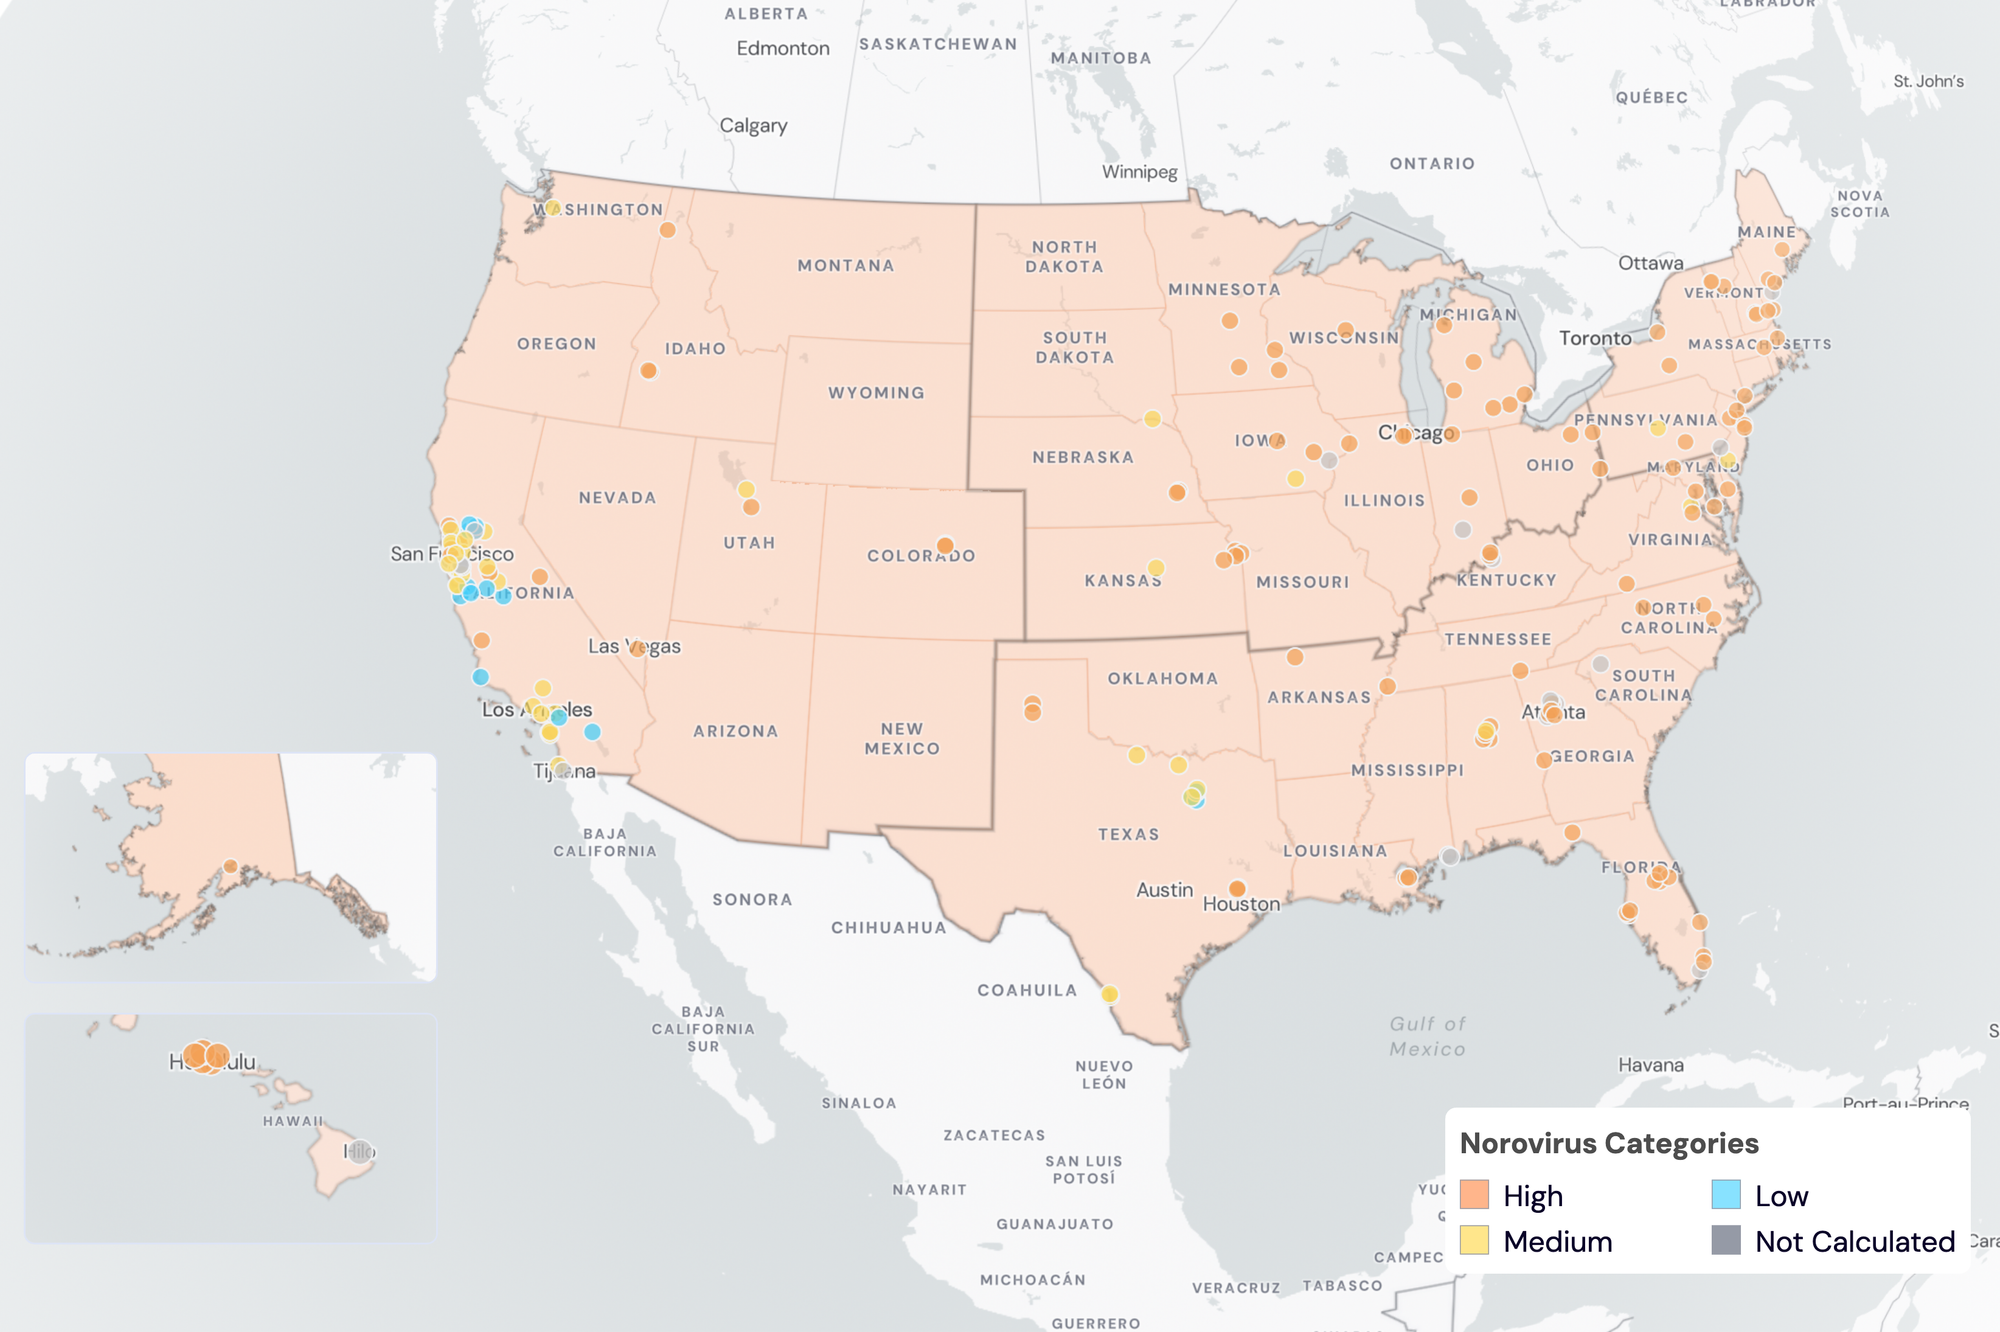
Norovirus Wastewater Categories. This map includes sample collection data through March 20, 2024. Each dot represents a single site and the four US Census regions are outlined in gray. Midwest states: IA, IL, IN, KS, MI, MN, NE, OH, SD, WI. Northeast states: CT, MA, ME, NH, NJ, NY, PA, VT. Southern states: AL, AR, DE, FL, GA, KY, LA, MD, MS, NC, TN, TX, VA, WV and Washington DC. Western States: AK, CA, CO, HI, ID, NV, UT, WA.
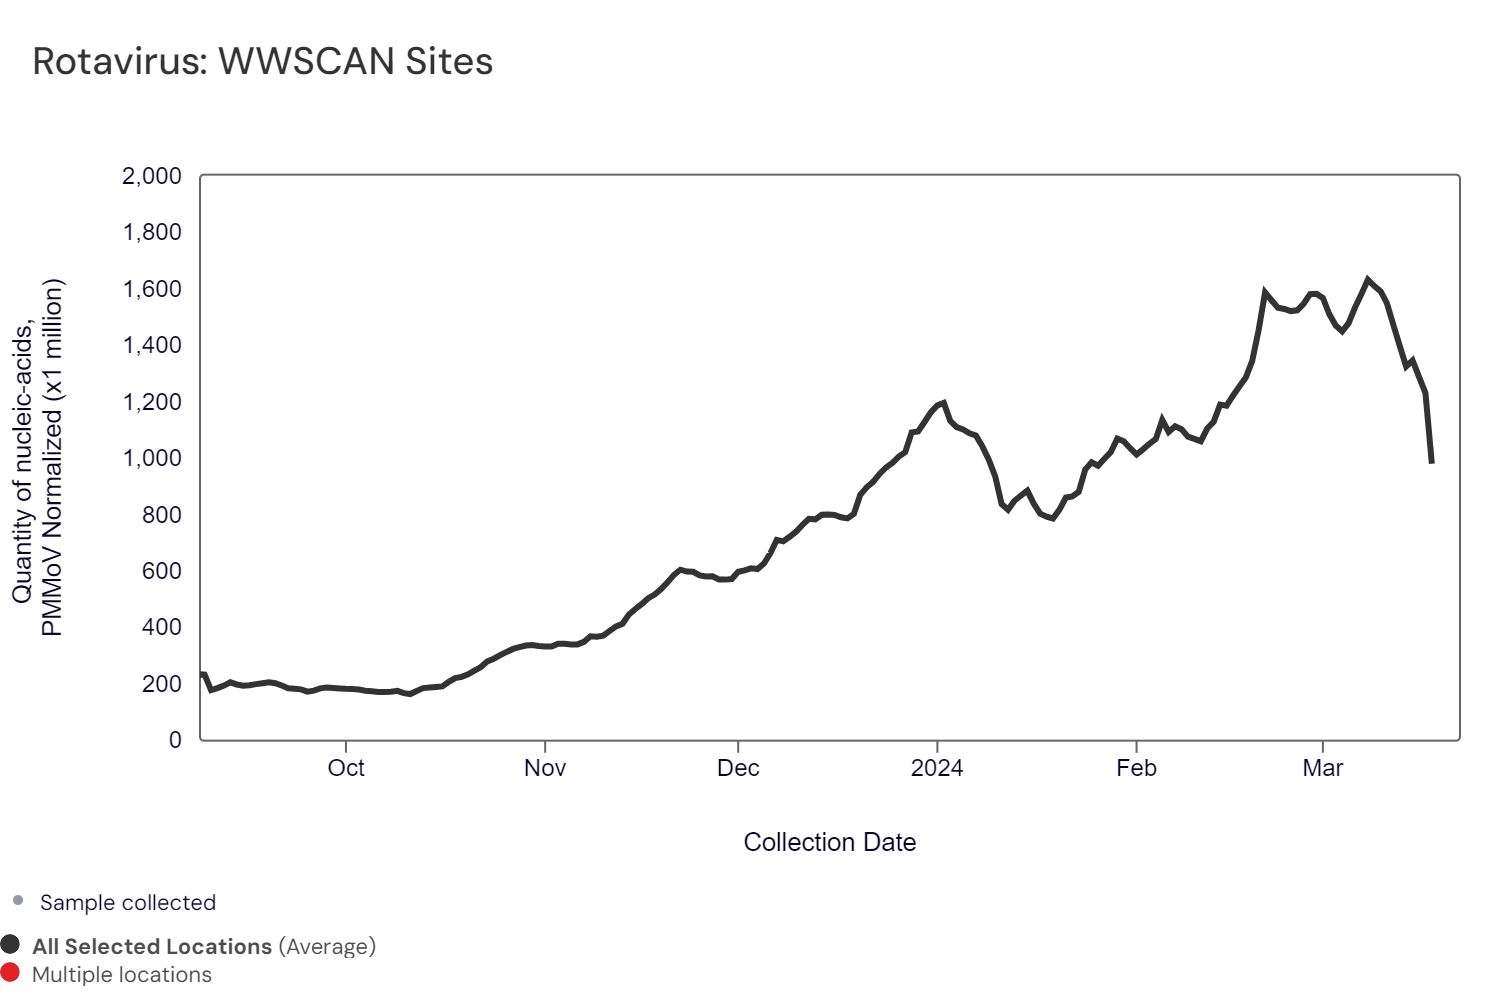
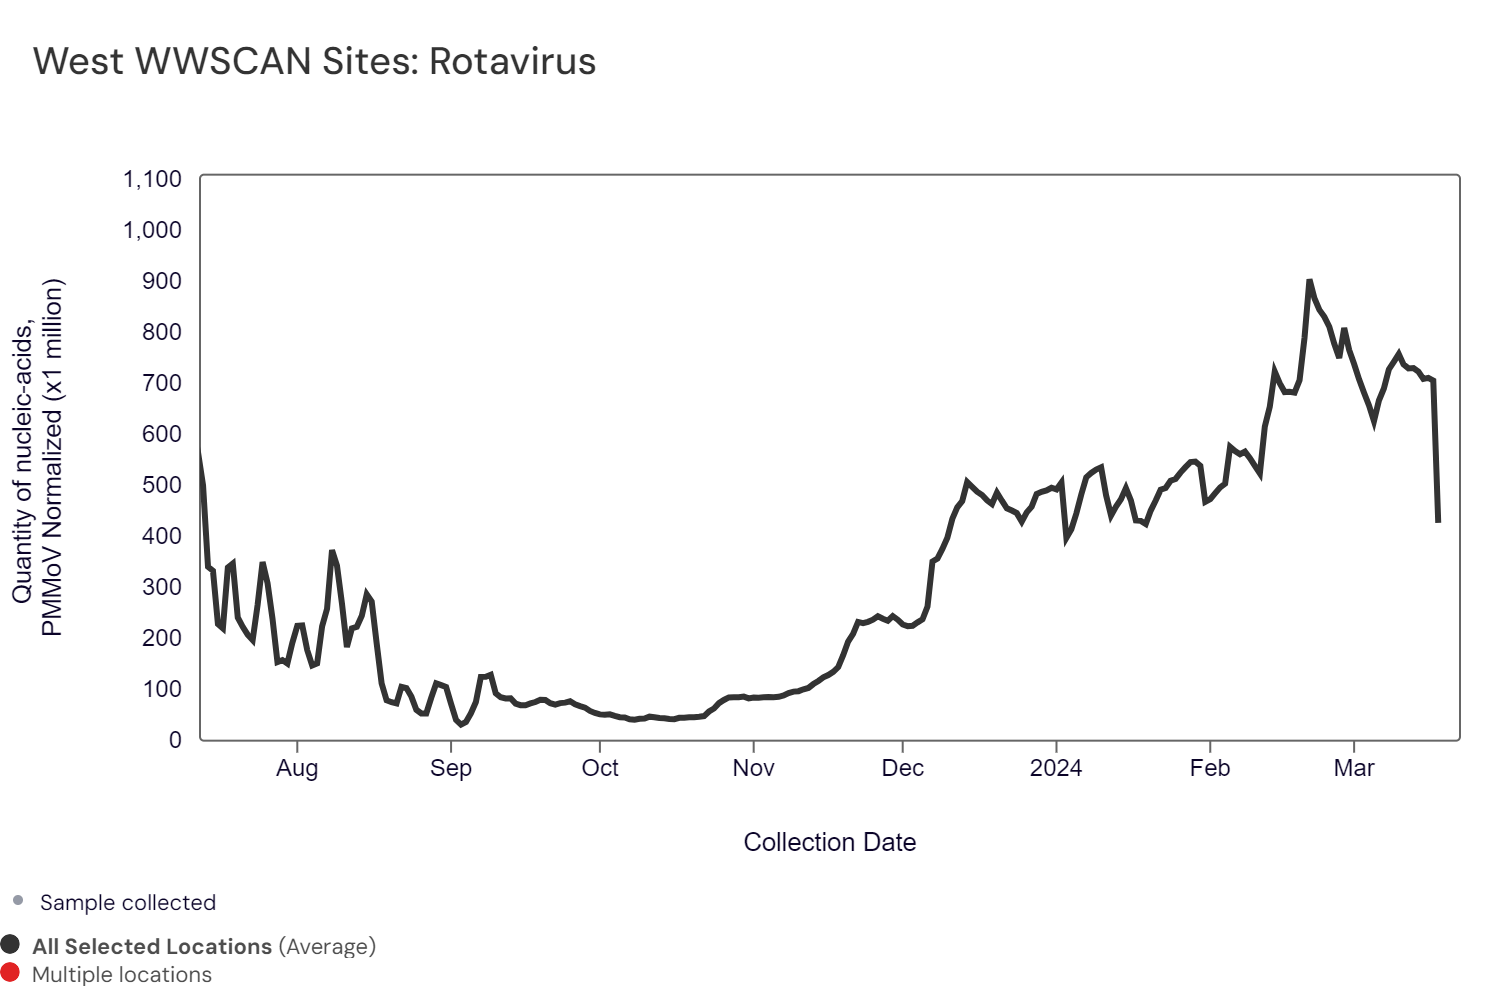
Rotavirus RNA median concentrations across all sites over the last 21 days is 244,104 copies/gram. For reference, the median concentration in February 2024 was 183,550 copies/gram.
Below are the Rotavirus RNA concentrations (normalized by PMMoV) from all participating WWSCAN sites across the country over about the last 6 months. The population-weighted average is shown.
Nationally, Rotavirus is in "High" category with aggregated measurements showing high concentrations with a downward trend in last 21 days.
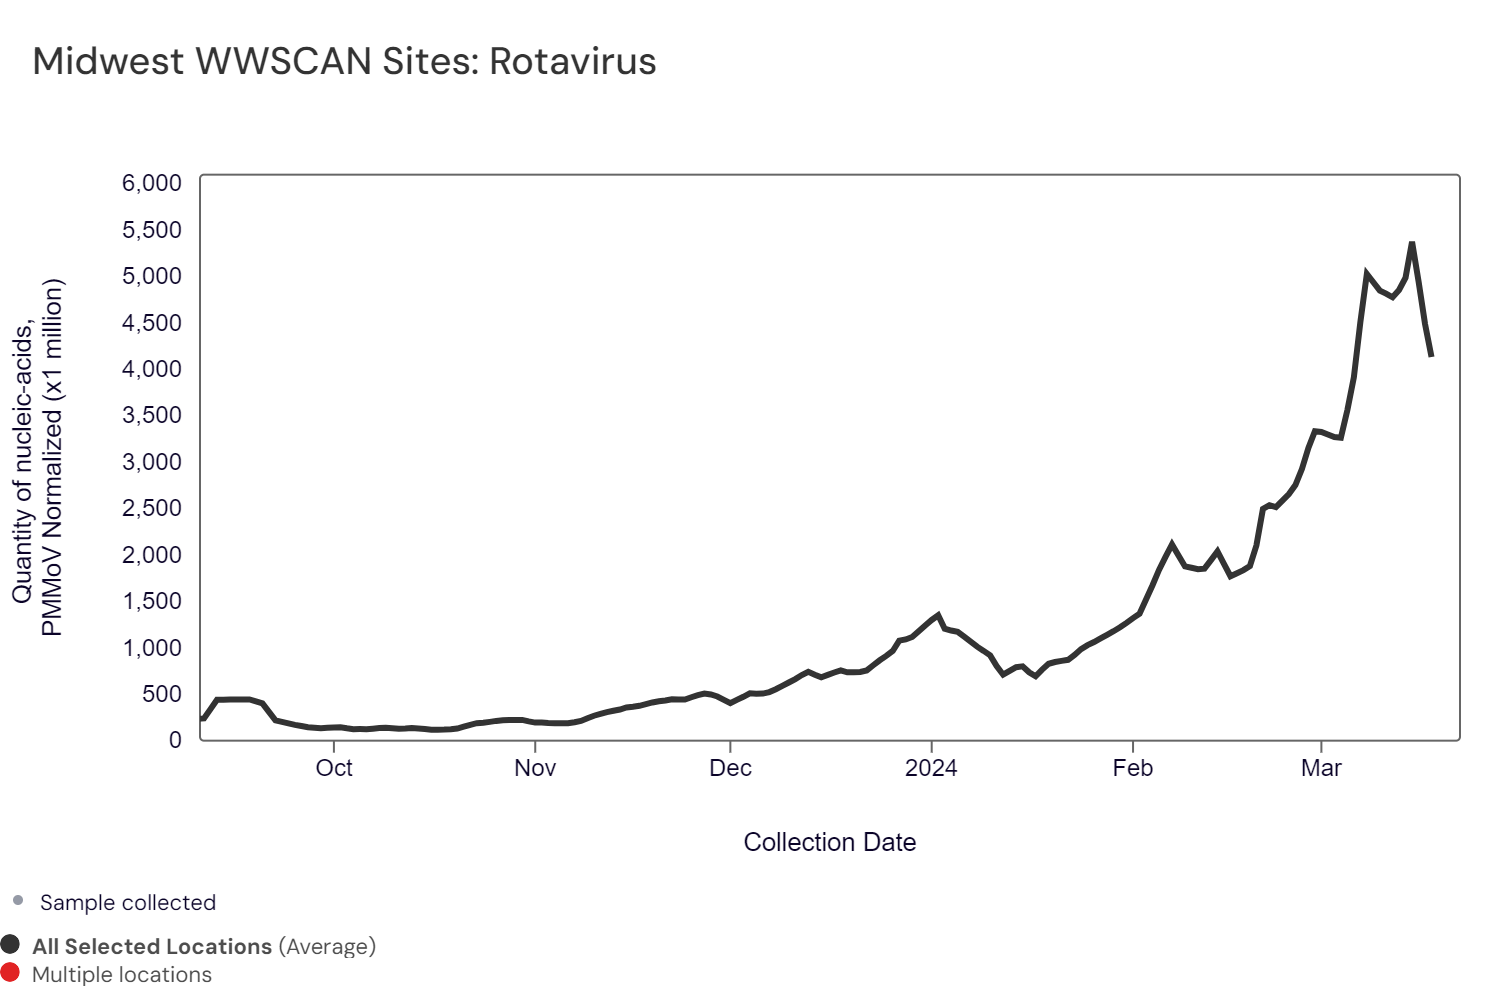
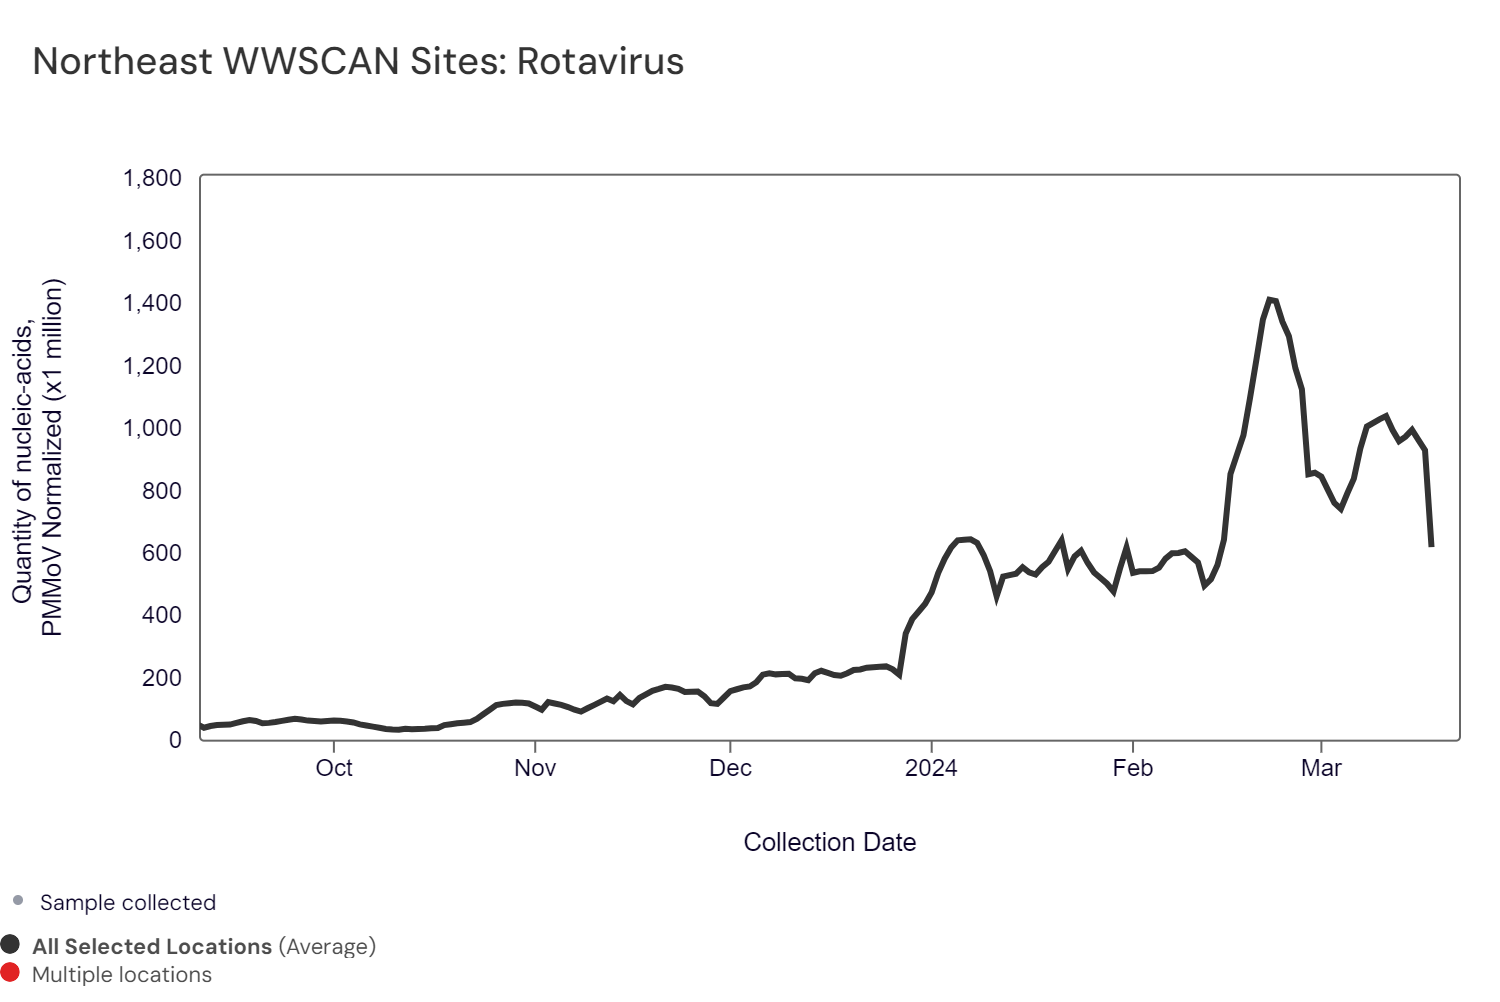
Below are the population-weighted average Rotavirus RNA concentrations (normalized by PMMoV) from sites in the Midwest US (top left panel), Northeast US (top right panel), Southern US (bottom left panel) and Western US (bottom right panel).
The Midwest, South, and West are in the "High" wastewater category for Rotavirus with high concentrations . The Northeast is in the "Medium" category due to medium concentrations and a downward trend in the last 21 days.
Below are the current Rotavirus wastewater categories for all WWSCAN sites (recall the category is determined by both the trend and the level):
- 18 are in the LOW Wastewater Category
- 53 are in the MEDIUM Wastewater Category
- 106 are in the HIGH Wastewater Category
- 14 do not have enough data to calculate (Fremont, CA; Newark, CA; Pacifica, CA; Petaluma, CA; South San Diego, CA; Union City, CA; South Miami, FL; Hilo, HI; Bloomington, IN; Muscatine, IA; Louisville, KY; Portland, ME; Gautier, MS; Pascagoula Moss Point, MS; Chester, PA)
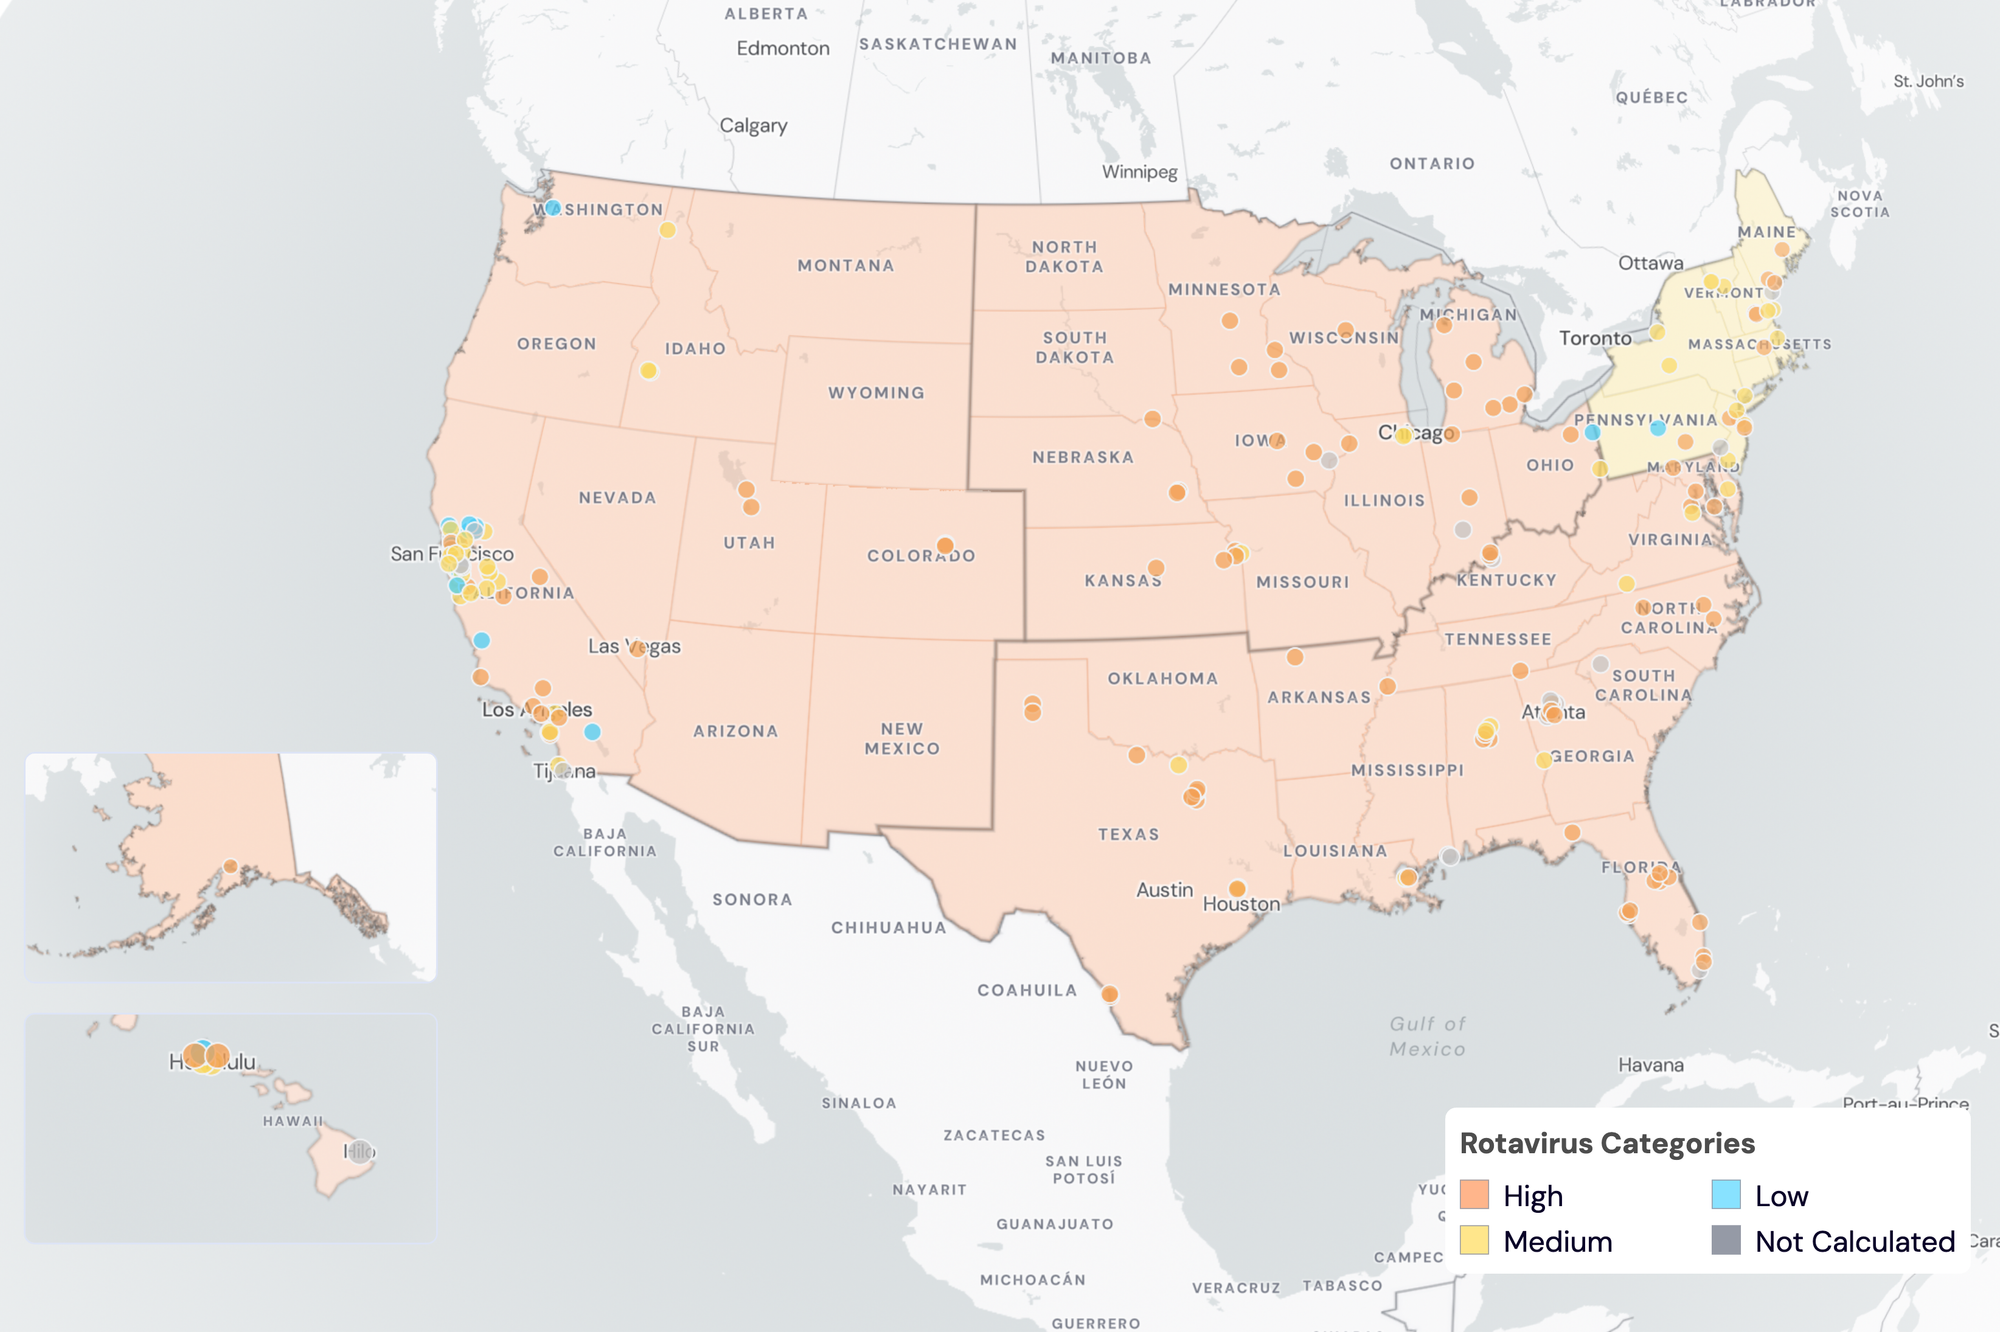
Rotavirus Wastewater Categories. This map includes sample collection data through March 20, 2024. Each dot represents a single site and the four US Census regions are outlined in gray. Midwest states: IA, IL, IN, KS, MI, MN, NE, OH, SD, WI. Northeast states: CT, MA, ME, NH, NJ, NY, PA, VT. Southern states: AL, AR, DE, FL, GA, KY, LA, MD, MS, NC, TN, TX, VA, WV and Washington DC. Western States: AK, CA, CO, HI, ID, NV, UT, WA.
Other Pathogens of Concern
Mpox, Candida auris, and Hepatitis A
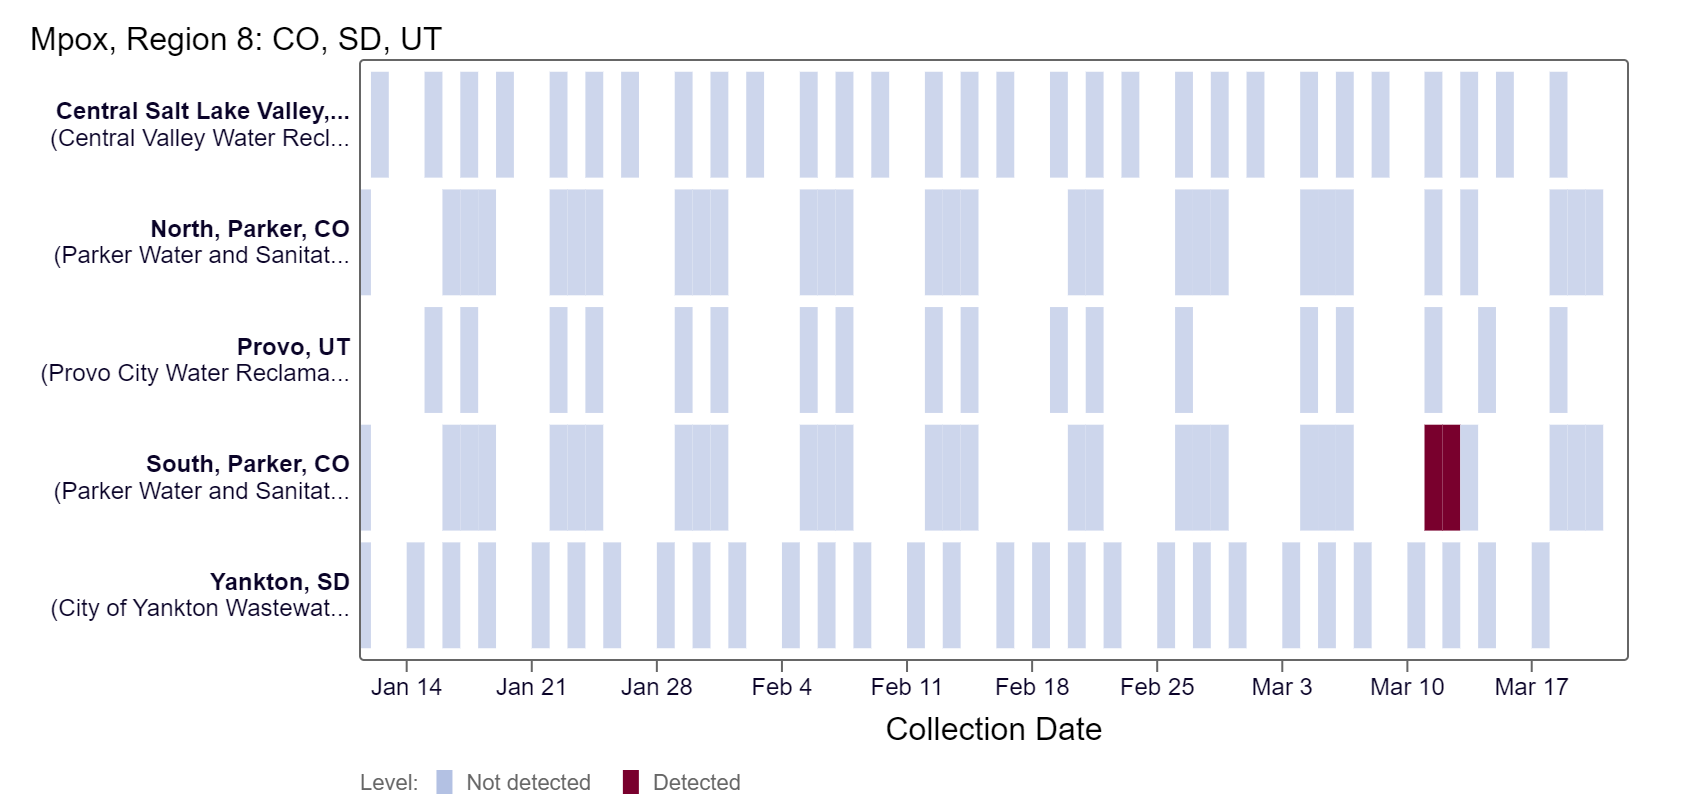
Mpox DNA We have only detected mpox DNA in 4 samples from all sites in the past 21 days. Nationally, Mpox is in "Low" category due to limited detections.
The chart below plants in HHS region 8 as rows, and the last 21 days as columns (labeled at the bottom axis). White indicates no samples, blue is non-detect for mpox DNA and red is detect for mpox DNA.
Below are the Mpox wastewater categories for all WastewaterSCAN sites (recall the category is determined by the frequency of detection):
- 177 are in the LOW Wastewater Category
- 0 are in the MEDIUM Wastewater Category
- 0 are in the HIGH Wastewater Category
- 14 do not have enough data to calculate (Fremont, CA; Newark, CA; Pacifica, CA; Petaluma, CA; South San Diego, CA; Union City, CA; South Miami, FL; Hilo, HI; Bloomington, IN; Muscatine, IA; Louisville, KY; Portland, ME; Gautier, MS; Pascagoula Moss Point, MS; Chester, PA)
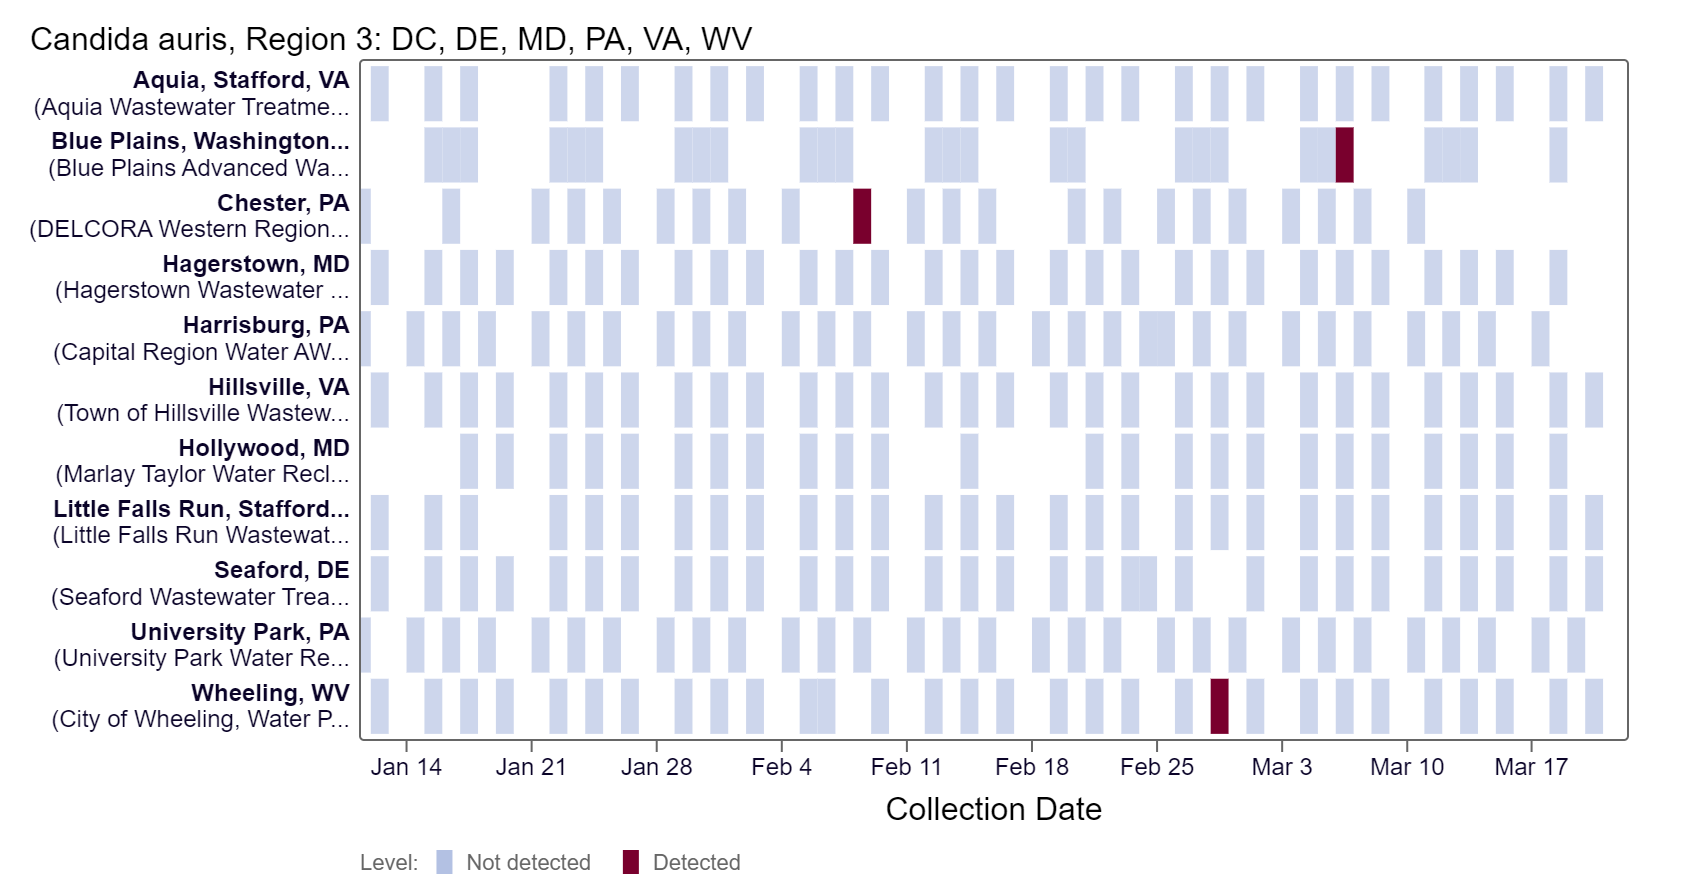
Candida auris (C.auris) DNA - We have detected C. auris DNA in 0.6% of samples from all WWSCAN sites over the past three weeks. Nationally, C. auris is in "Low" category due to limited detections.
The chart below shows each WWSCAN plant in HHS Region 3 as rows, and the last 21 days as columns (labeled at the bottom axis). White indicates no samples, blue is non-detect for C. auris DNA and red is detect for C. auris DNA.
Below are the C. auris wastewater categories for all WastewaterSCAN sites (recall the category is determined by the frequency of detection):
- 176 are in the LOW Wastewater Category
- 1 is in the MEDIUM Wastewater Category
- 0 are in the HIGH Wastewater Category
- 14 do not have enough data to calculate (Fremont, CA; Newark, CA; Pacifica, CA; Petaluma, CA; South San Diego, CA; Union City, CA; South Miami, FL; Hilo, HI; Bloomington, IN; Muscatine, IA; Louisville, KY; Portland, ME; Gautier, MS; Pascagoula Moss Point, MS; Chester, PA)
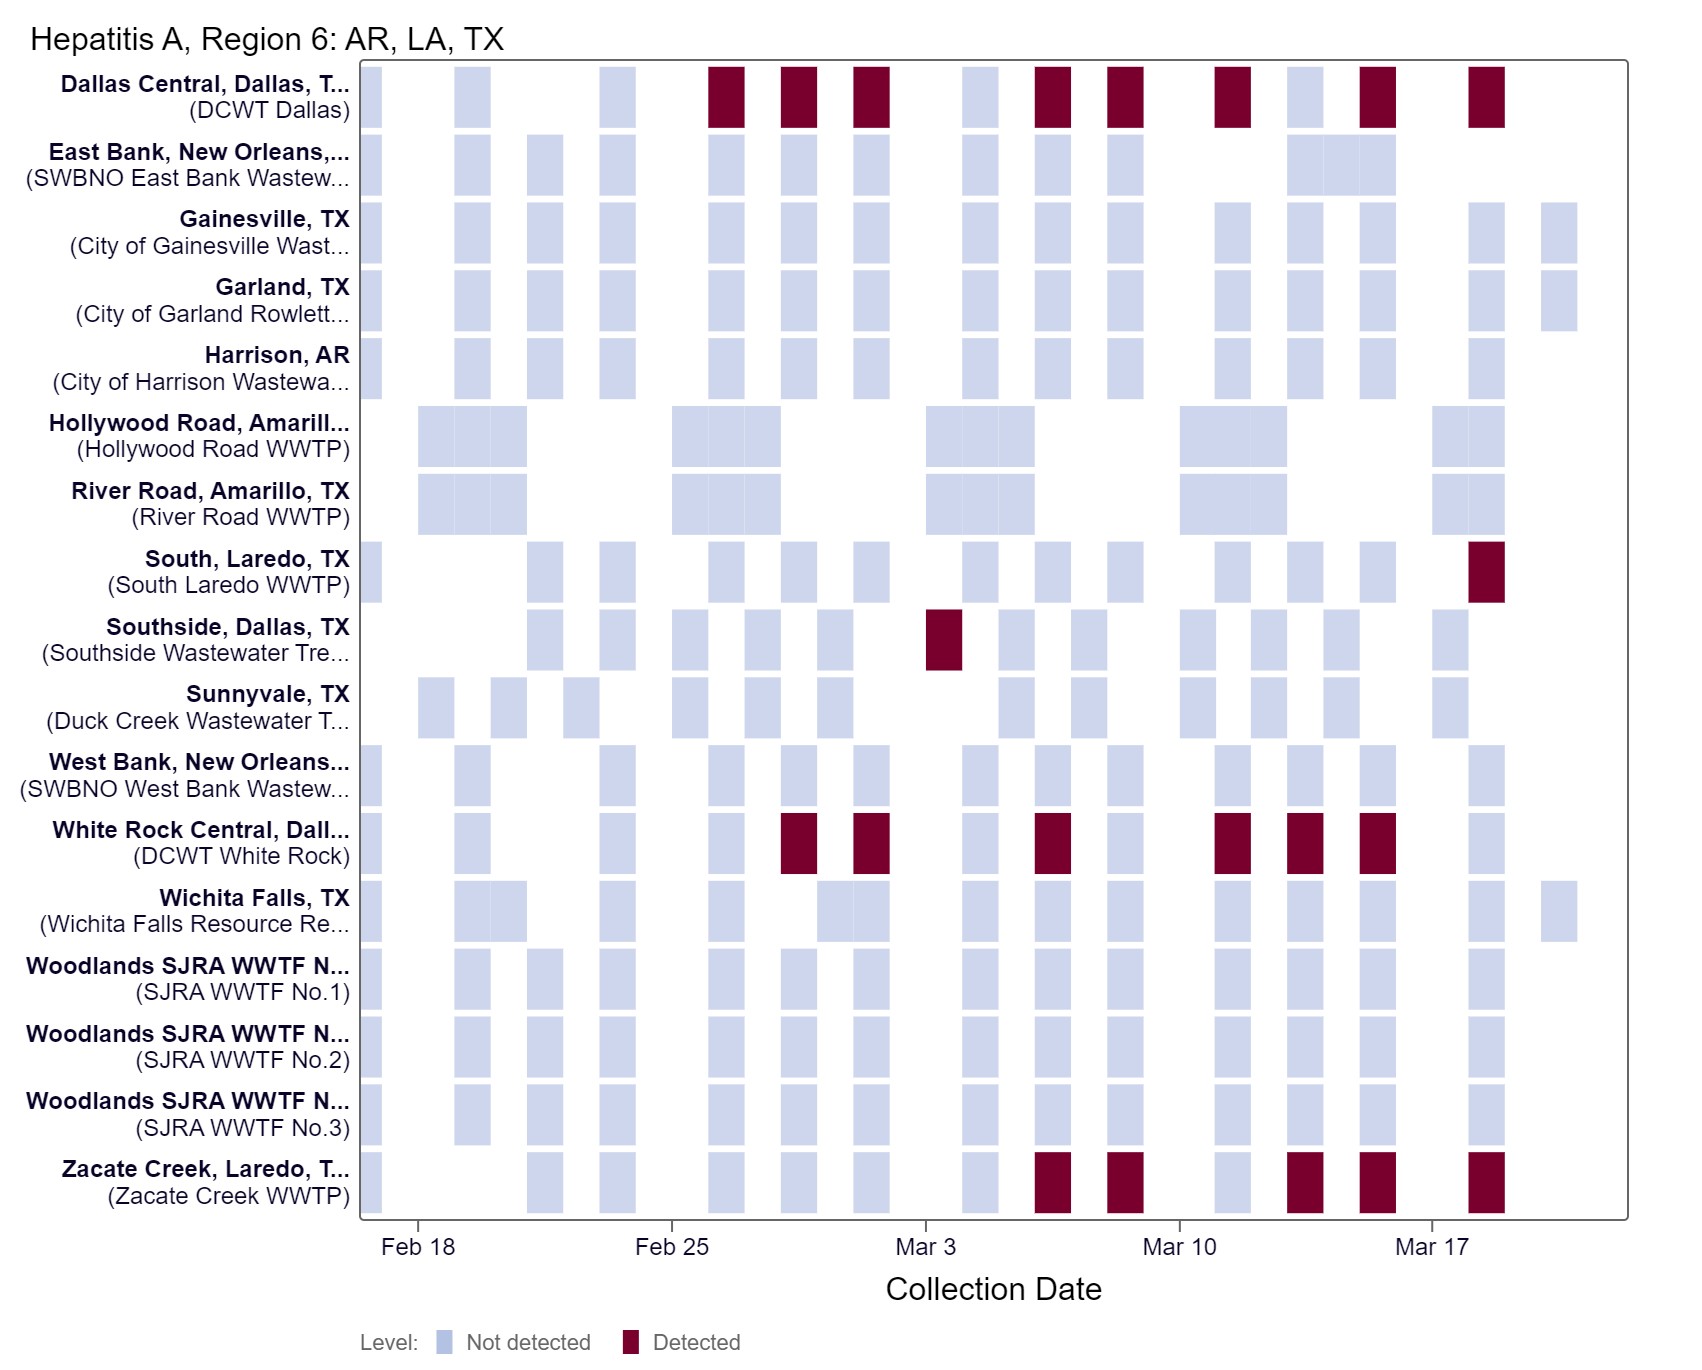
Hepatitis A (Hep A) RNA - We have detected Hep A RNA in 13.9% of samples from all WWSCAN sites over the past three weeks. Nationally, HepA is in "Low" category due to limited detections.
The chart below shows each WWSCAN plant in HHS Region 6 as rows, and the last 21 days as columns (labeled at the bottom axis). White indicates no samples, blue is a non-detect for Hep A RNA and red is a detect for Hep A RNA.
Below are the current HepA wastewater categories for all WWSCAN sites (the category is determined by the frequency of detection):
- 157 are in the LOW Wastewater Category
- 20 are in the MEDIUM Wastewater Category
- 0 are in the HIGH Wastewater Category
- 14 do not have enough data to calculate (Fremont, CA; Newark, CA; Pacifica, CA; Petaluma, CA; South San Diego, CA; Union City, CA; South Miami, FL; Hilo, HI; Bloomington, IN; Muscatine, IA; Louisville, KY; Portland, ME; Gautier, MS; Pascagoula Moss Point, MS; Chester, PA)
WWSCAN protocols and methods in peer reviewed publications
Protocols (Pre-analytical methods and SARS-CoV-2 analytical methods including controls):
- High Throughput RNA Extraction and PCR Inhibitor Removal of Settled Solids for Wastewater Surveillance of SARS-CoV-2 RNA
- High Throughput pre-analytical processing of wastewater settled solids for SARS-CoV-2 RNA analyses
- Quantification of SARS-CoV-2 variant mutations (HV69-70, E484K/N501Y, del156-157/R158G, del143-145, LPPA24S, S:477-505, and ORF1a Del 141-143) in settled solids using digital RT-PCR
- High Throughput SARS-COV-2, PMMoV, and BCoV quantification in settled solids using digital RT-PCR
Pre-prints and peer-reviewed publications provided WWSCAN methods:
- SARS-CoV-2
- Influenza, Human metapneumovirus, Respiratory syncytial virus, Human parainfluenza
- Mpox
- Norovirus GII
- Adenovirus group F, Rotavirus, Candida auris, Hepatitis A
- Enterovirus D68
To see find a complete list of peer-reviewed publications utilizing the WWSCAN data here.
Join us at the next WWSCAN Stakeholder call on April 12th, 2024
If you have questions about the website or anything else, please email: wwscan_stanford_emory@lists.stanford.edu