SCAN Weekly Update - 5/22/24
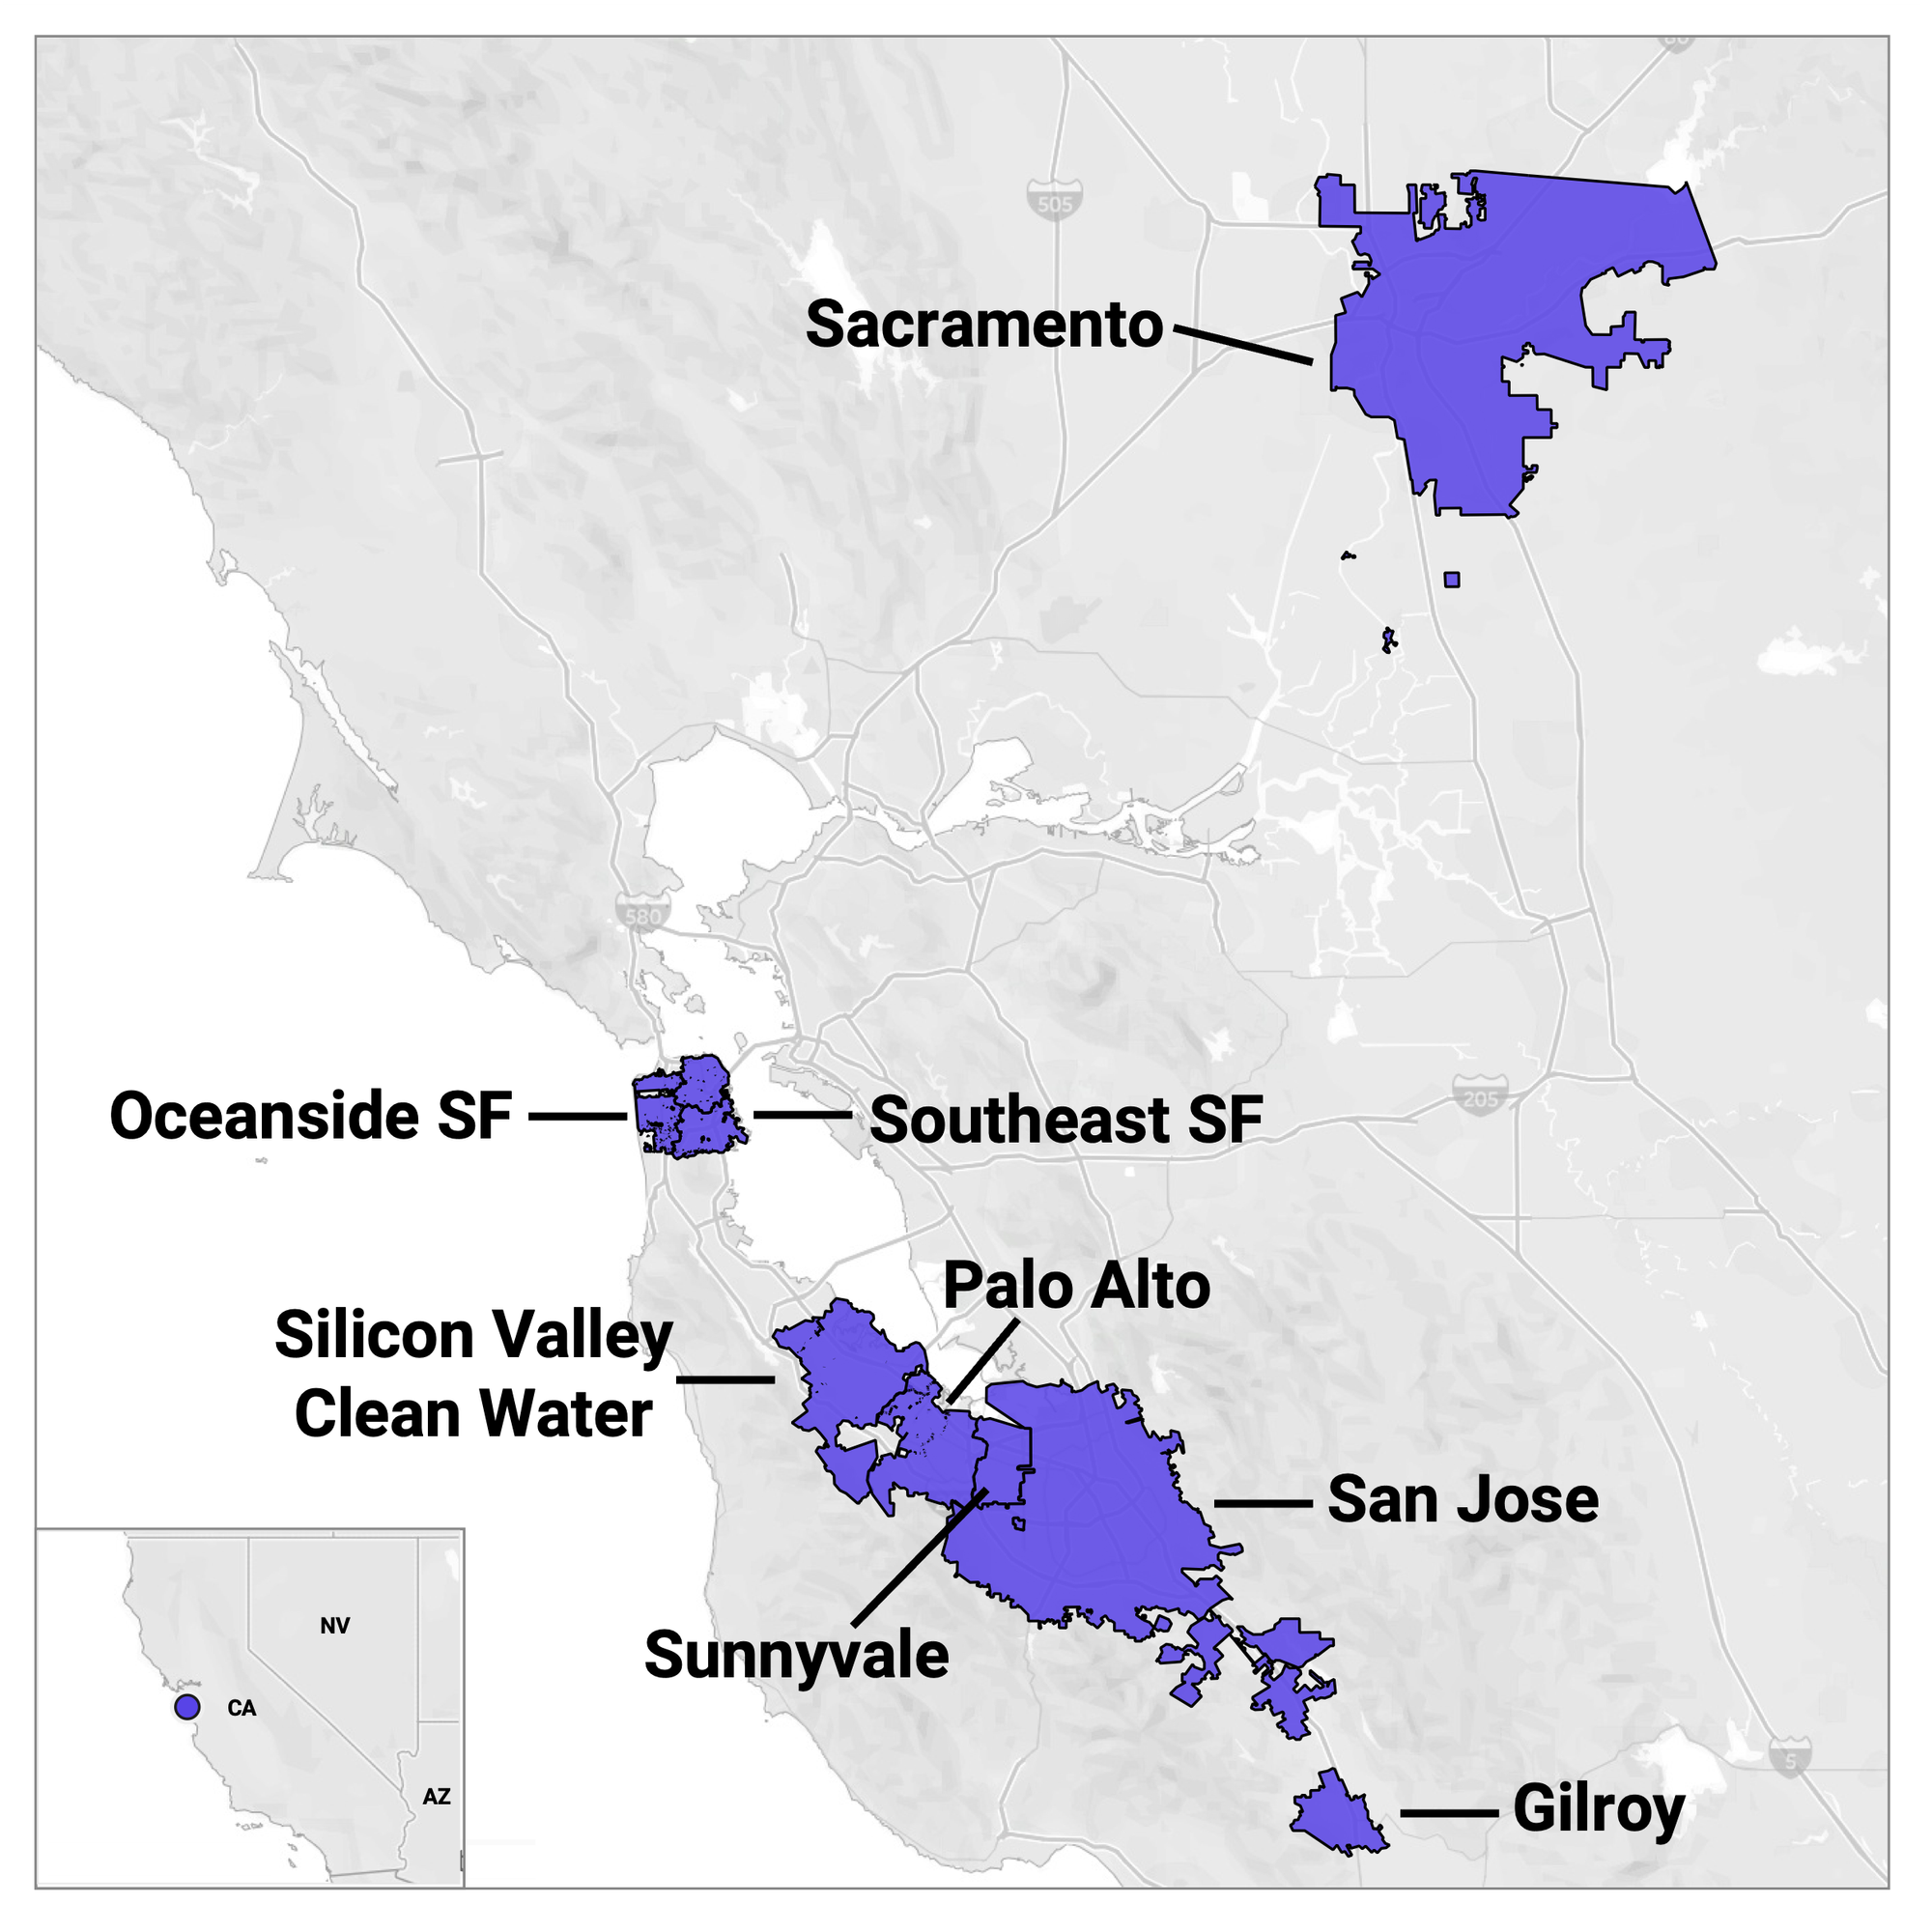
This blog post describes data collected at 8 wastewater treatment plants in the Greater Bay Area of San Francisco, CA, including Sacramento, that are partners in the SCAN project which began in late 2020. The SCAN plants are a subset of the WastewaterSCAN plants.
All samples picked up by the couriers as of 5/20/24 have been processed and their data are on the site: data.wastewaterscan.org. Please email Amanda at albidwel@stanford.edu if you identify any bugs on the site.
For site level summaries of the SCAN plants with current Wastewater Categories and concentration plots, see the following links:
We are excited to share a new document that provides an overview of the program’s peer-reviewed scientific literature, organized by topics and themes. Click here to access the WastewaterSCAN published body of work.
COVID-19
SARS-CoV-2 concentration in wastewater and sequencing for variants
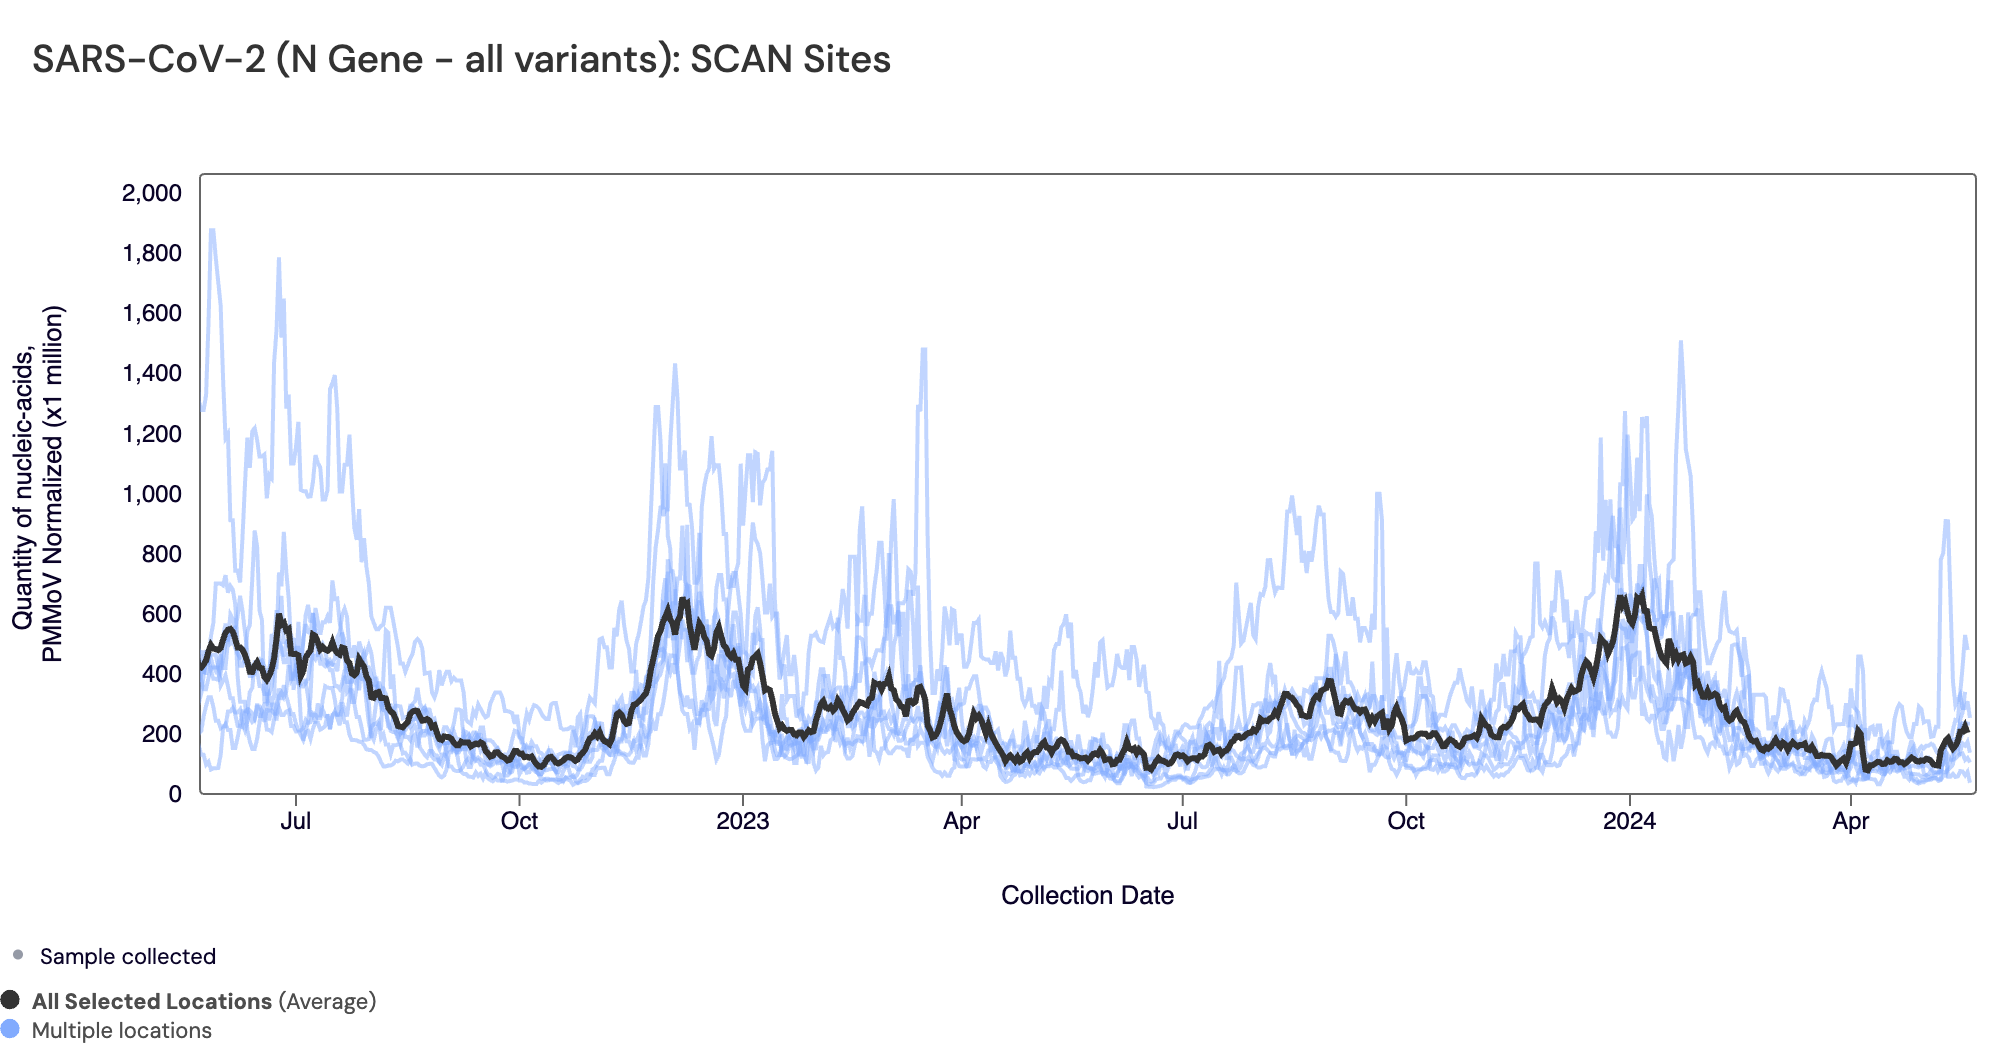
SARS-CoV-2 N gene concentrations are between 8,744 to 1,655,00 copies/g over the last 21 days. Below are the current SARS-CoV-2 wastewater categories for the SCAN sites (recall the category is determined by both the trend and the level):
- Gilroy and Sacramento are in the LOW Wastewater Category for SARS-CoV-2
- Oceanside SF is in the MEDIUM Wastewater Category for SARS-CoV-2
- Palo Alto, San Jose, Southeast SF, Sunnyvale and SVCW are in the HIGH Wastewater Category for SARS-CoV-2
Below are all the data from all the SCAN plants for the last two years. You can access the graph here. The population weighted average across the SCAN plants is shown in black. The population weighted average shows a recent increase compared to the lower concentrations we measured in early spring 2024.
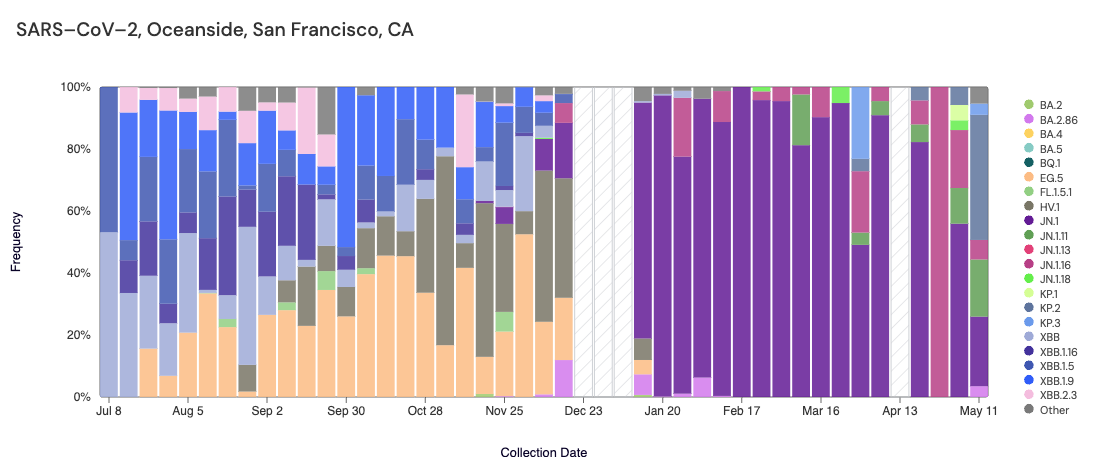
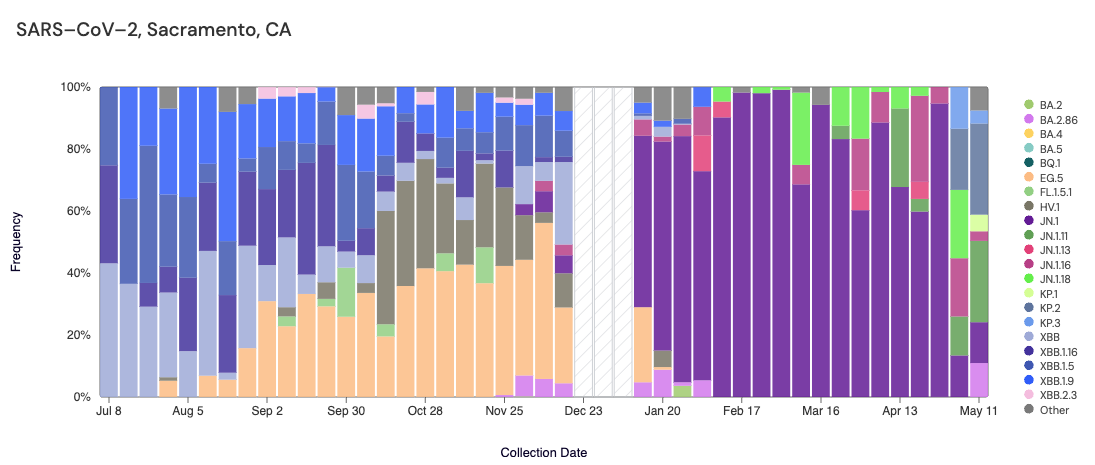
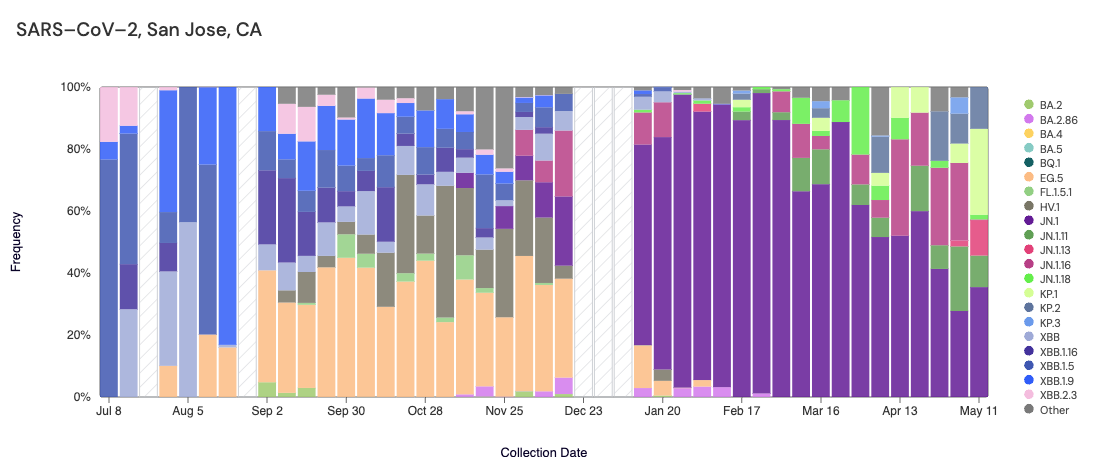
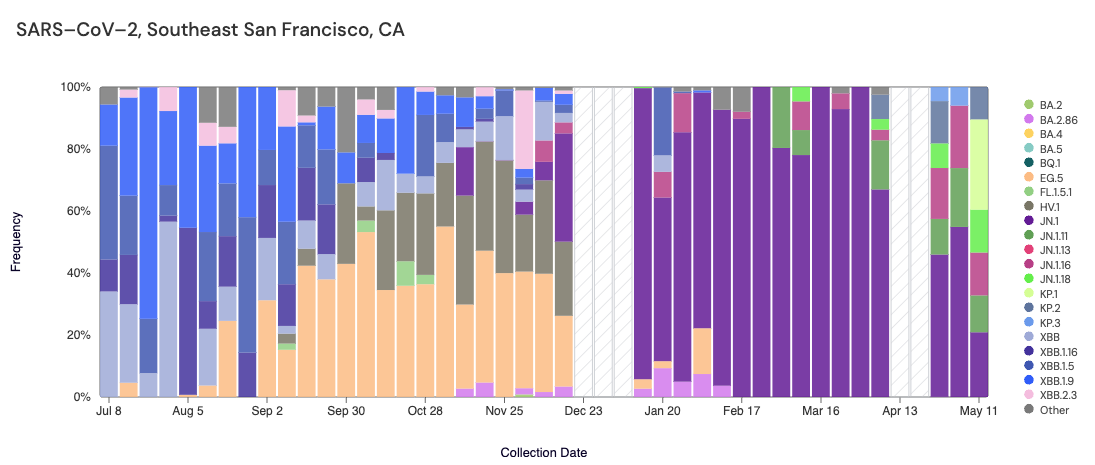
Below are plots from Oceanside SF, Sacramento, San Jose, and Southeast SF showing the relative proportions of different variants inferred from sequencing the entire genome of SARS-CoV-2. White and grey striped bars indicate no data is currently available for that week. In the most recent samples, we are starting to see greater portions of KP.1 (light green) and KP.2 (slate blue).Note that the sequencing data are always from samples taken between 1-2 weeks ago (in this case, May 11, 2024).
Other Respiratory Targets
Influenza A & B, RSV, HMPV, EV-D68 and Parainfluenza
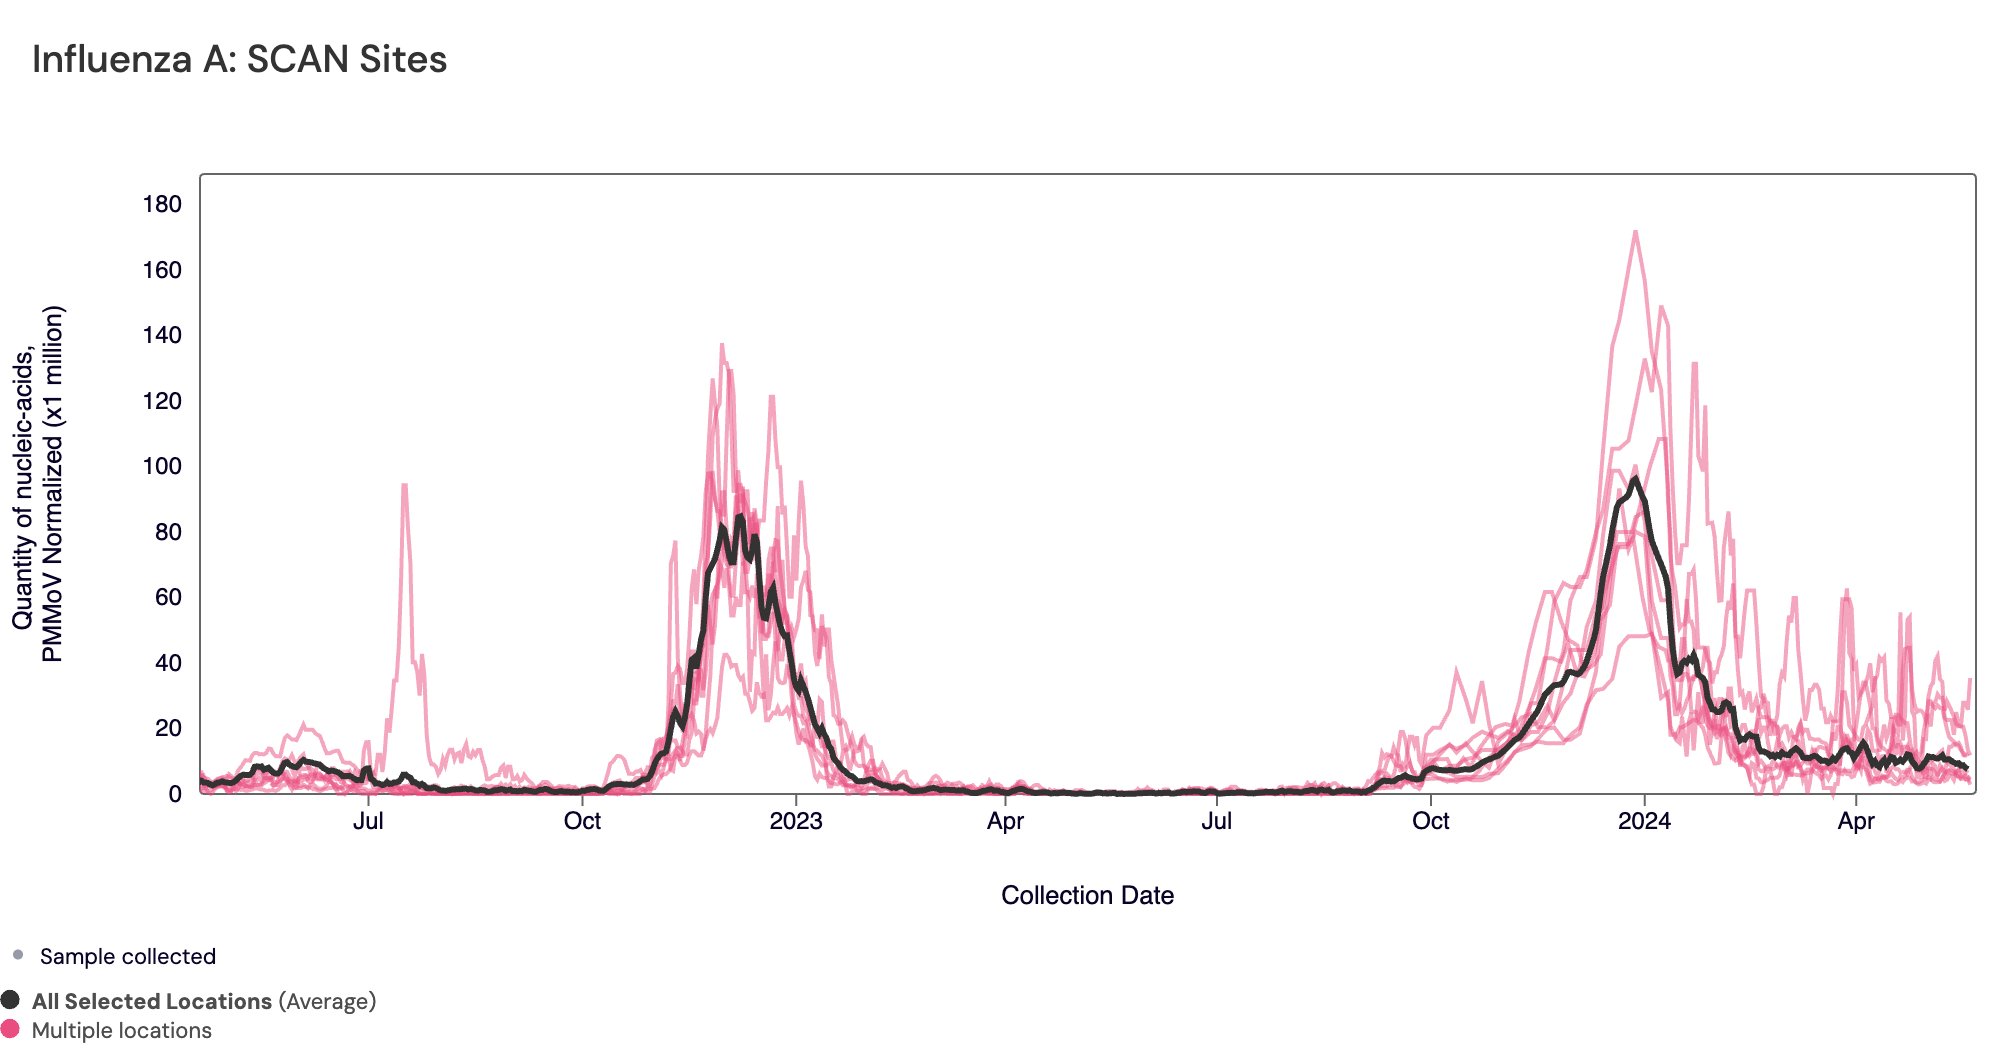
Influenza A (IAV) RNA: Below are all the IAV data from all the SCAN plants for the last two years. You can access the graph here. The population weighted average across the SCAN plants is shown in black. All SCAN sites are still in onset for IAV are are continuing to come down from the peak seen at the end of 2023/beginning of 2024 (but we are continuing to see positive detections for IAV across all sites).
Below are the current IVA wastewater categories for the SCAN sites (recall the category is determined by both the trend and the level):
- Palo Alto, Oceanside SF, Southeast SF, Sacramento, San Jose, SVCW and Sunnyvale are in the MEDIUM Wastewater Category for IAV
- Gilroy is in the HIGH Wastewater Category for IAV
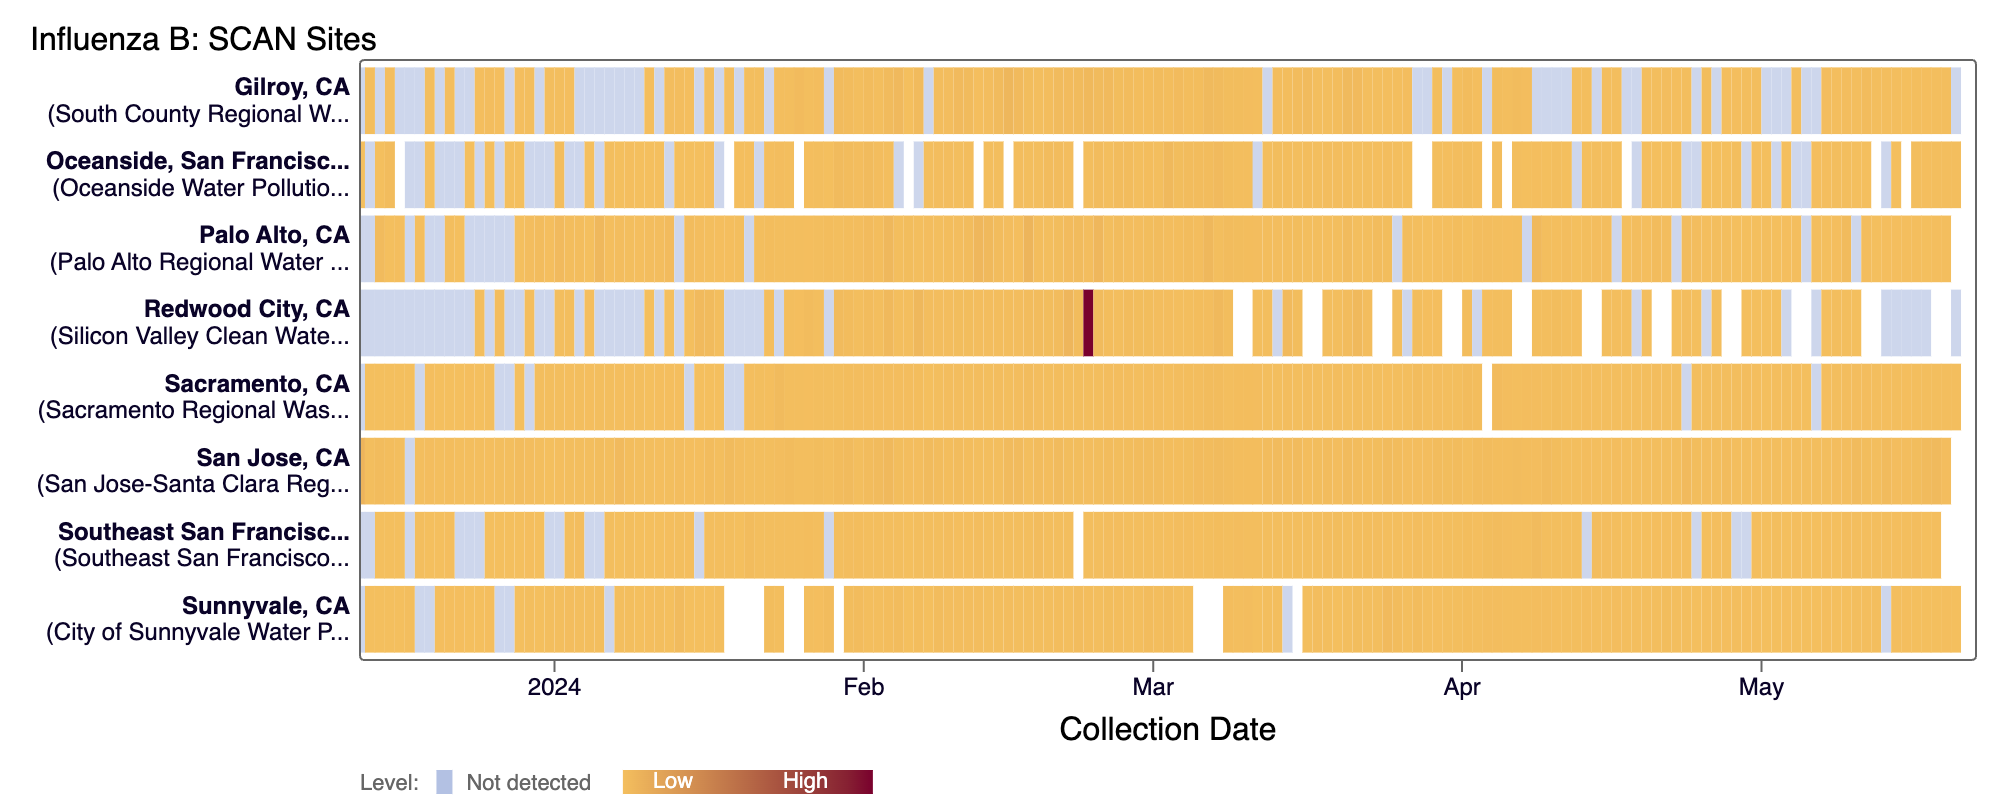
Influenza B (IBV) RNA has been detected in most samples collected from SCAN sites in the last 21 days. The heat map below shows all the SCAN sites as a row and each date as a column for data from October 2023-present. The color blue means the sample was non-detect for IBV RNA and the colors get darker with higher concentrations. White indicates no sample was collected. Here is the link to the heat map chart.
Below are the current IBV wastewater categories for the SCAN sites (recall the category is determined by both the trend and the level):
- Oceanside and SVCW are in the LOW Wastewater Category for IBV
- Palo Alto, Sacramento, and Sunnyvale are in the MEDIUM Wastewater Category for IBV
- Gilroy, Southeast SF and San Jose are in the HIGH Wastewater Category for IBV
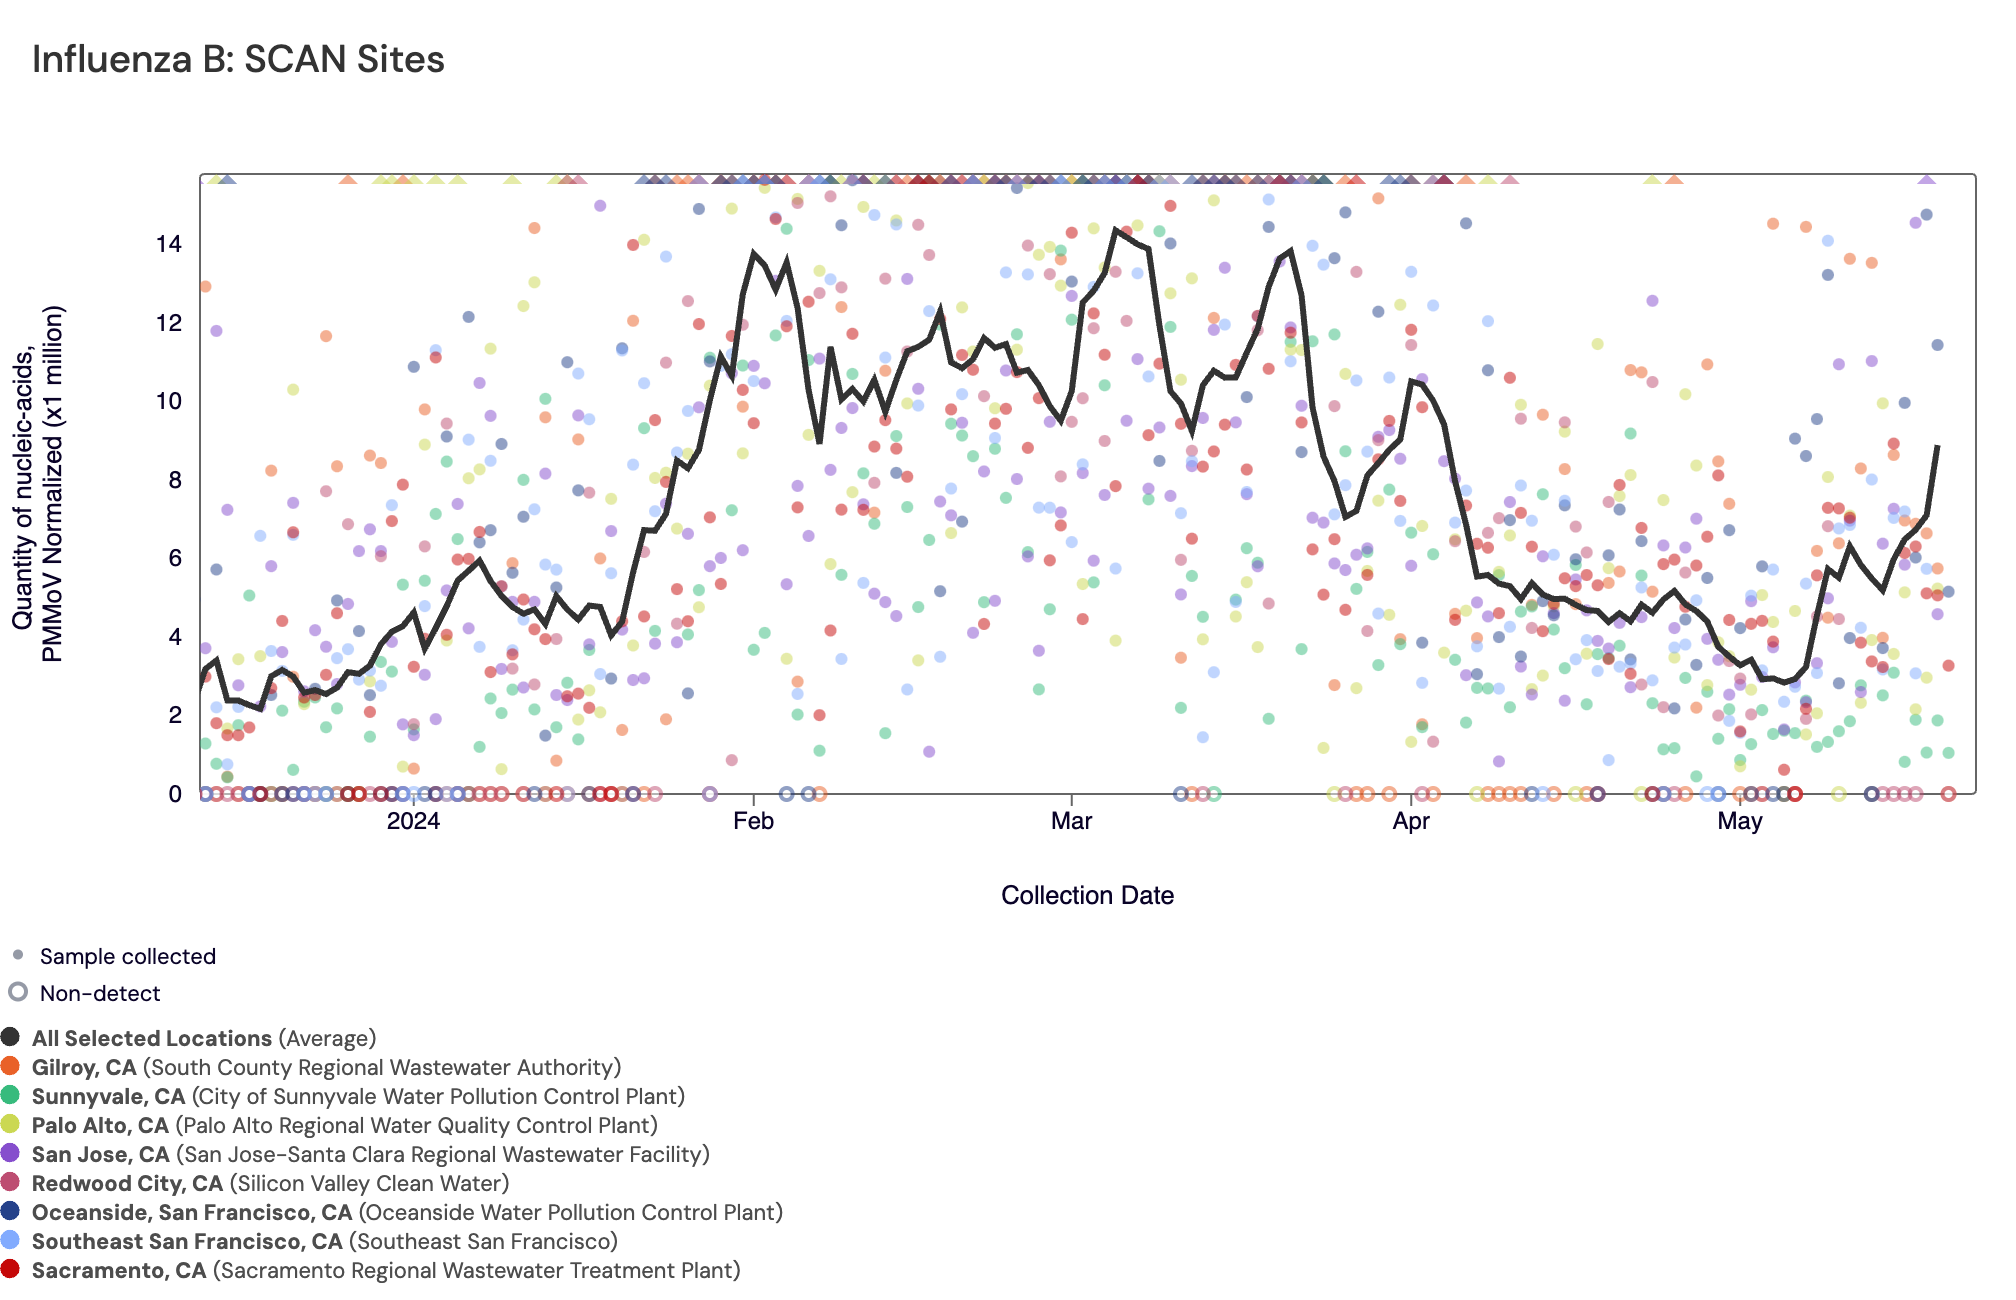
In the chart below, the population weighted average line across all the SCAN plants is shown in black and raw IBV data for the SCAN sites are shown as points. We've seen an uptick in IBV concentrations across most sites since the beginning of May 2024.
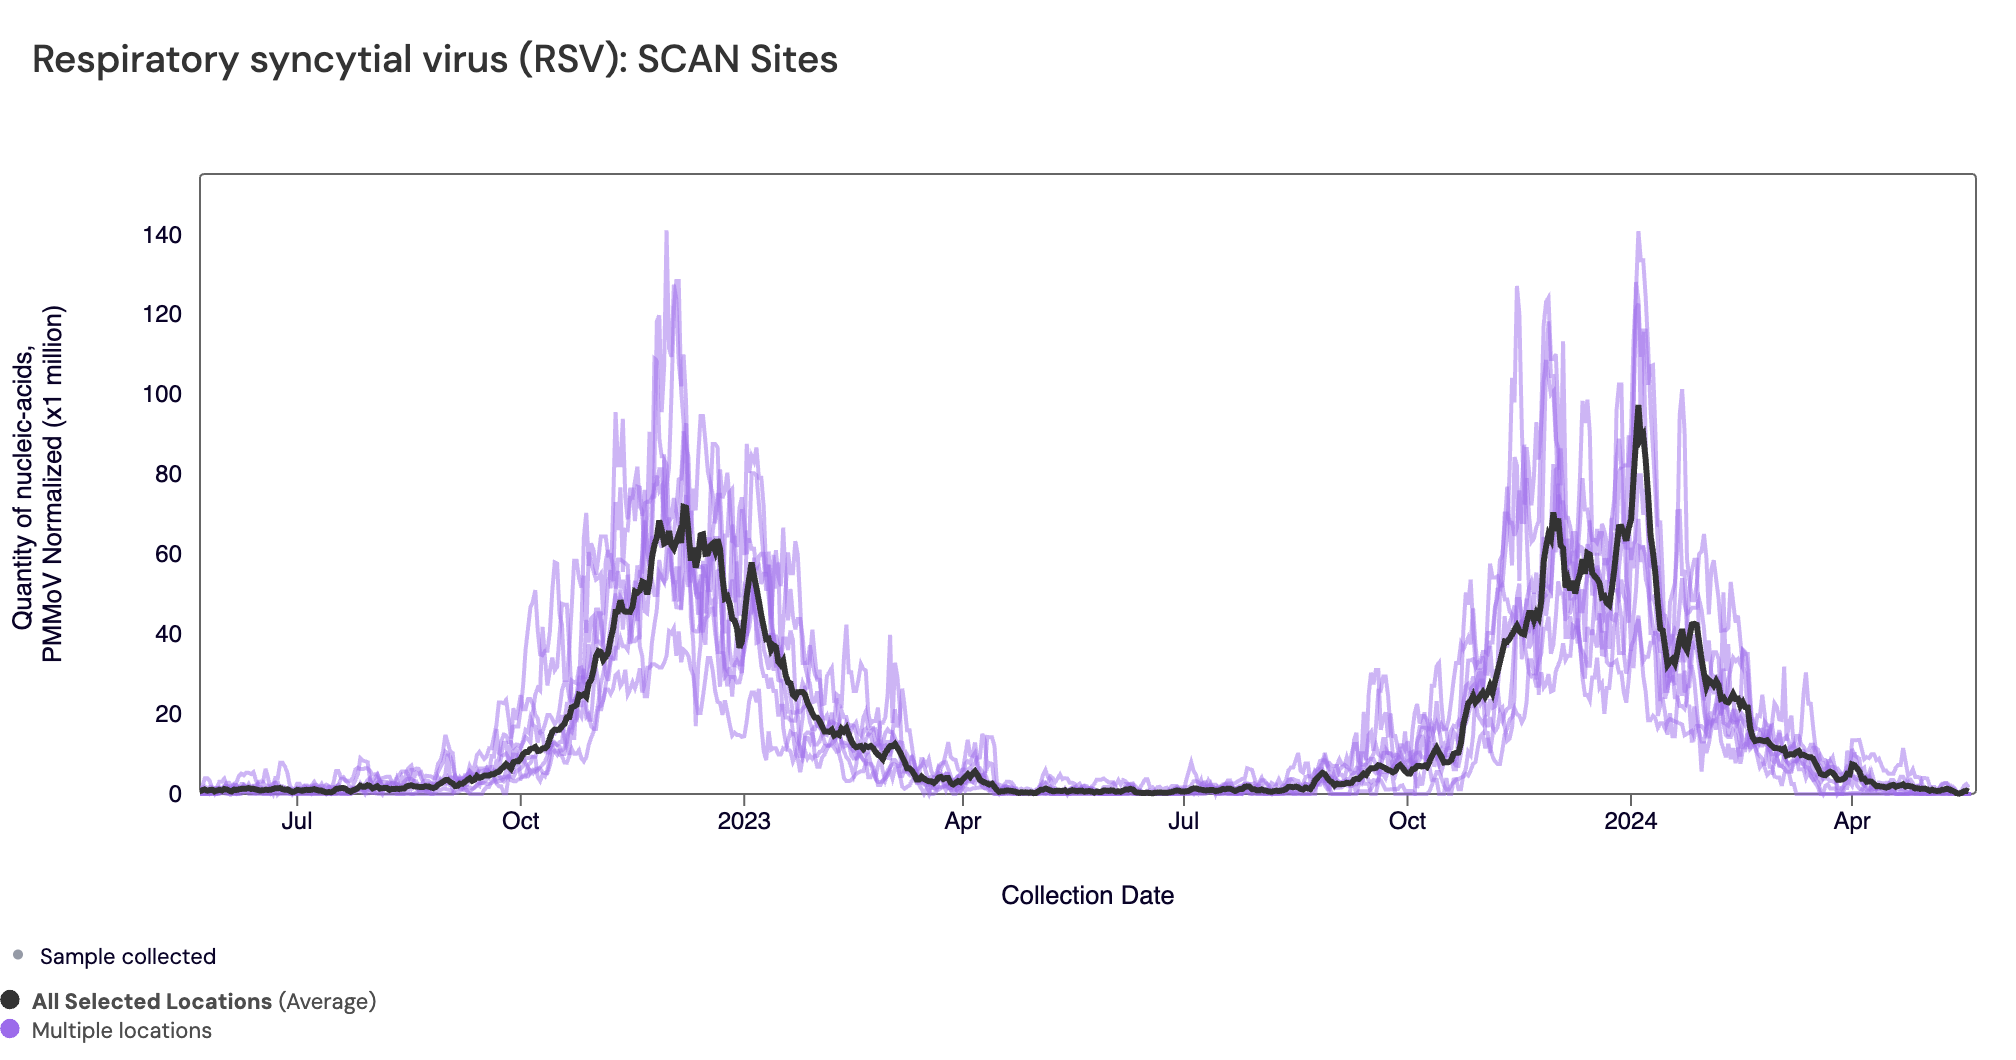
RSV RNA concentrations have decreased to low levels. In the chart below (representing data from the past 2 years), the population weighted average line across all the SCAN sites is shown in black, and you can see the current concentrations relative to the peak RSV levels from last year. The link to the chart below is here if you would like to interact with it.
Below are the current RSV wastewater categories for the SCAN sites (recall the category is determined by both the trend and the level):
- Gilroy, Palo Alto, Oceanside SF, Sacramento, San Jose, Southeast Sunnyvale, and SVCW are in the LOW Wastewater Category due to no longer being in in seasonal onset
HMPV (Human metapneumovirus) RNA concentrations remain elevated across all SCAN sites (expect Gilroy). Below are the current wastewater categories for the SCAN sites (recall the category is determined by both the trend and the level):
- Gilroy is in the LOW Wastewater Category for HMPV
- SVCW is in the MEDIUM Wastewater Category for HMPV
- Palo Alto, Oceanside SF, Sacramento, San Jose, Southeast SF, and Sunnyvale are in the HIGH Wastewater Category for HMPV
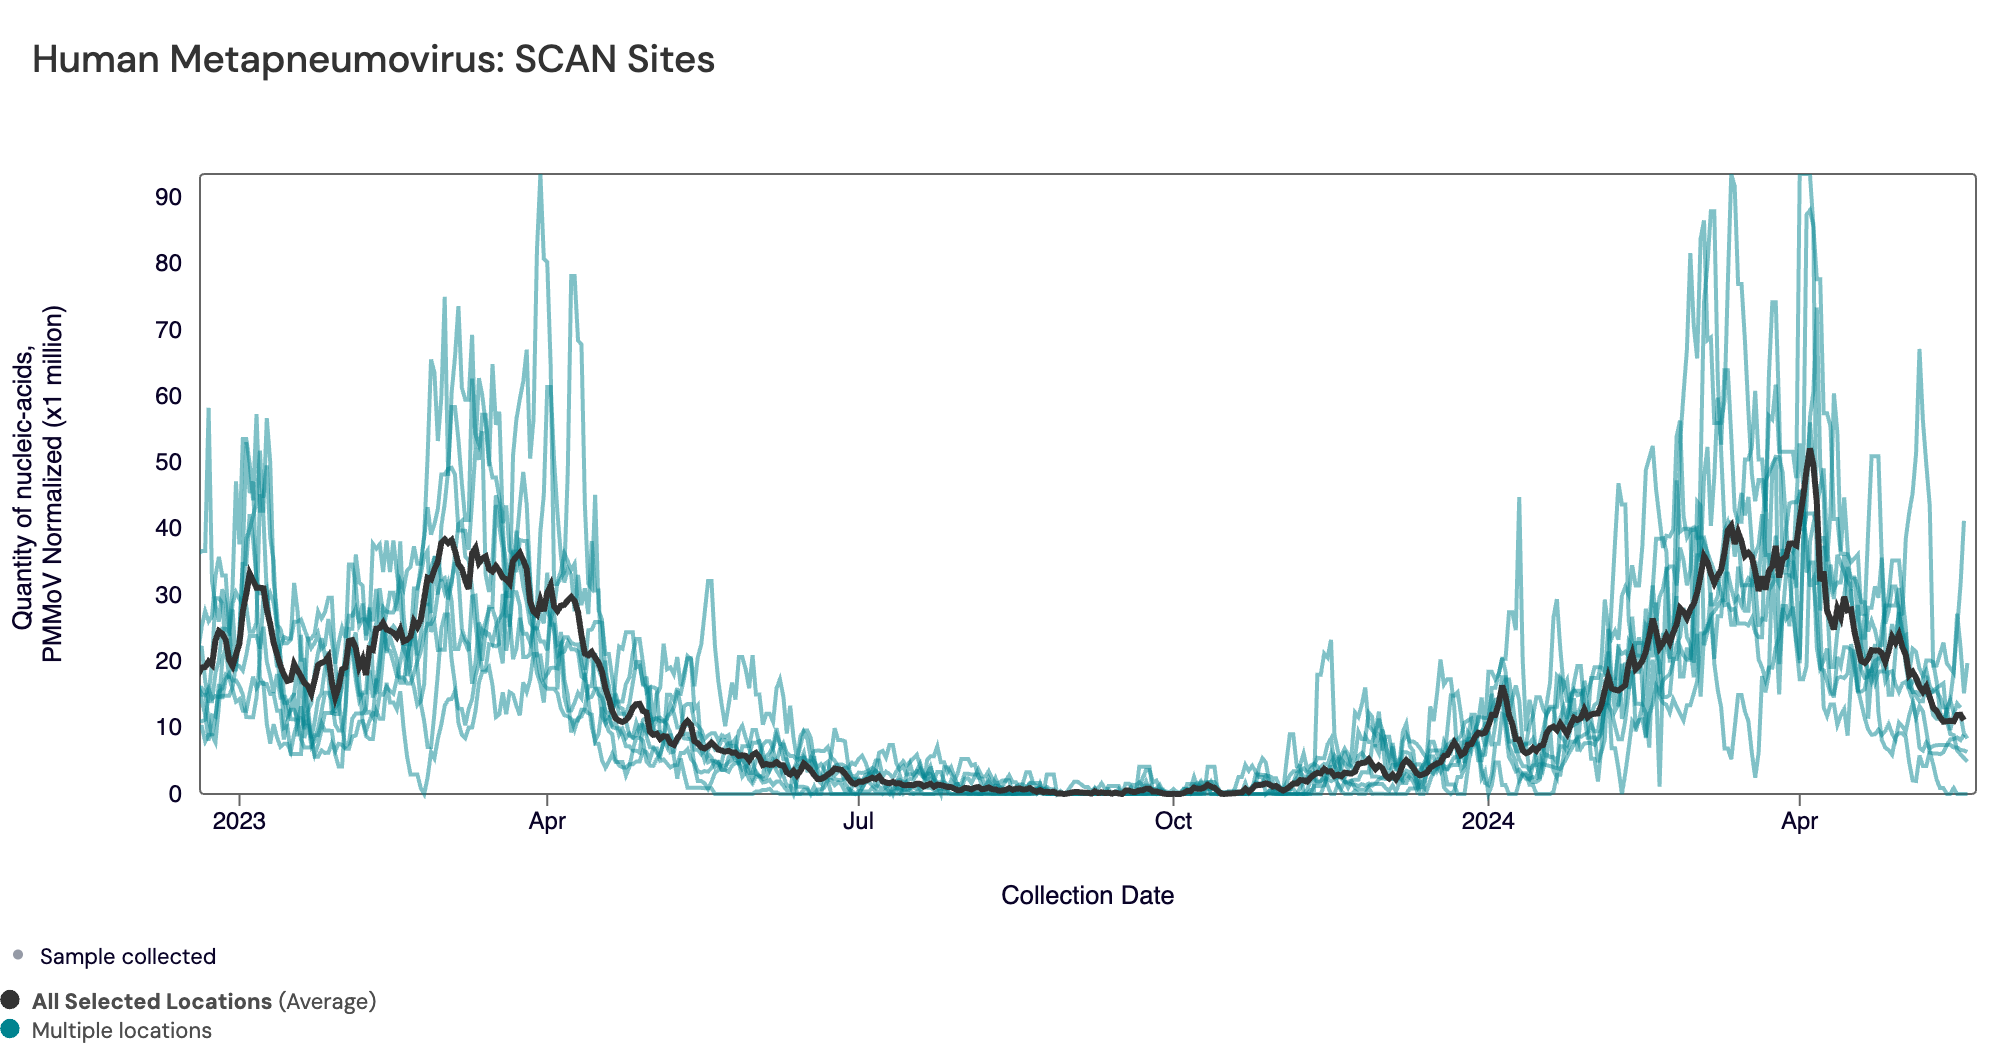
In the chart below, the population weighted average line across all the SCAN plants is shown in black (link here to this chart if you want to interact with it) since December 2022. Evident in the chart is the recent decrease in HMPV concentrations across all SCAN sites, but all sites are still experiencing high concentrations of HMPV.
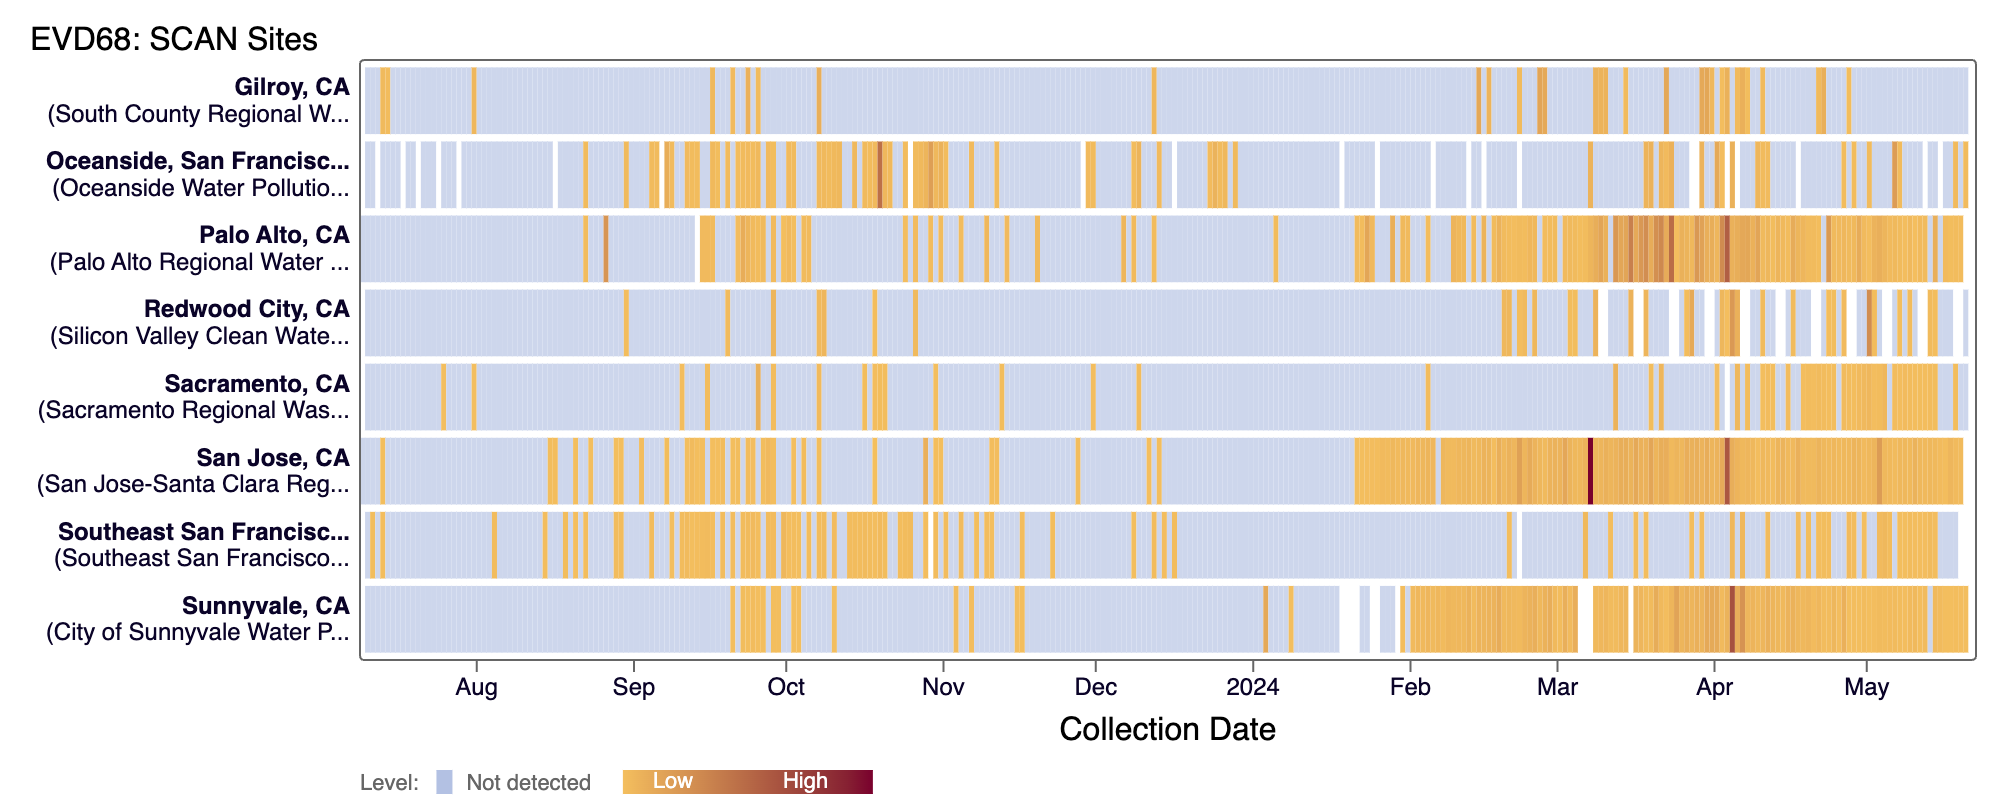
EV-D68 RNA was detected at all SCAN sites from samples collected in the last 10 days (expect Gilroy). Below are the current wastewater categories for the SCAN sites (the category is determined by the frequency of detection):
- Gilroy, Oceanside SF, and SVCW are in the LOW Wastewater Category for EV-D68
- Palo Alto, Sacramento, San Jose, Southeast SF, and Sunnyvale are in the MEDIUM Wastewater Category for EV-D68
The heat map below shows all the SCAN sites as a row, and each date as a column since monitoring began in July 2023. The color blue means the sample was non-detect for EV-D68 RNA and the colors get darker with higher concentrations. White indicates no sample was collected. You can access the chart here.
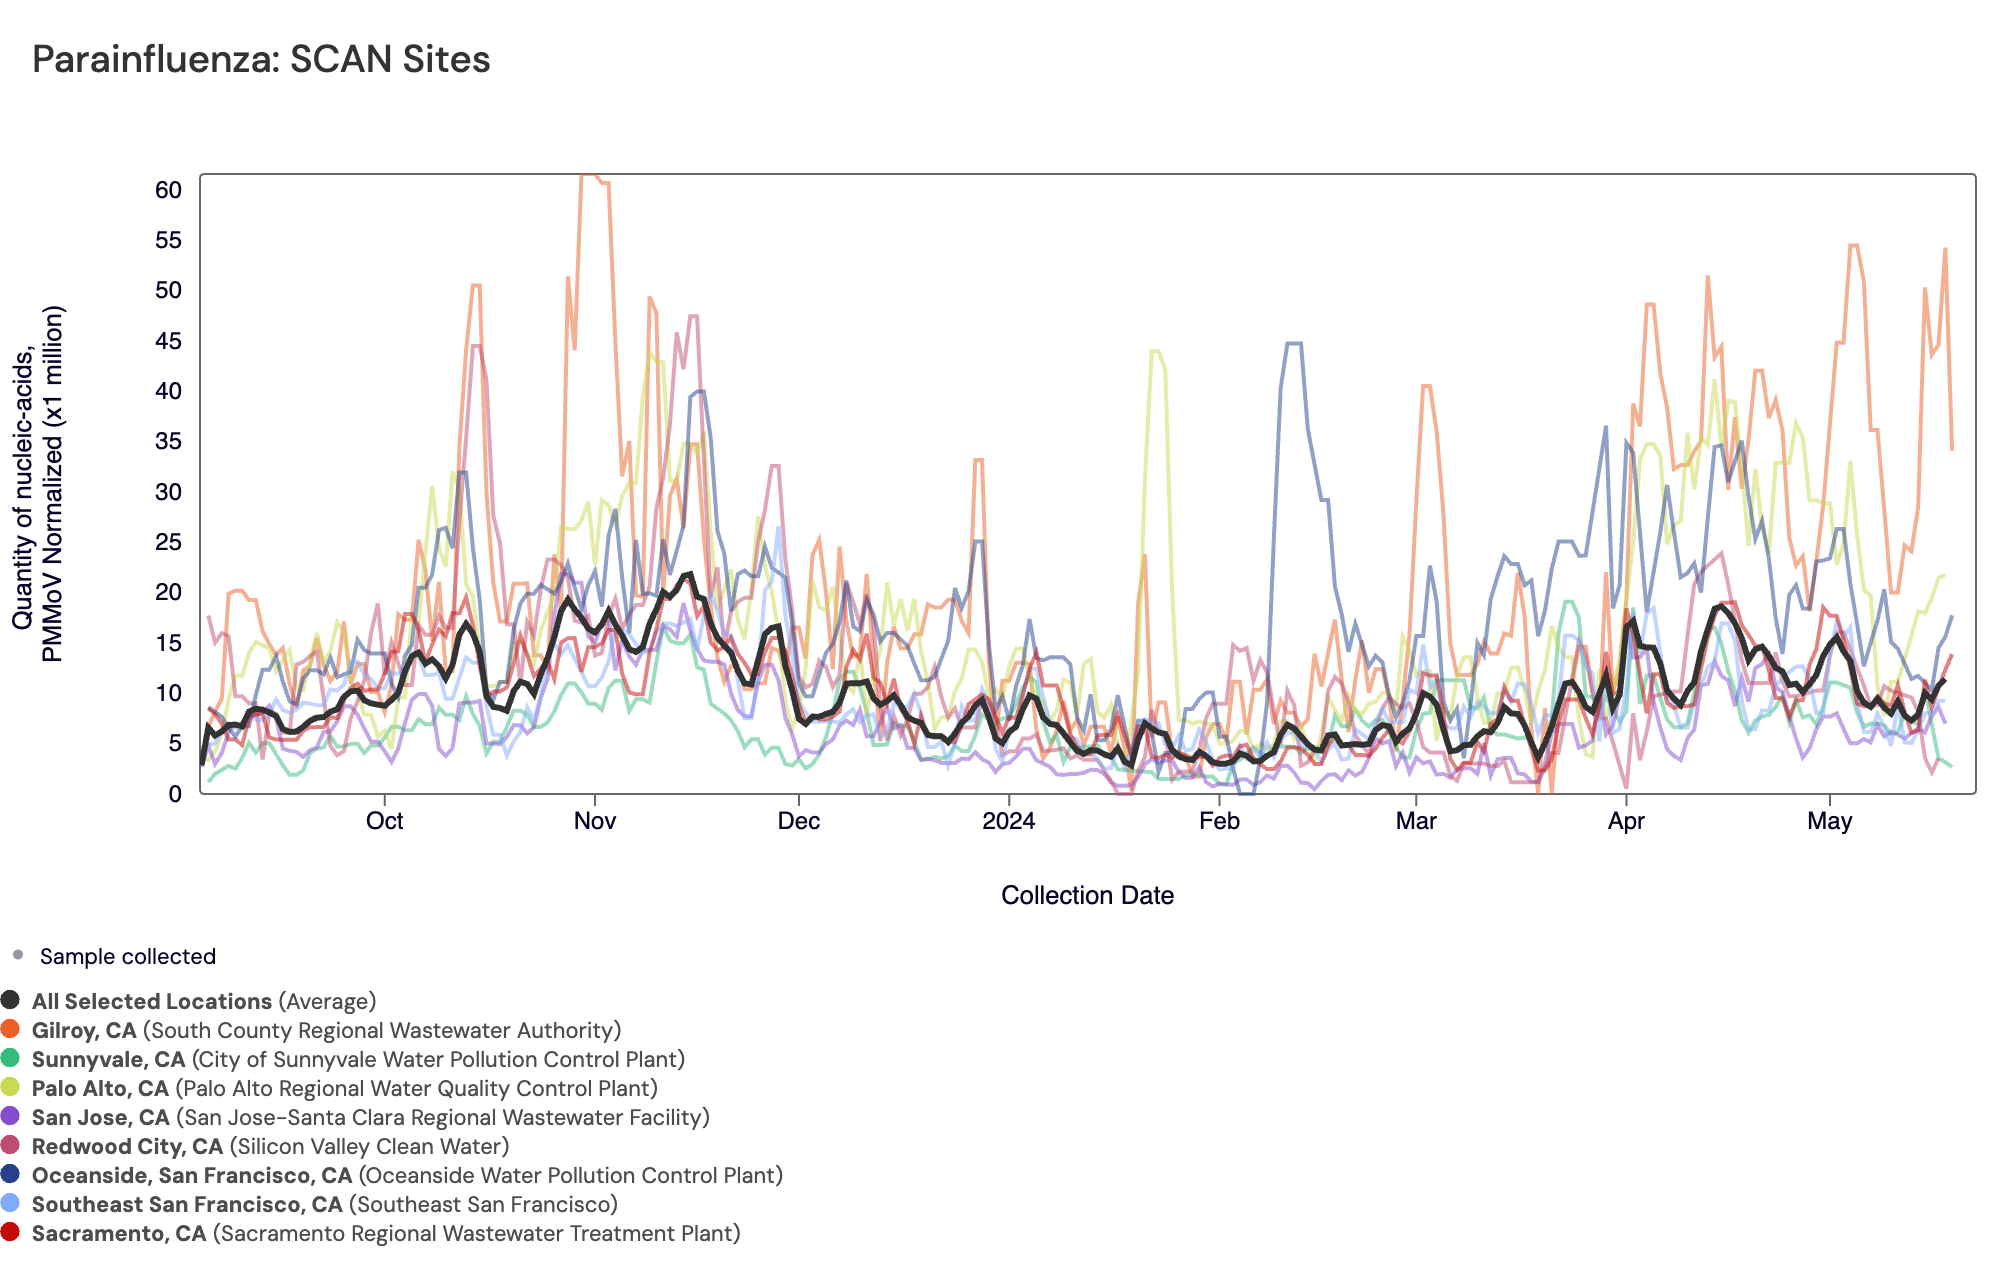
Parainfluenza RNA has consistently been detected in most samples collected from SCAN sites. The population weighted average across SCAN sites is shown in black. You can access the chart here. As a reminder we are temporarily pausing Parainfluenza RNA measurements while we run the H5 specific influenza assay.
Gastrointestinal Targets
Norovirus GII and Rotavirus
Norovirus GII RNA was commonly detected at all SCAN sites, which is what we are observing across the national WWSCAN sites as well. In the chart below, the population weighted average line across all the SCAN plants is shown in black and raw Norovirus data for the SCAN sites are shown as points. We've seen an uptick in Norovirus concentrations across most sites since early spring and concentrations are on average higher than they were this time last year.
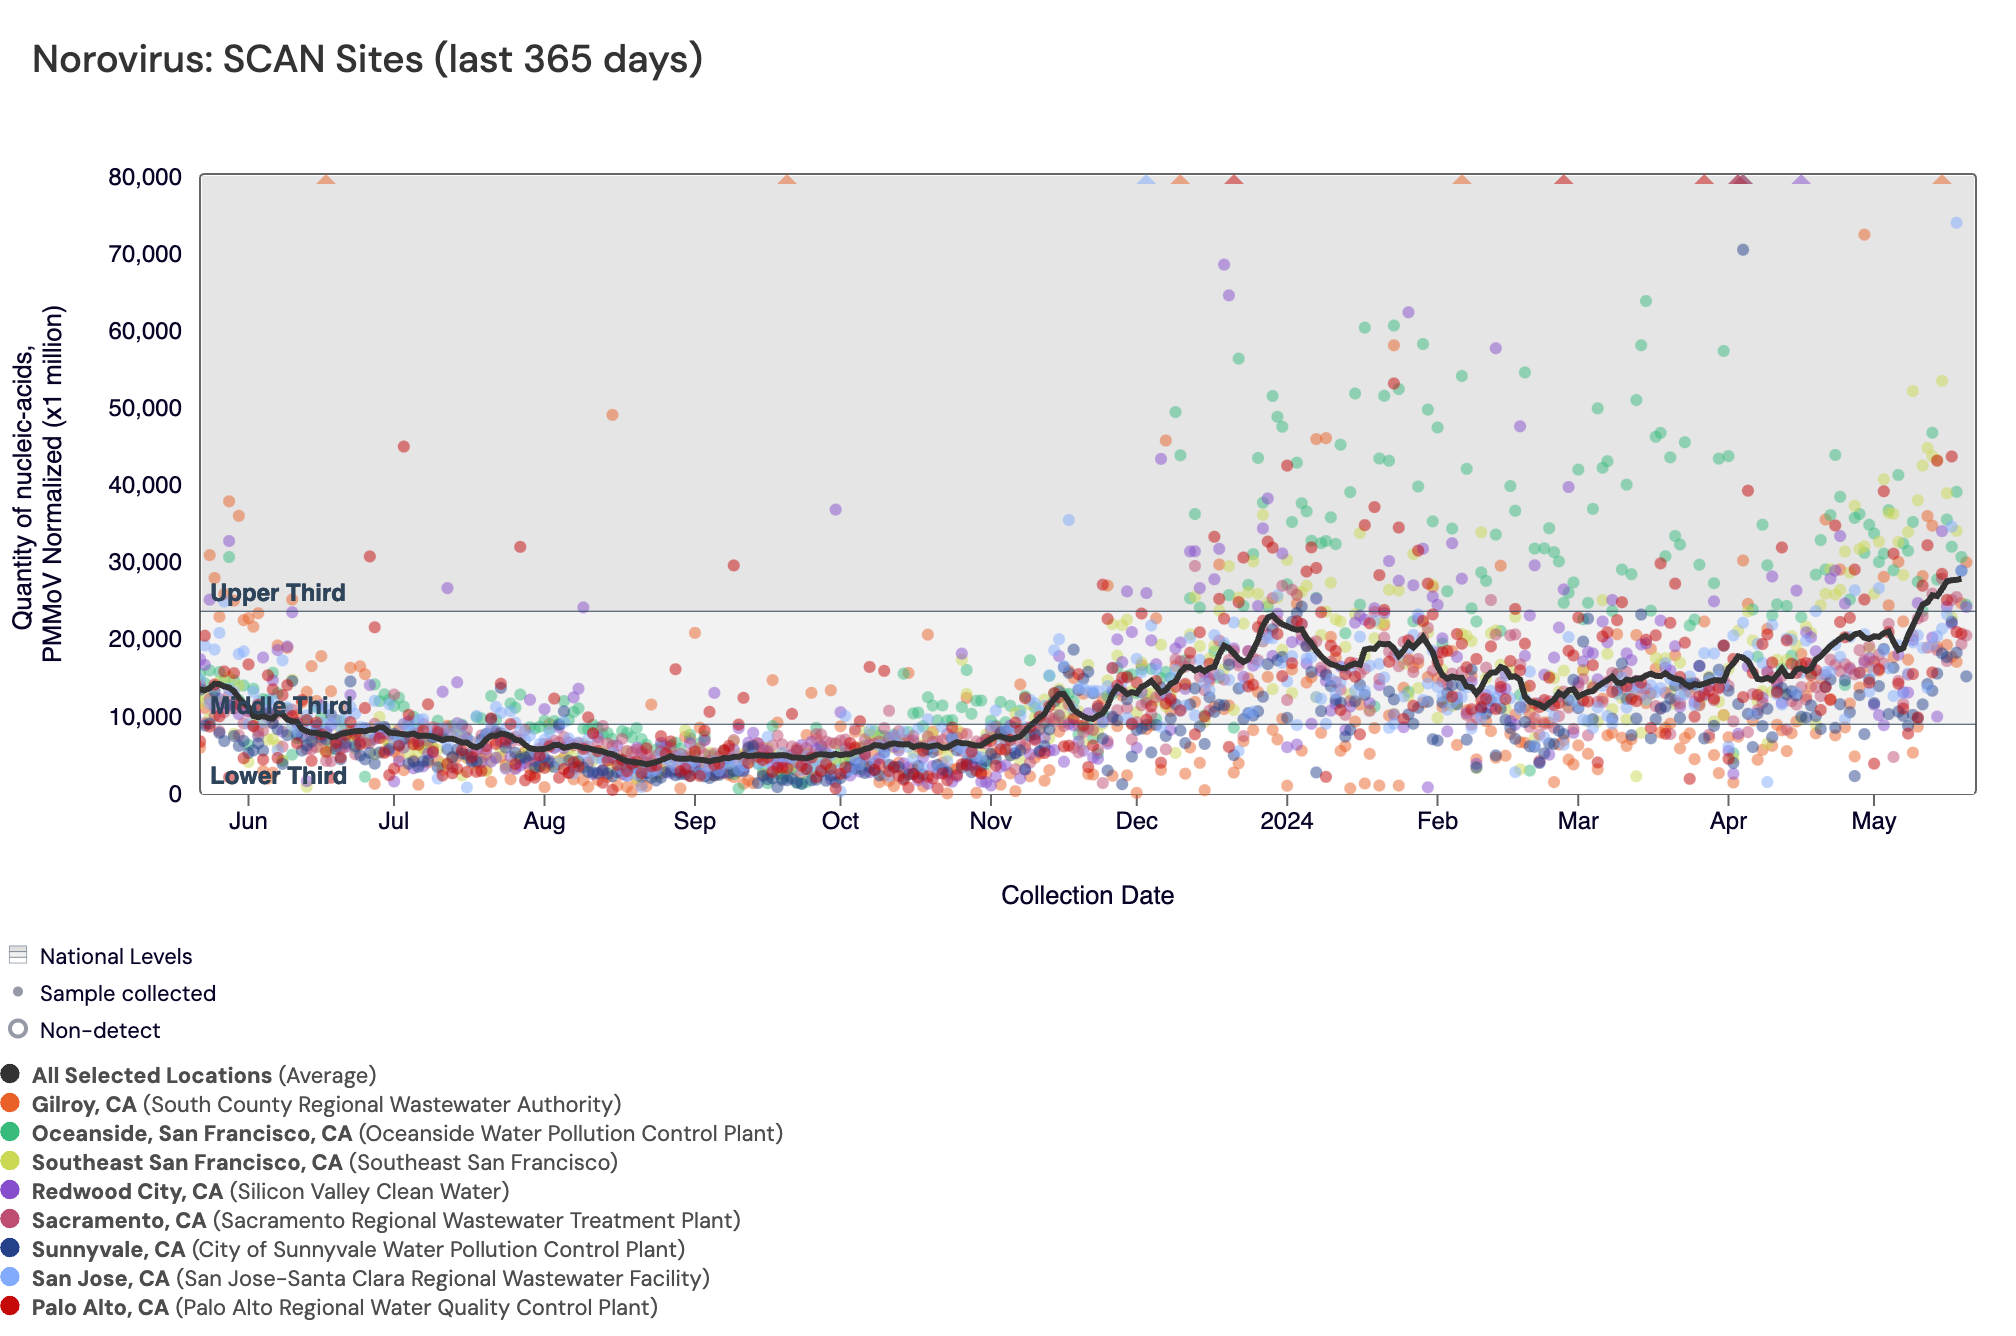
Below are the current Norovirus wastewater categories for the SCAN sites (recall the category is determined by both the trend and the level):
- Palo Alto is in the MEDIUM Wastewater Category for Norovirus
- Gilroy, Oceanside SF, Sacramento, San Jose, Southeast SF, Sunnyvale, and SVCW are in the HIGH Wastewater Category for Norovirus
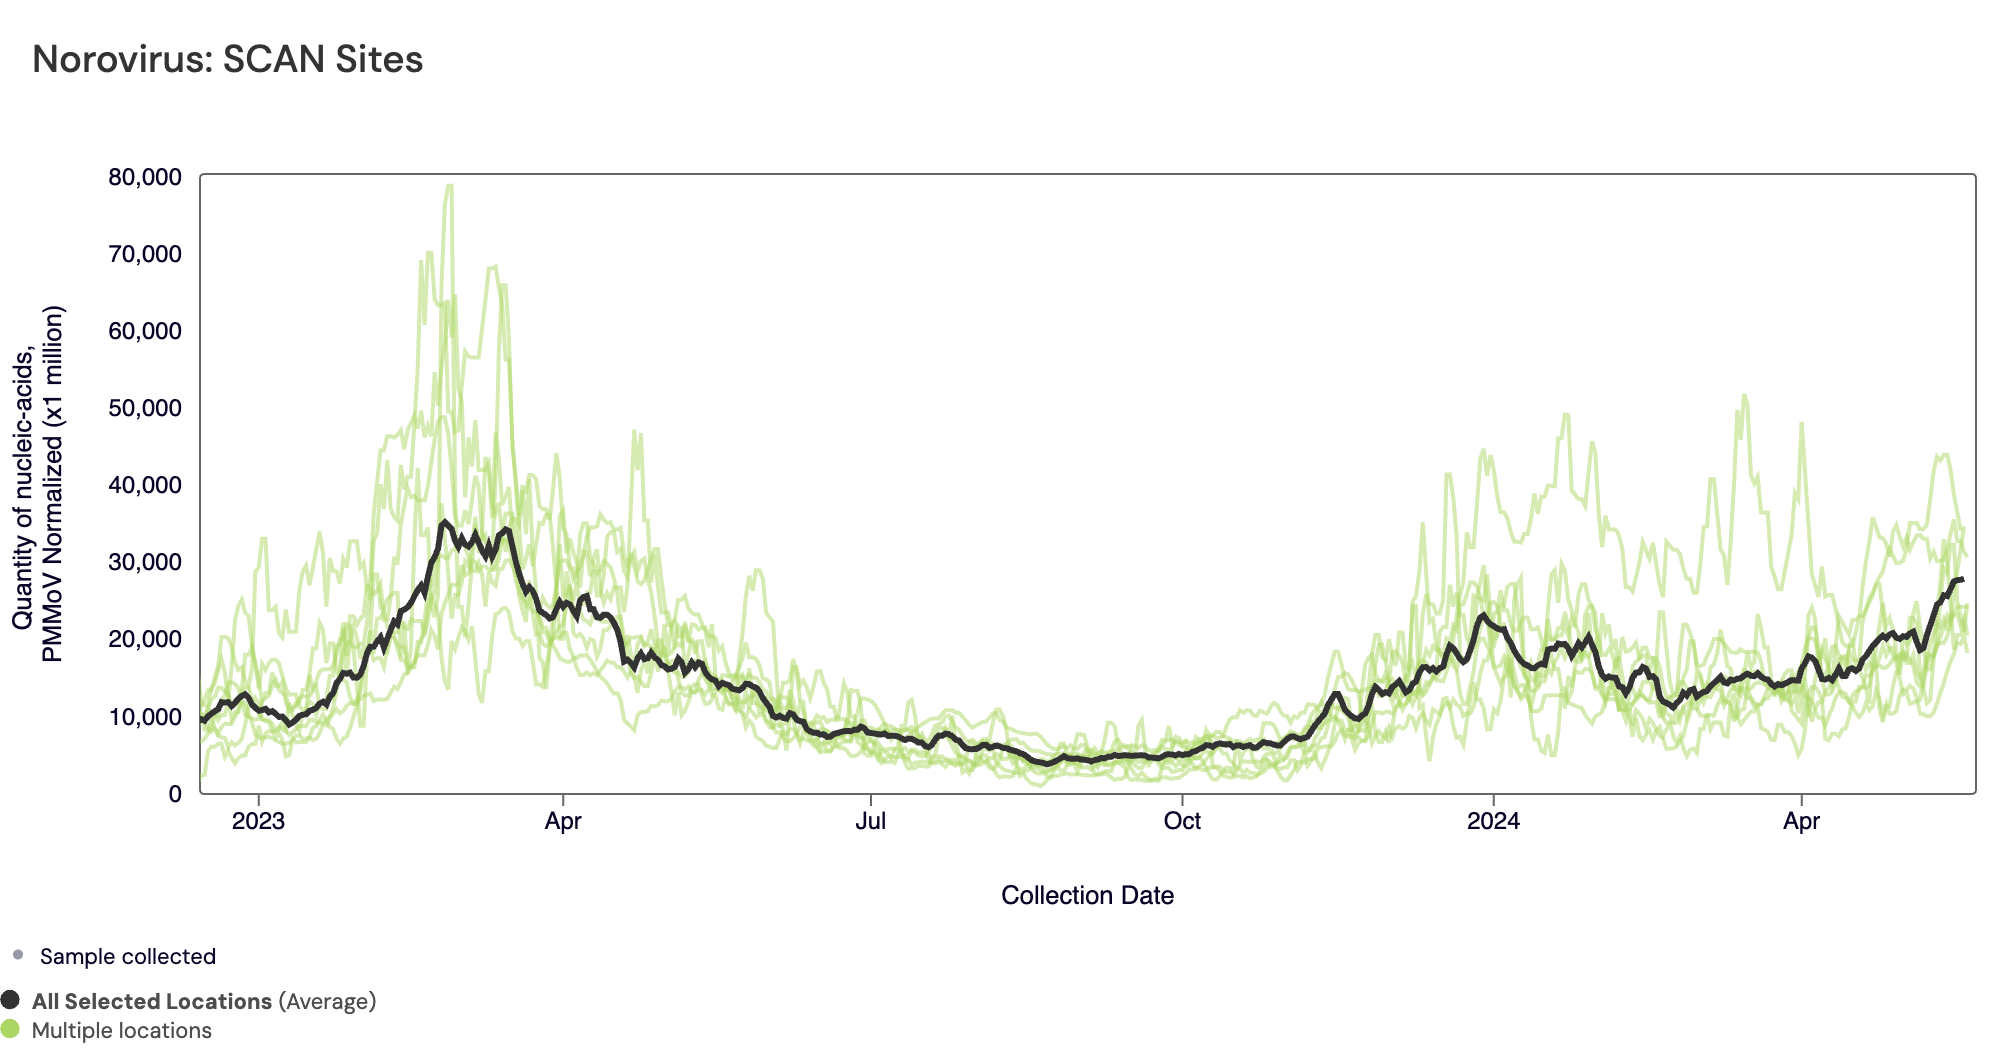
The plot below shows the Norovirus concentrations at the SCAN sites since we began monitoring in late 2022. The population weighted average line is shown in black. You can interact with the chart of all the plants at this link.
Rotavirus RNA concentrations are shown in the chart below (all the SCAN plants are shown together) since mid Oct 2023. The population weighted average line is shown in black. You can interact with the chart of all the plants here.
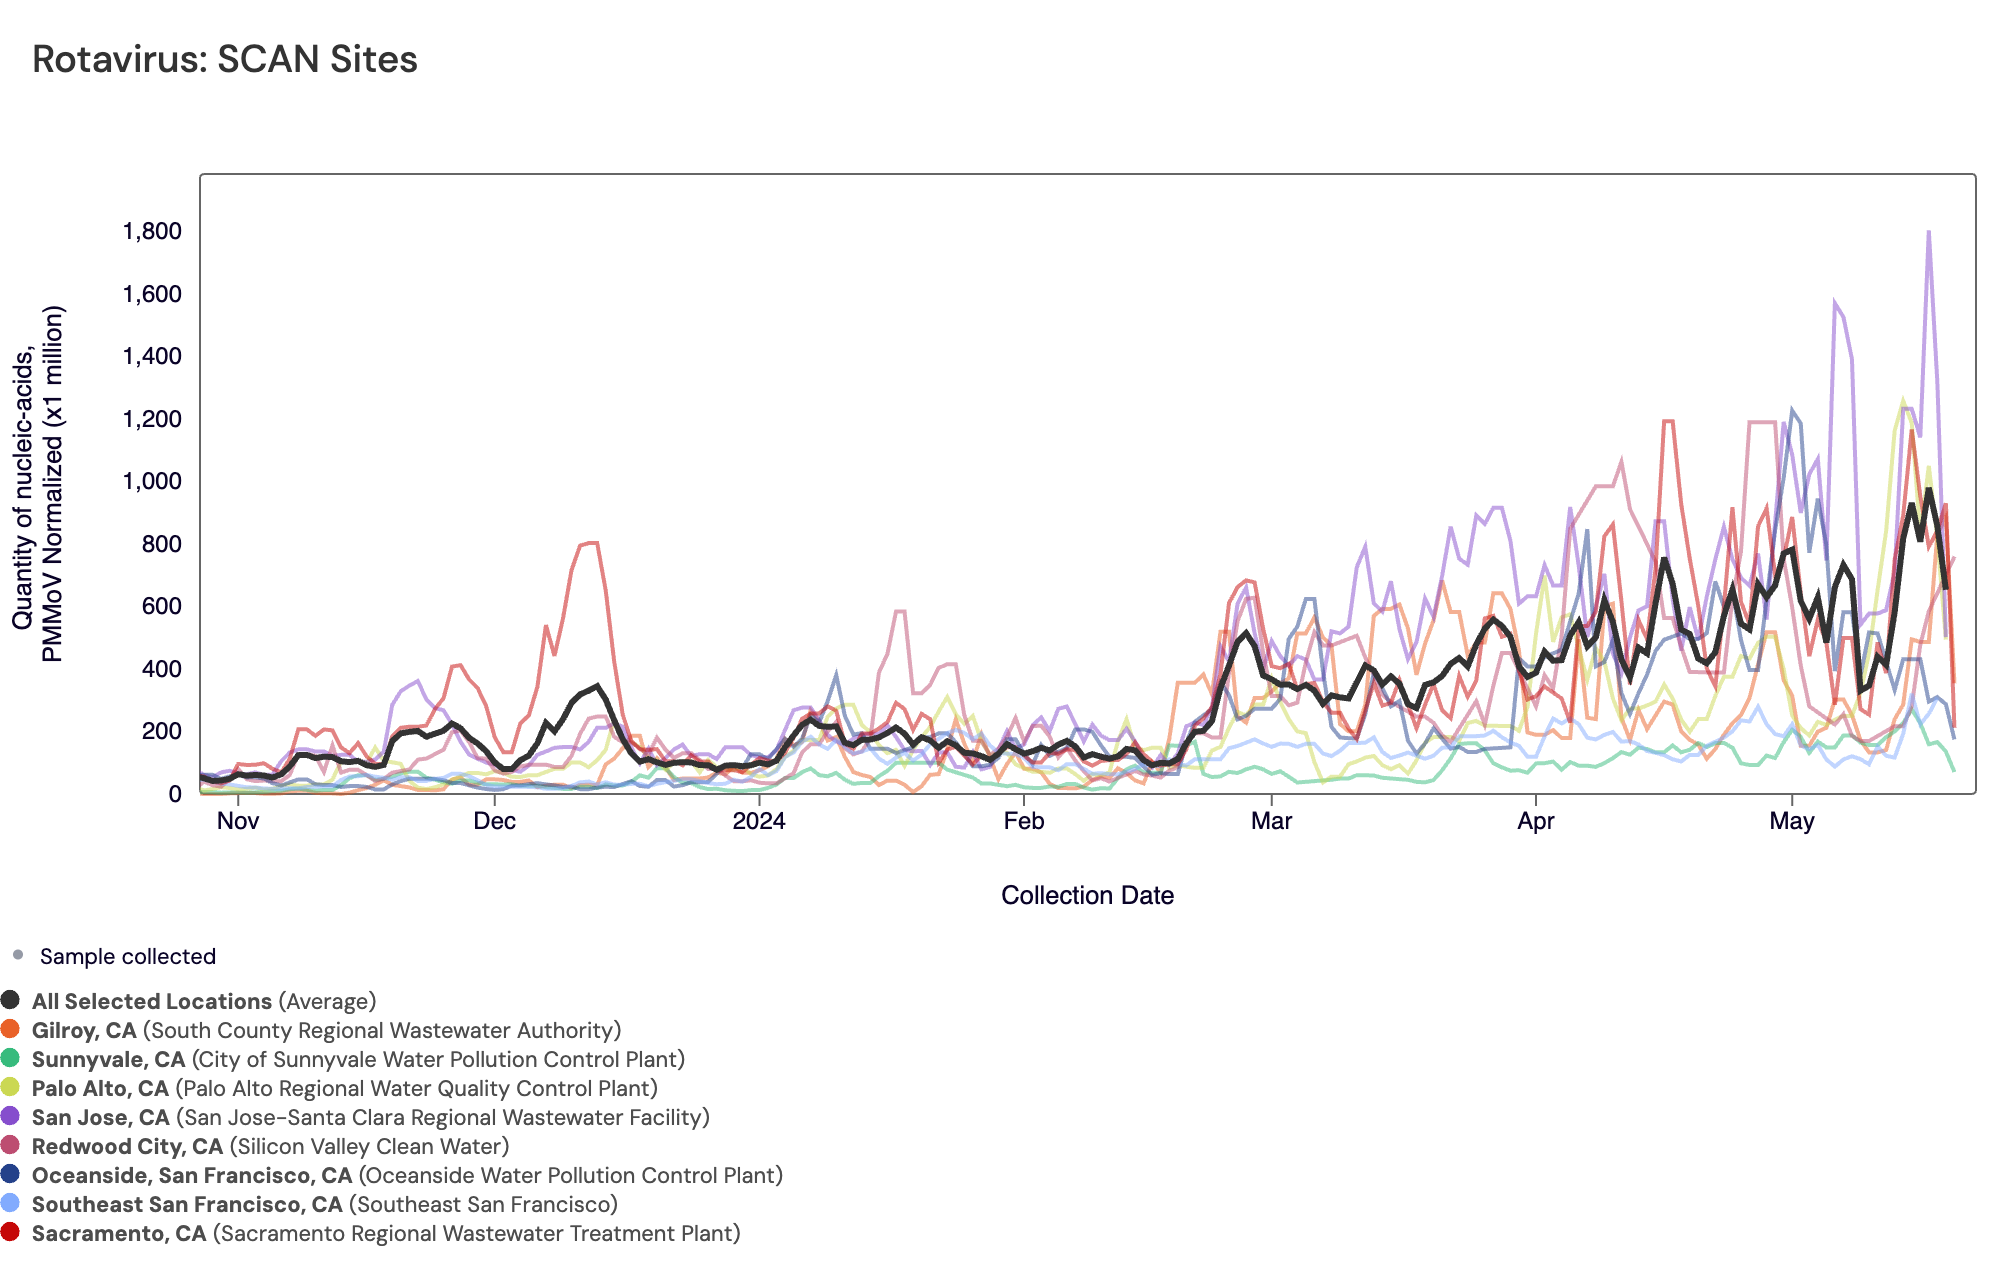
Below are the current wastewater categories for the SCAN sites (recall the category is determined by both the trend and the level):
- Sunnyvale is in the LOW Wastewater Category for Rotavirus
- Gilroy, Palo Alto, Oceanside SF, Sacramento, and Southeast SF are in the MEDIUM Wastewater Category for Rotavirus
- Palo Alto & SVCW are in the HIGH Wastewater Category for Rotavirus
Other Pathogens of Concern
Mpox, Candida auris, and Hepatitis A
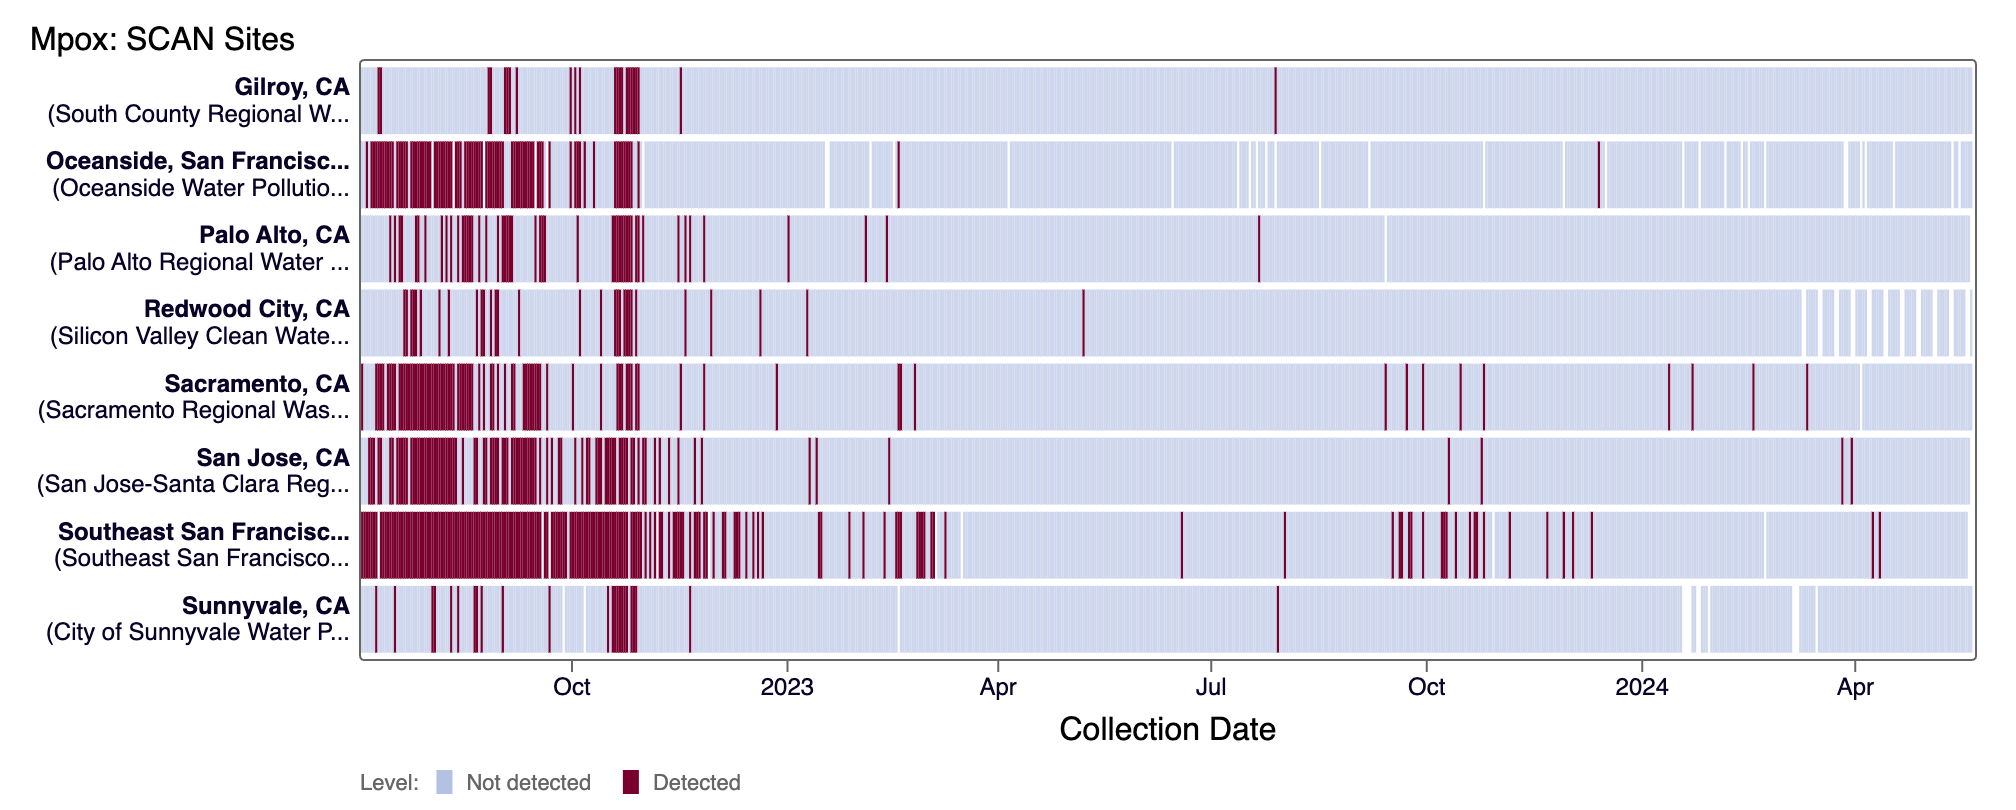
Mpox DNA was not detected at any SCAN sites recently. Currently all SCAN sites are in the 'LOW' category for Mpox.
The heat map below shows all the SCAN sites as a row, and each date as a column since July 2022. The color blue means that MPXV DNA was not detected in the sample, and the dark purple color means it was detected. White indicates no sample was collected. The chart shows all the data we have collected. You can access the chart here.
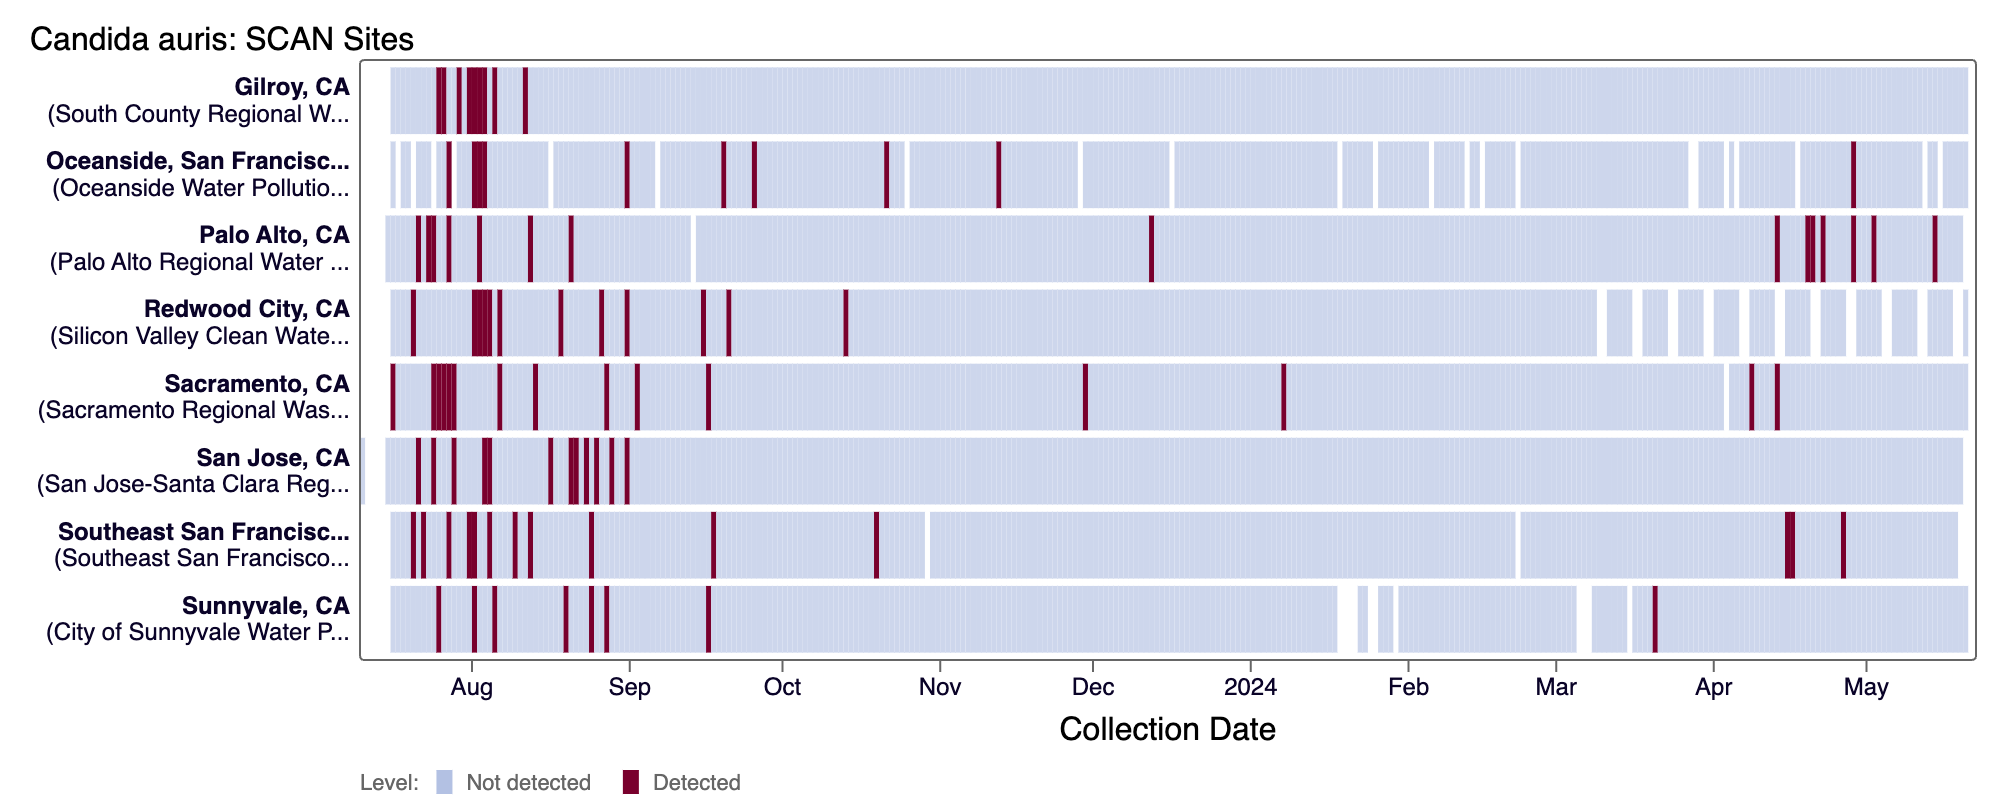
Candida auris DNA was not detected in the last 10 days at most SCAN sites (1 positive detection from Palo Alto on 5/14/24). Currently all SCAN sites are in the 'LOW' category for C. auris.
The heat map below shows all the SCAN sites as a row, and each date as a column for all data collected since monitoring began in July. The color blue means that Candida auris DNA was not detected in the sample, and the dark purple color means it was detected. White indicates no sample was collected. You can access the chart here.
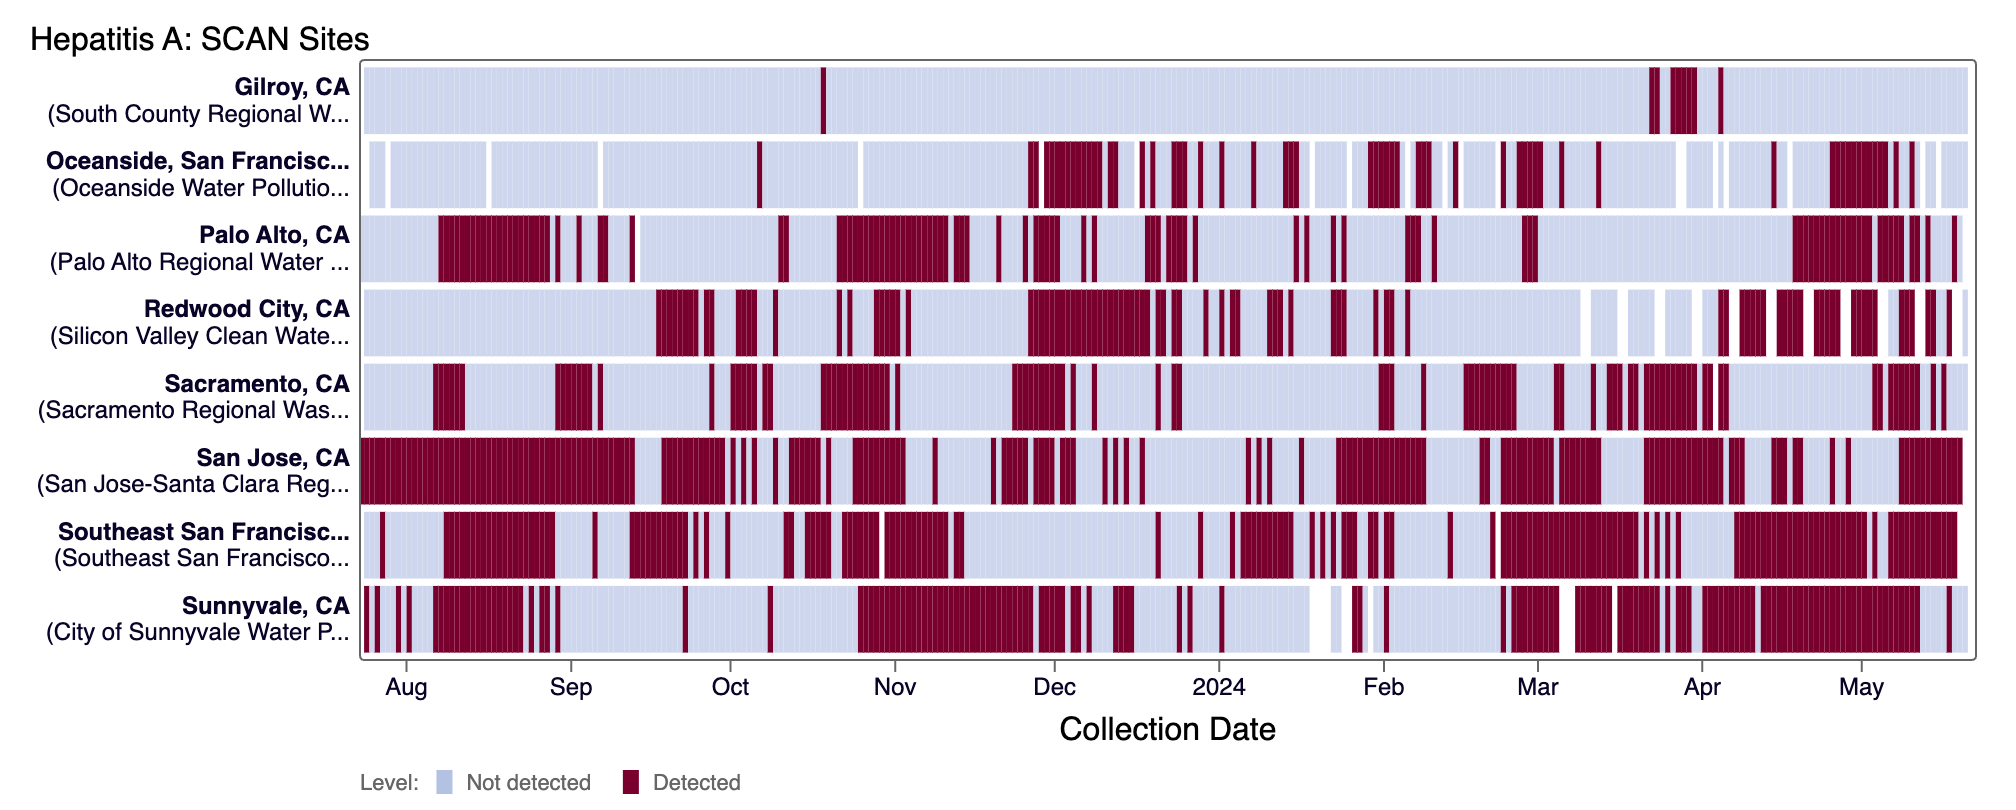
Hepatitis A RNA has been detected frequently at all SCAN sites in the last 10 days (minus Gilroy and Oceanside SF). Below are the current wastewater categories for the SCAN sites (the category is determined by the frequency of detection):
- Gilroy, Palo Alto, Oceanside SF, Sacramento and Sunnyvale are in the LOW Wastewater Category for Hepatitis A
- San Jose, Southeast SF, and SVCW are in the MEDIUM Wastewater Category for Hepatitis A
The heat map below shows all the SCAN sites as a row, and each date as a column for all data collected since monitoring began in July 2023. The color blue means that Hepatitis A RNA was not detected in the sample, and the dark purple color means it was detected. White indicates no sample was collected. You can access the chart here.
Join us at the next WWSCAN Partner call on June 14th, 2024
Please email Amanda Bidwell (albidwel@stanford.edu) if you do not have the calendar invite for the WWSCAN partner call.