Bay Area SCAN weekly update 3/1/23
All samples picked up by the couriers as of 2/26/23 have been processed and their data are on the site: wbe.stanford.edu. The data from the SCAN sites are also on the new site designed by Stamen data.wastewaterscan.org. If you notice any bugs on the new site or have any comments about it, please email Amanda Bidwell at albidwel@stanford.edu.
We stopped measuring the SARS-CoV-2 S gene so we could run an assay for 5 uniquely adjacent SNPs in XBB*. The primers and probe sequences are available at our protocols.io site. The assay is designed to detect both XBB and XBB1.5.
COVID-19
SARS-CoV-2 and Variants
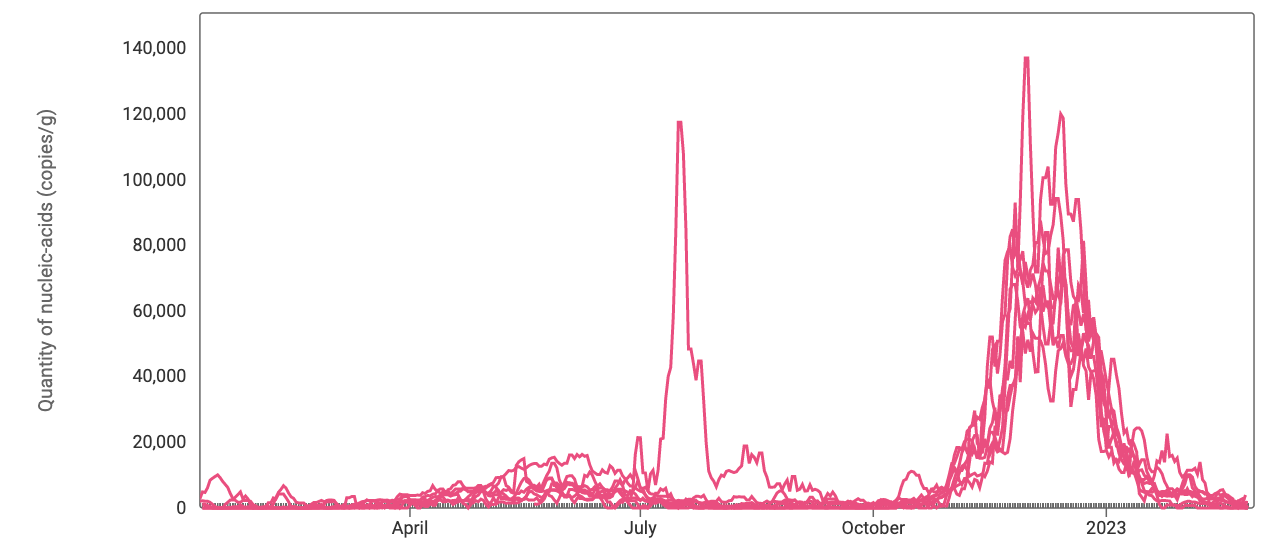
SARS-CoV-2 RNA concentrations show a range of trends over the last week. Some plants are showing an increasing trends, while others less so. Here is a representative chart from Oceanside in San Francisco where we are seeing an increase.
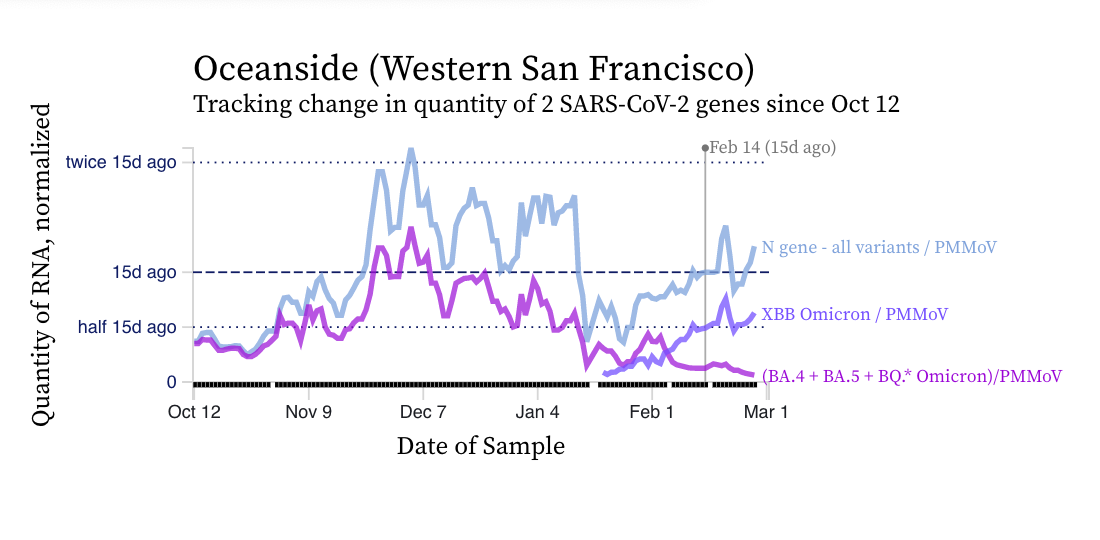
The chart shows that the mutation in XBB* (shown in violet) is closer to the blue line (showing the N gene, present in all variants) than the bright purple line (showing the mutation present in the BQ* and BA.5 sublineages). This indicates that most of the shedders in the sewershed are likely infected with and shedding XBB* rather than the other variants. We see the pattern across all the sewersheds in SCAN.
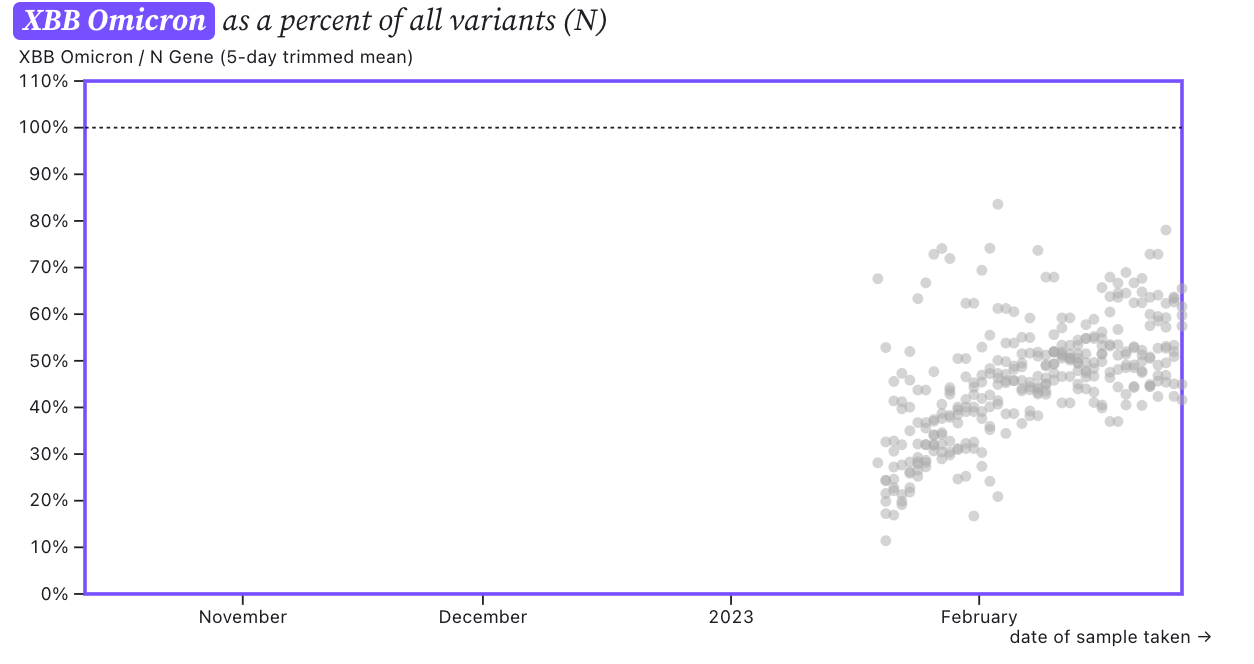
The ratio of the XBB* mutations/N across SCAN plants is shown in the chart below. As the ratio reaches 100%, it suggests that all the SARS-CoV-2 genomes in wastewater have the XBB* mutations. These data indicate that the regional average ratio XBB* mutations/N is ~60% but some places show levels as high as 70-80%, and there is an increasing trend. This suggests 60%-80% of infections across the communities are caused by XBB or XBB1.5 and the percentage is increasing.
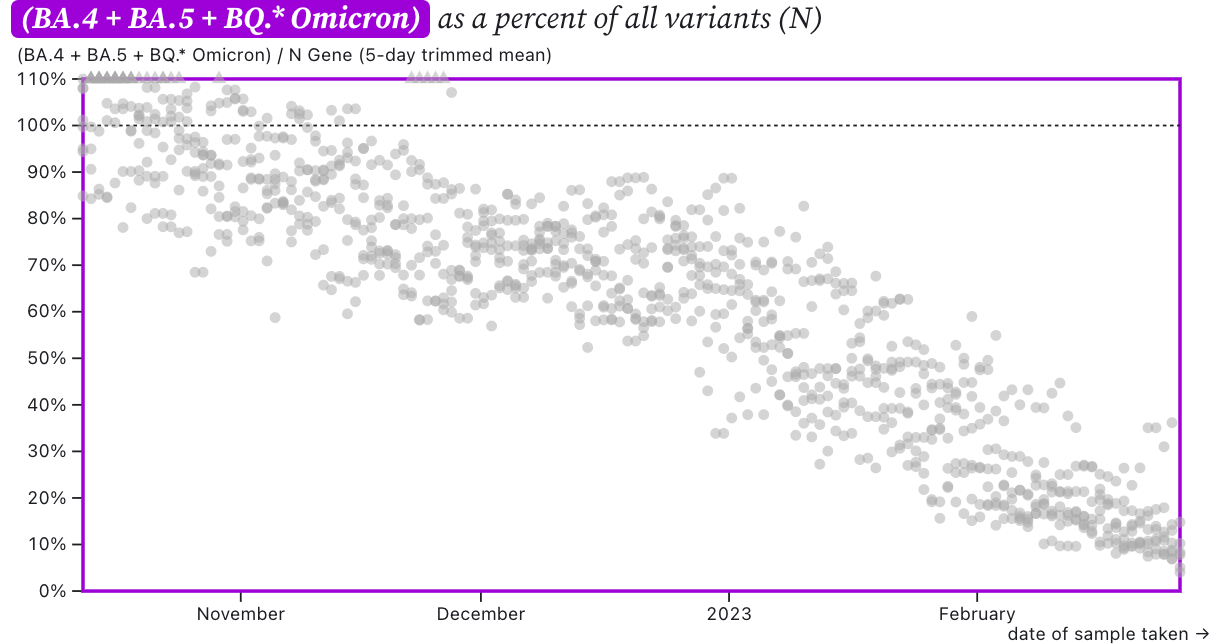
The chart below shows the ratio of the BA.5, BA.4, and BQ* mutation/N across SCAN plants. It can be read the same way as the above chart. The regional average ratio is about 10% and has a decreasing trend.
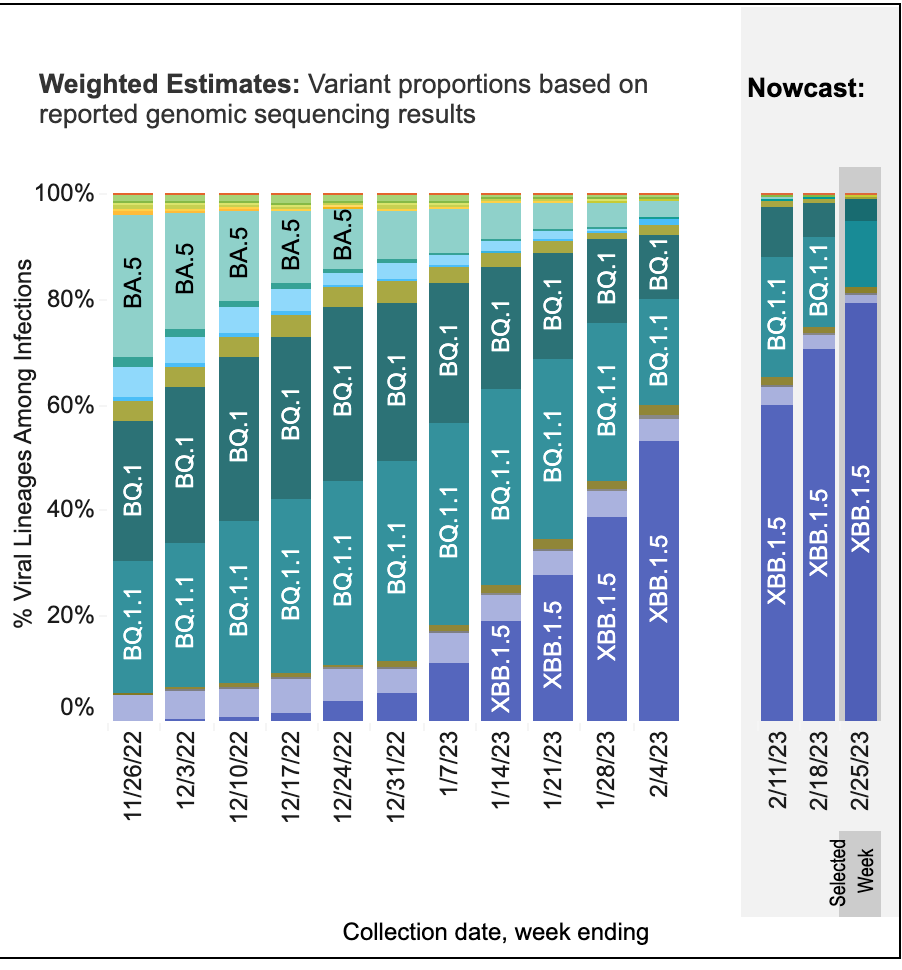
These data from wastewater solids on variants is consistent with the results from the CDC Nowcast for HHS region 9 (which includes CA). The nowcast suggests 80% of infections in HHS region 9 are caused by XBB1.5 and 15% by BQ* (see screen shot from website below).
Other Respiratory Viruses
IAV, IBV, RSV, and HMPV
Influenza A (IAV) RNA concentrations have dropped across the plants. Concentrations are generally on the order of 1,000 copies per gram dry weight of wastewater solids, and we even have some non-detects at some plants. Here is a year's worth of data from all the SCAN plants where you can see the small summer influenza peak and the larger winter one. The large summer peak is from Palo Alto.
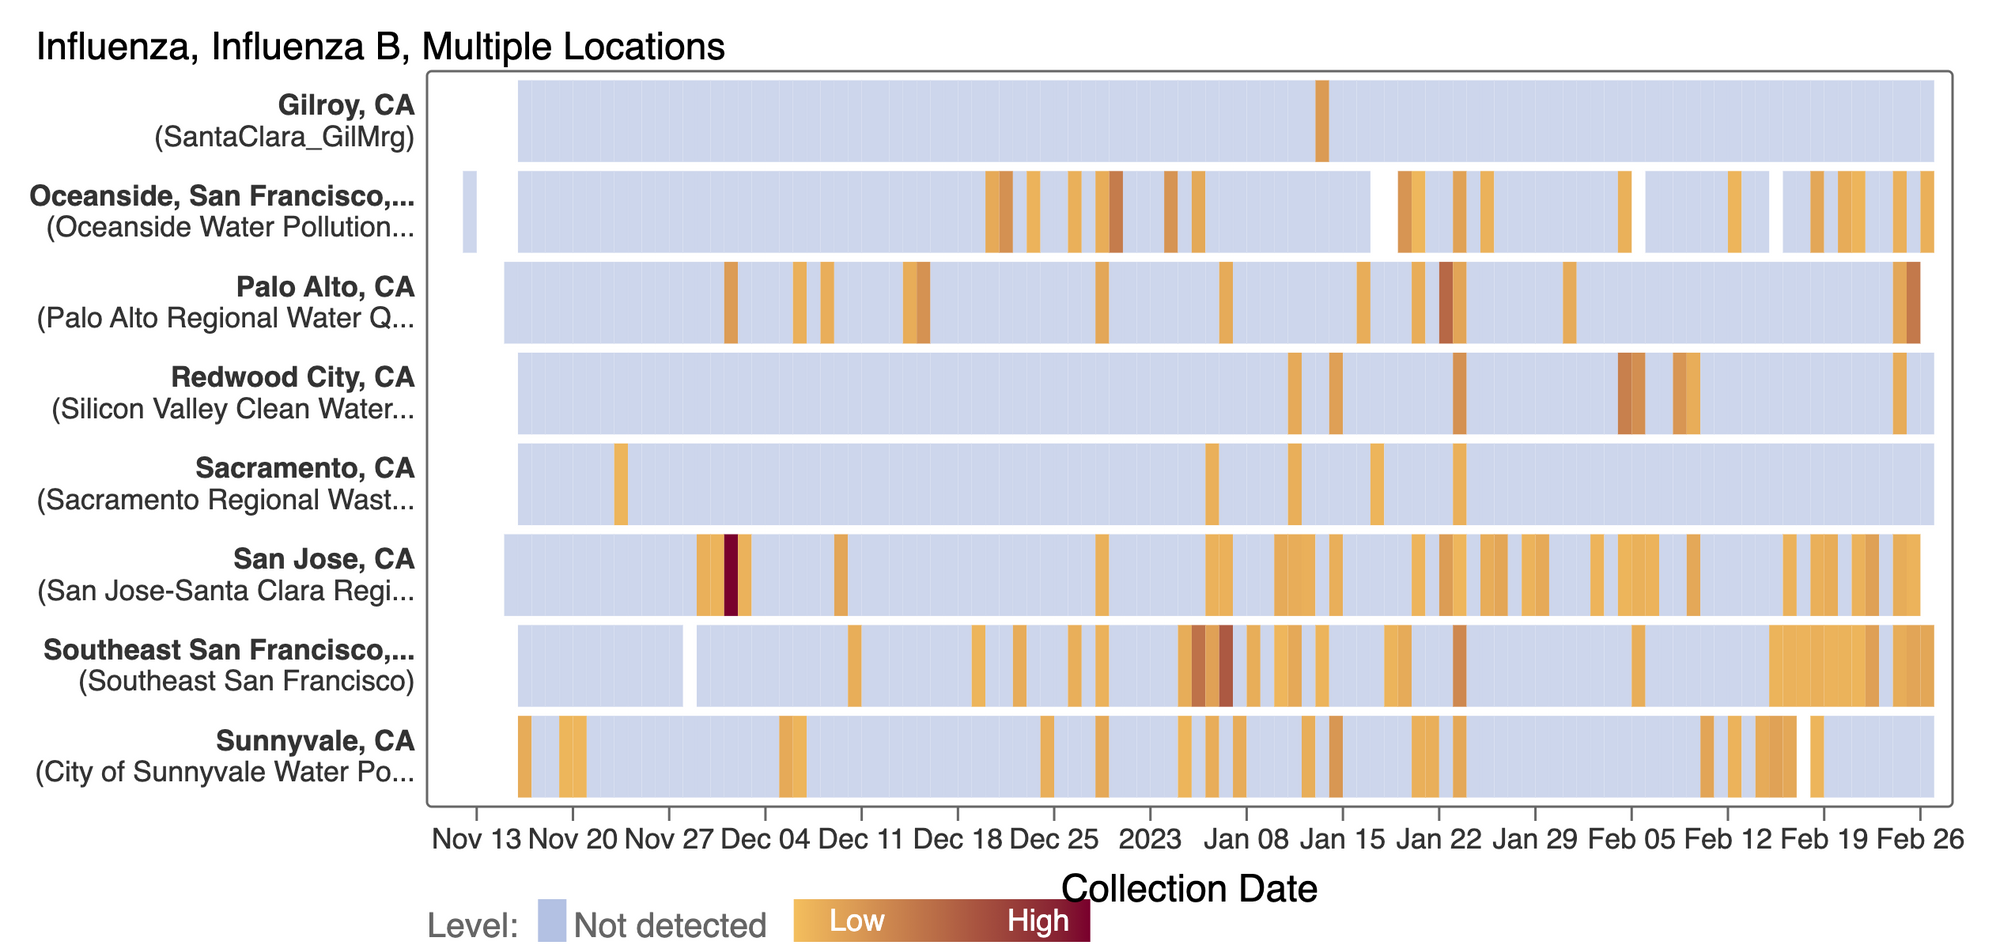
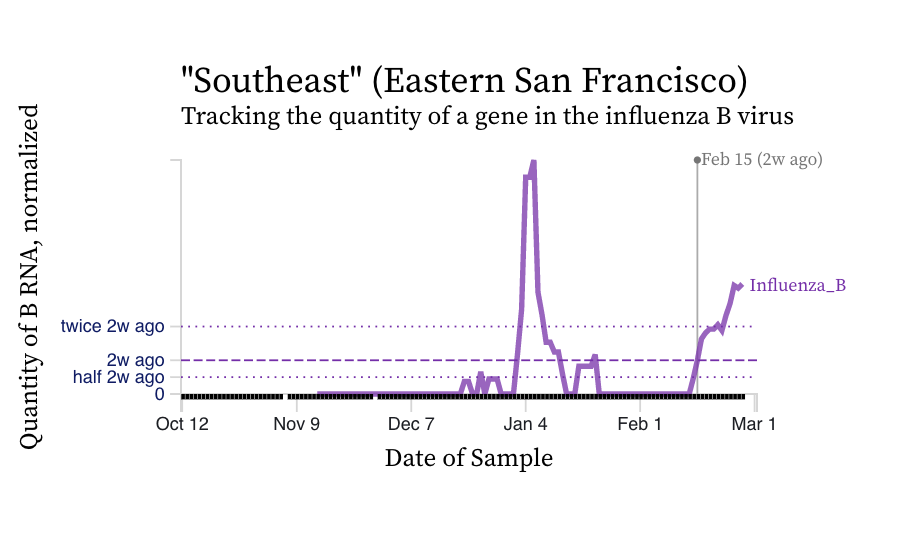
Influenza B (IBV) RNA concentrations continue to be sporadically detected at low concentrations at the SCAN plants. A heat map is shown below of the IBV concentrations at the SCAN plants. Each plant is represented by a row (y-axis), and dates are shown along the x-axis. Blue indicates a non-detect, and darker orange/red is proportional to concentration with the highest values being darkest. There are a whole bunch of consecutive days of detection in Southeast plant in SF. I have added a chart with the Southeast data as a concentration over time below the heat map. Here is the link to the heat map chart - the linked chart will update automatically as more data are added to the site.
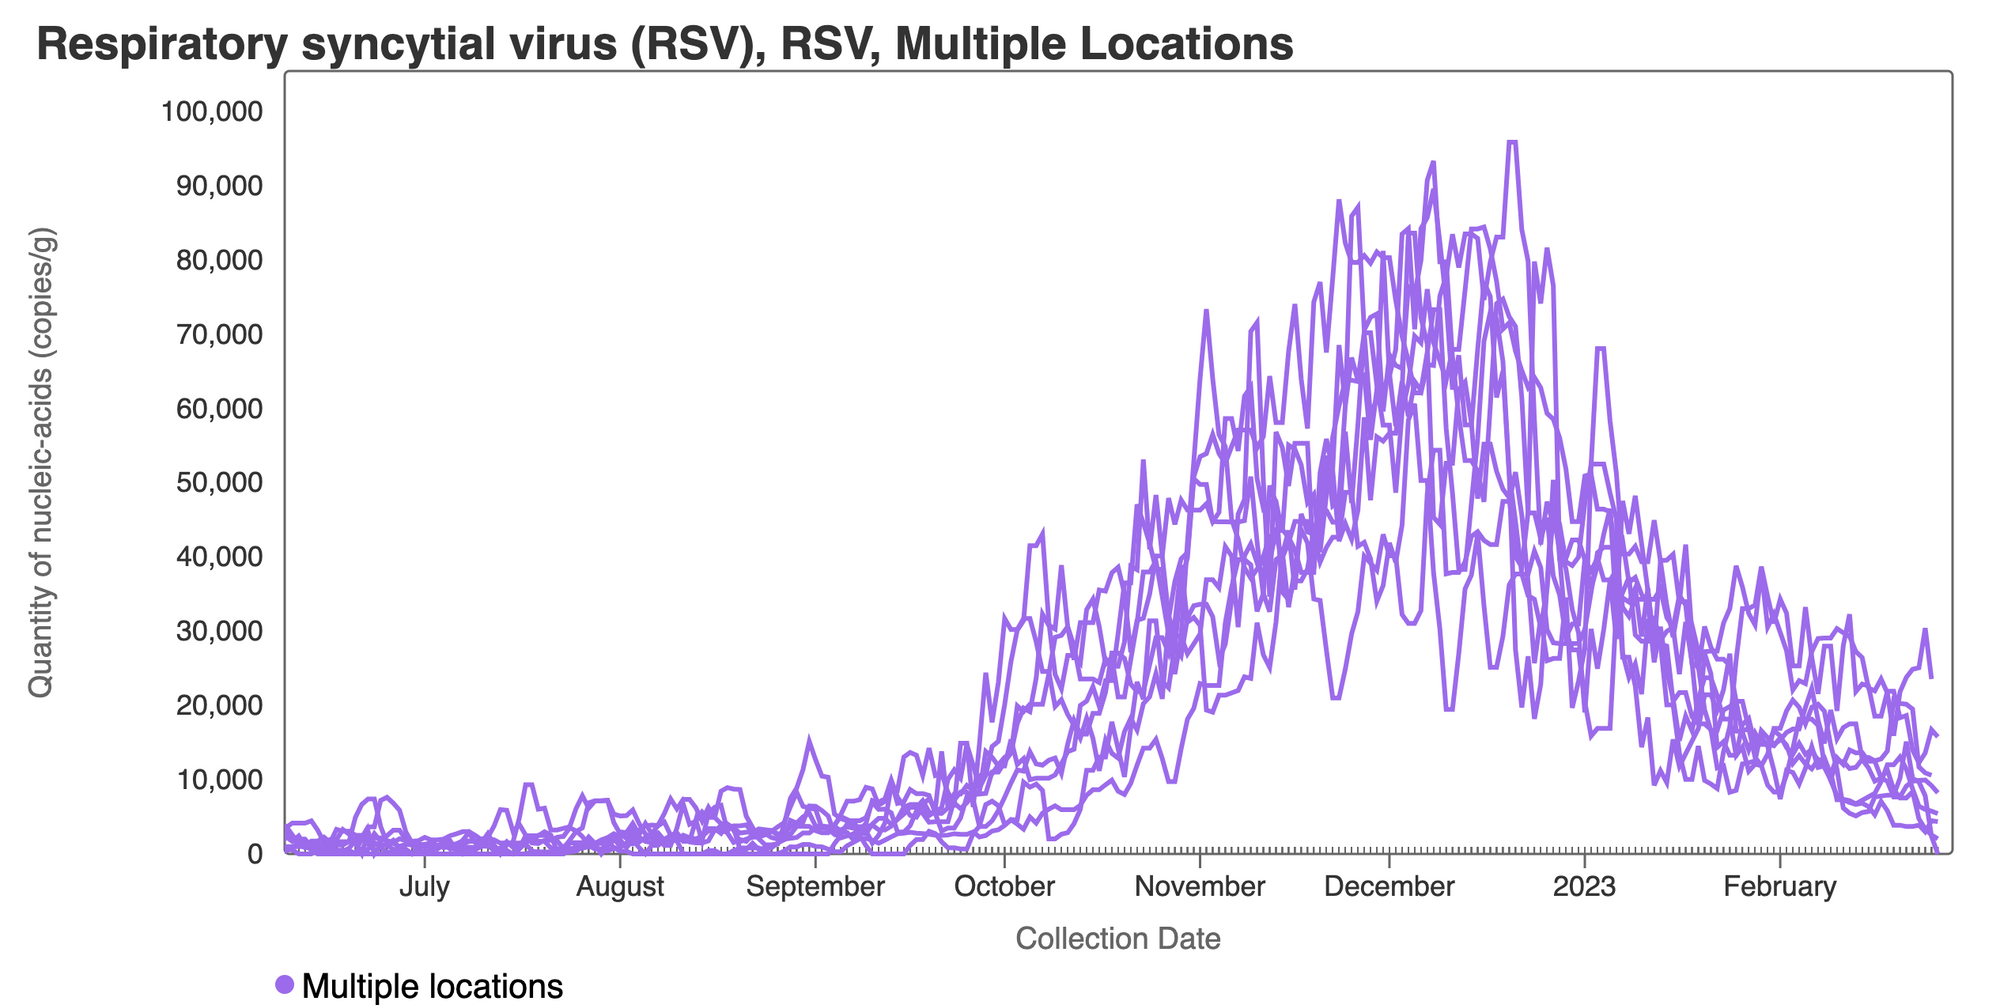
RSV RNA concentrations have decreased from their highest levels but concentrations remain detectable at concentrations between 1,000 - 10,000 copies/gram. Most plants have an "open curve" meaning that although levels are decreasing, they have not bottomed out (like IAV appears to have). This plot shows data from all the SCAN sites together and can be access here.
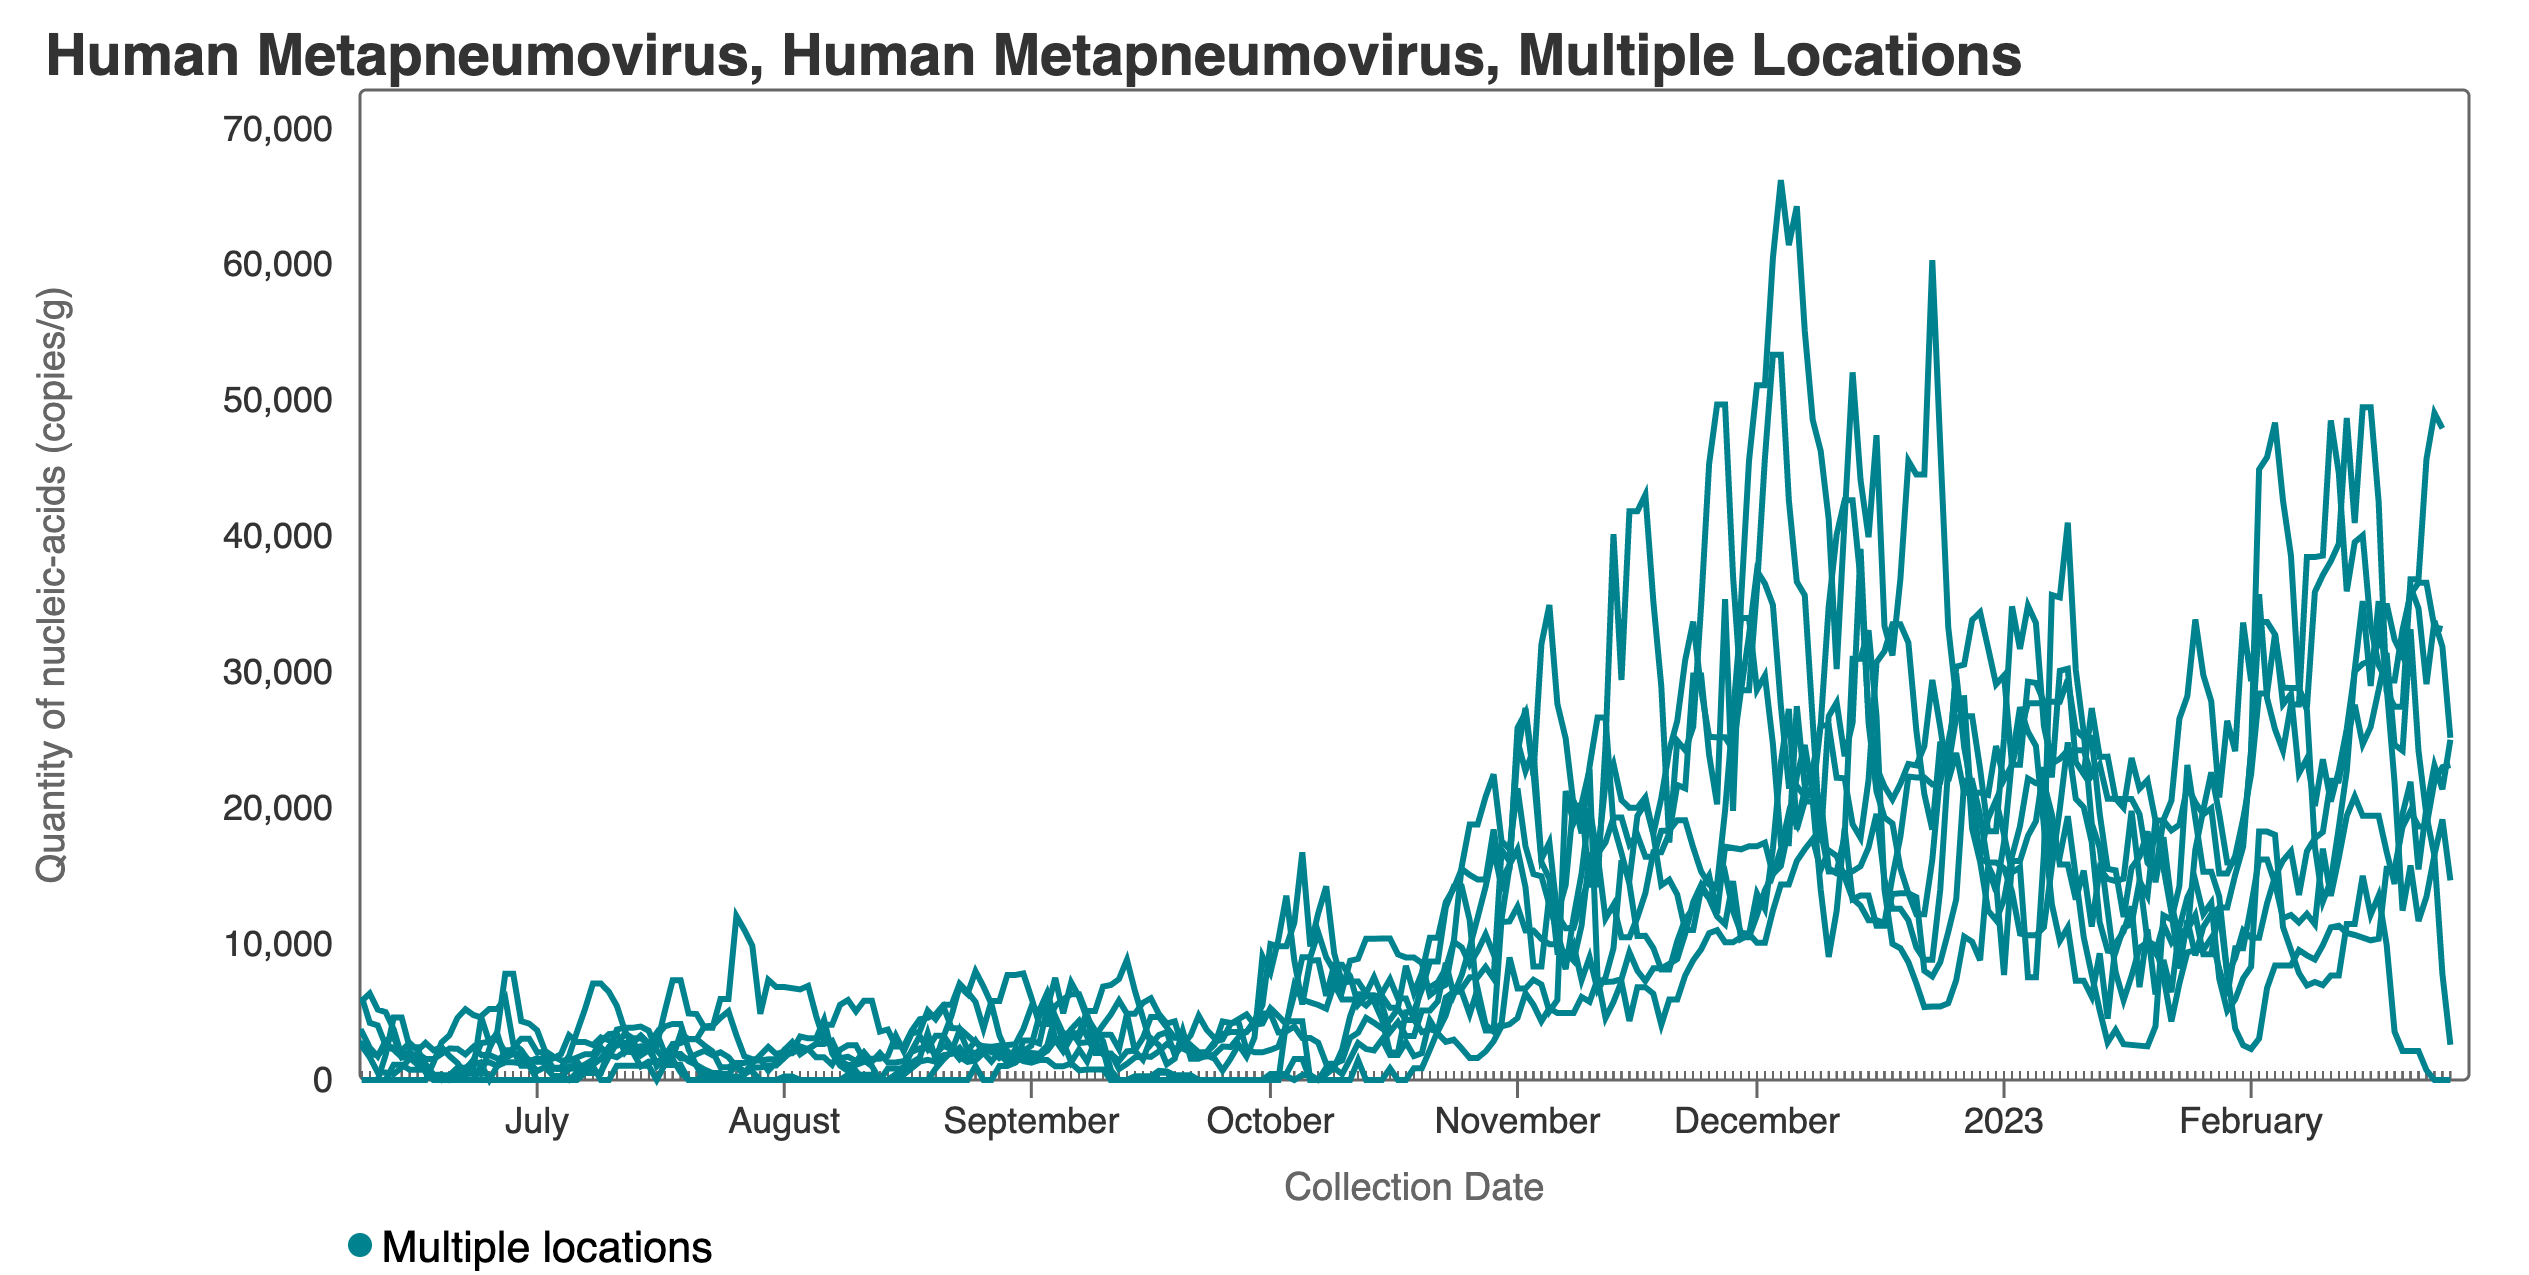
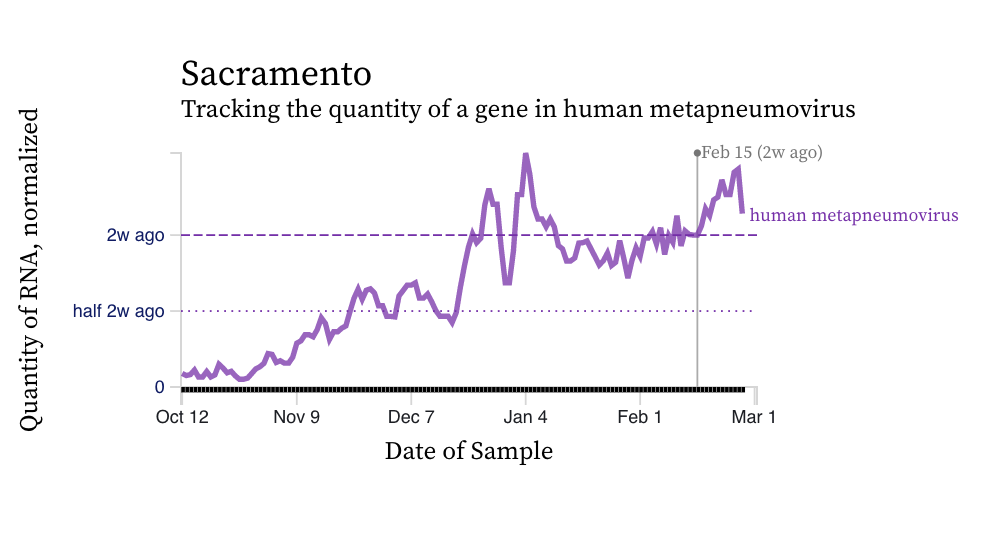
HMPV (human metapneumovirus) RNA concentrations have increased at SAC over the last week, yet have remained constant at others. Below are charts showing data from all the SCAN plants together (link here to this chart if you want to interact with it), and Sacramento showing relatively high concentrations and an increasing trend.
Norovirus
Assay detects human norovirus GII
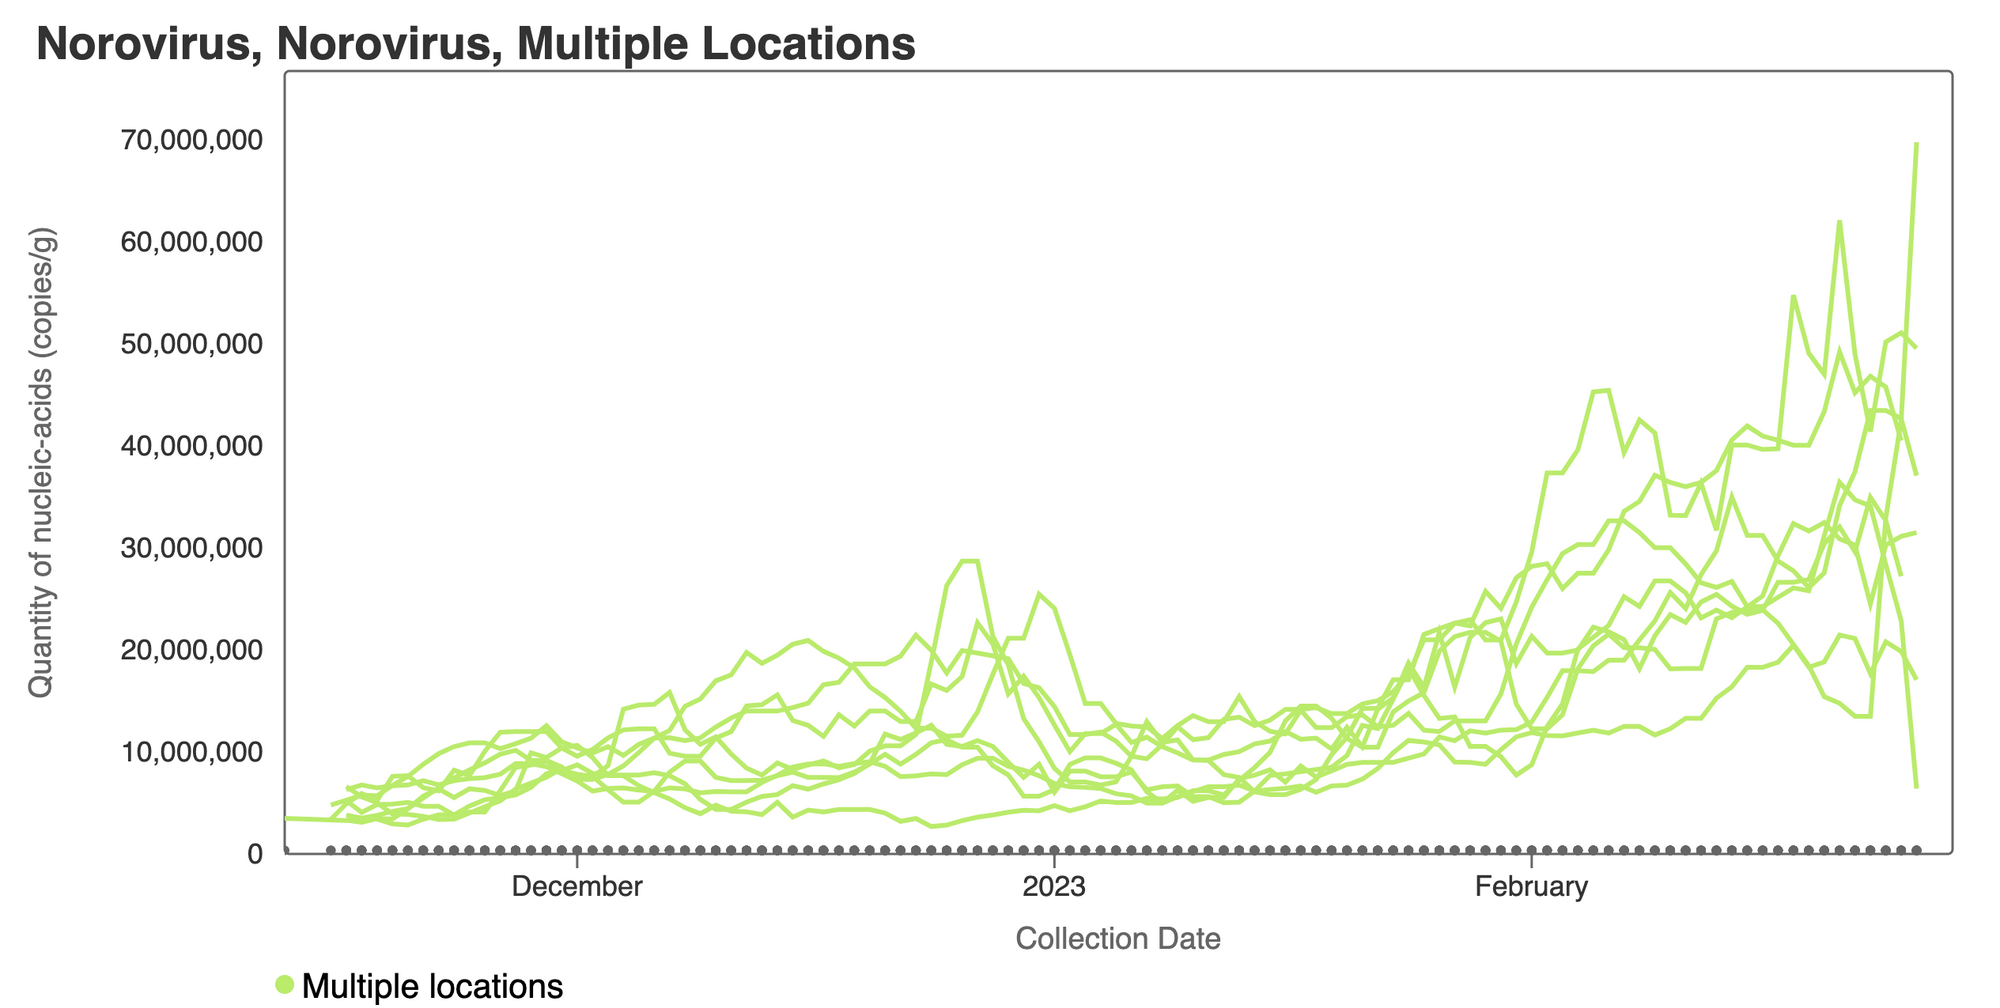
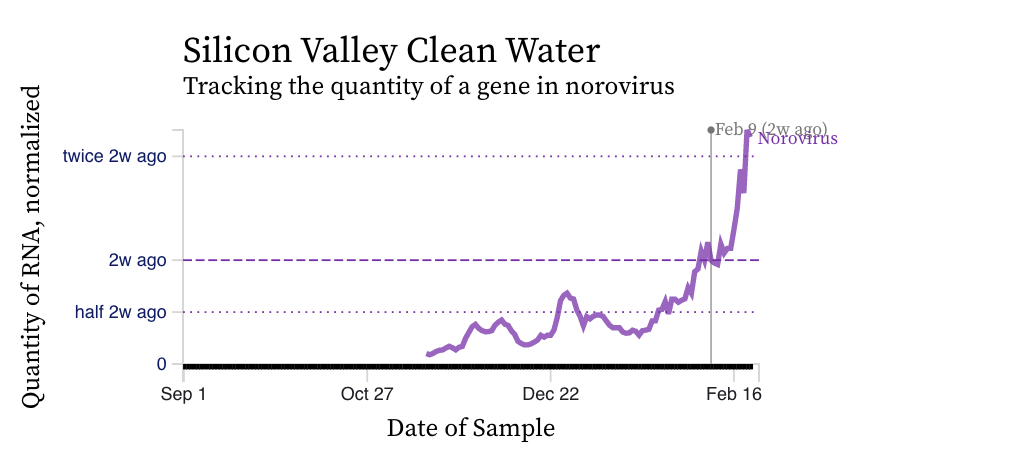
Norovirus GII RNA concentrations are trending upward visually at most plants. A chart of all the SCAN plants together is shown below, and then just Silicon Valley Clean Water. You can interact with the chart of all the plants at this link.
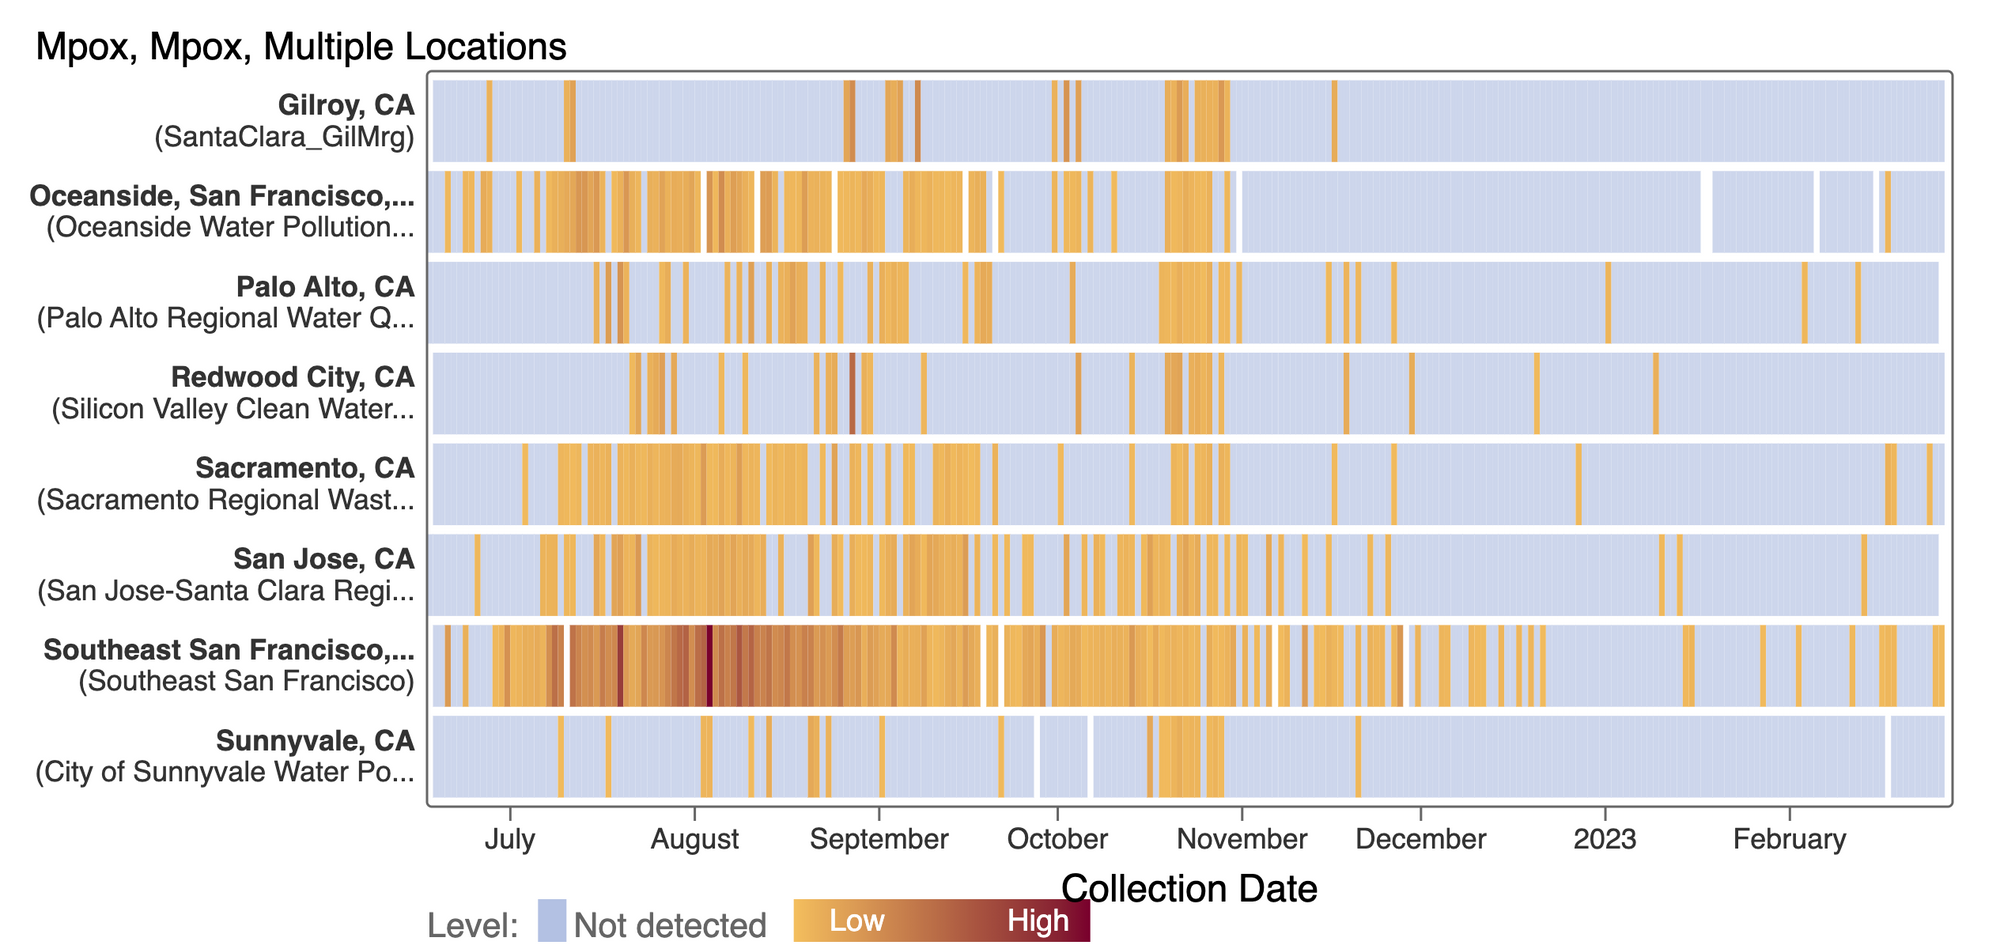
Mpox
We've seen mostly non-detects in the past week for MPXV DNA at most SCAN plants. This heat map shows all the SCAN sites as a row, and each date as a column. The color blue means the sample was non-detect for MPXV DNA and the colors get darker with higher concentrations. This chart highlights that we rarely have detections of MPXV DNA at these SCAN plants recently, but we can see how we had much more in the past. You can access this plot here.