Bay Area SCAN weekly update 3/15/23
All samples picked up by the couriers as of 3/14/23 have been processed and their data are on the site: wbe.stanford.edu. The data from the SCAN sites are also on the site designed by Stamen data.wastewaterscan.org. If you notice any bugs on the new site or have any comments about it, please email Amanda Bidwell at albidwel@stanford.edu.
COVID-19
SARS-CoV-2 and Variants
SARS-CoV-2 N gene concentrations at SCAN sites are similar to what they were two weeks ago. Concentrations are between 100,000 copies per gram and over 500,000 copies/g, still well above our lower detection limit of approximately 1000 copies/g. Below is a chart showing data from the Southeast plant in San Francisco showing reduced concentrations relative to two weeks ago. And also a chart from San Jose where concentrations have been relatively constant over the last two weeks.
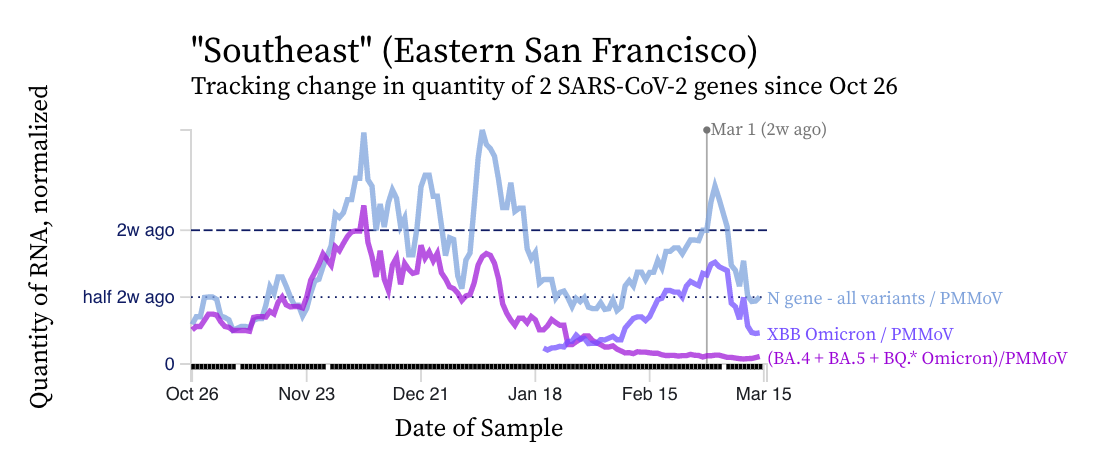
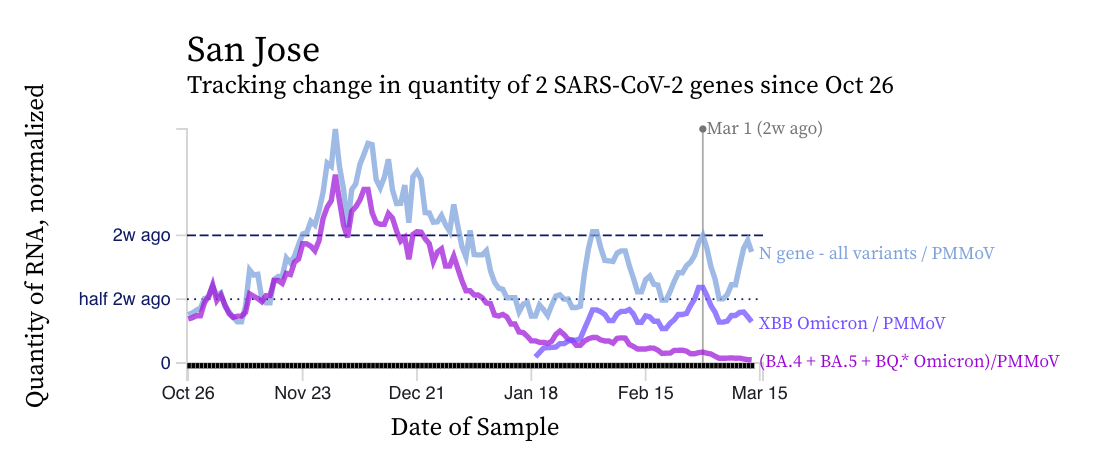
The charts show that the mutation marker for XBB* (shown in violet) is closer to the blue line (showing the N gene, present in all variants) than the bright purple line (showing the mutation present in the BQ* and BA.5 sublineages). This indicates that most of the shedders in the sewersheds are likely infected with and shedding XBB* rather than the other variants. We see the pattern across all the sewersheds in SCAN.
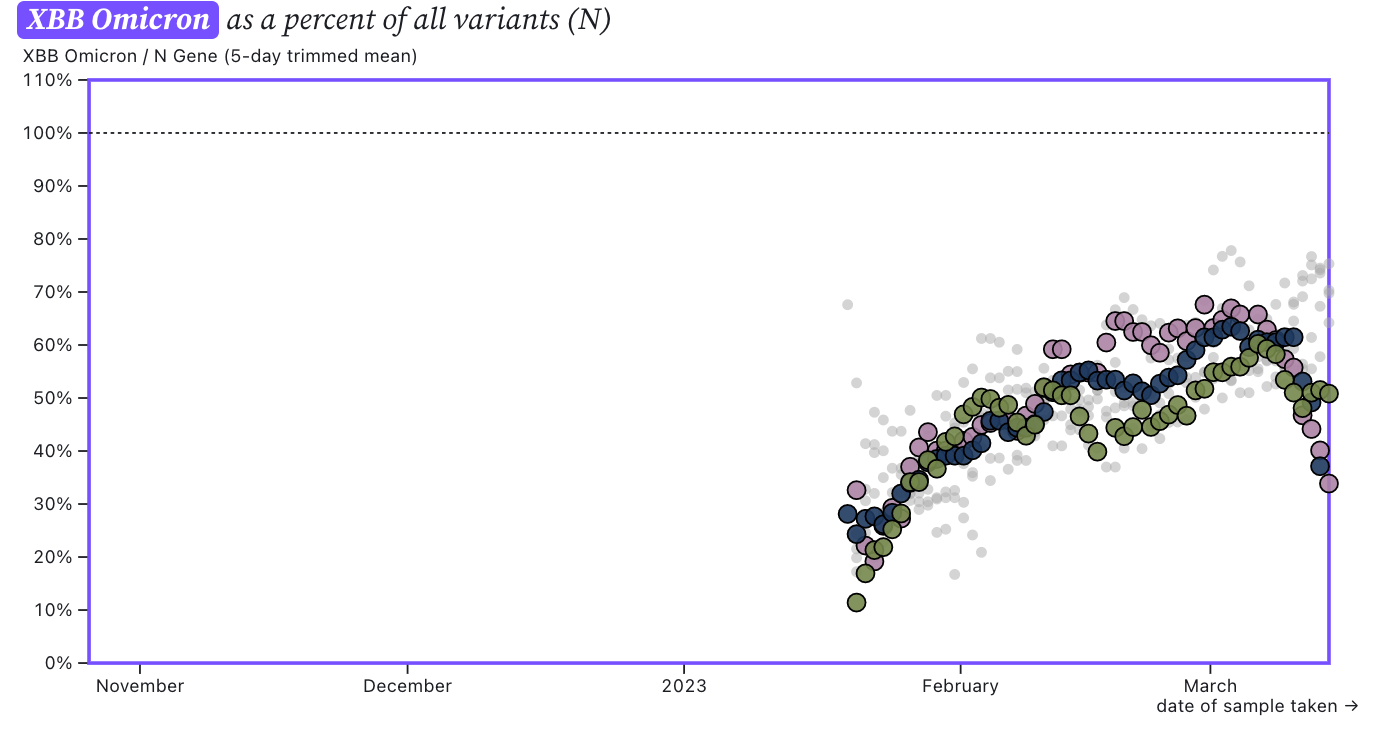
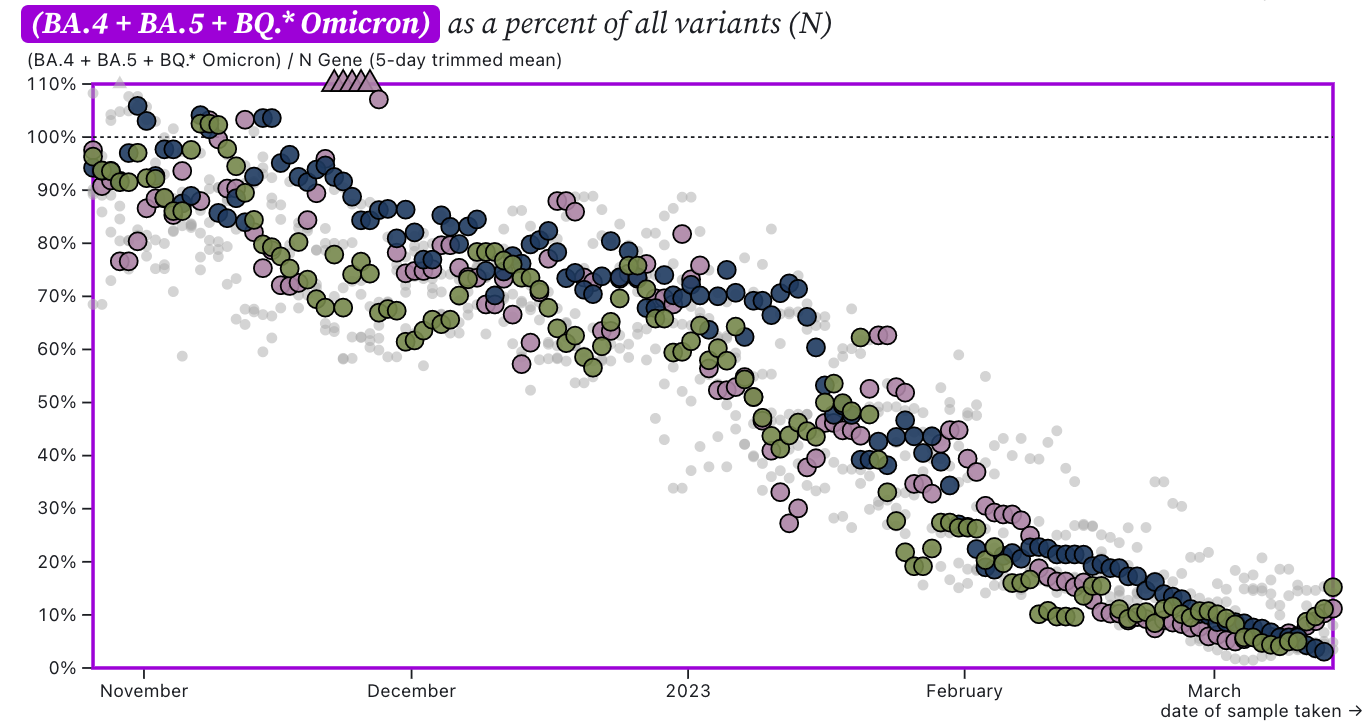
The ratio of the XBB* mutations/N across SCAN plants is shown in the chart below. The samples from San Jose, Sunnyvale, and Southeast are darkened in different colors. As the ratio reaches 100%, it suggests that all the SARS-CoV-2 genomes in wastewater have the XBB* mutations. These data indicate that the regional average ratio XBB* mutations/N is 60-70% but some places show levels as high as 80%. This suggests the majority of infections across the communities are caused by XBB or XBB1.5. While the trend is overall increasing, we can see a drop off in the ratio if we look at the individual plants Southeast, Sunnyvale, and San Jose.
The chart below shows the ratio of the BA.5, BA.4, and BQ* mutation/N across SCAN plants with the Southeast, Sunnyvale, and San Jose plants' samples shown in dark colors. It can be read the same way as the above chart. The regional average ratio is less than 10% and has a decreasing trend, except we do see slight upticks in the ratio in Sunnyvale and Southeast.
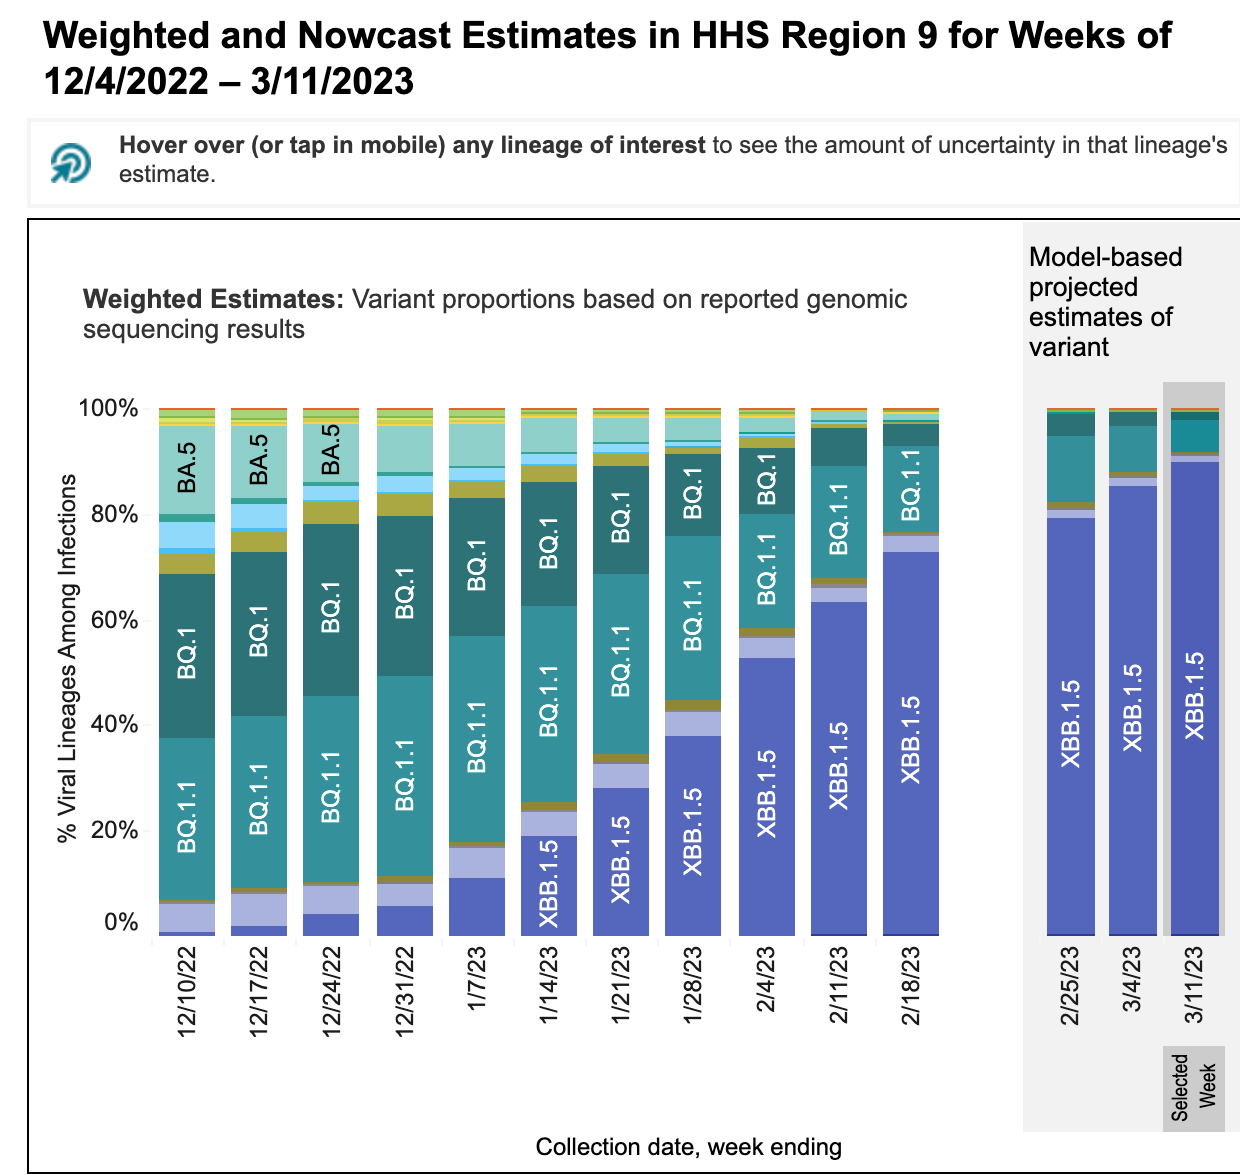
These data from wastewater solids on variants is consistent with the results from the CDC Nowcast for HHS region 9 (which includes CA). The nowcast suggests approximately 85% of infections in HHS region 9 are caused by XBB1.5 and 10% by BQ* (see screen shot from website below). It is important to note that the clinical sample sequencing data used to make the CDC nowcast charts is only available as recently as a month ago (week of 2/18/23 in the chart below) and the rest of the data are predictions. The predictions suggest slightly higher XBB* percentages in HHS region 9 than the SCAN sites here are showing.
Other Respiratory Viruses
IAV, IBV, RSV, and HMPV
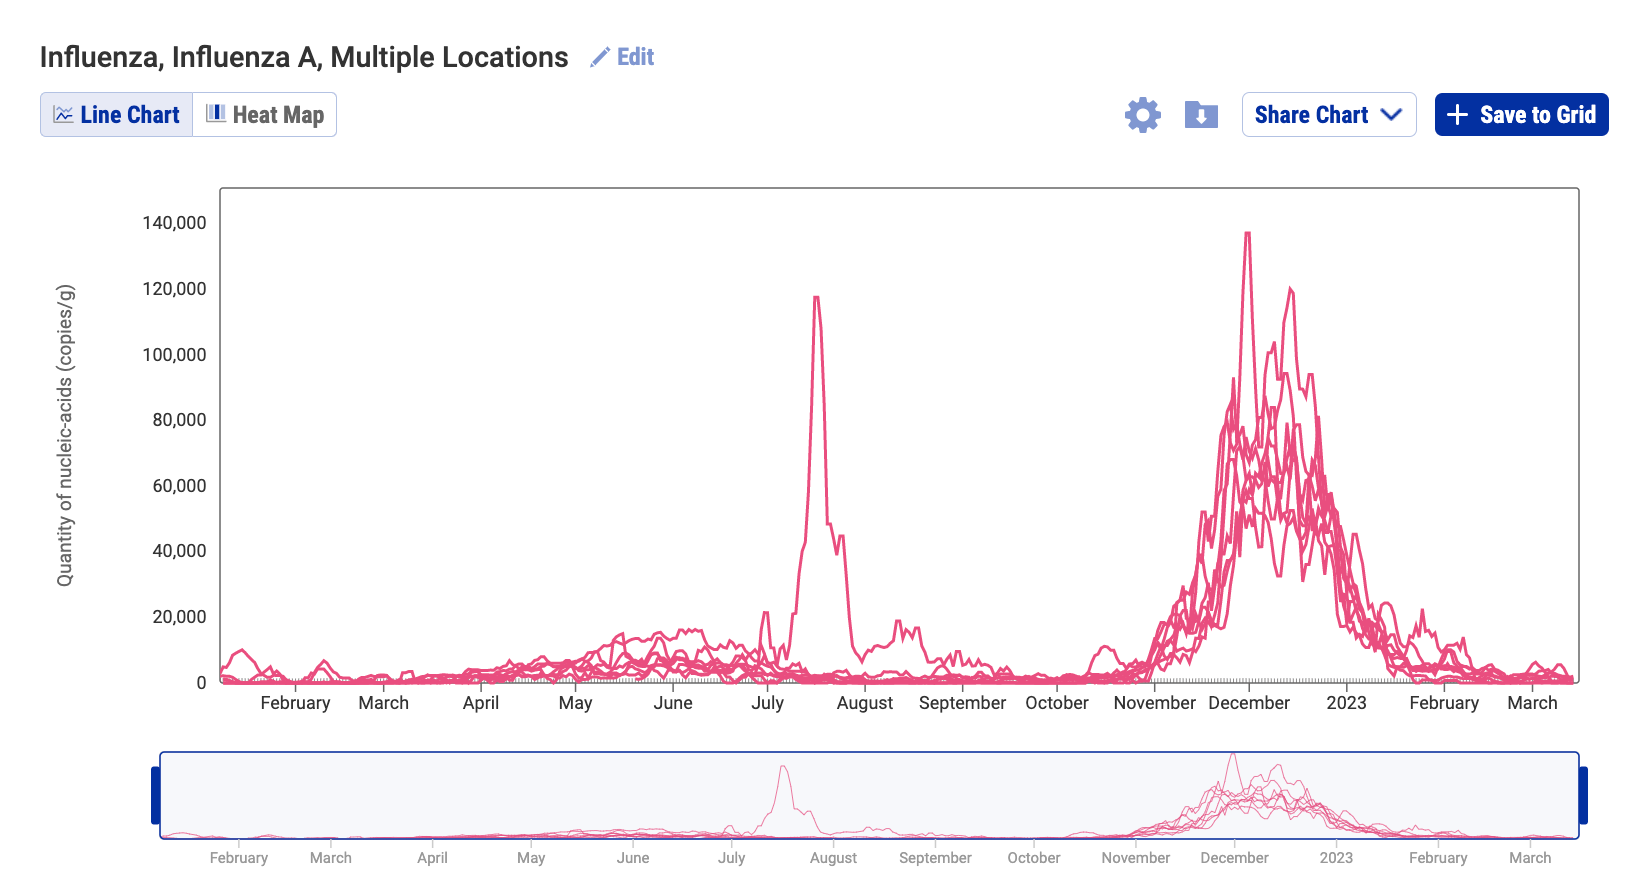
Influenza A (IAV) RNA concentrations have dropped across the plants. Concentrations are generally on the order of 1,000 copies per gram dry weight of wastewater solids, and we observe non-detects at some plants. The chart below shows over a year of data from all the SCAN plants where you can see the small summer influenza peak and the larger winter one. The large summer peak is from the plant in Palo Alto. The link to the chart is here if you would like to interact with it.
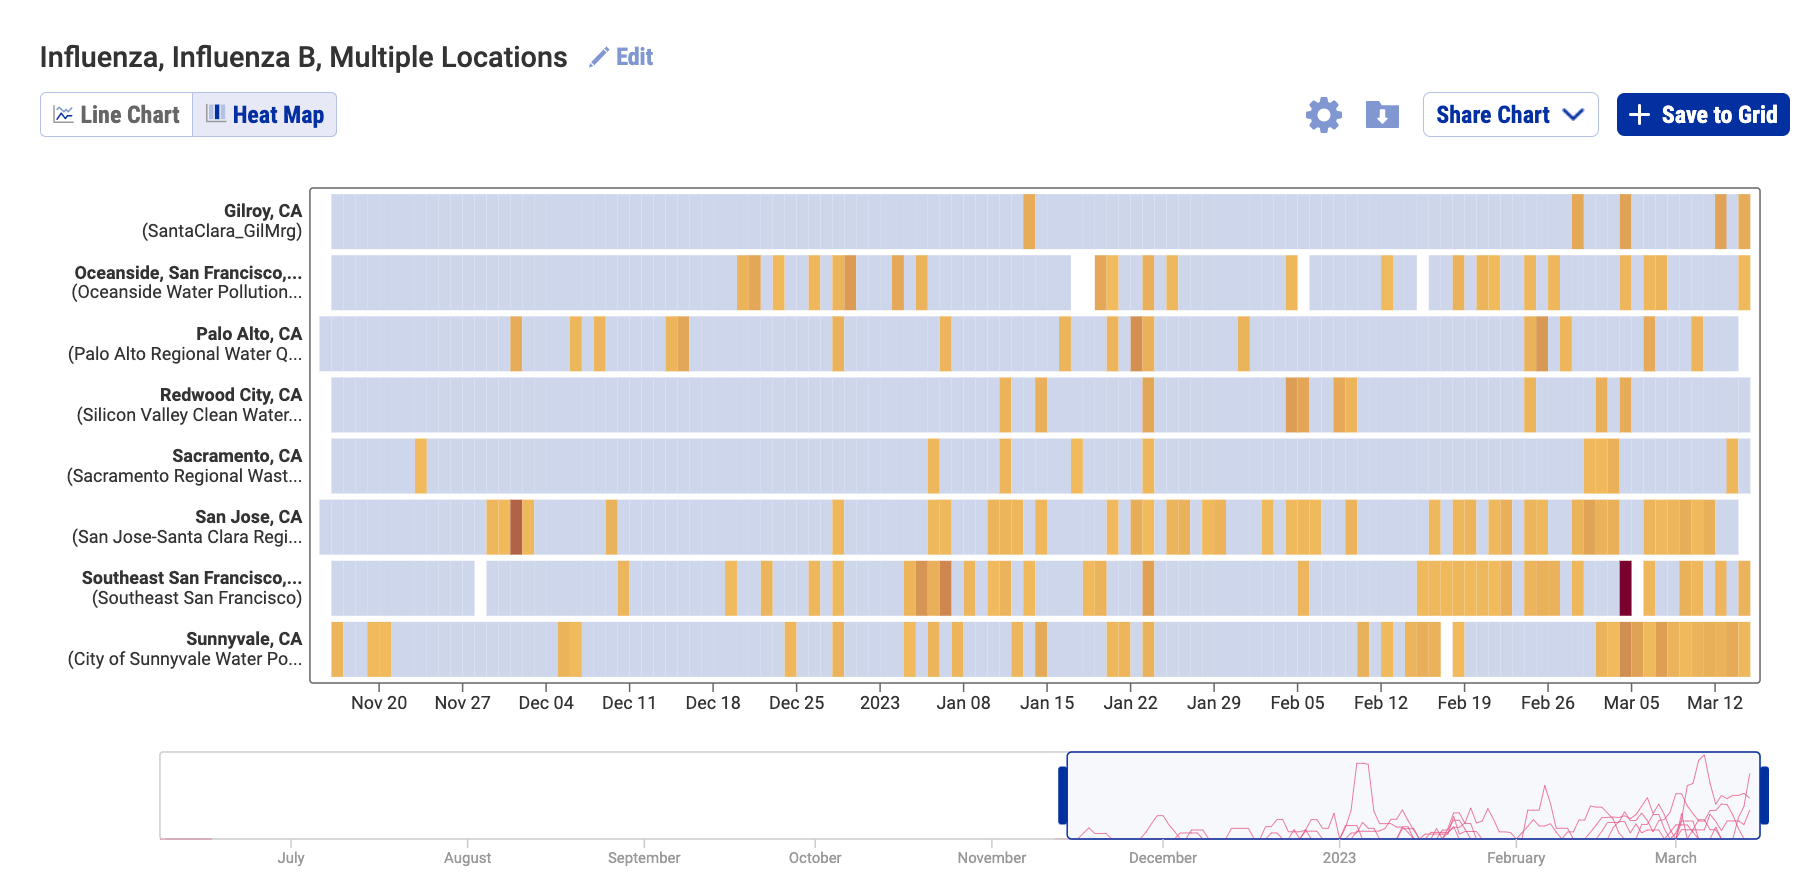
Influenza B (IBV) RNA continues to be sporadically detected at low concentrations at the SCAN plants. The frequency of detection of IBV RNA is increasing in recent week at Sunnyvale a well as the two plants in San Francisco. However, concentrations are still low (less than 5000 copies/g). A heat map is shown below of the IBV RNA concentrations at the SCAN plants. Each plant is represented by a row (y-axis), and dates are shown along the x-axis. Blue indicates a non-detect, and darker orange/red is proportional to concentration with the highest values being darkest. A white means no sample was collected. Here is the link to the heat map chart - the linked chart will update automatically as more data are added to the site.
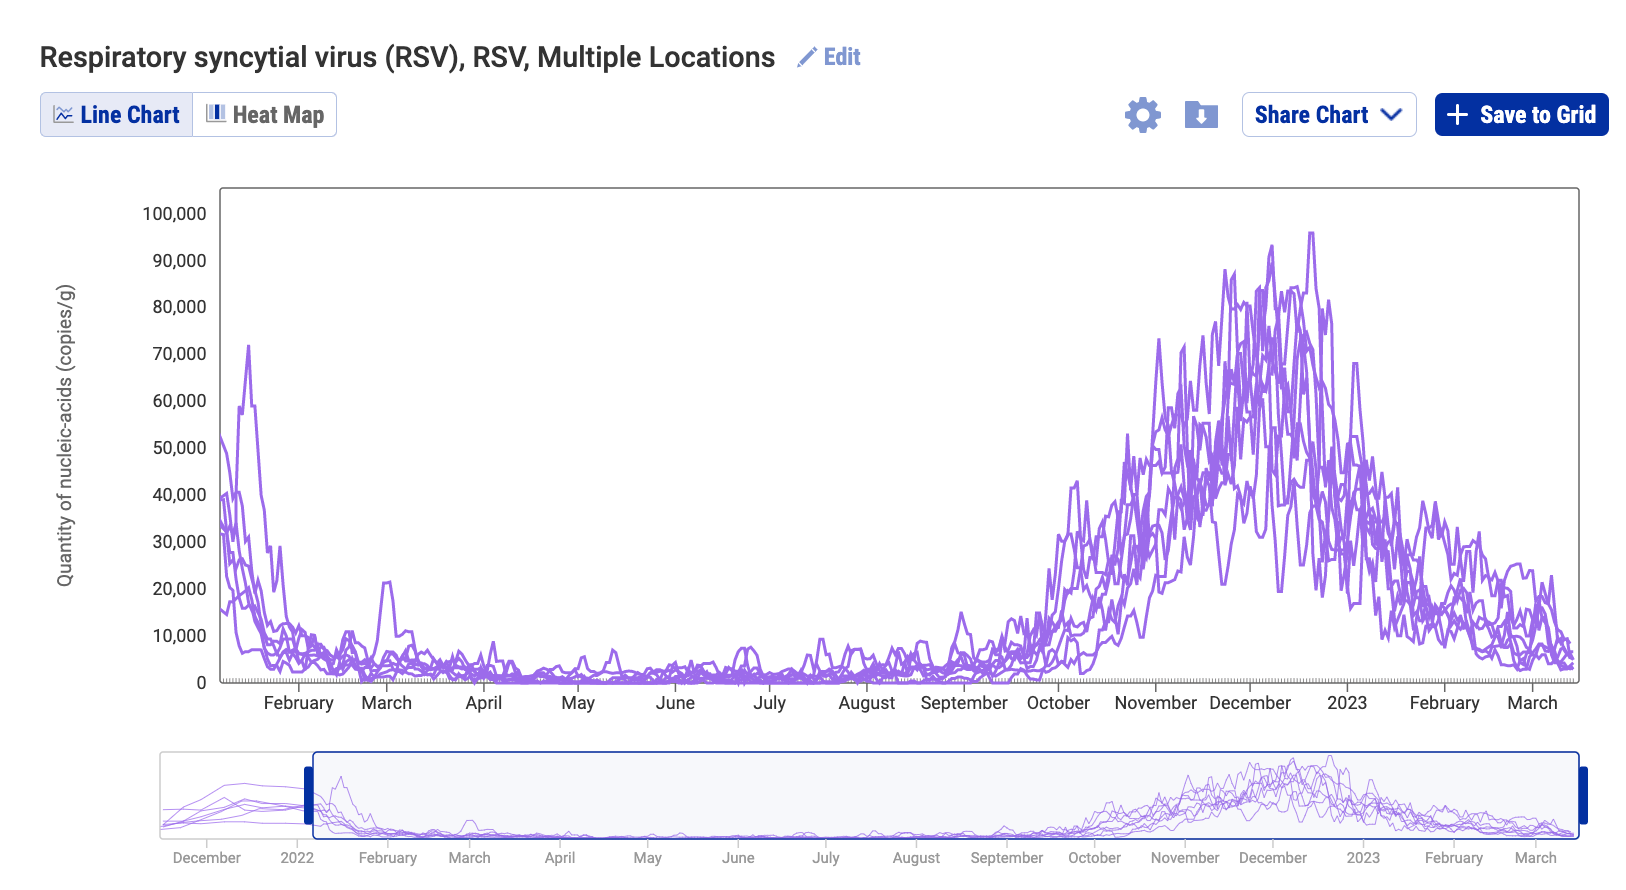
RSV RNA concentrations have decreased from their highest levels but concentrations remain detectable at concentrations between 1,000 - 10,000 copies/gram on all SCAN sites. This plot shows data from all the SCAN sites together and can be access here. We have over a year's worth of data.
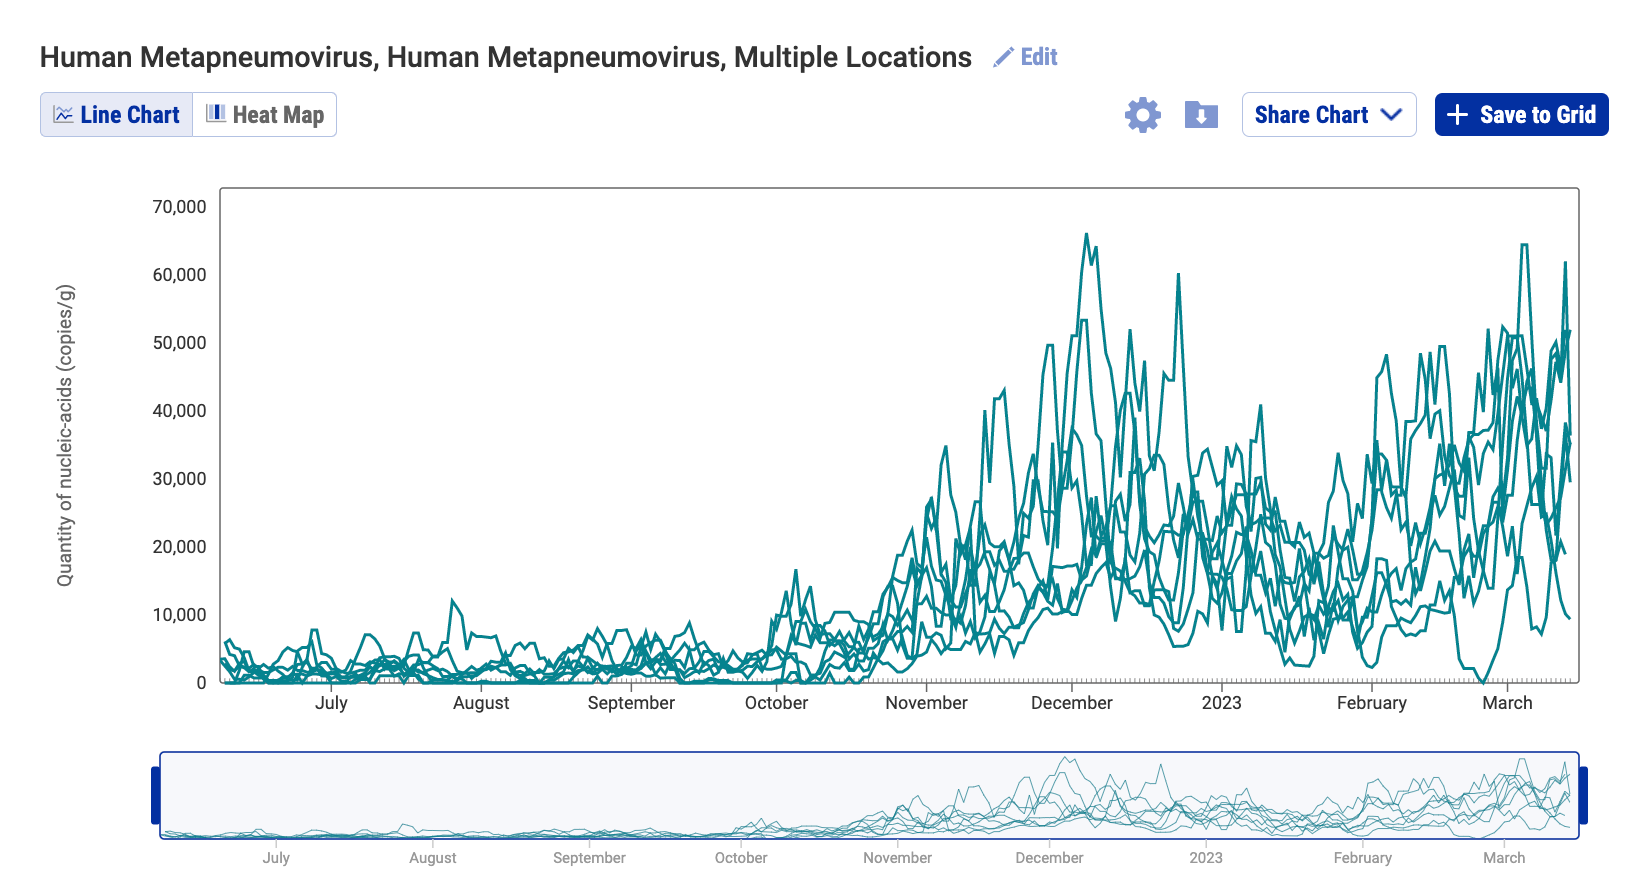
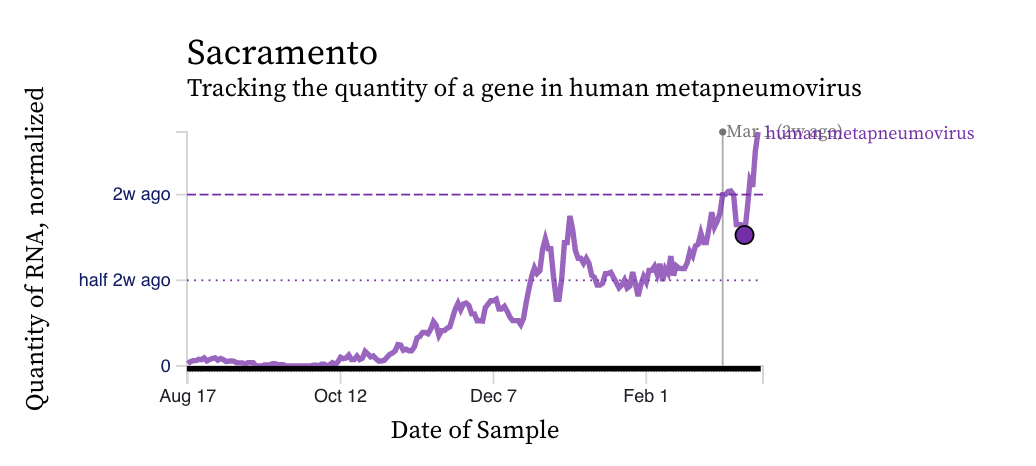
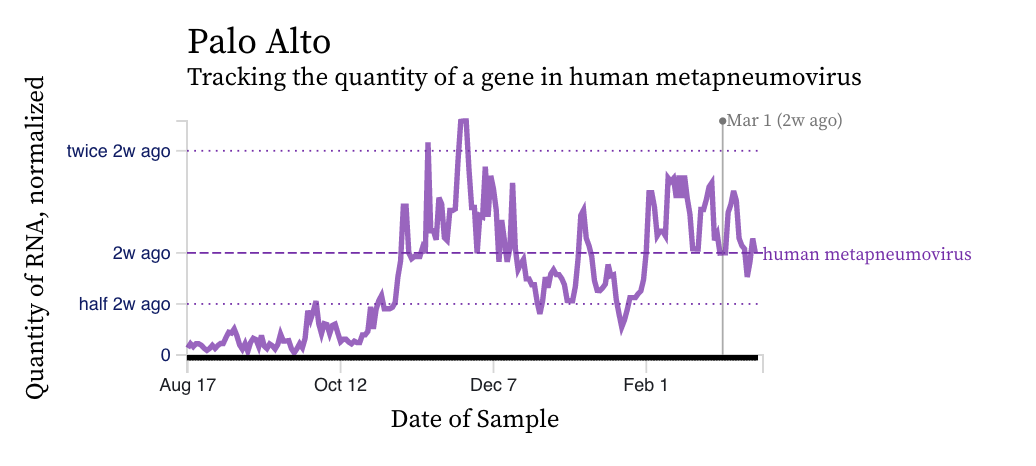
HMPV (human metapneumovirus) RNA concentrations have increased at a number of plants over the last 2 weeks, yet have remained constant at others. Below are charts showing data from all the SCAN plants together (link here to this chart if you want to interact with it), Sacramento showing relatively high concentrations and an increasing trend, and Palo Alto with relatively high concentrations and a flat trend. The trends for this viral RNA is quite distinct from those for RSV and IAV RNA.
Norovirus
Assay detects human norovirus GII
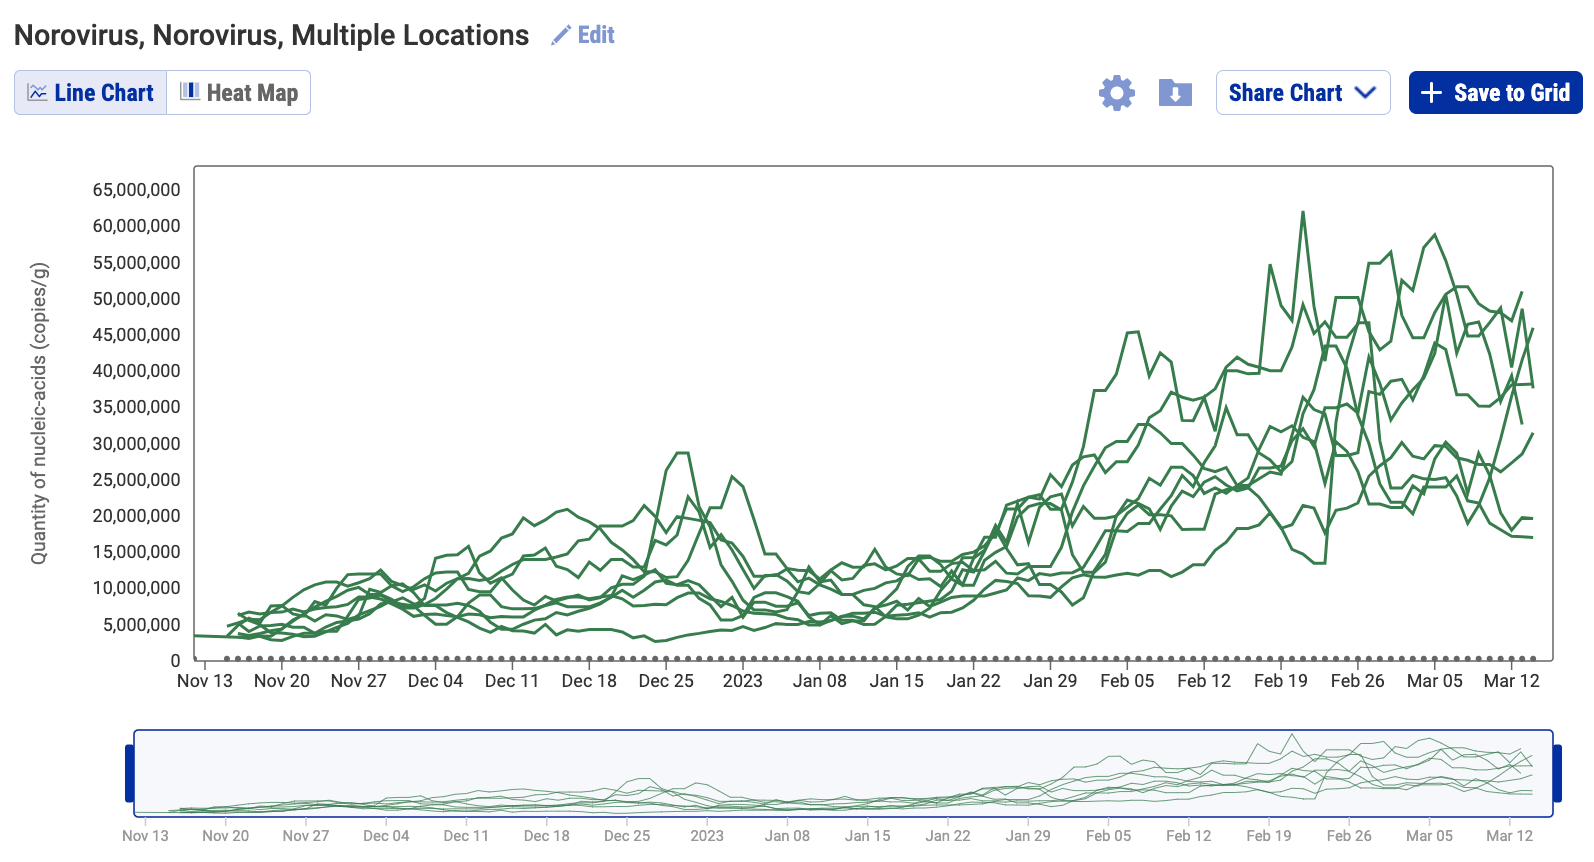
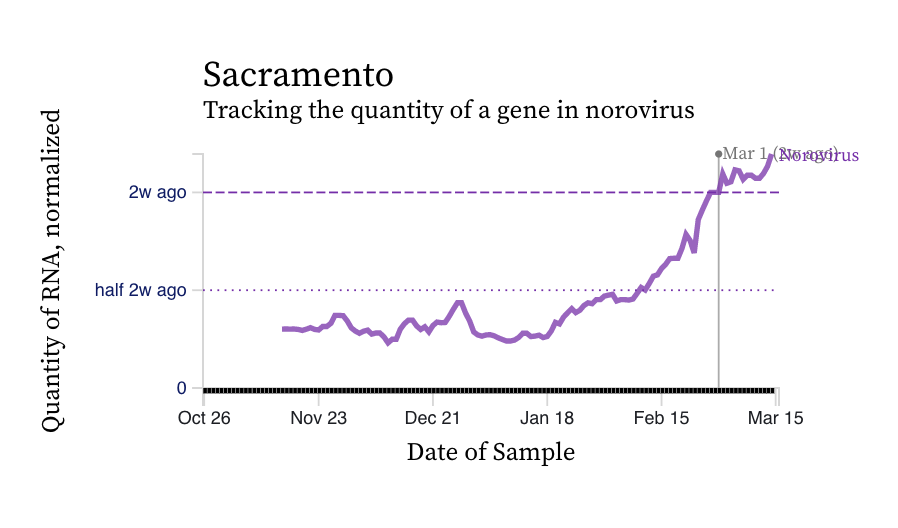
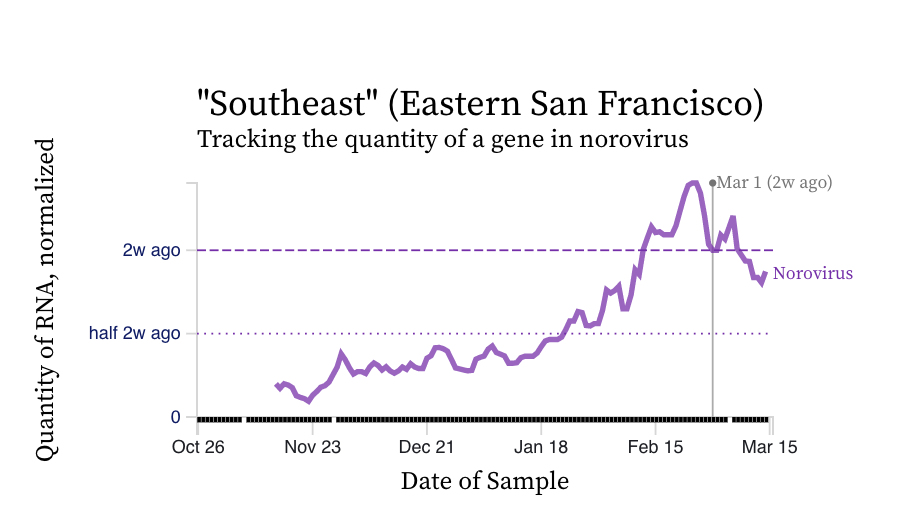
Norovirus GII RNA concentrations are trending upward visually at most plants. A chart of all the SCAN plants together is shown below, and then just Sacramento and Southeast. You can interact with the chart of all the plants at this link. In reading some of the literature on shedding, I learned that people with asymptomatic infections can shed just as much norovirus in their stool as those with symptomatic infections, and one study found a prevalence of 12% of people they tested (across a year, in the United Kingdom) were infected with norovirus with no symptoms.
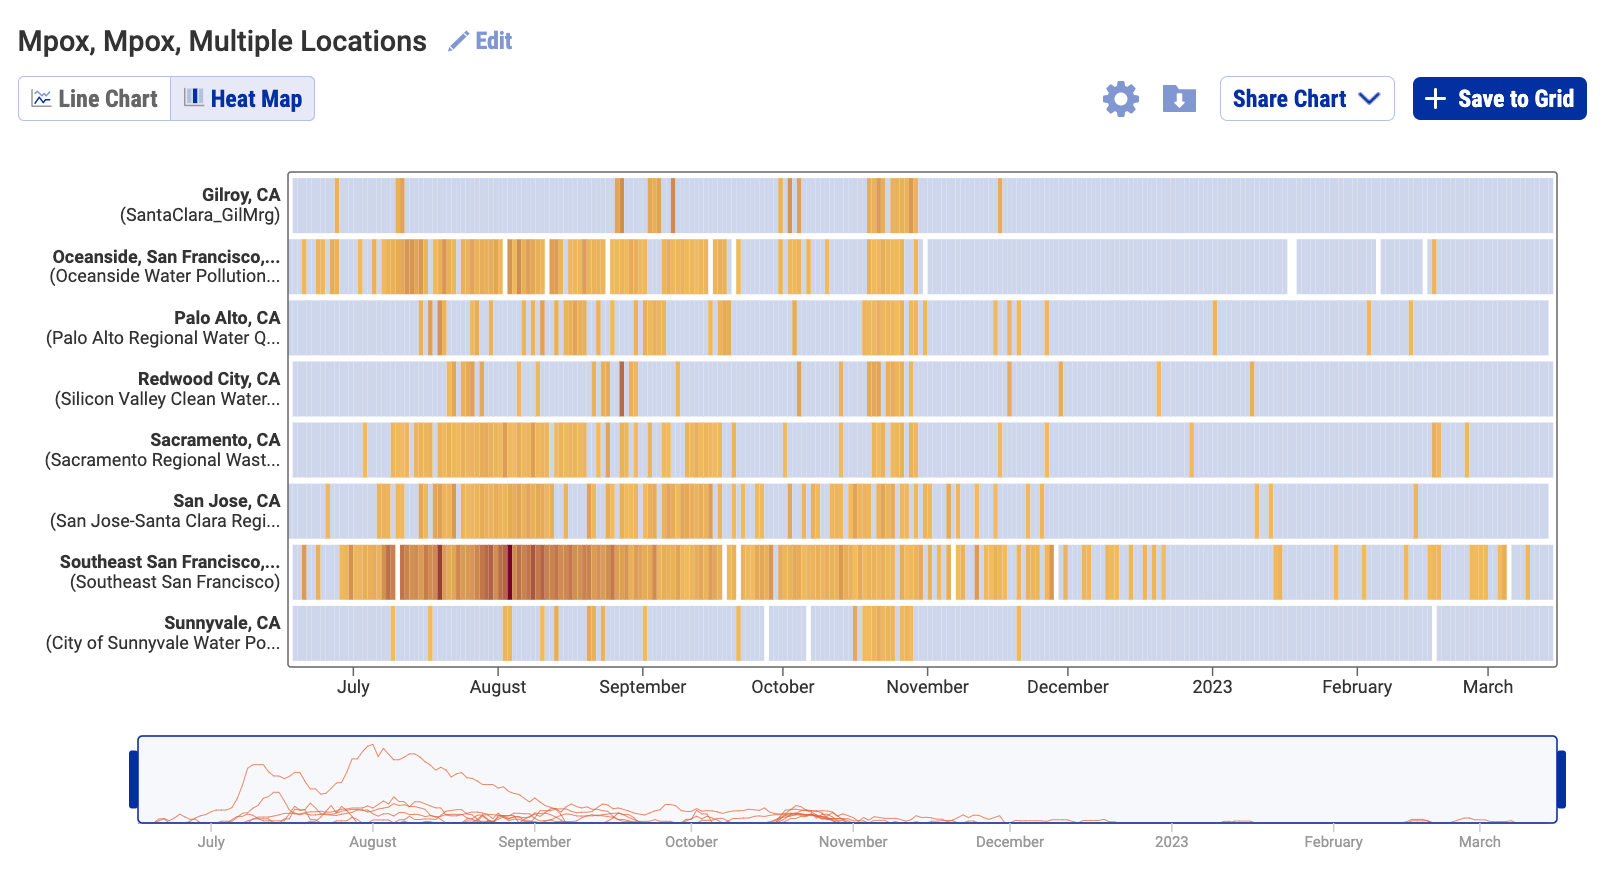
Mpox
We've seen non-detects in the past 2 weeks for MPXV DNA at most SCAN plants. The exception is Southeast San Francisco 3 of the last 13 samples in the (approximately the last 2 weeks) have had detection. This heat map shows all the SCAN sites as a row, and each date as a column. The color blue means the sample was non-detect for MPXV DNA and the colors get darker with higher concentrations. This chart highlights that we rarely have detections of MPXV DNA at these SCAN plants recently, but we can see how we had much more in the past. You can access this plot here.