
Georgia WWSCAN Biweekly Newsletter Update 2/16/24
Welcome to the bi-weekly update for WWSCAN partners in Georgia! The samples provided up through 2/12/24 have been processed in the lab and data are on the site at data.wastewaterscan.org.
If you notice any bugs on the site or have any comments about it, please continue to send your feedback via email wwscan_stanford_emory@lists.stanford.edu. We thank you for your partnership!
Infectious Disease Target Review
Currently monitoring a suite of Respiratory, Gastrointestinal and Outbreak Pathogens of Concern
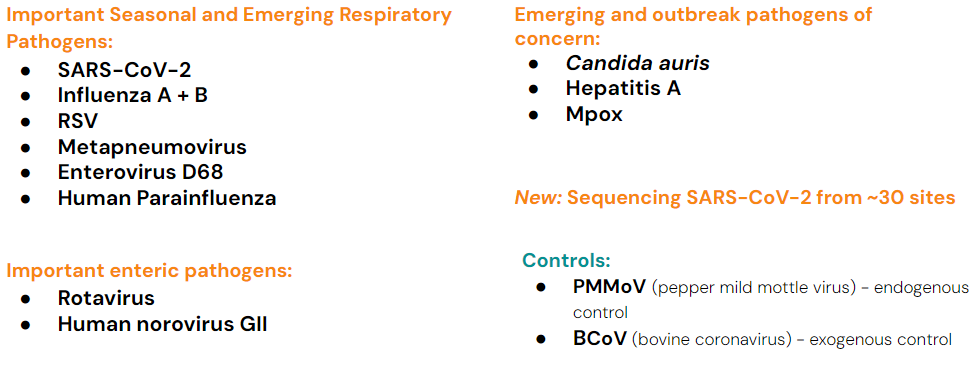
The methods for our assays are in the public domain and links for these are provided at the end of the newsletter.
COVID-19
SARS-CoV-2 concentration in wastewater and sequencing for variants
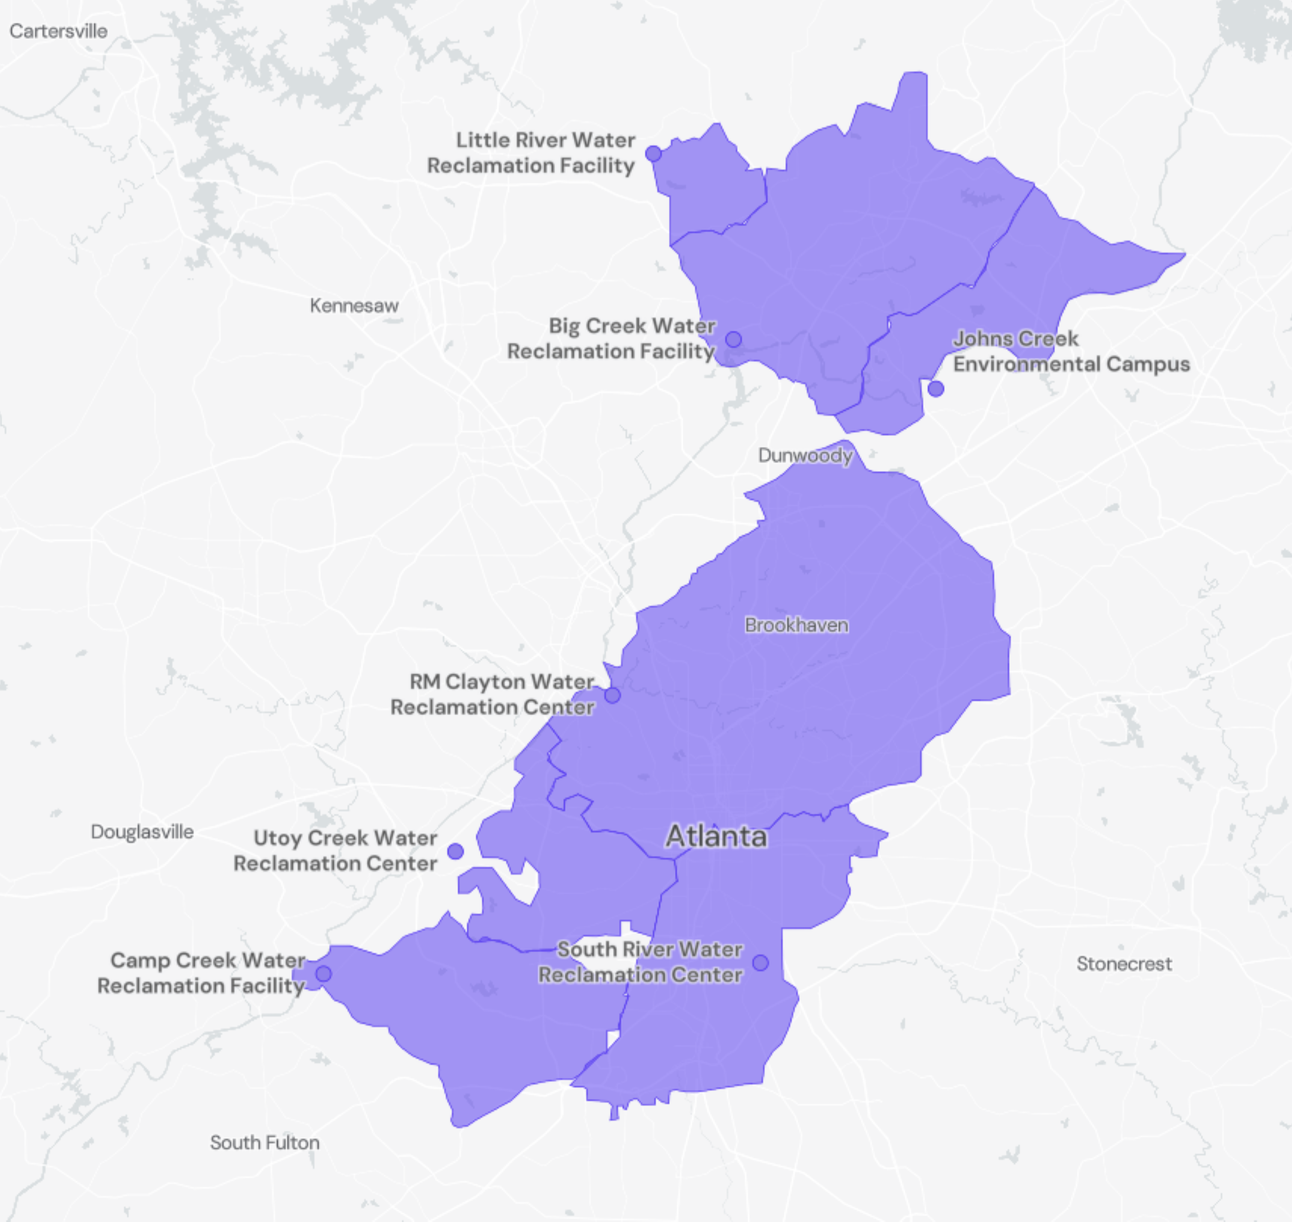
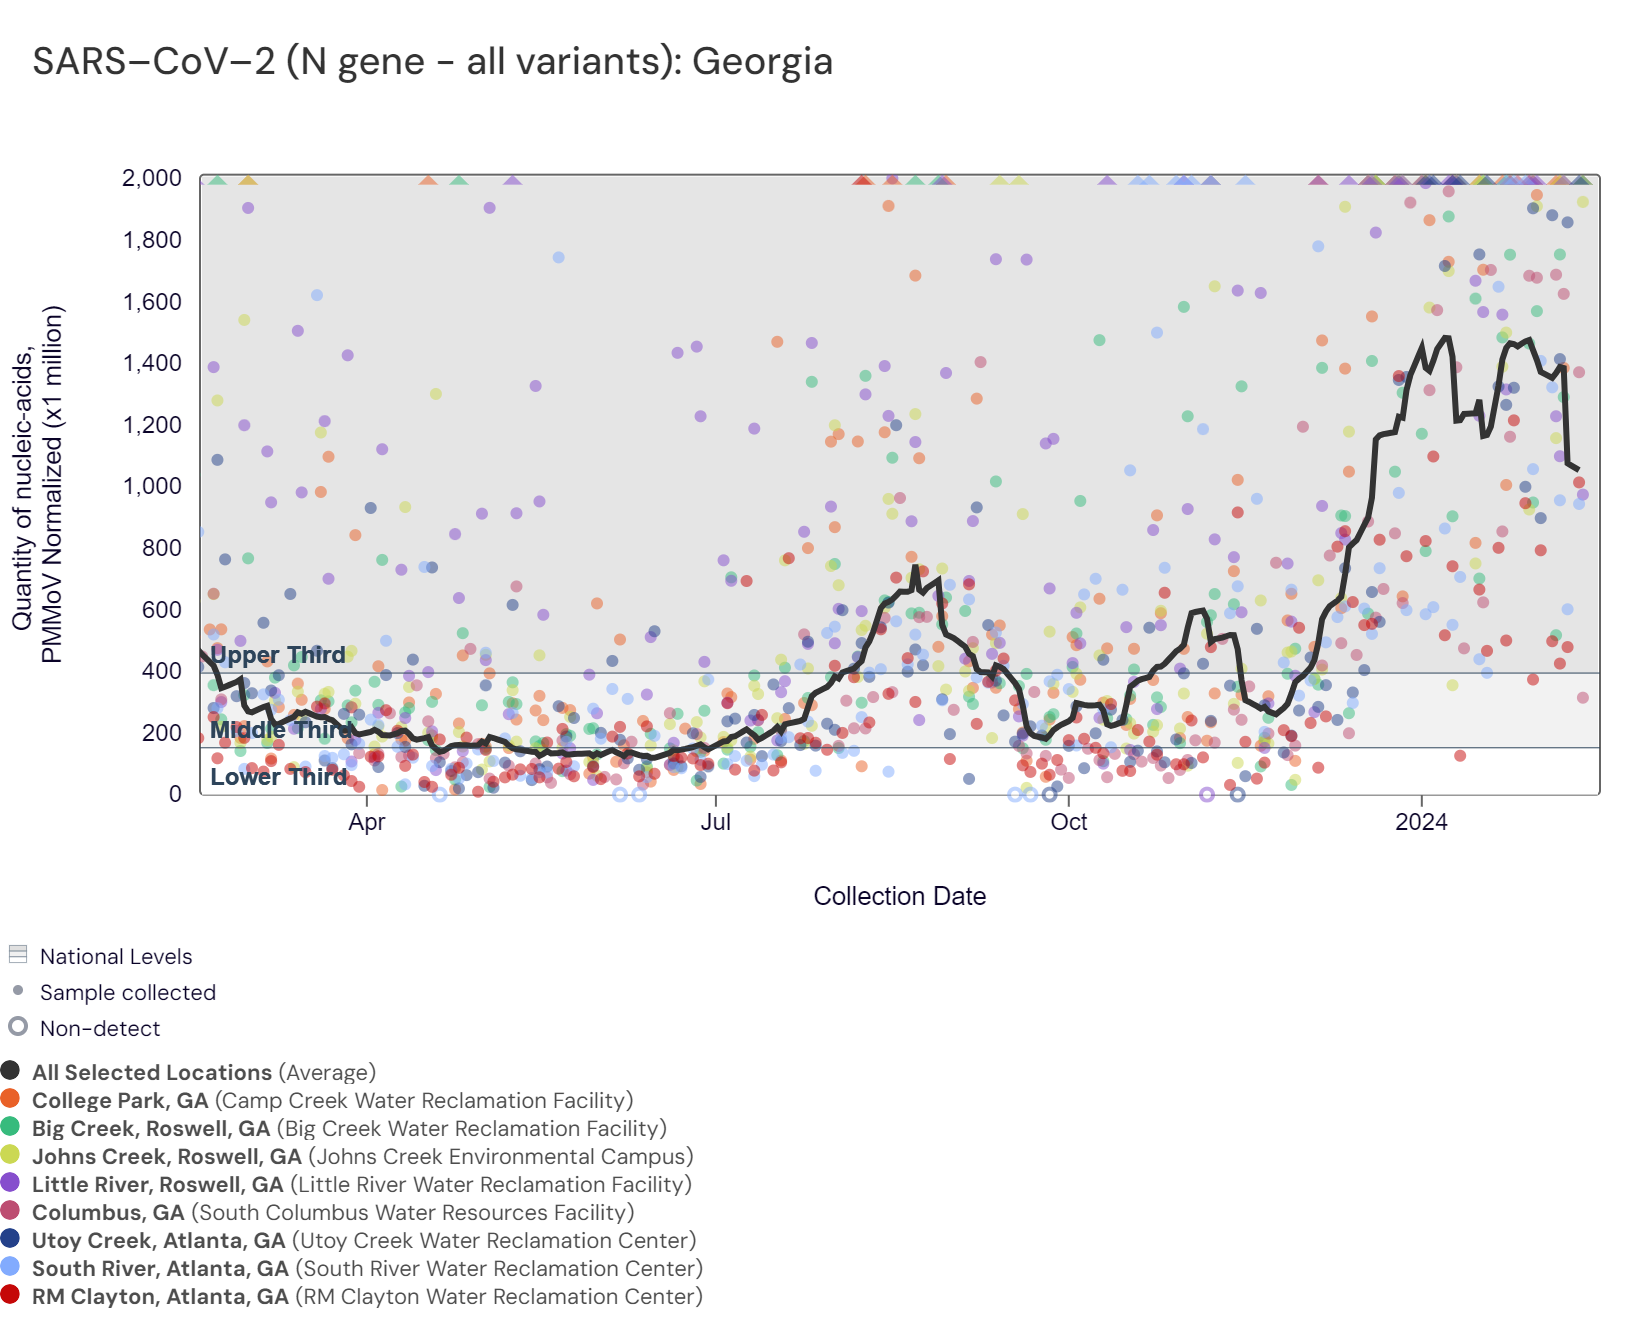
SARS-CoV-2 RNA concentrations have been between 72,000 and 890,000 copies/gram in the last two weeks. The chart below shows the raw data over the last 365 days and the population-weighted aggregated trend line for all 8 Georgia sites when the data is normalized by PMMoV. The aggregated line and the National Levels benchmarks illustrate that SARS-CoV-2 N gene RNA concentrations among Georgia sites are within the upper third level of all concentrations measured in the last year. As of 2/16/24, RM Clayton, College Park, Columbus, Little River, Utoy Creek, South River, Big Creek, and Johns Creek are in the HIGH (8 sites) category.
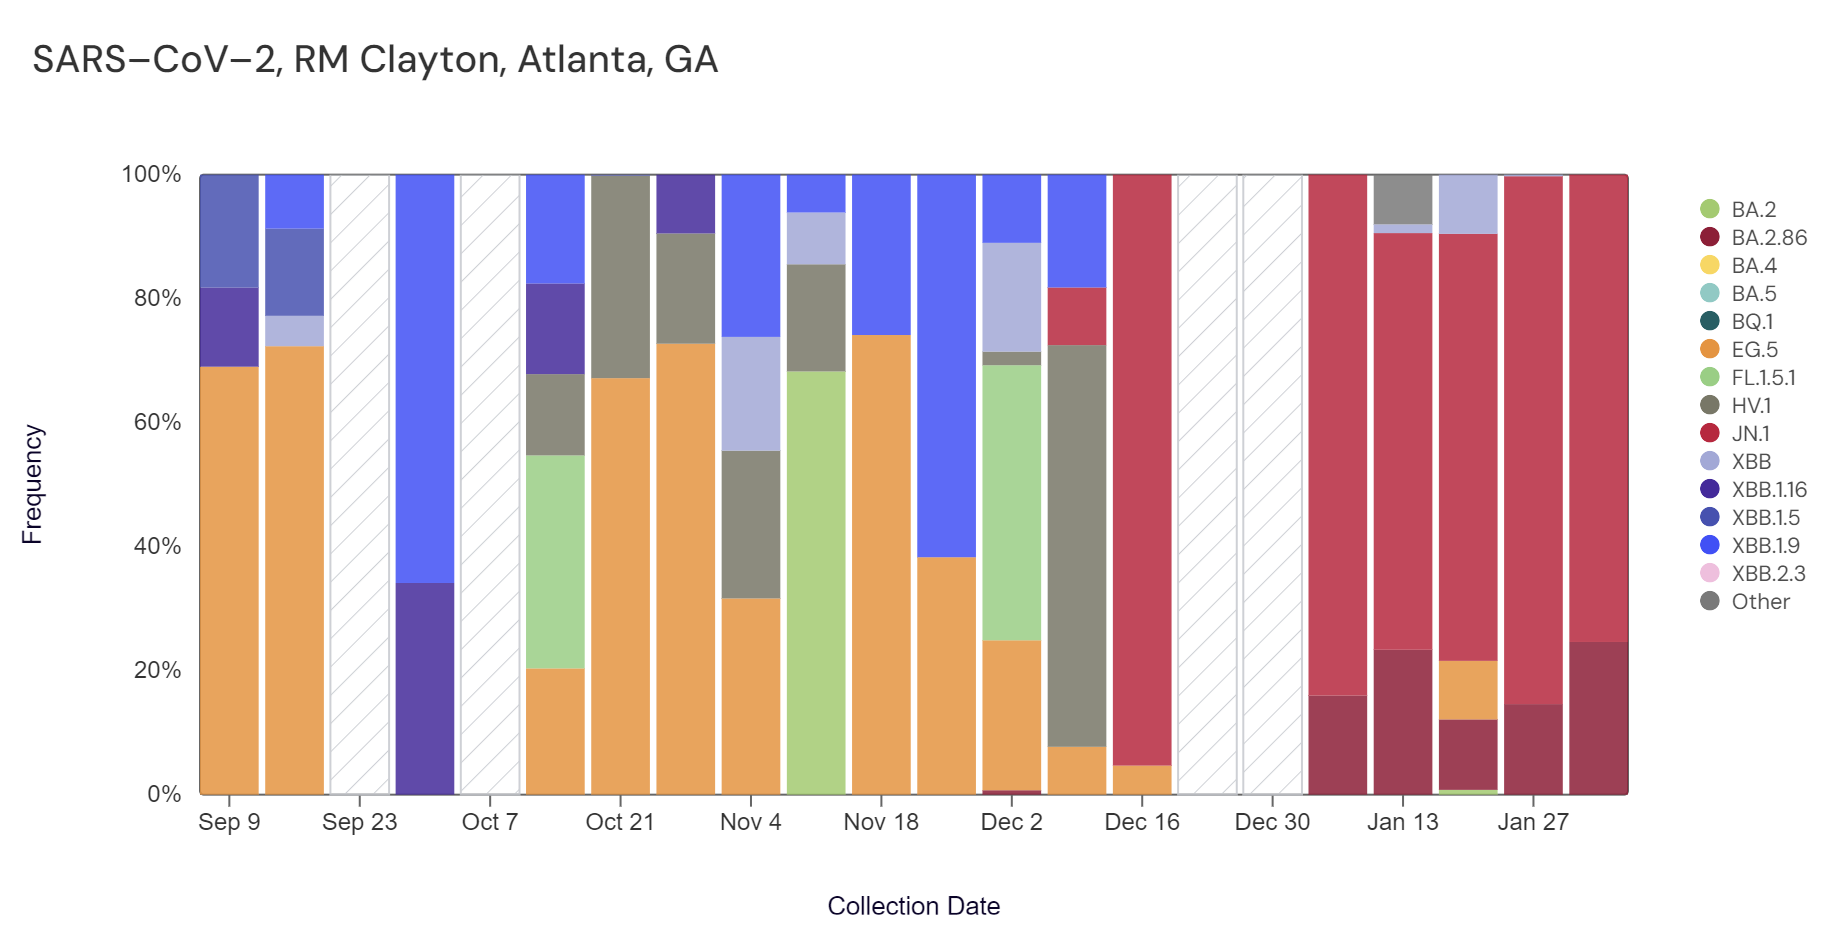
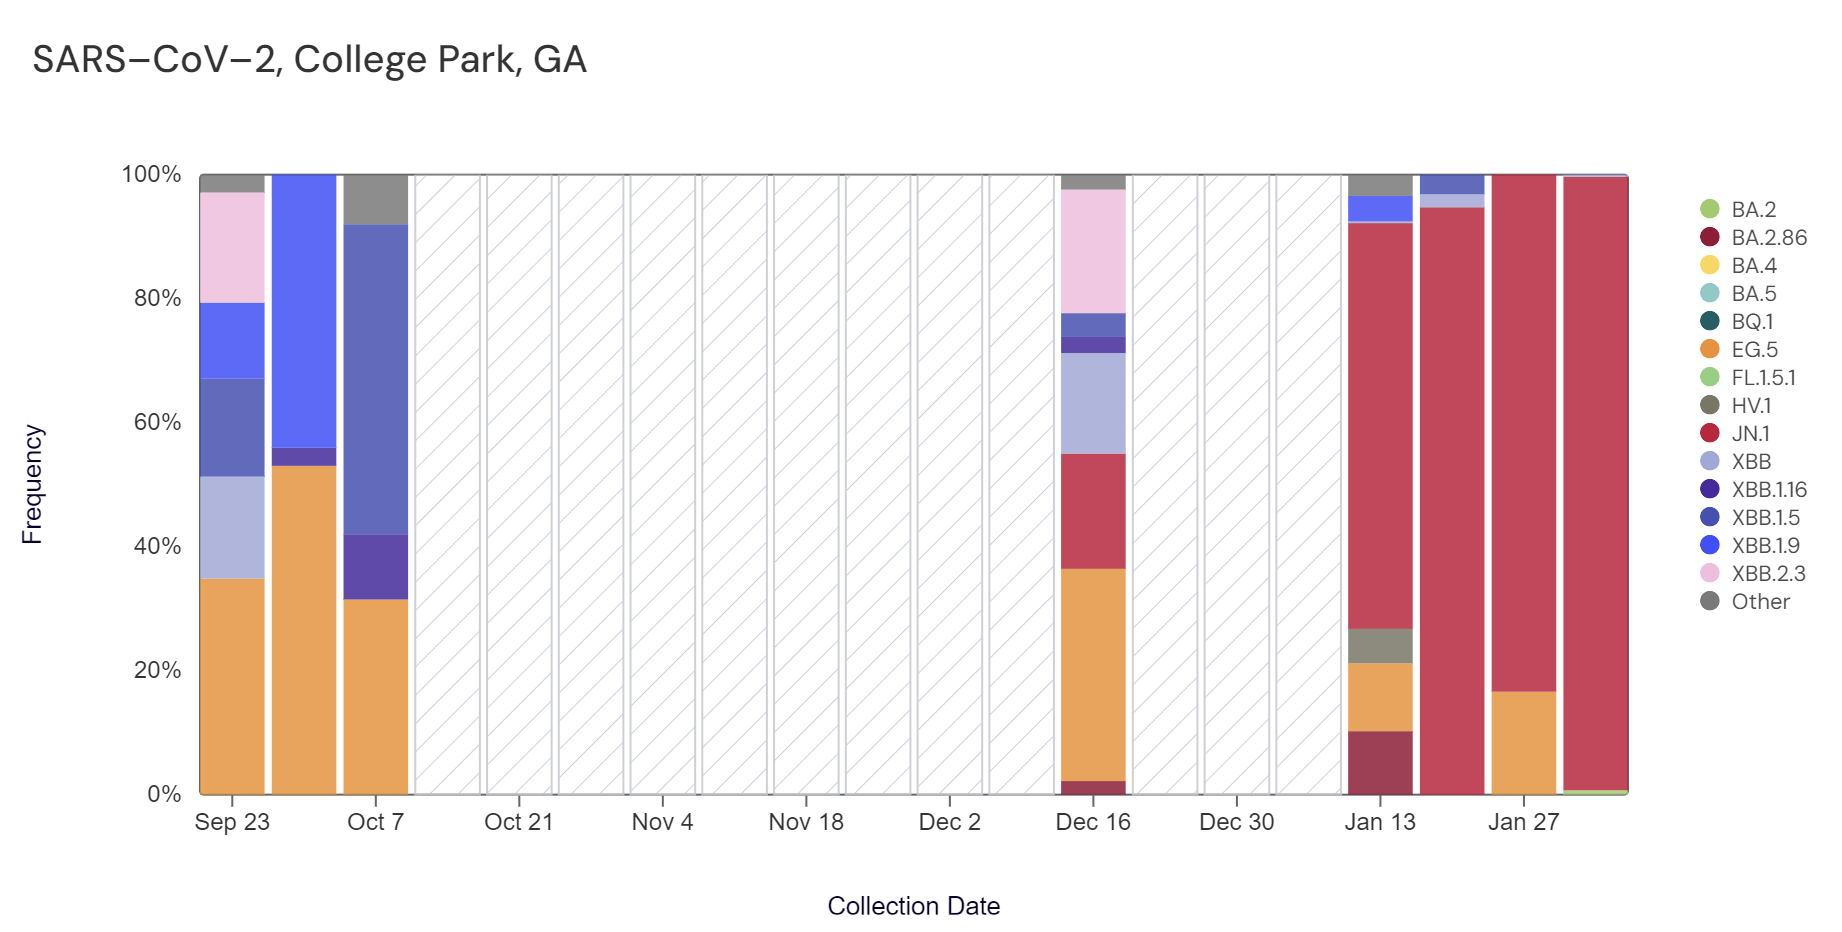
Sequencing of SARS-CoV-2 from wastewater is available for RM Clayton and College Park (Camp Creek). The plots below show the relative proportions of different variants inferred from sequencing the entire genome of SARS-CoV-2 (Note: the sequencing variant plots are now available on the website, so the plots that are shown below are linked above if you want to interact with them). Results are based on sequencing of 2 samples per week, combined to provide a weekly value. Please note that the large gap of "no data" for College Park is because we had data available from preliminary testing while finalizing site selection for sequencing, and then began weekly sequencing in the middle of December.
In the most recent samples, JN.1 (bright red) made up the largest proportion of the lineages detected at both sites (75.4% at RM Clayton, and 98.9% at College Park). Note that the most recent data are from two weeks ago (through Feb 3); sequencing data are always from samples taken between 1- 2 weeks ago.
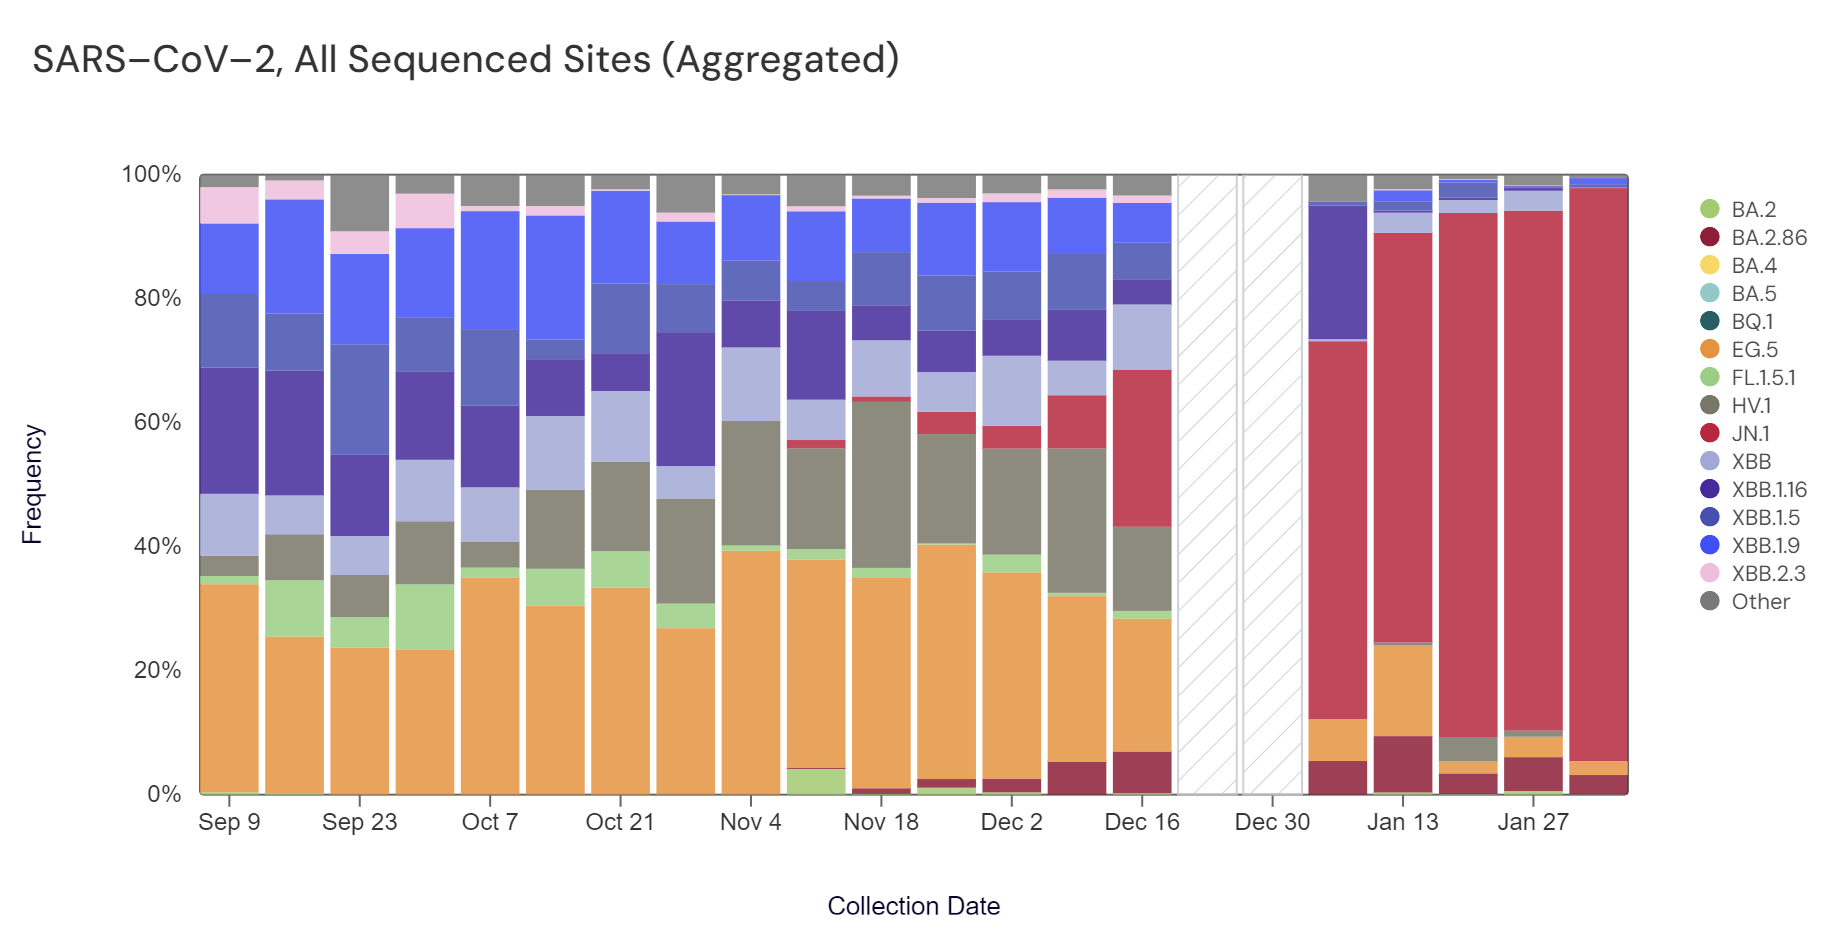
Sequencing data is now also available in aggregate across all sites in WWSCAN with sequencing data. That plot is shown below and also suggests that JN.1 is the most abundant variant across all sites (92.4%).
Other Respiratory Pathogens
Influenza A and B, Respiratory Syncytial Virus, Human metapneumovirus, Human Parainfluenza & EV-D68
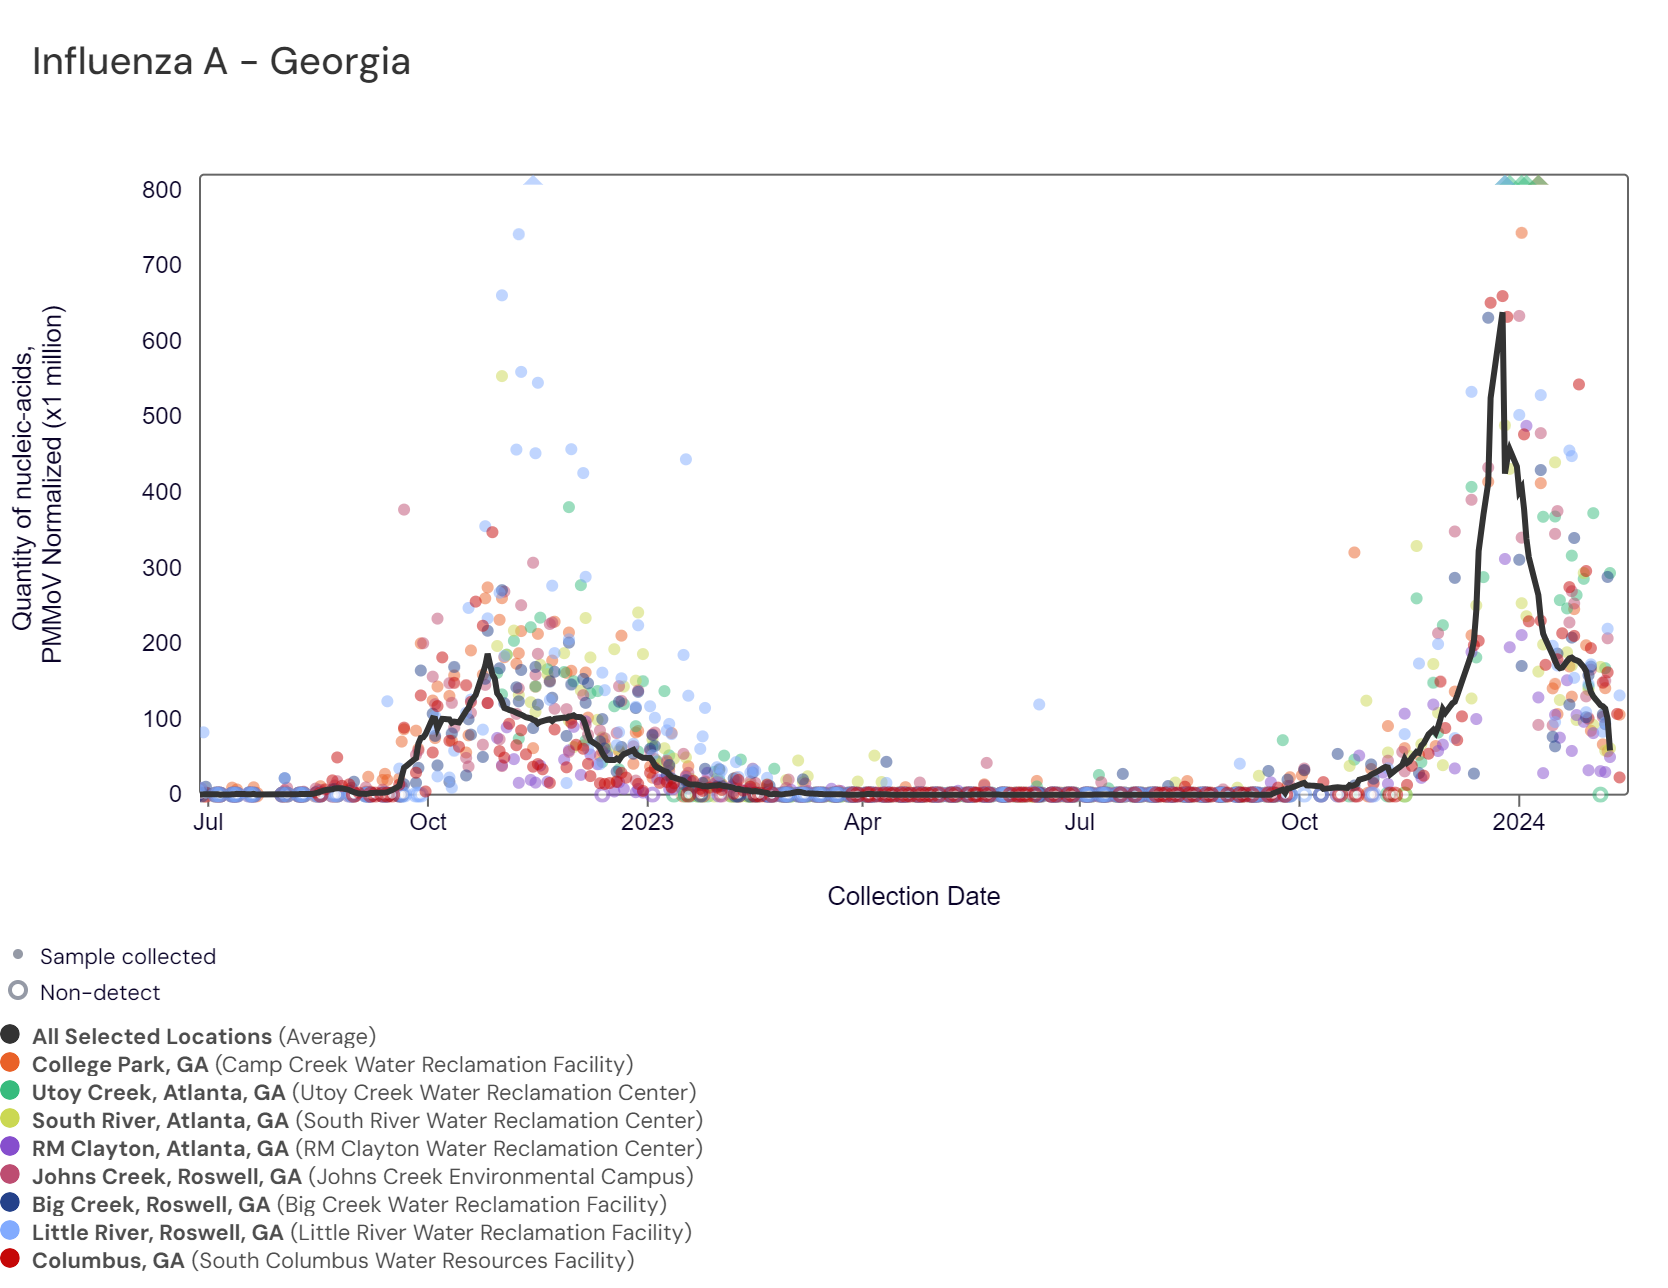
Influenza A: The reanalyzed retrospective data (between Oct 1st, 2023 ~ Jan 11th, 2024) is now available on the website. IAV RNA concentrations have been between 7,500 and 79,000 copies/gram in the last two weeks. The chart below shows the raw data and the population-weighted aggregated trend line for all 8 Georgia sites when the data is normalized by PMMoV. It appears the recent influenza A peak in wastewater was higher than the peak in fall/winter 2022. As of 2/16/24, all Georgia sites have had an onset of IAV in wastewater and are in the HIGH (8 sites) category. IAV RNA wastewater concentrations in the Southern region are high with an upward trend over the last 3 weeks.
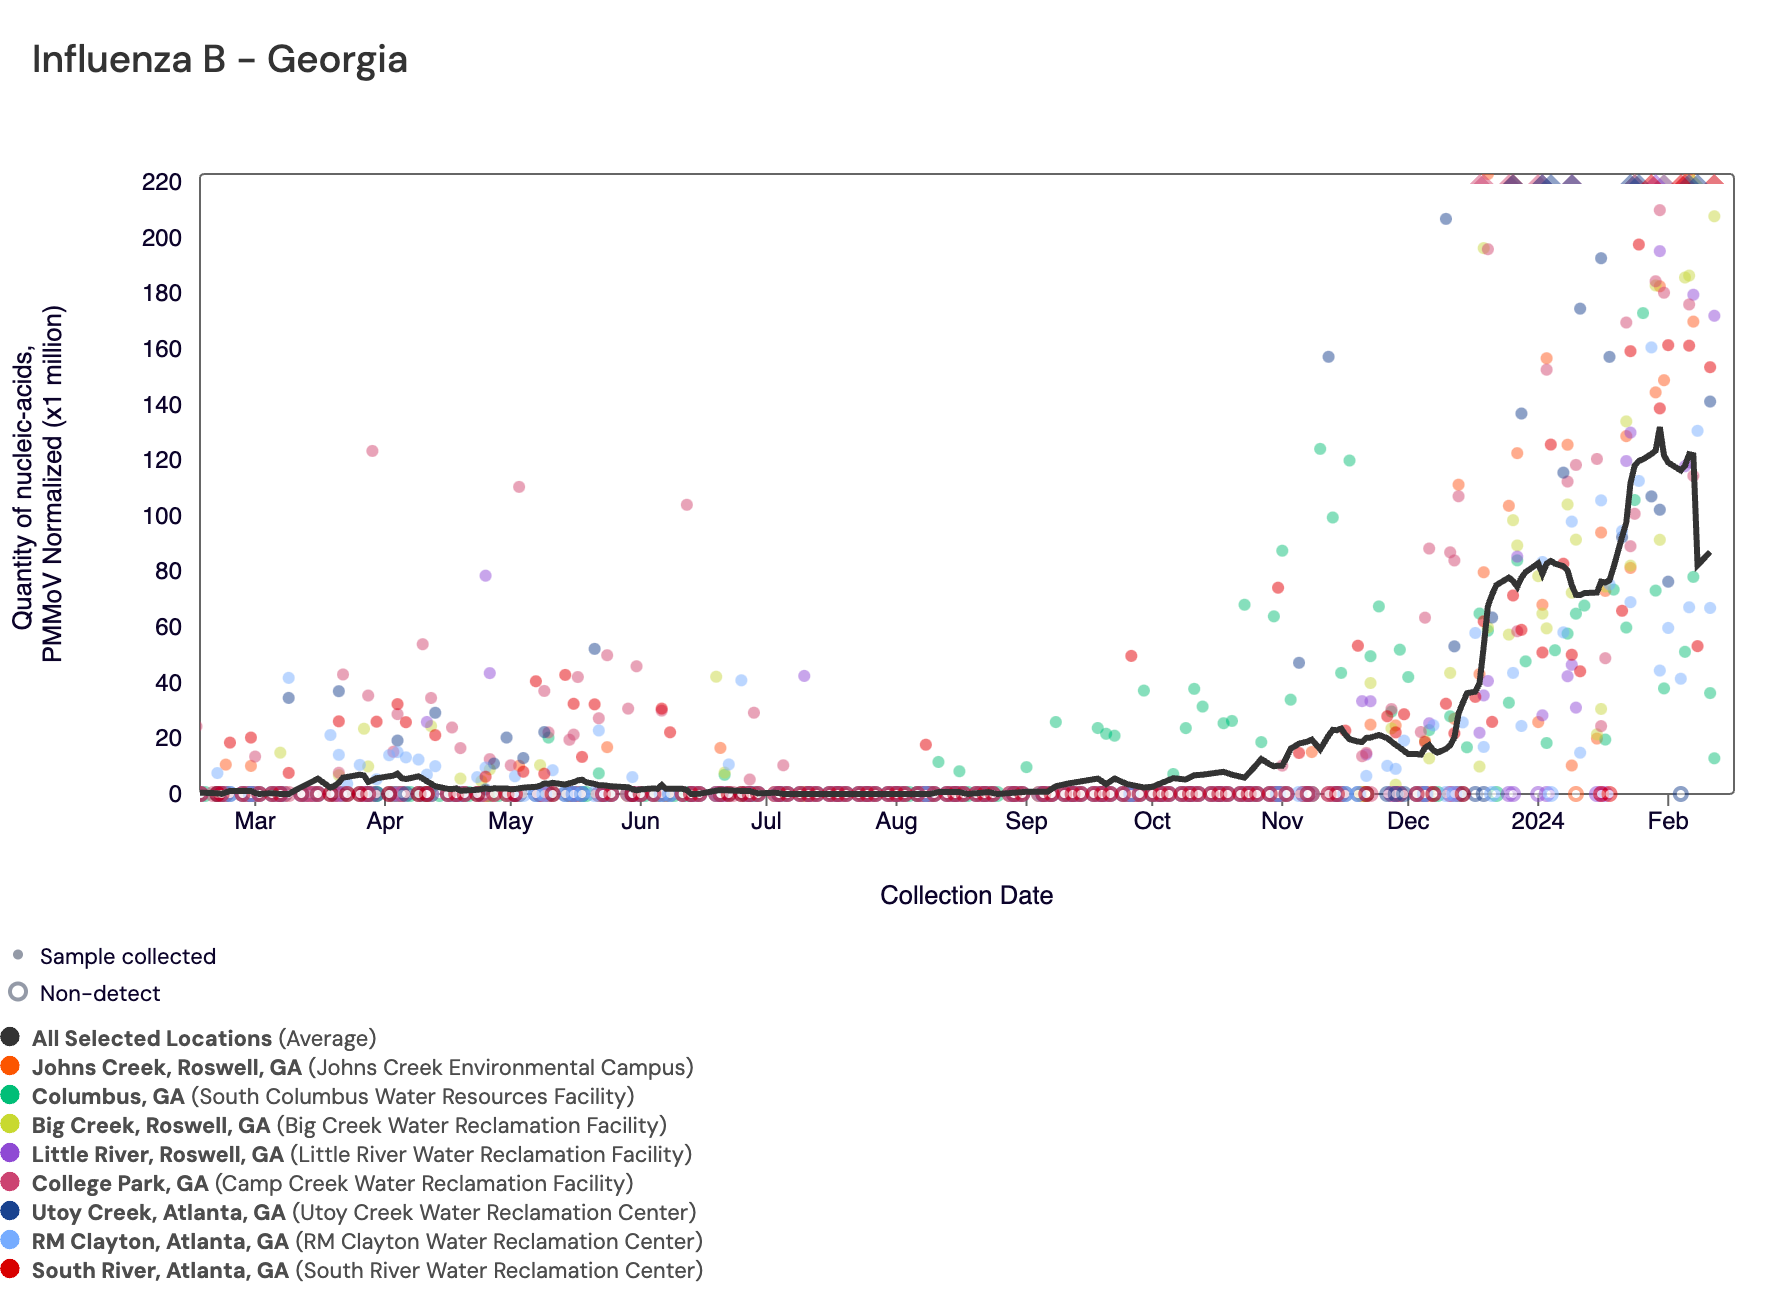
Influenza B (IBV) RNA has been frequently detected at all Georgia sites at low up to high concentrations over the last several months. IBV RNA concentrations are below 78,000 copies/gram. As of 2/16/24, all Georgia sites have had an onset of IBV in wastewater and are in the HIGH (8 sites) category. IBV RNA wastewater concentrations in the Southern region are also high but with a downward trend over the last 3 weeks.
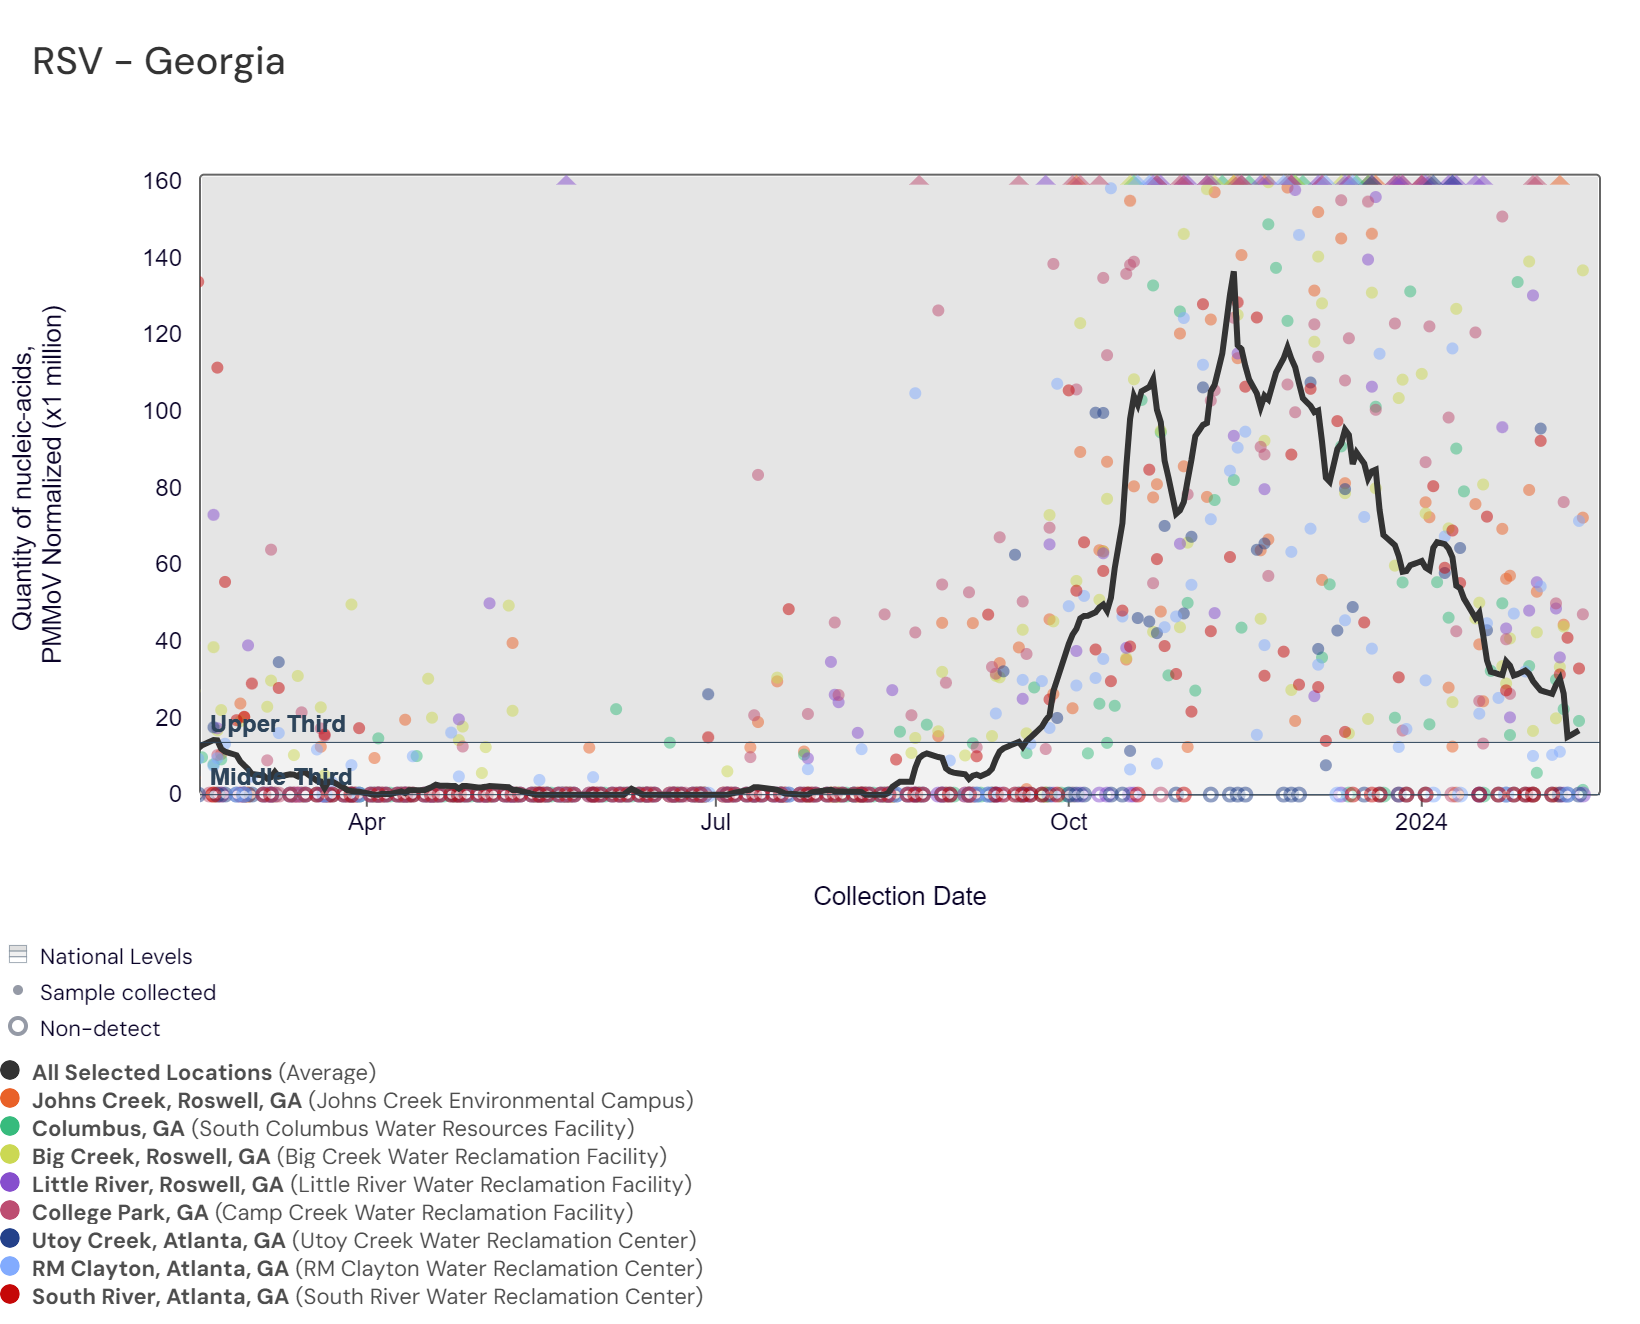
Respiratory syncytial virus (RSV) RNA concentrations were below 22,000 copies/gram over the last two weeks. The chart below includes the raw data for each site since February 2023. The aggregated line below is within the dark shaded area, showing that RSV RNA concentrations among Georgia sites are within the upper third level of all concentrations measured in the last year. Levels are now approaching the middle level.
As of 2/16/24, Big Creek, College Park, Columbus, and Johns Creek are in the HIGH (4 sites) Wastewater Category. RM Clayton is in the MEDIUM (1 site) category. The rest of Georgia sites are in the LOW (3 sites) category, which includes Little River, South River, and Utoy Creek.
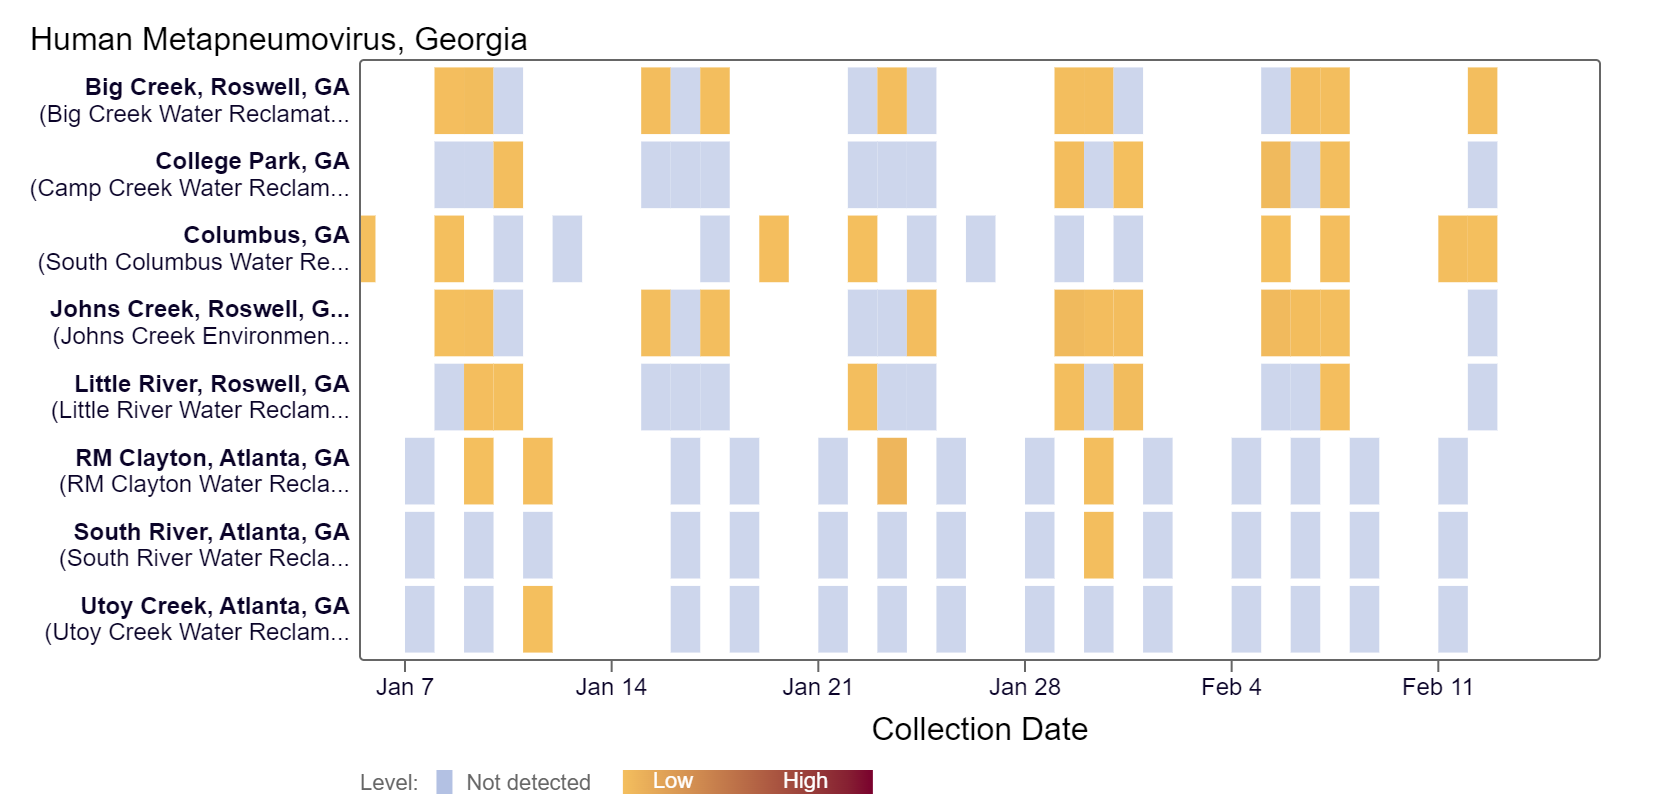
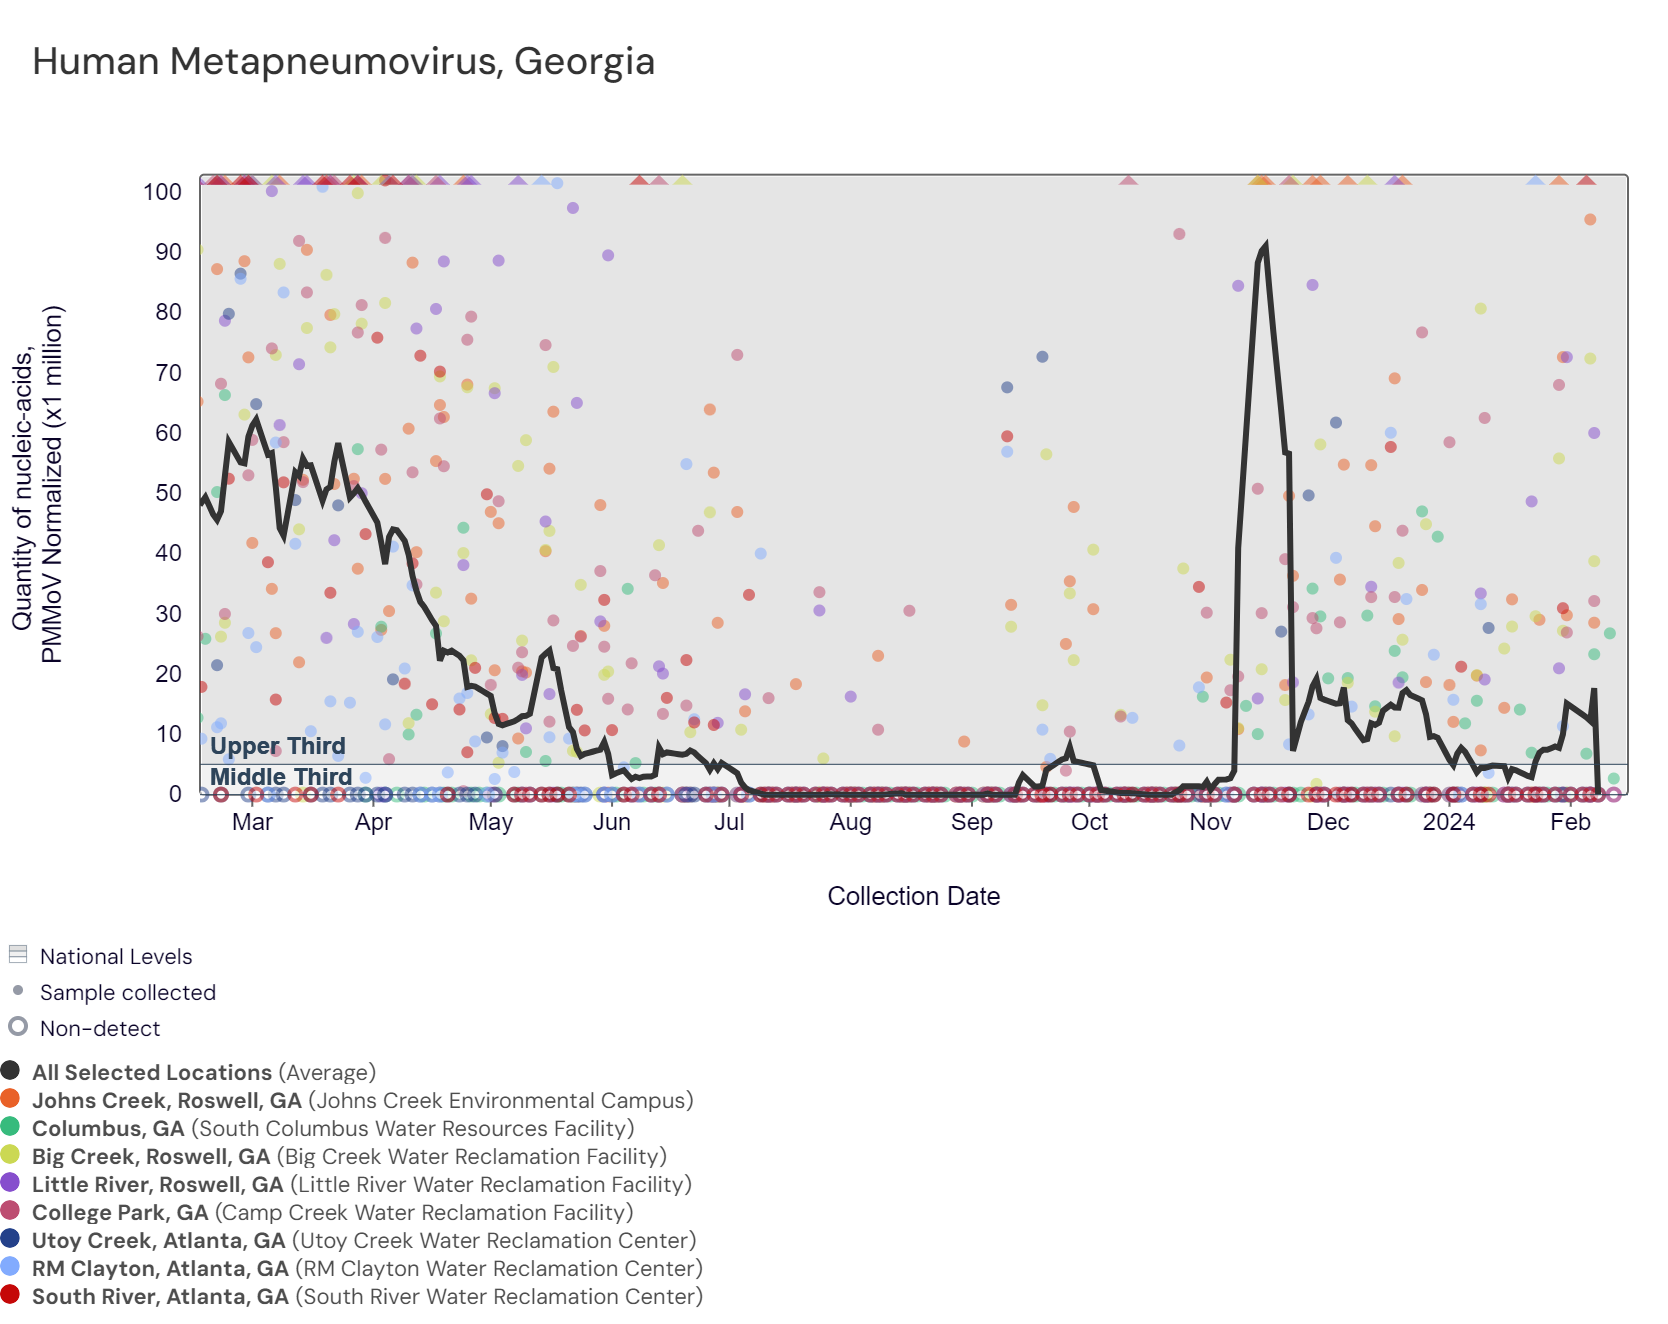
HMPV (human metapneumovirus) RNA concentrations in wastewater are below 21,000 copies/g. Based on the heat map below, HMPV is detected sporadically at some locations and has not been detected at Utoy Creek within the last two weeks. HMPV RNA concentrations in Georgia are much lower and have decreased to approach the middle third level of all concentrations measured in the last year. Most Georgia sites are in the LOW (7 sites) Wastewater Category, as of 2/16/24. Johns Creek has had a recent onset of HMPV in wastewater and is in the HIGH (1 site) category.
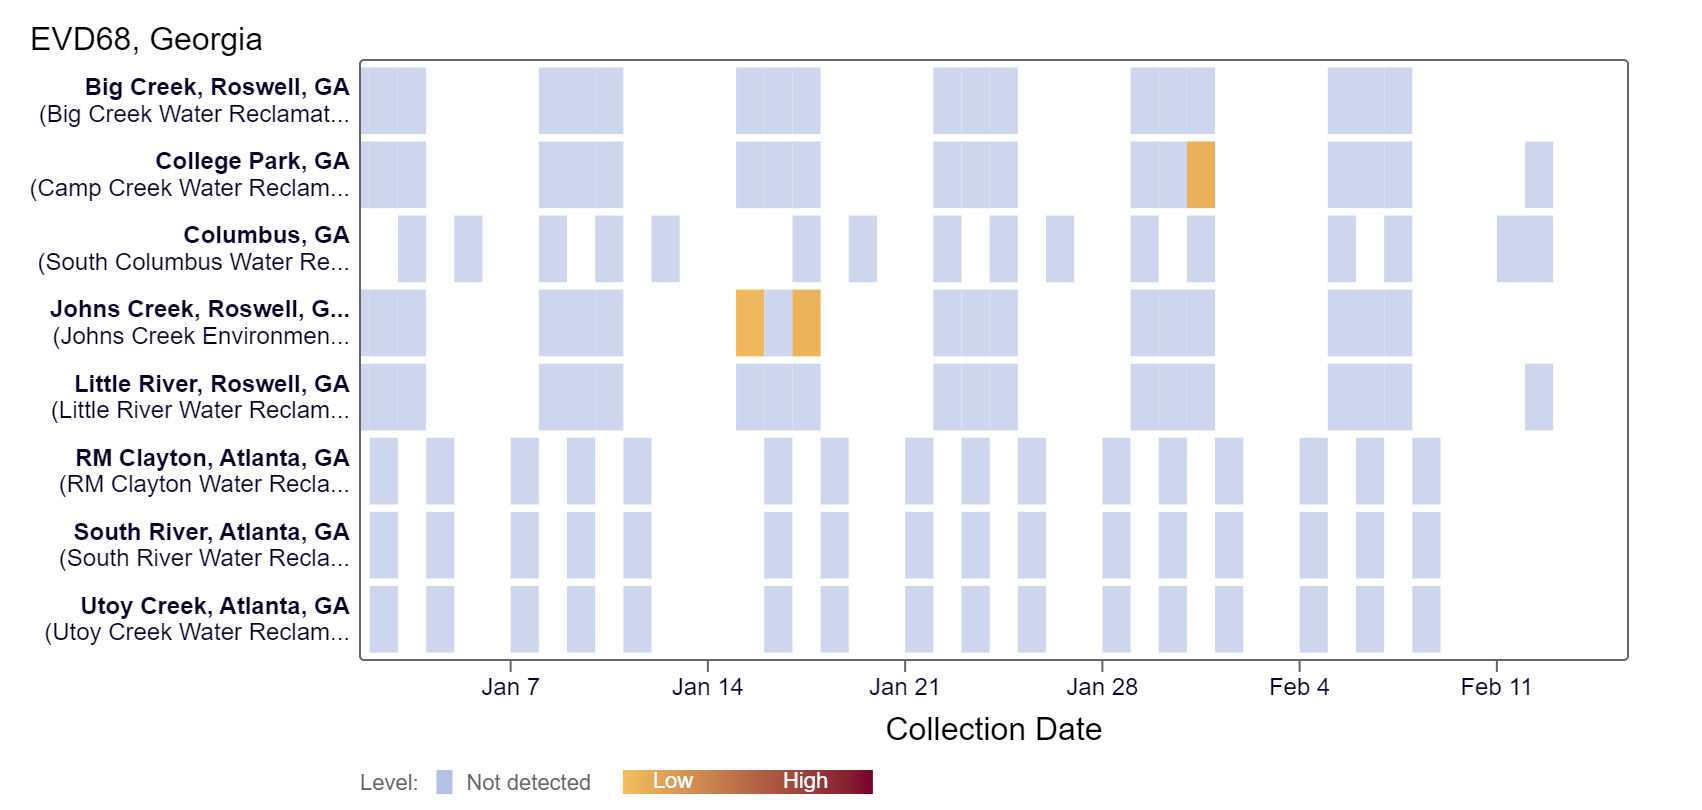
EV-D68 RNA detection continues to be rare at Georgia sites. Over the last two weeks, EV-D68 has only been detected at College Park, according to the heat map below. As a reminder, the color blue means the sample was non-detect for EV-D68 RNA and the colors get darker with higher concentrations. Because this is a newer target, there is no category assigned and we are still establishing what an expected baseline amount of detection will be.
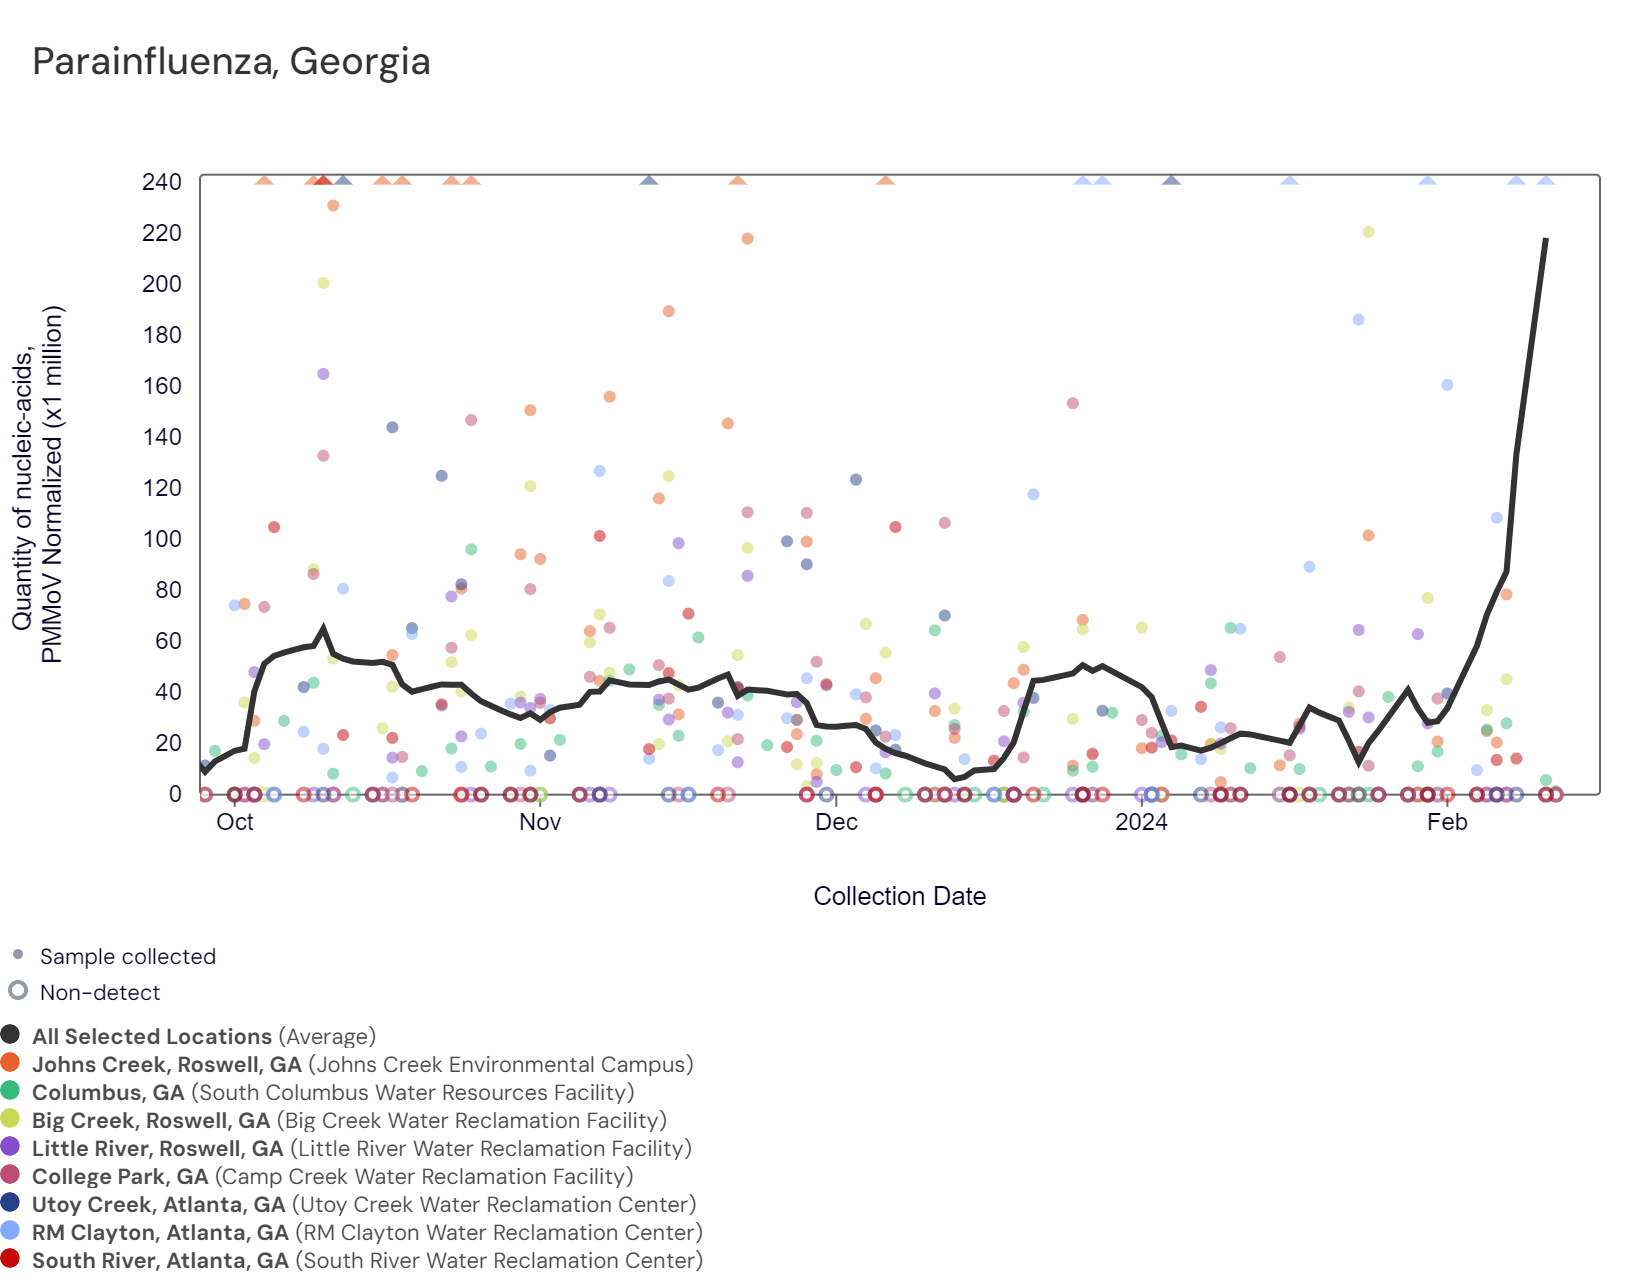
Parainfluenza RNA has been frequently detected at lower concentrations in samples collected from most Georgia sites. RM Clayton has detected parainfluenza at slightly higher concentrations in comparison to the other sites. Parainfluenza concentrations have been less than 81,000 copies/g. The chart below shows the raw data and the population-weighted aggregated trend line for all 8 Georgia sites when the data is normalized by PMMoV. The line depicts an increase in concentrations over the last two weeks. Because this is a newer target, there is no category assigned and we are still establishing what an expected baseline amount of detection will be.
Gastrointestinal Pathogens
Norovirus GII and Rotavirus
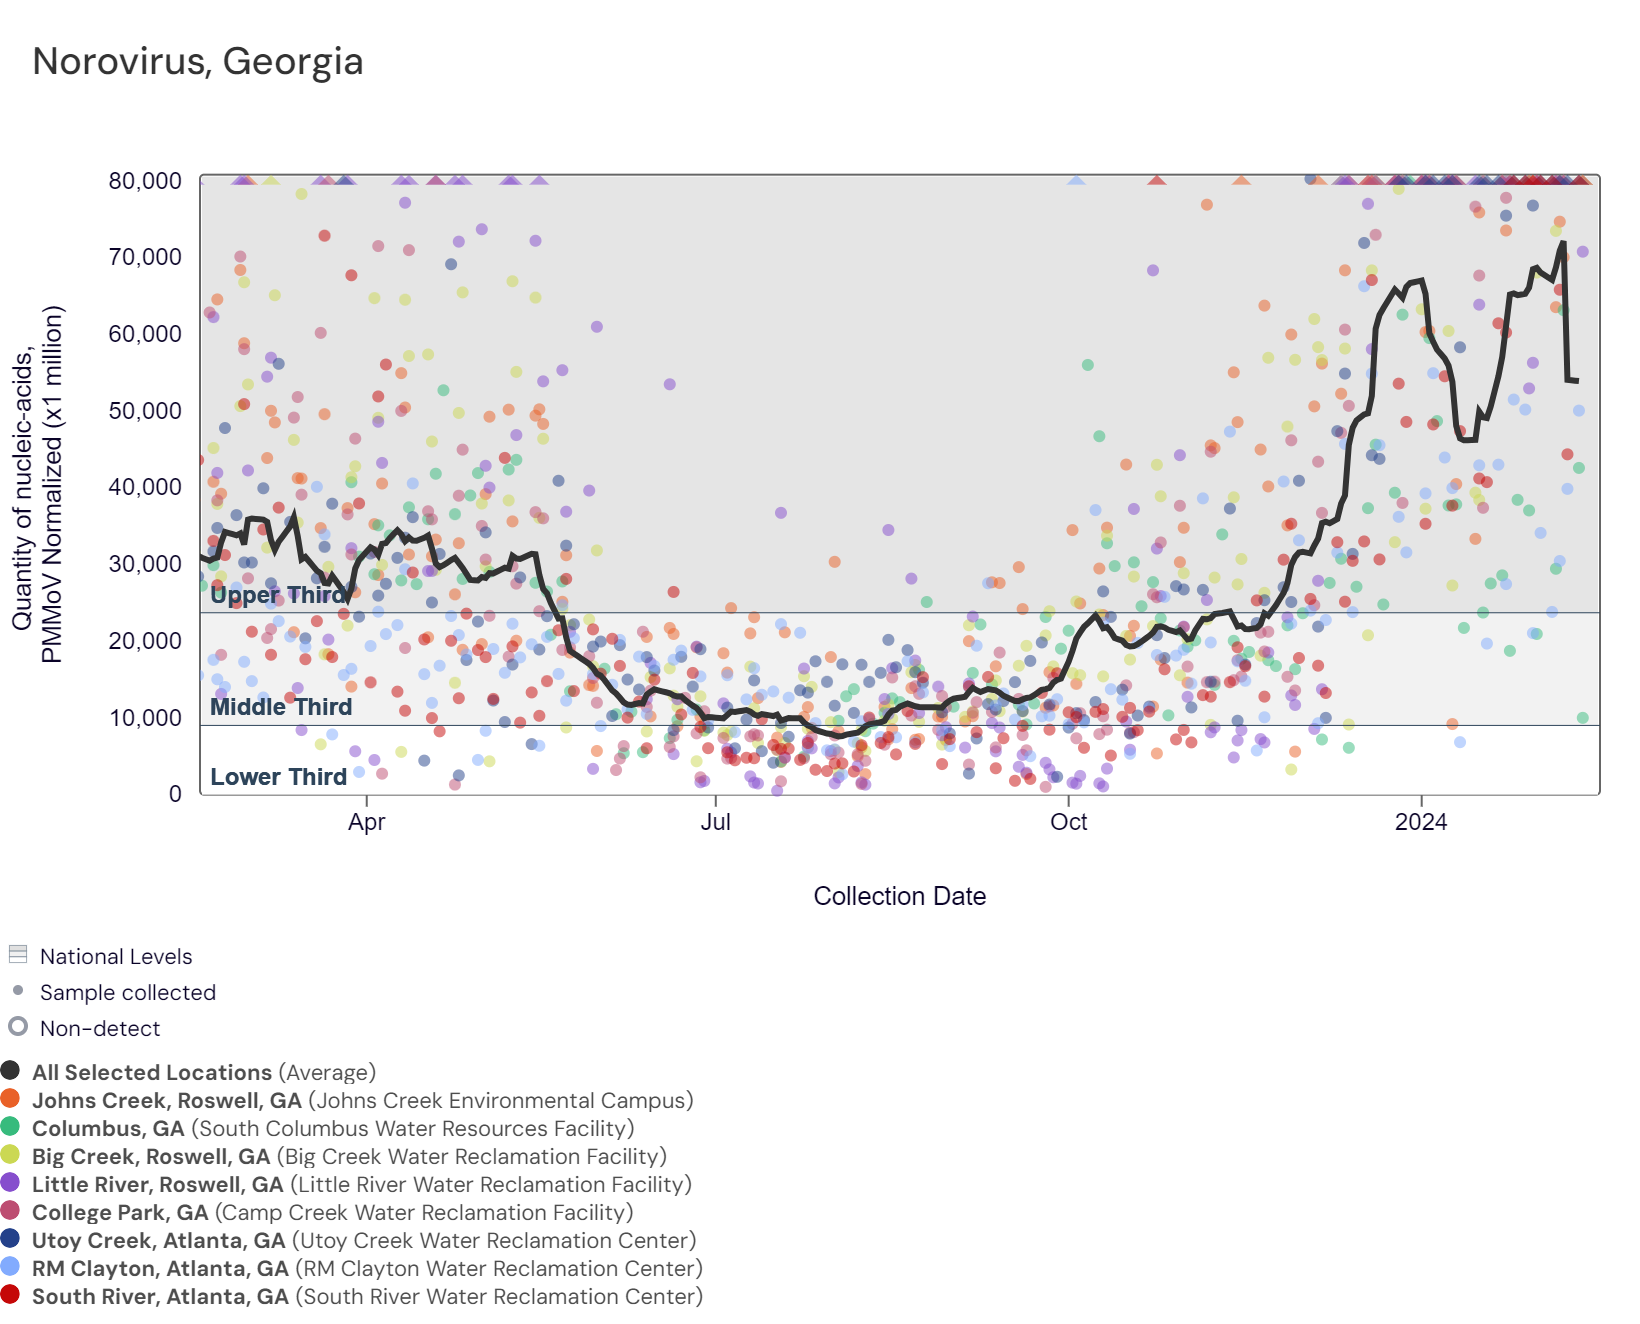
Norovirus GII (HuNoV GII) RNA concentrations range between 6,000,000 - 36,000,000 copies/g, and the population-weighted average line for the 8 Georgia sites is within the upper third level. HuNoV GII RNA wastewater concentrations in the Southern region remain high with an upward trend over the last 21 days. Concentrations in Georgia are much higher than around this time last year. As of 2/16/2024, all Georgia sites are in the HIGH (8 sites) Wastewater Category.
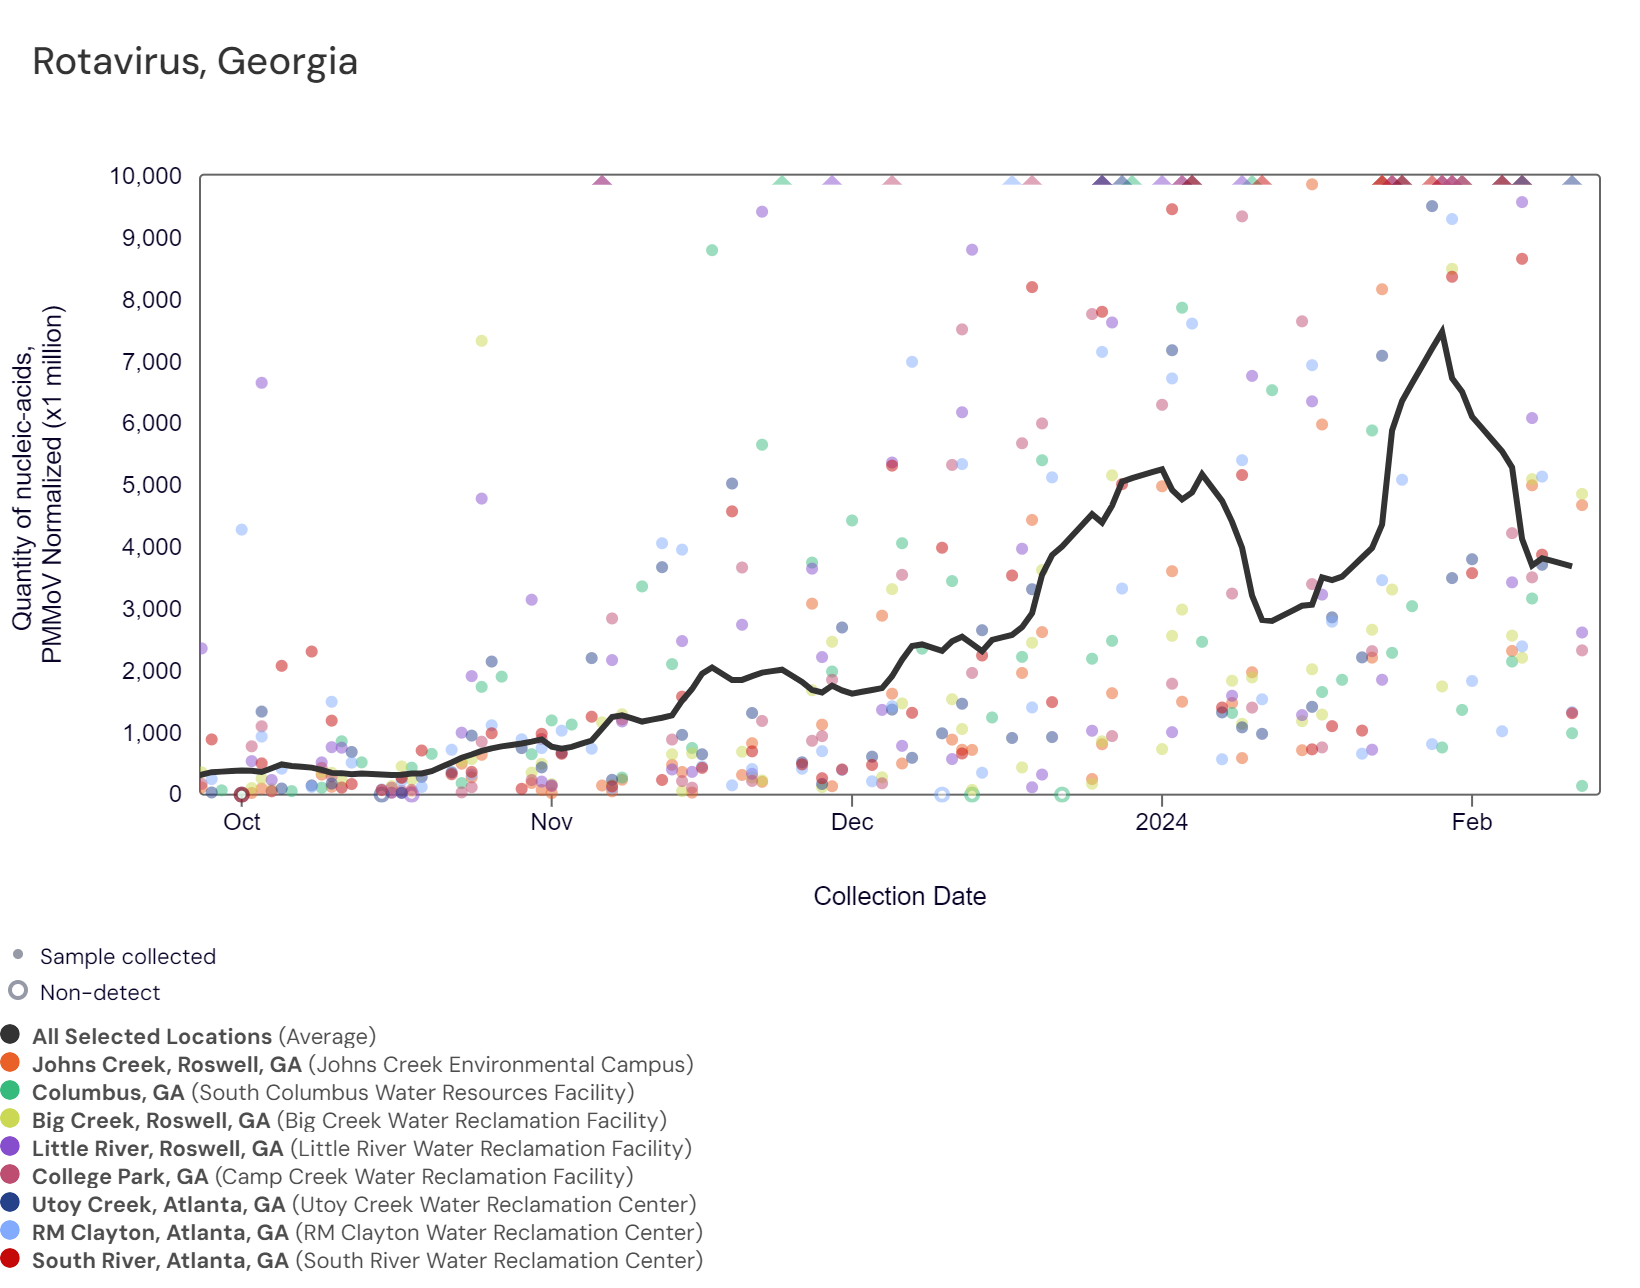
Rotavirus RNA concentrations have been between 240,000 - 6,500,000 copies/g over the last two weeks. The chart below shows the population-weighted average line is shown in black plus the raw data for each site. Because this is a new target, there is no category assigned and we are still establishing what an expected baseline amount of detection will be.
Other Pathogens of Concern
Mpox, Candida auris, and Hepatitis A
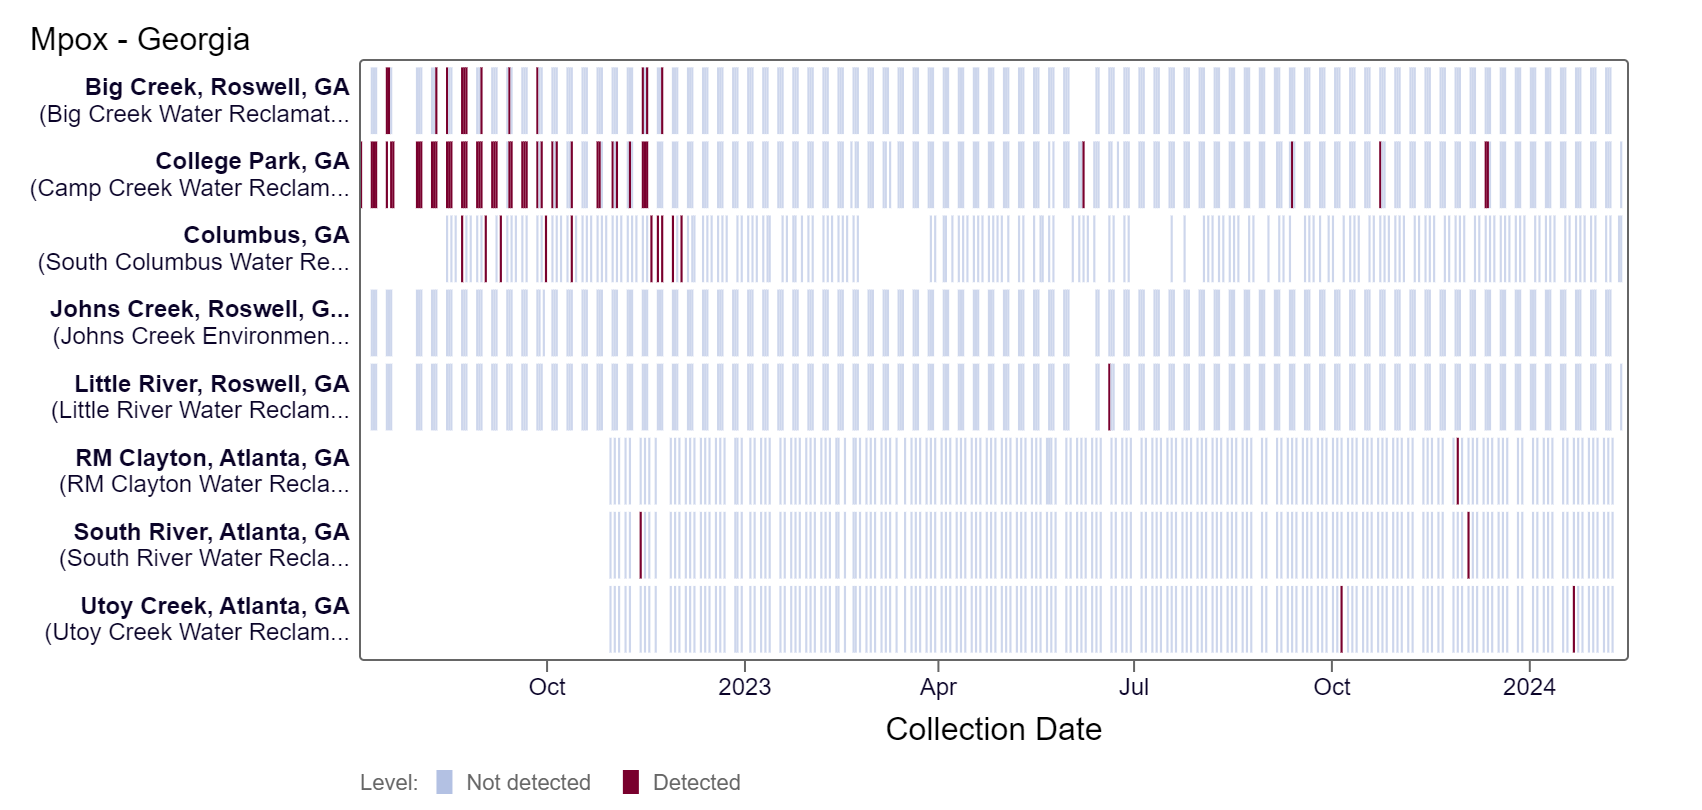
Mpox DNA results have been non-detect at all Georgia sites in the last 21 days. This heat map shows data since July 2022. Sites are labeled in the rows and each date a sample was collected as a column. The color blue means the sample was non-detect for mpox DNA and the color maroon means Mpox DNA was detected. White indicates no sample was collected. All Georgia sites are in the LOW Wastewater Category as of 2/16/24.
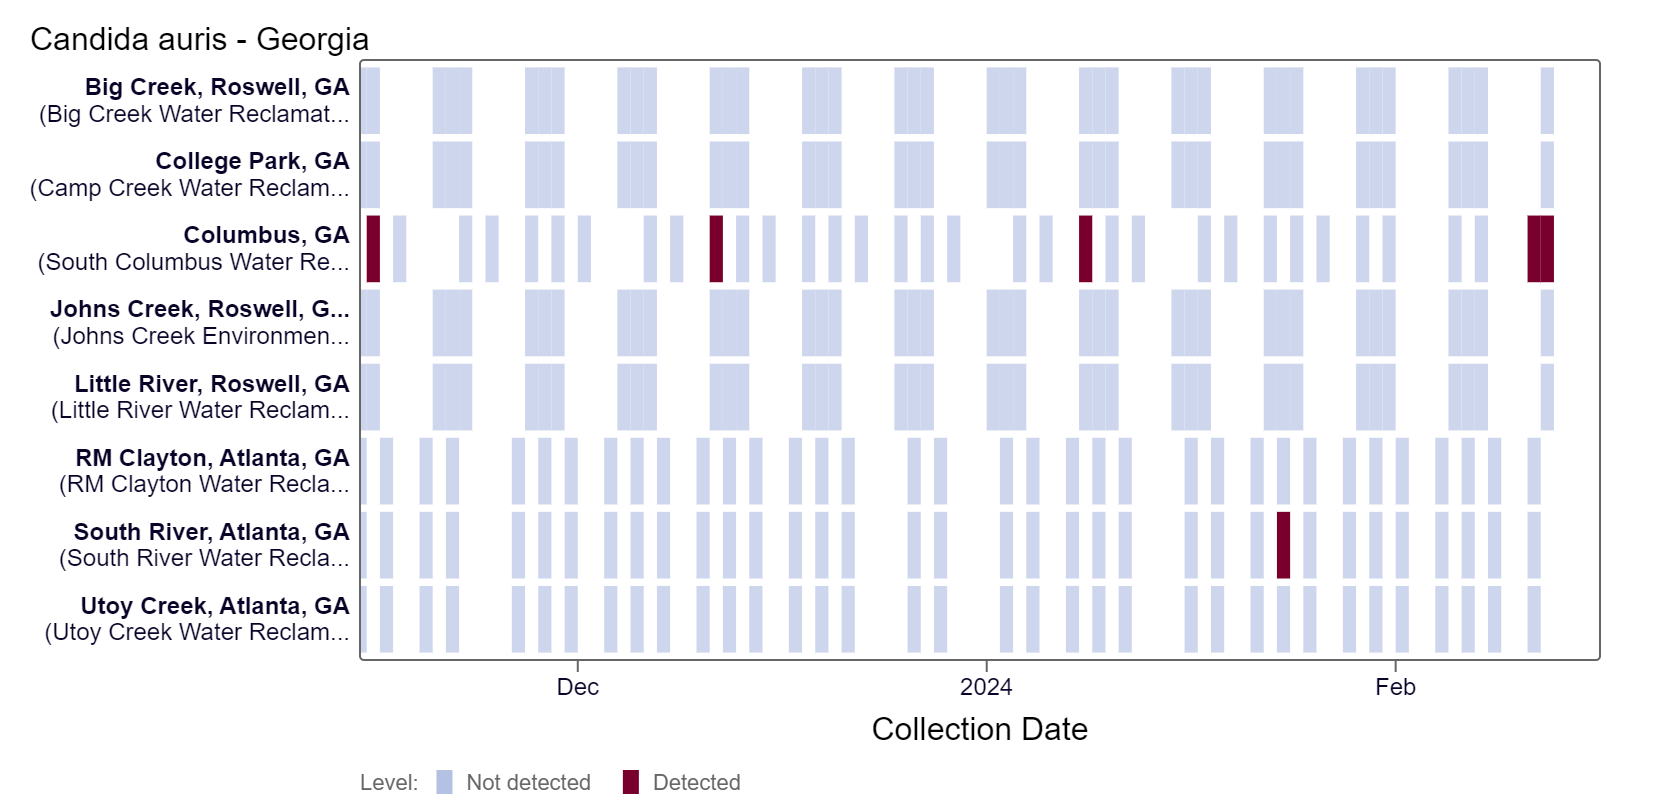
Candida auris DNA has only been detected at the Columbus site in the last two weeks, based on the heat map below. Because this is a new target, there is no category assigned and we are still establishing what an expected baseline amount of detection will be.
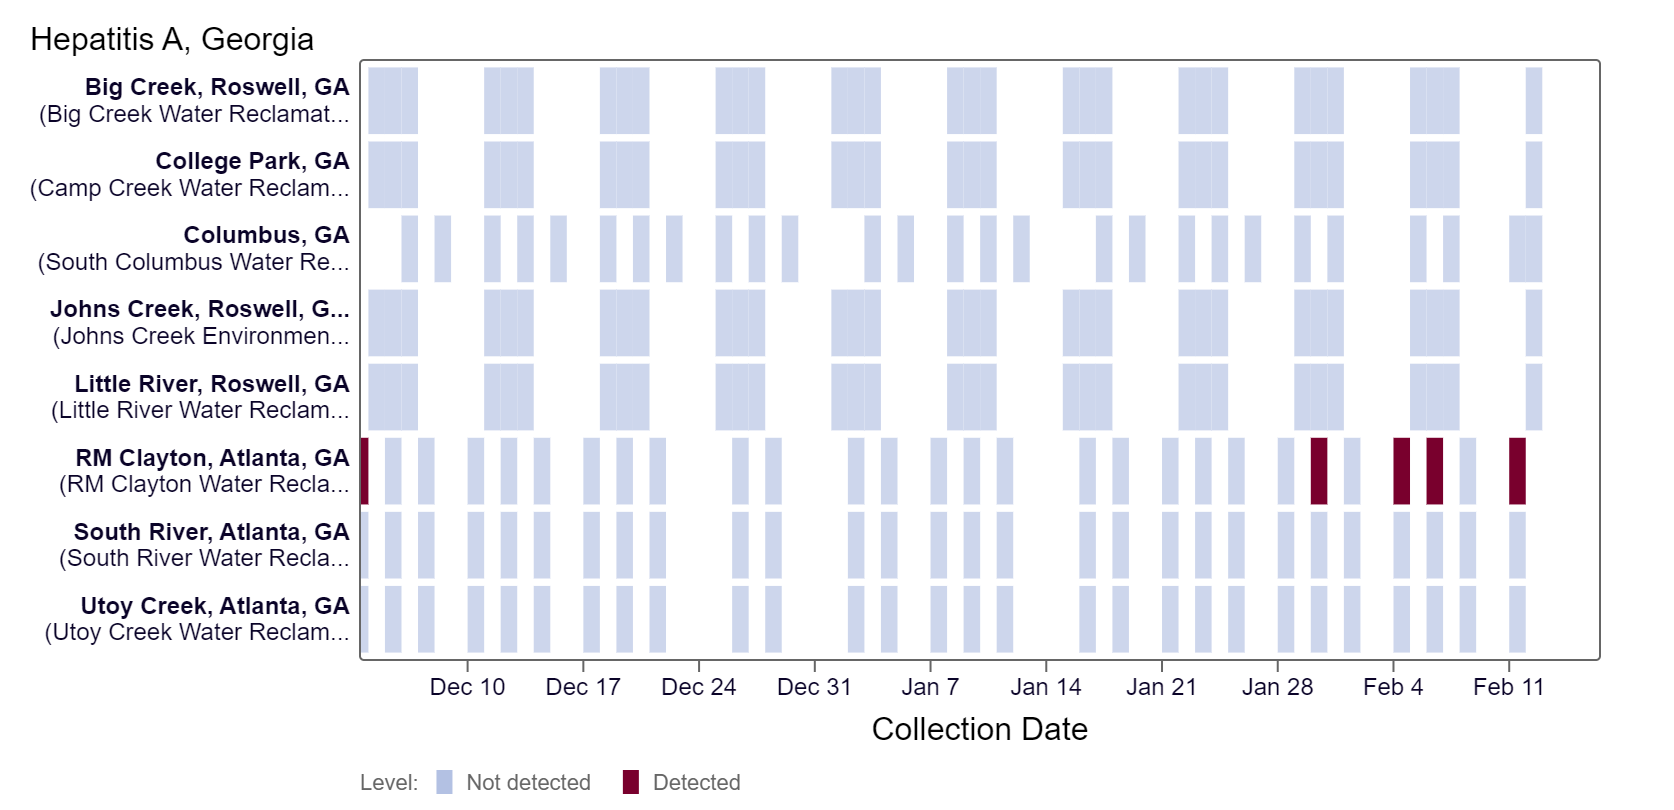
Hepatitis A RNA has been detected in multiple samples collected from the RM Clayton site over about the last two weeks, according to the heat map. Because this is a new target, there is no category assigned and we are still establishing what an expected baseline amount of detection will be.
WWSCAN protocols and methods in peer reviewed publications
Protocols (Pre-analytical methods and SARS-CoV-2 analytical methods including controls):
- High Throughput RNA Extraction and PCR Inhibitor Removal of Settled Solids for Wastewater Surveillance of SARS-CoV-2 RNA
- High Throughput pre-analytical processing of wastewater settled solids for SARS-CoV-2 RNA analyses
- Quantification of SARS-CoV-2 variant mutations (HV69-70, E484K/N501Y, del156-157/R158G, del143-145, LPPA24S, S:477-505, and ORF1a Del 141-143) in settled solids using digital RT-PCR
- High Throughput SARS-COV-2, PMMoV, and BCoV quantification in settled solids using digital RT-PCR
Pre-prints and peer-reviewed publications provided WWSCAN methods:
- SARS-CoV-2
- Influenza, Human metapneumovirus, Respiratory syncytial virus, Human parainfluenza
- Mpox
- Norovirus GII
- Adenovirus group F, Rotavirus, Candida auris, Hepatitis A
- Enterovirus D68
Related News
The next stakeholder meeting will take place Friday, March 8th @ 12 PM EST. You can use this zoom link to join. Hope to see you there!