
Georgia WWSCAN Biweekly Newsletter Update 9/13/24
Welcome to the bi-weekly update for WWSCAN partners in Georgia! The samples provided up through 9/9/24 have been processed in the lab and data are on the site at data.wastewaterscan.org. Note that data may be limited in this update due to delays in sample submission from multiple sites.
If you notice any bugs on the site or have any comments about it, please continue to send your feedback via email wwscan_stanford_emory@lists.stanford.edu. We thank you for your partnership!
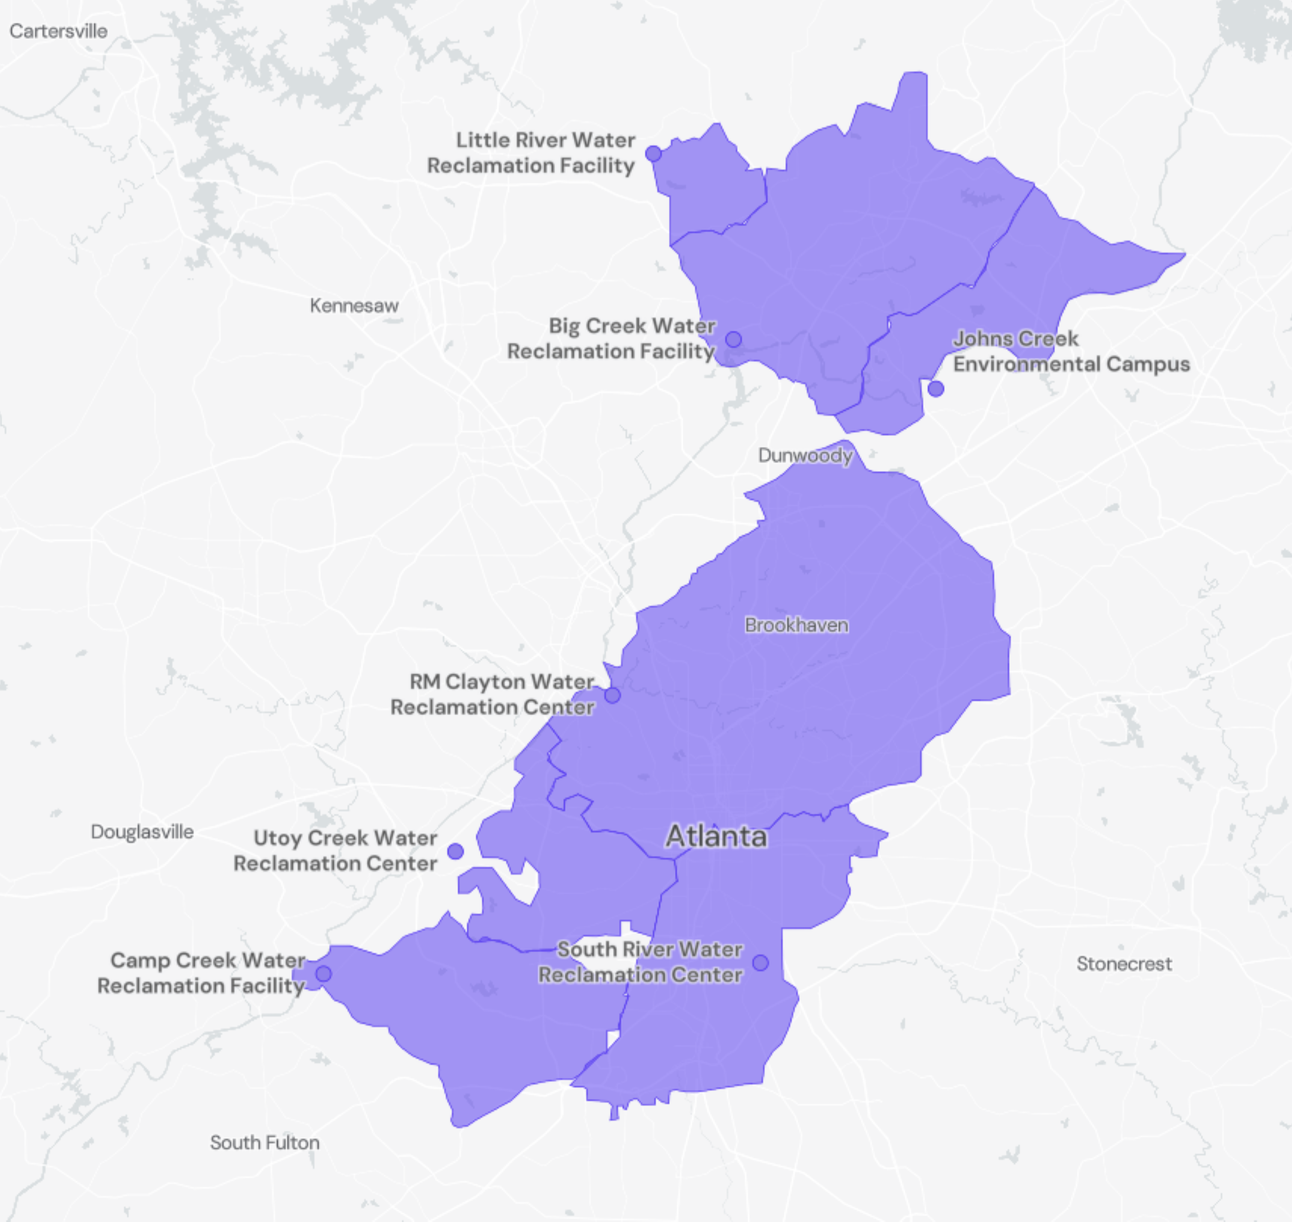
For site level summaries of the GA plants with current Wastewater Categories and concentration plots, see the following links:
- Big Creek, Roswell, GA
- College Park, GA
- Columbus, GA
- Johns Creek, Roswell, GA
- Little River, Roswell, GA
- RM Clayton, Atlanta, GA
- South River, Atlanta, GA
- Utoy Creek, Atlanta, GA
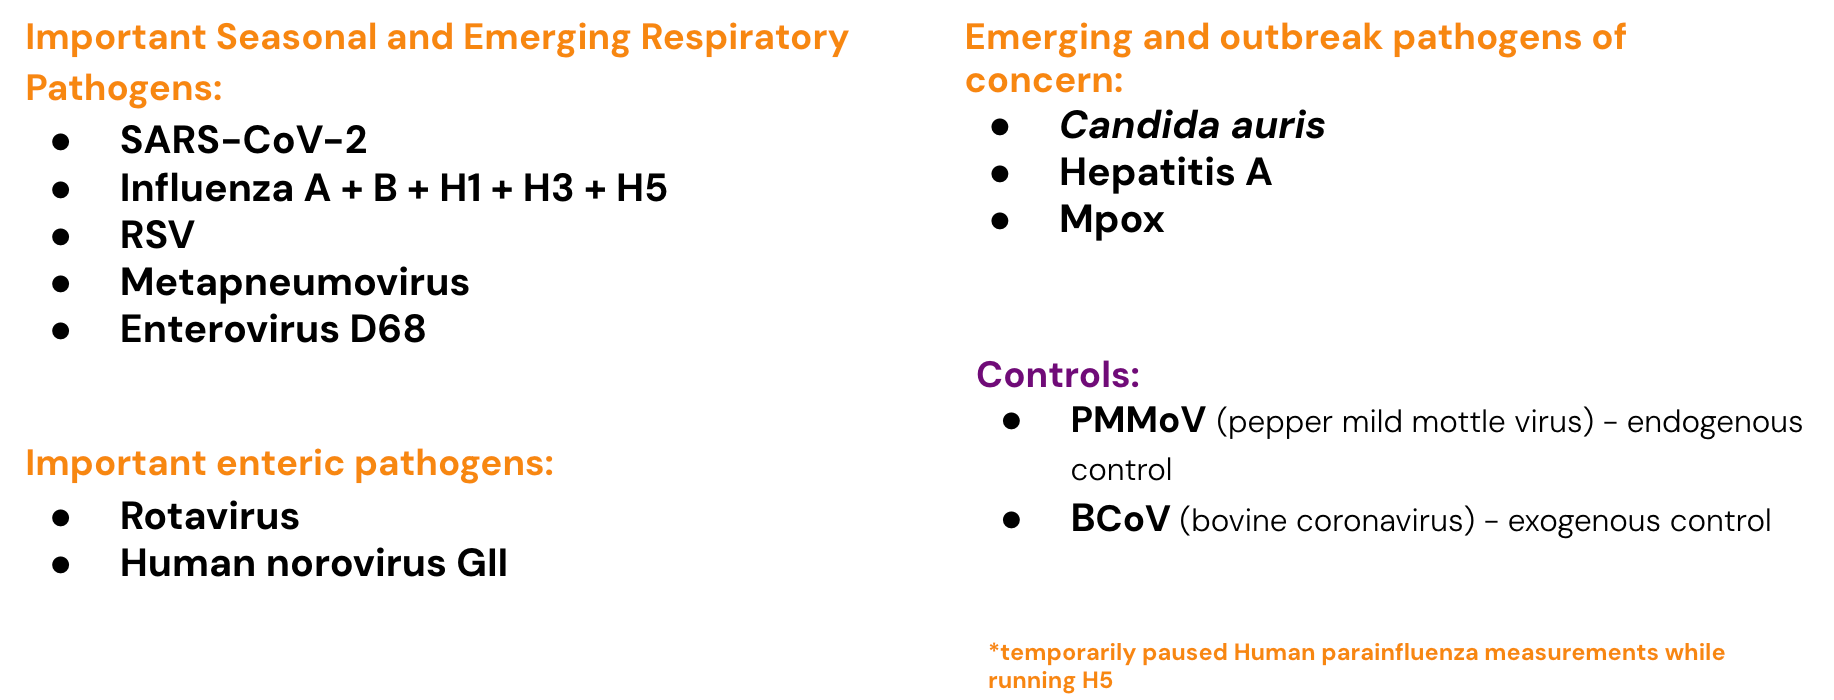
Infectious Disease Target Review
Currently monitoring a suite of Respiratory, Gastrointestinal and Outbreak Pathogens of Concern
The methods for our assays are in the public domain and links for these are provided at the end of the newsletter.
COVID-19
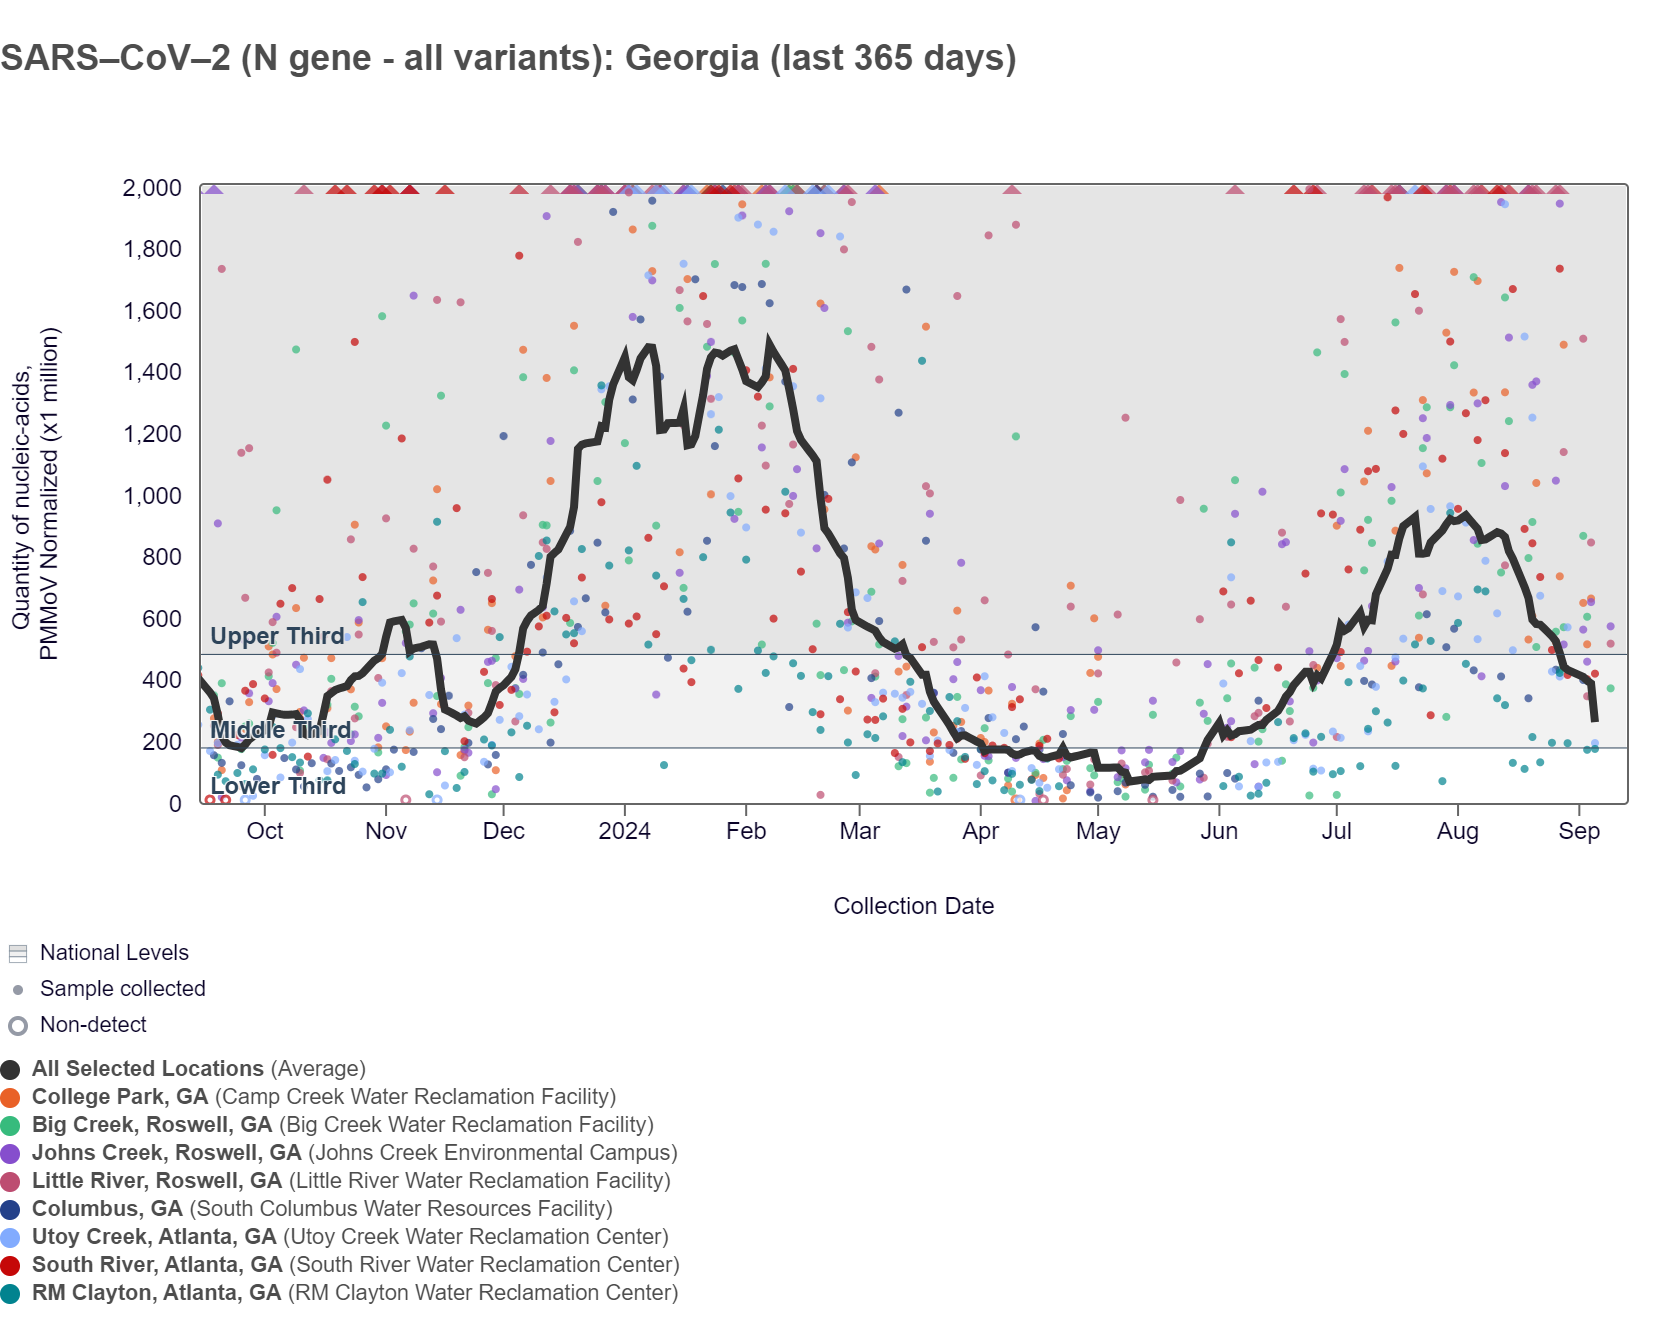
SARS-CoV-2 concentration in wastewater and sequencing for variants
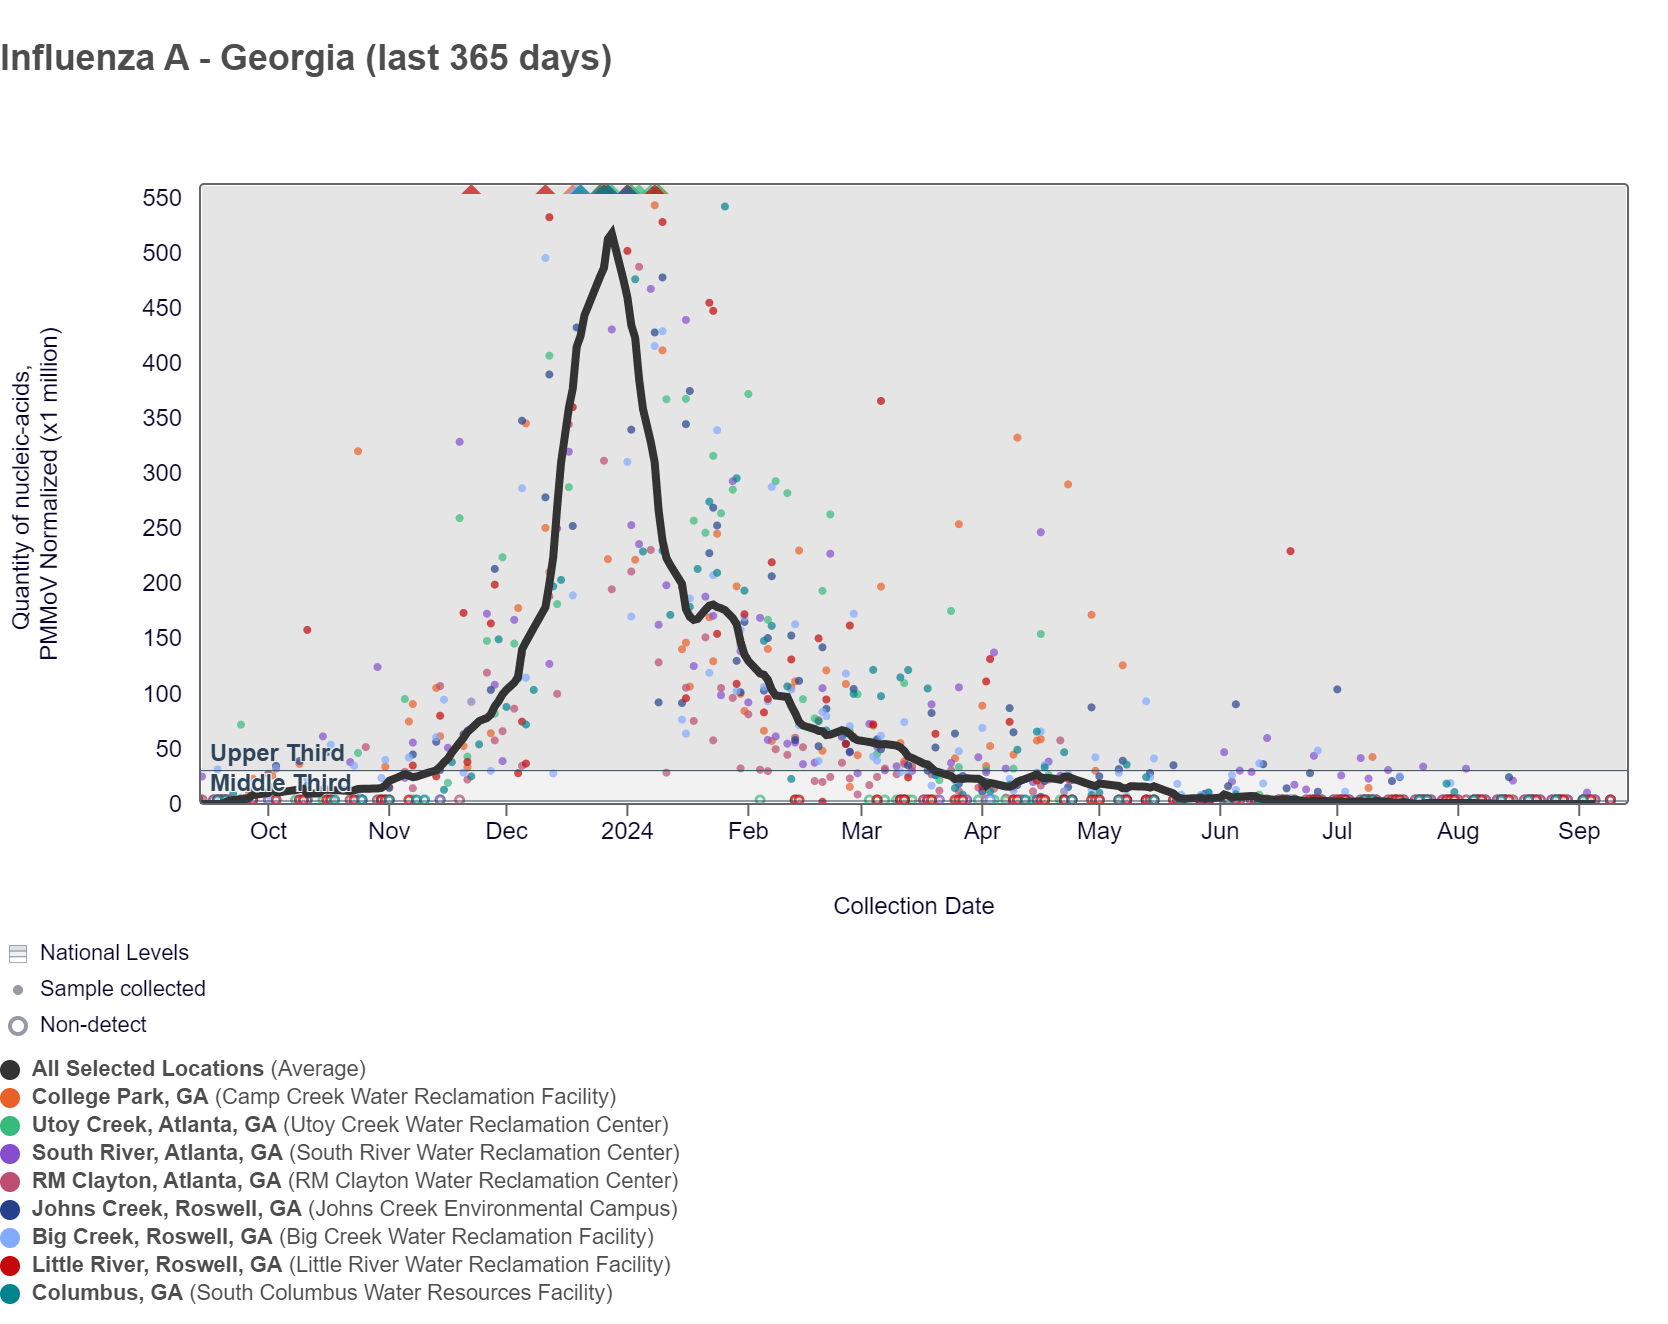
SARS-CoV-2 RNA concentrations have been between 35,000 and 350,000 copies/gram in the last two weeks. The chart below shows the raw data over the last 365 days and the population-weighted aggregated trend line for all 8 Georgia sites when the data is normalized by PMMoV. The aggregated line and the National Levels benchmarks illustrate that SARS-CoV-2 N gene RNA concentrations among Georgia sites continue to be within the middle third level of all concentrations measured in the last year. In the Southern region, SARS-CoV-2 is now in the "Medium" wastewater category.
As of 9/13/24, Johns Creek and Little River are in the HIGH (2 sites) wastewater category. Big Creek is in the MEDIUM (1 site) category. There was not enough data to calculate a category for South River, Utoy Creek, College Park, Columbus, and RM Clayton.
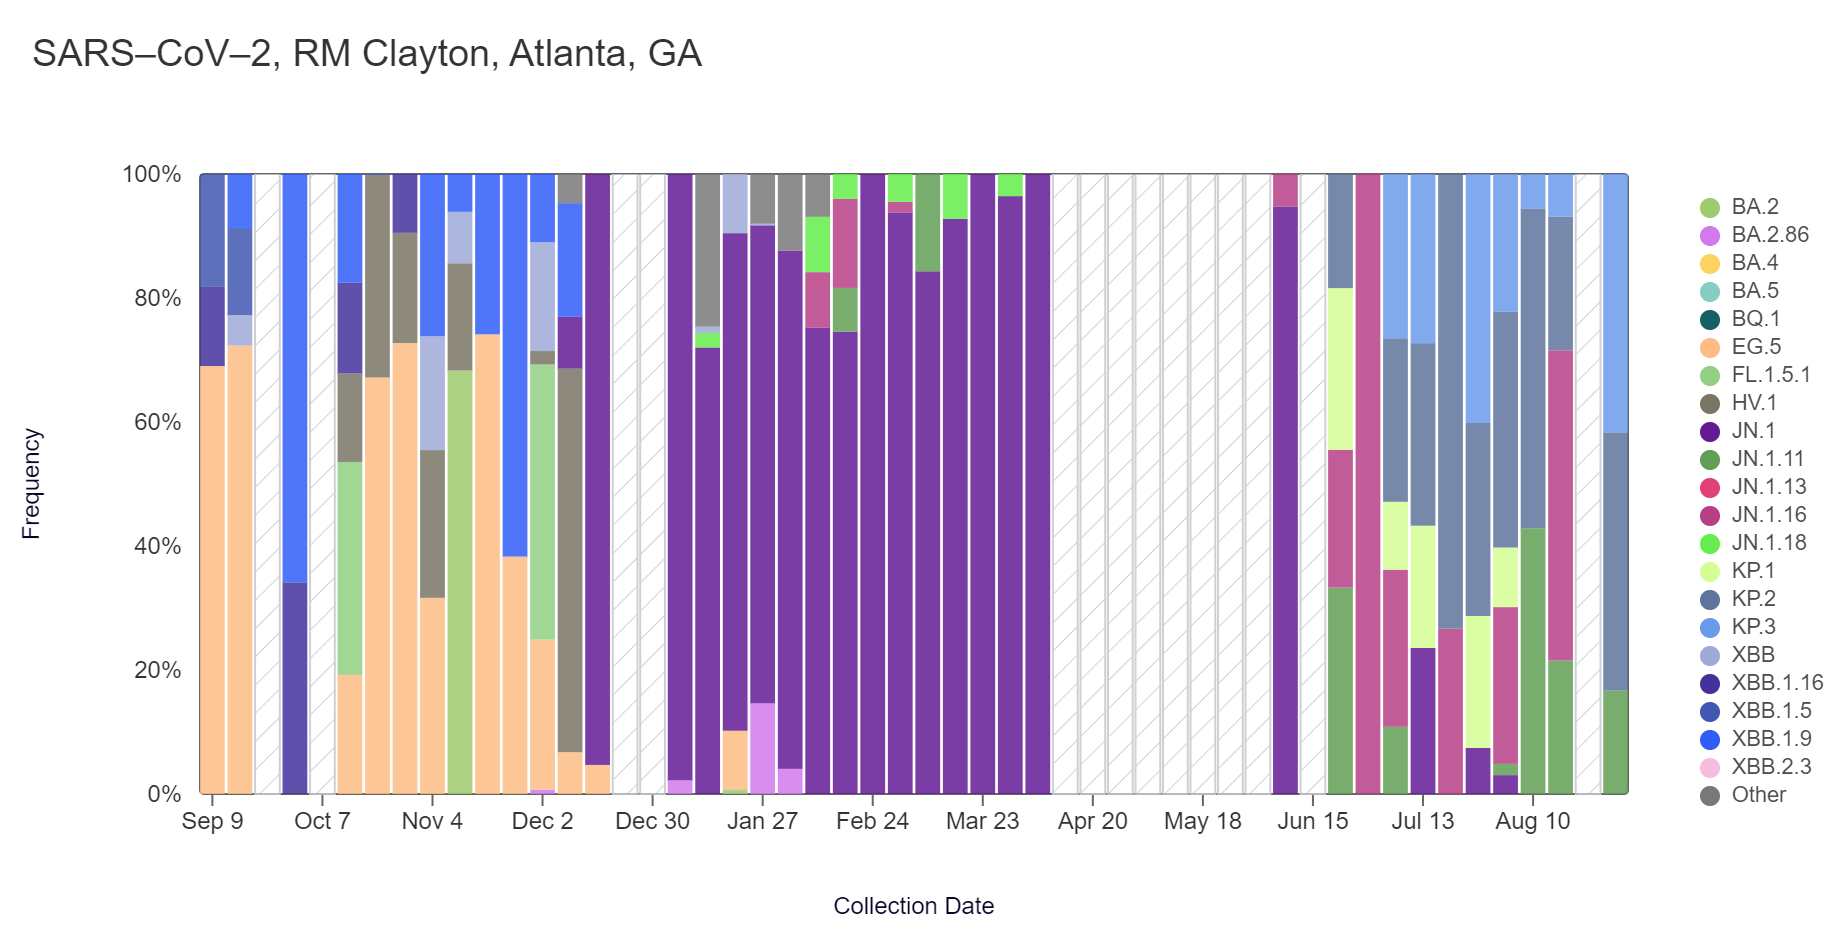
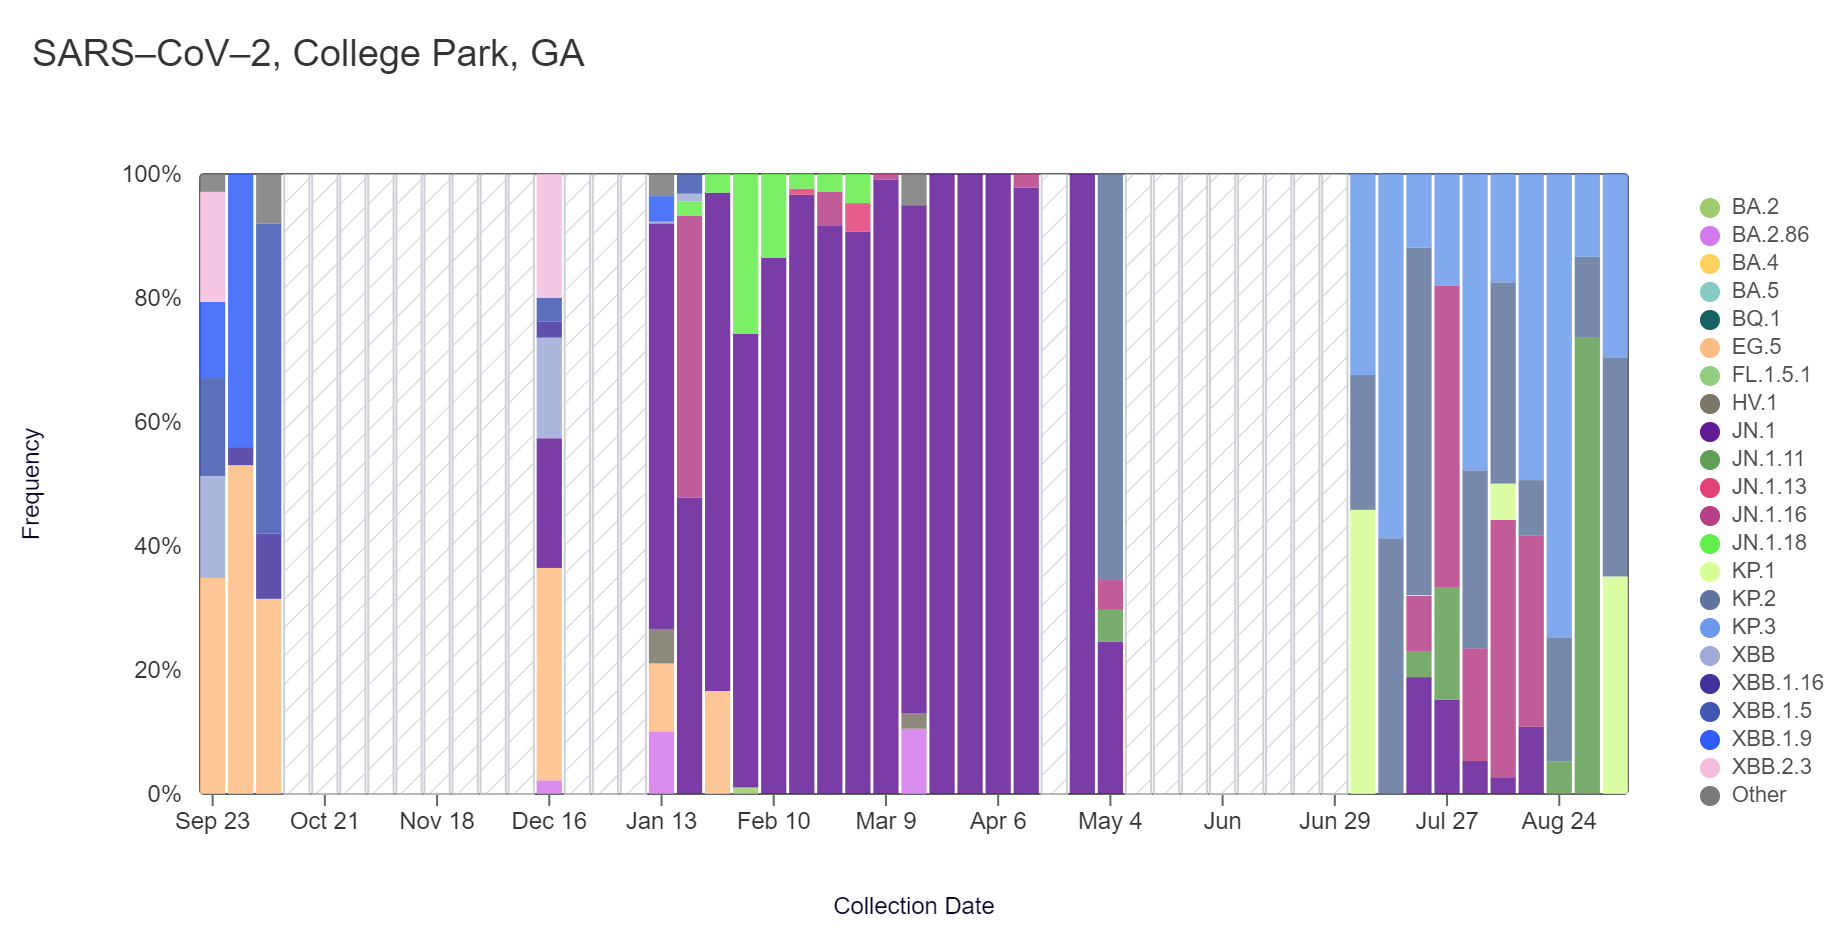
Sequencing of SARS-CoV-2 from wastewater is available for RM Clayton and College Park (Camp Creek). The plots below show the relative proportions of different variants inferred from sequencing the entire genome of SARS-CoV-2 (Note: the sequencing variant plots are now available on the website, so the plots that are shown below are linked above if you want to interact with them). Results are based on sequencing of 2 samples per week, combined to provide a weekly value.
In the most recent samples, KP.2 (41.7%) and KP.3 (41.7%) made up the largest proportions of lineages detected at RM Clayton. KP.2 (35.2%) and KP.1 (35.1%) also made up the largest proportion of lineages detected at College Park. Note that the most recent data is shown below & should be updated as more samples are analyzed (through Aug 31 at RM Clayton and College Park).
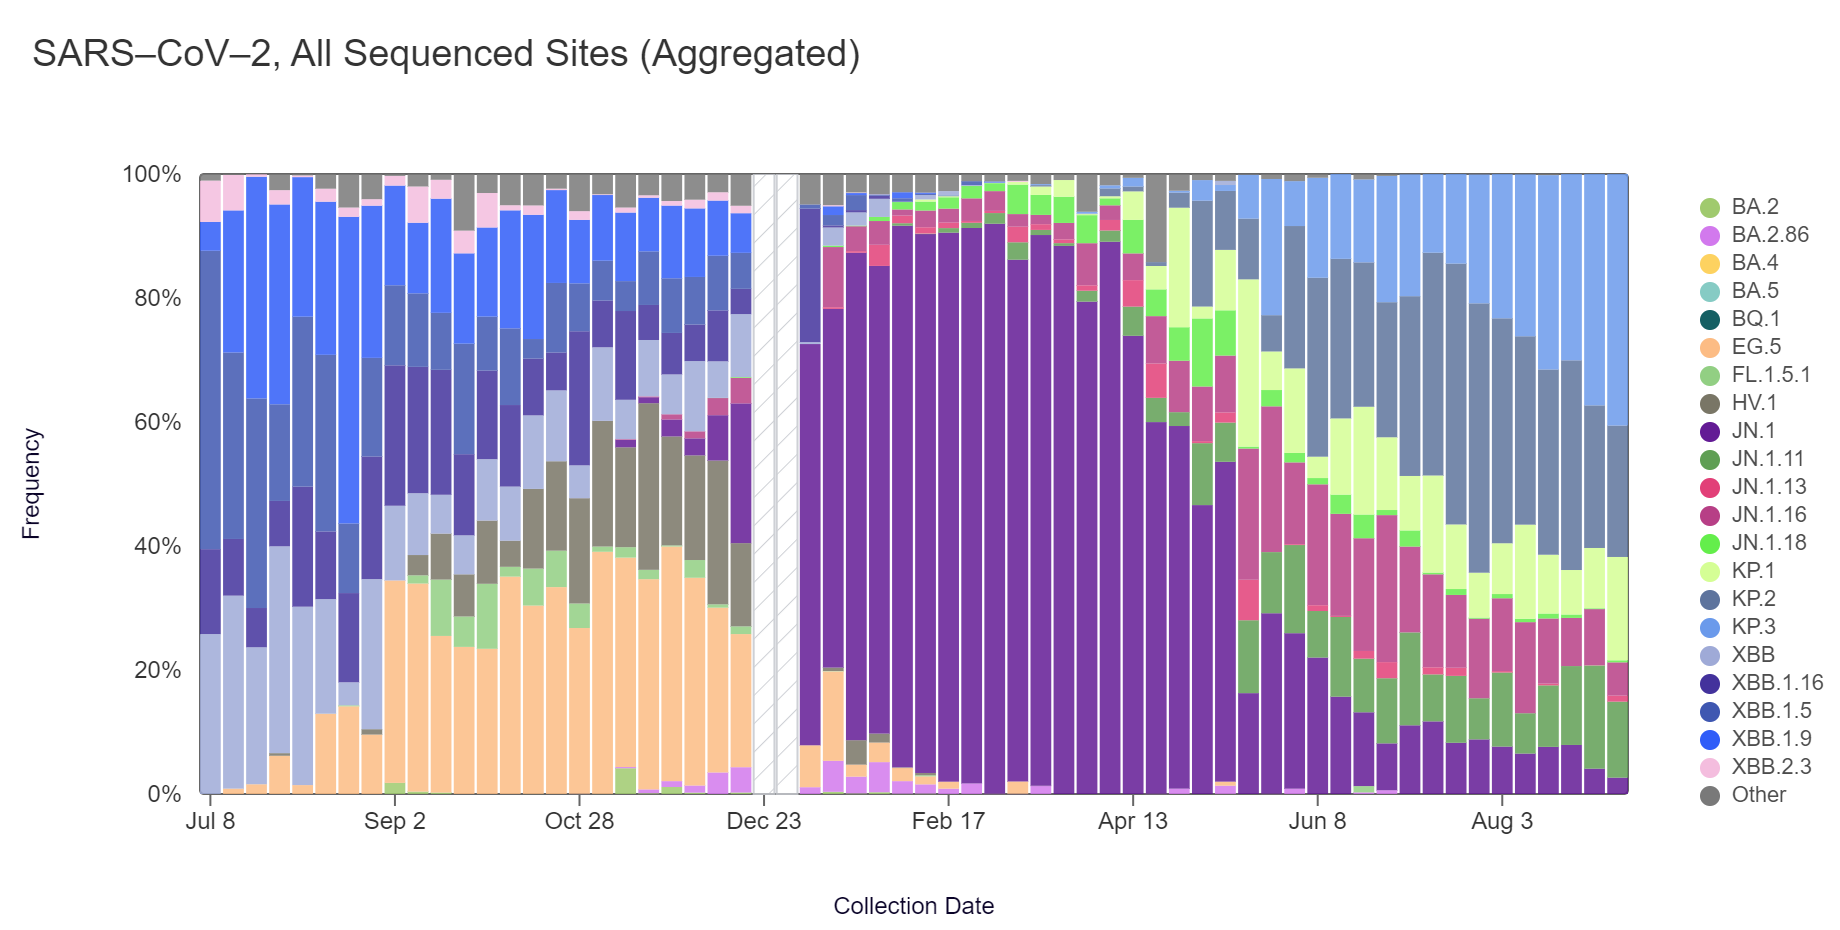
Sequencing data is now also available in aggregate across all sites in WWSCAN with sequencing data through Aug 3. That plot is shown below and suggests that KP.3 is the most abundant variant across all sites (40.3%) while KP.2 is the second most abundant variant (21.2%).
Other Respiratory Pathogens
Influenza A and B, Respiratory Syncytial Virus, Human metapneumovirus & EV-D68
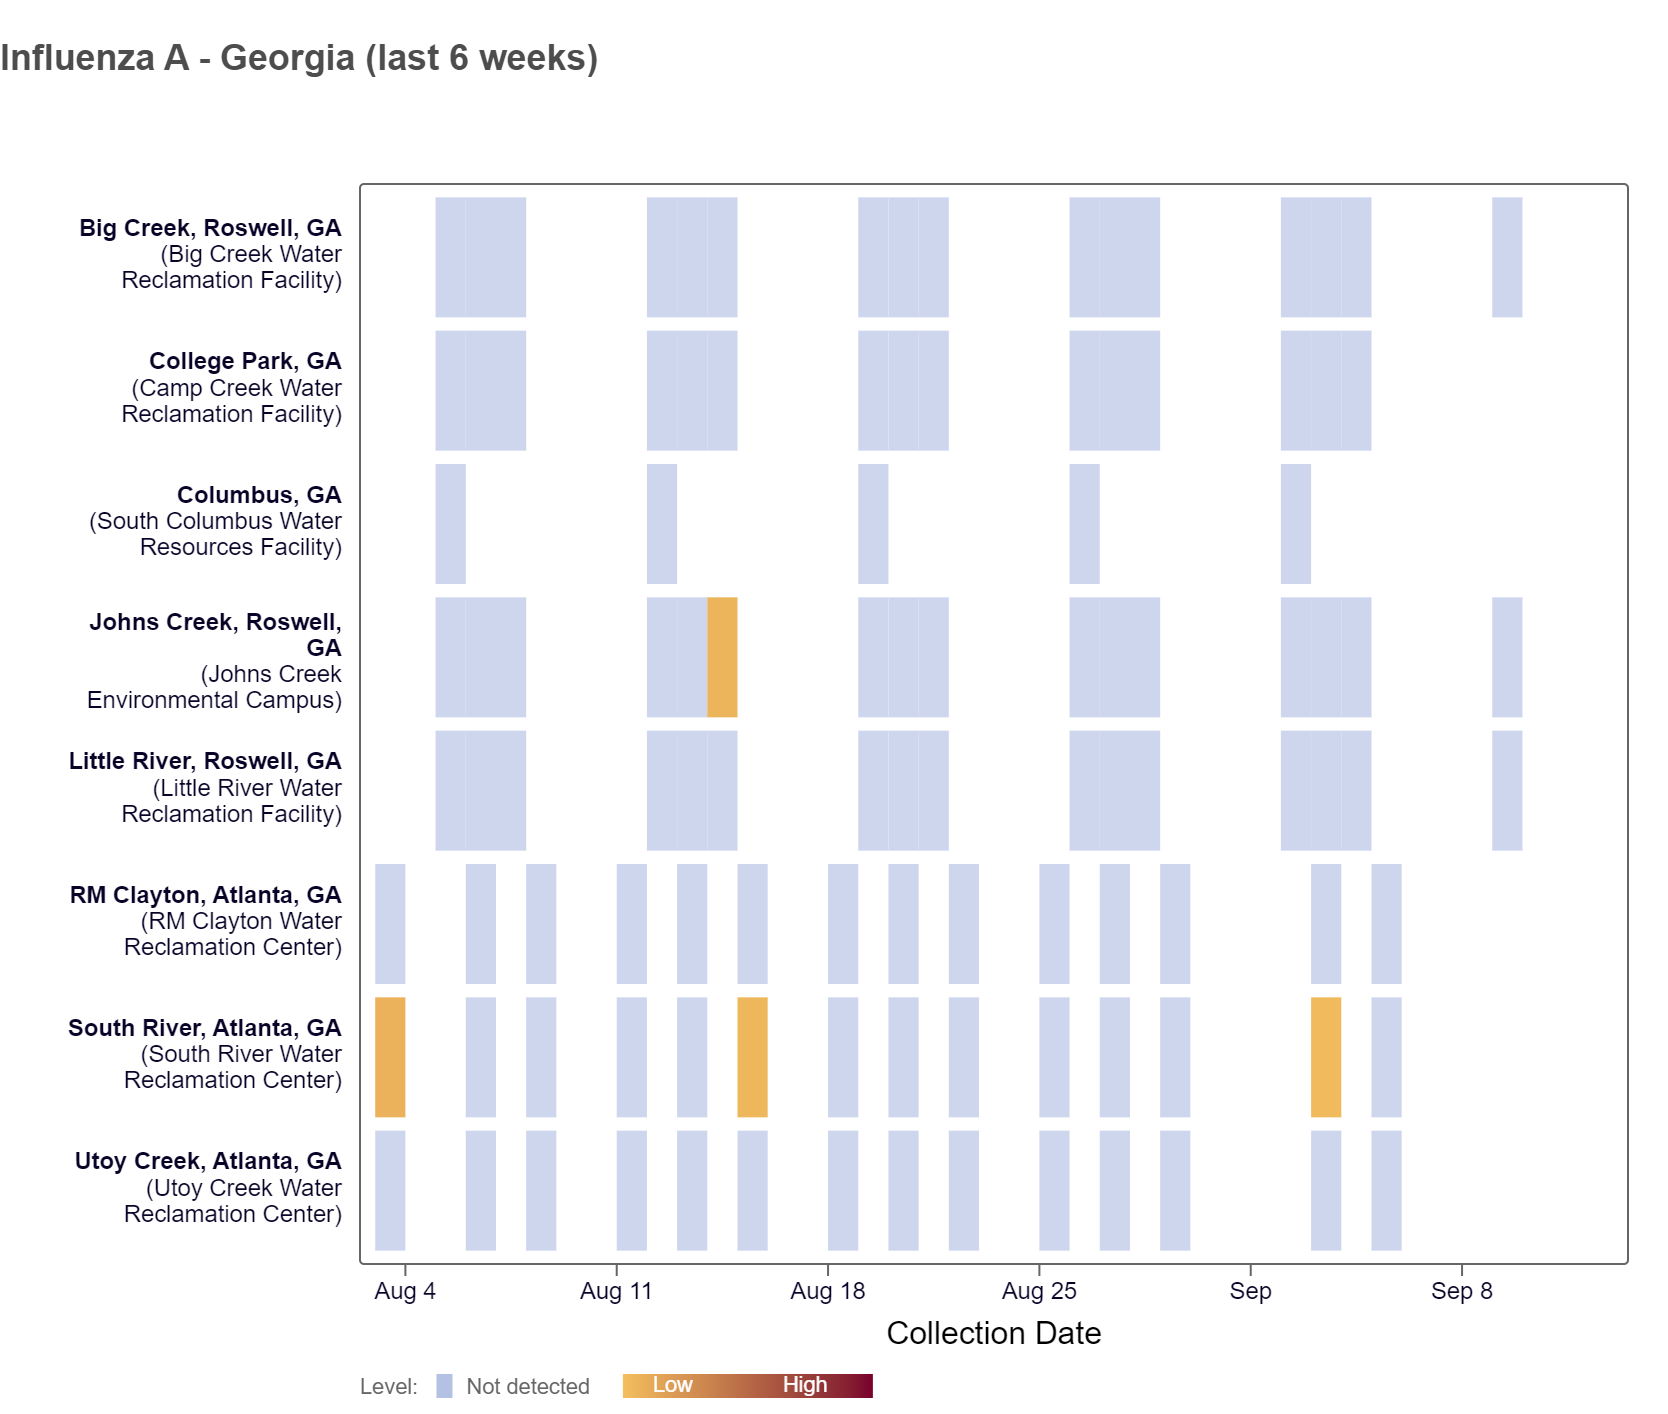
Influenza A (IAV) RNA was detected at the South River site in the last two weeks, according to the heat map below.
The chart below shows the raw data and the population-weighted aggregated trend line for all 8 Georgia sites when the data is normalized by PMMoV is at the bottom of the middle third level. As of 9/13/24, Big Creek, Johns Creek, and Little River are in the LOW (3 sites) wastewater category. There was not enough data to calculate a category for RM Clayton, South River, Utoy Creek, College Park, and Columbus.
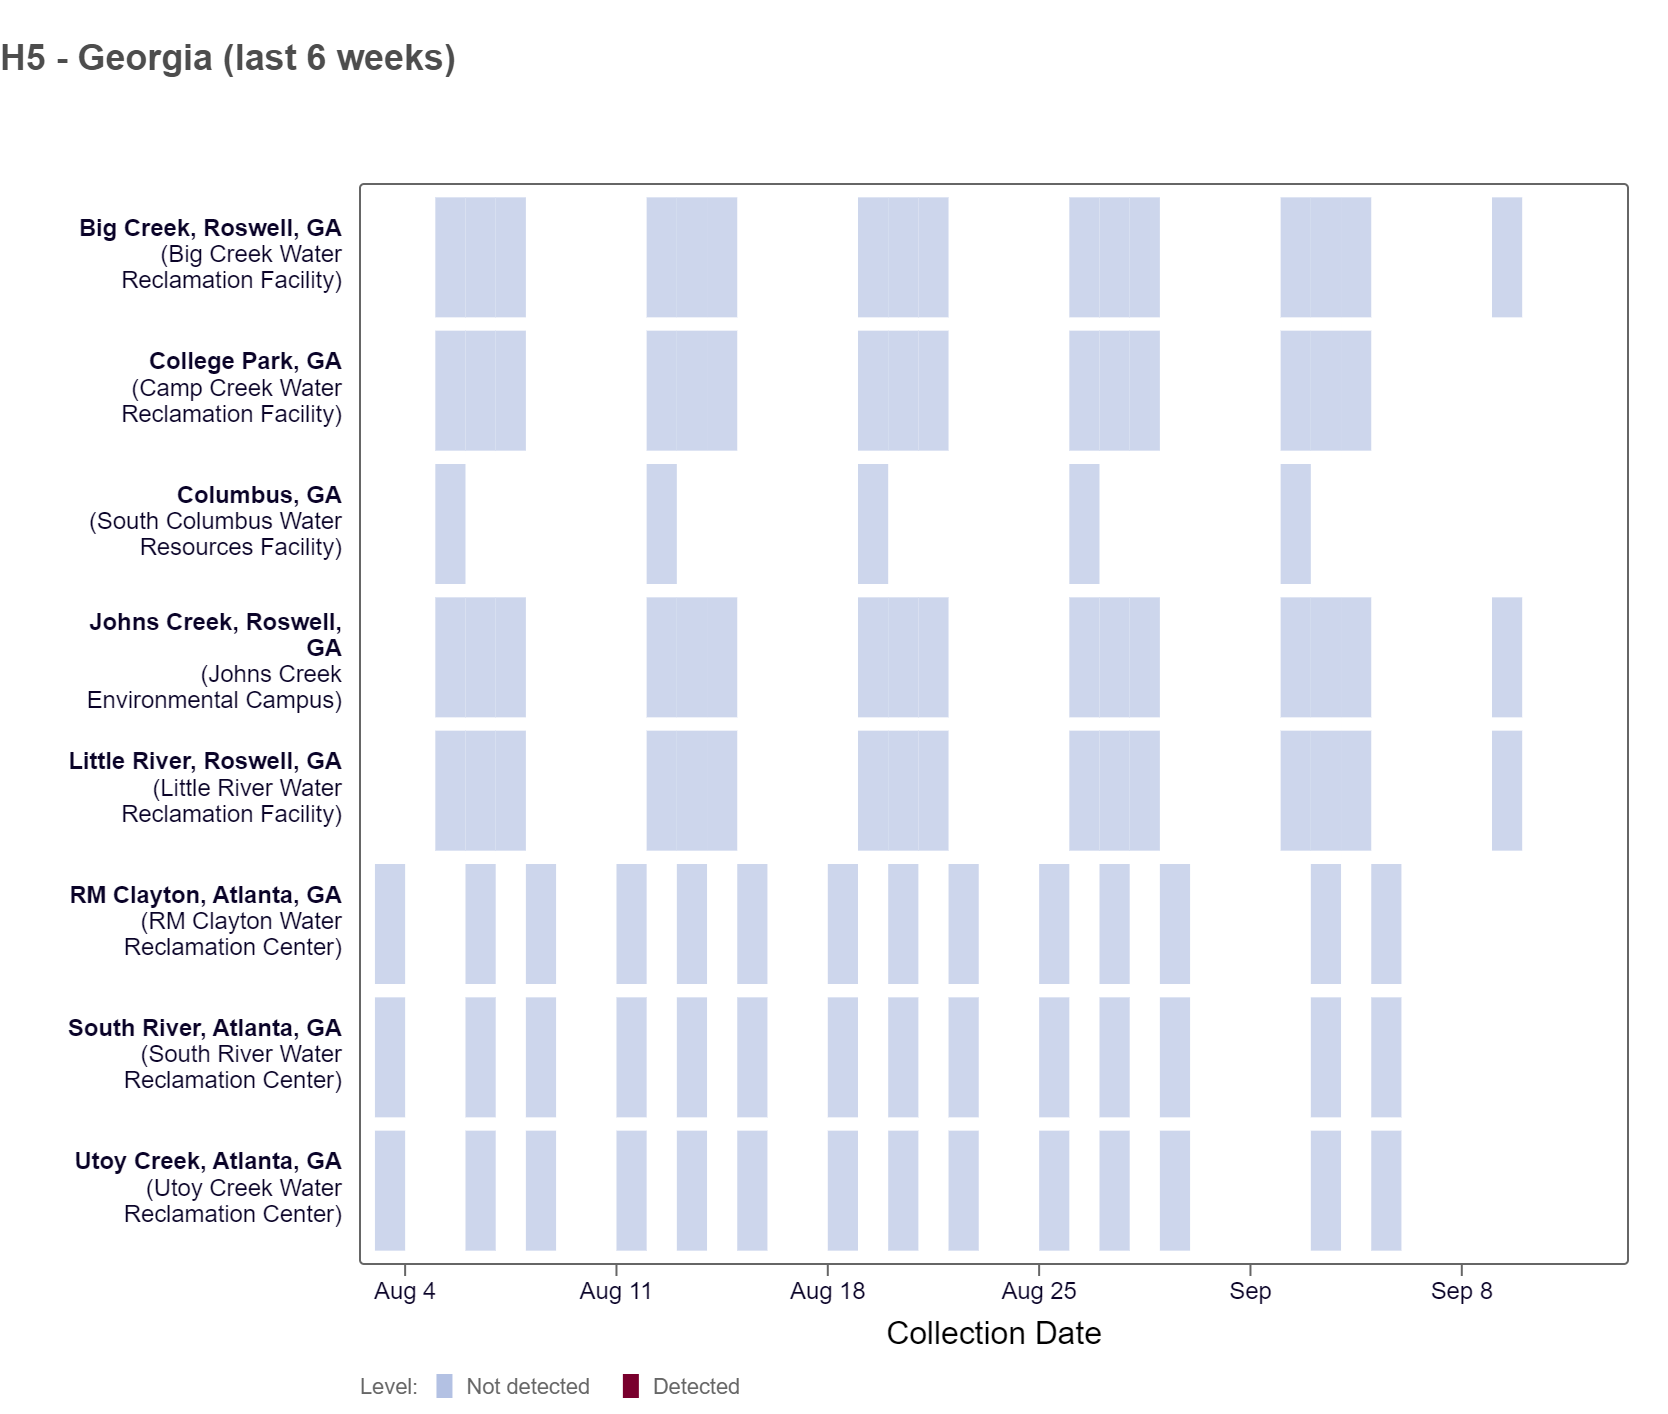
H5 marker in Influenza A (IAV) Below is a heat map showing the Georgia sites with samples collected in the last 6 weeks. All results thus far have been non-detect at all Georgia sites based on available data. For more information about this testing and interpretation of results, see our FAQ sheet here.
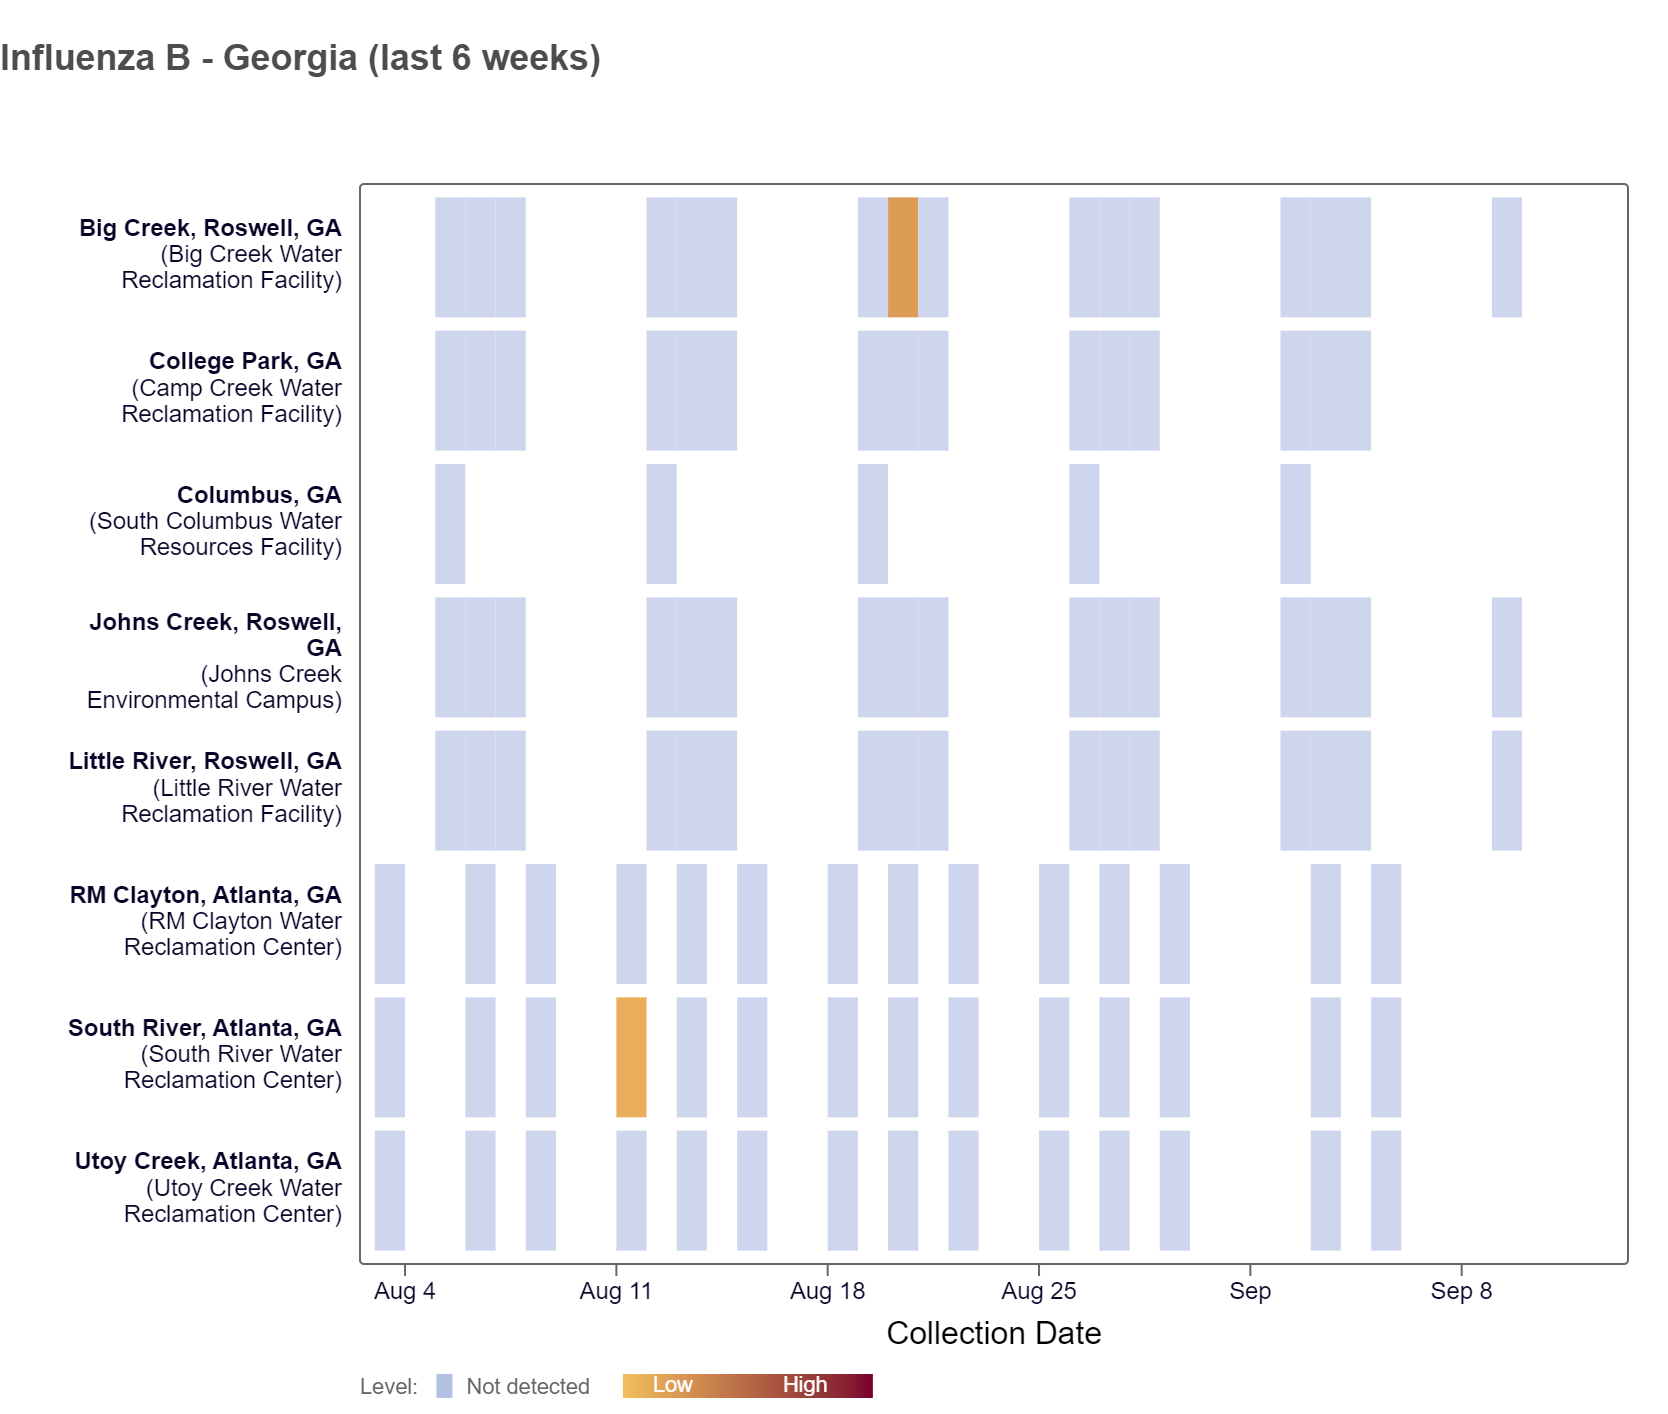
Influenza B (IBV) RNA has not been detected at any of the Georgia WWSCAN sites in the last two weeks, according to the heat map below. As of 9/13/24, Big Creek, Johns Creek, and Little River are in the LOW (3 sites) wastewater category. There was not enough data to calculate a category for RM Clayton, South River, Utoy Creek, College Park, and Columbus.
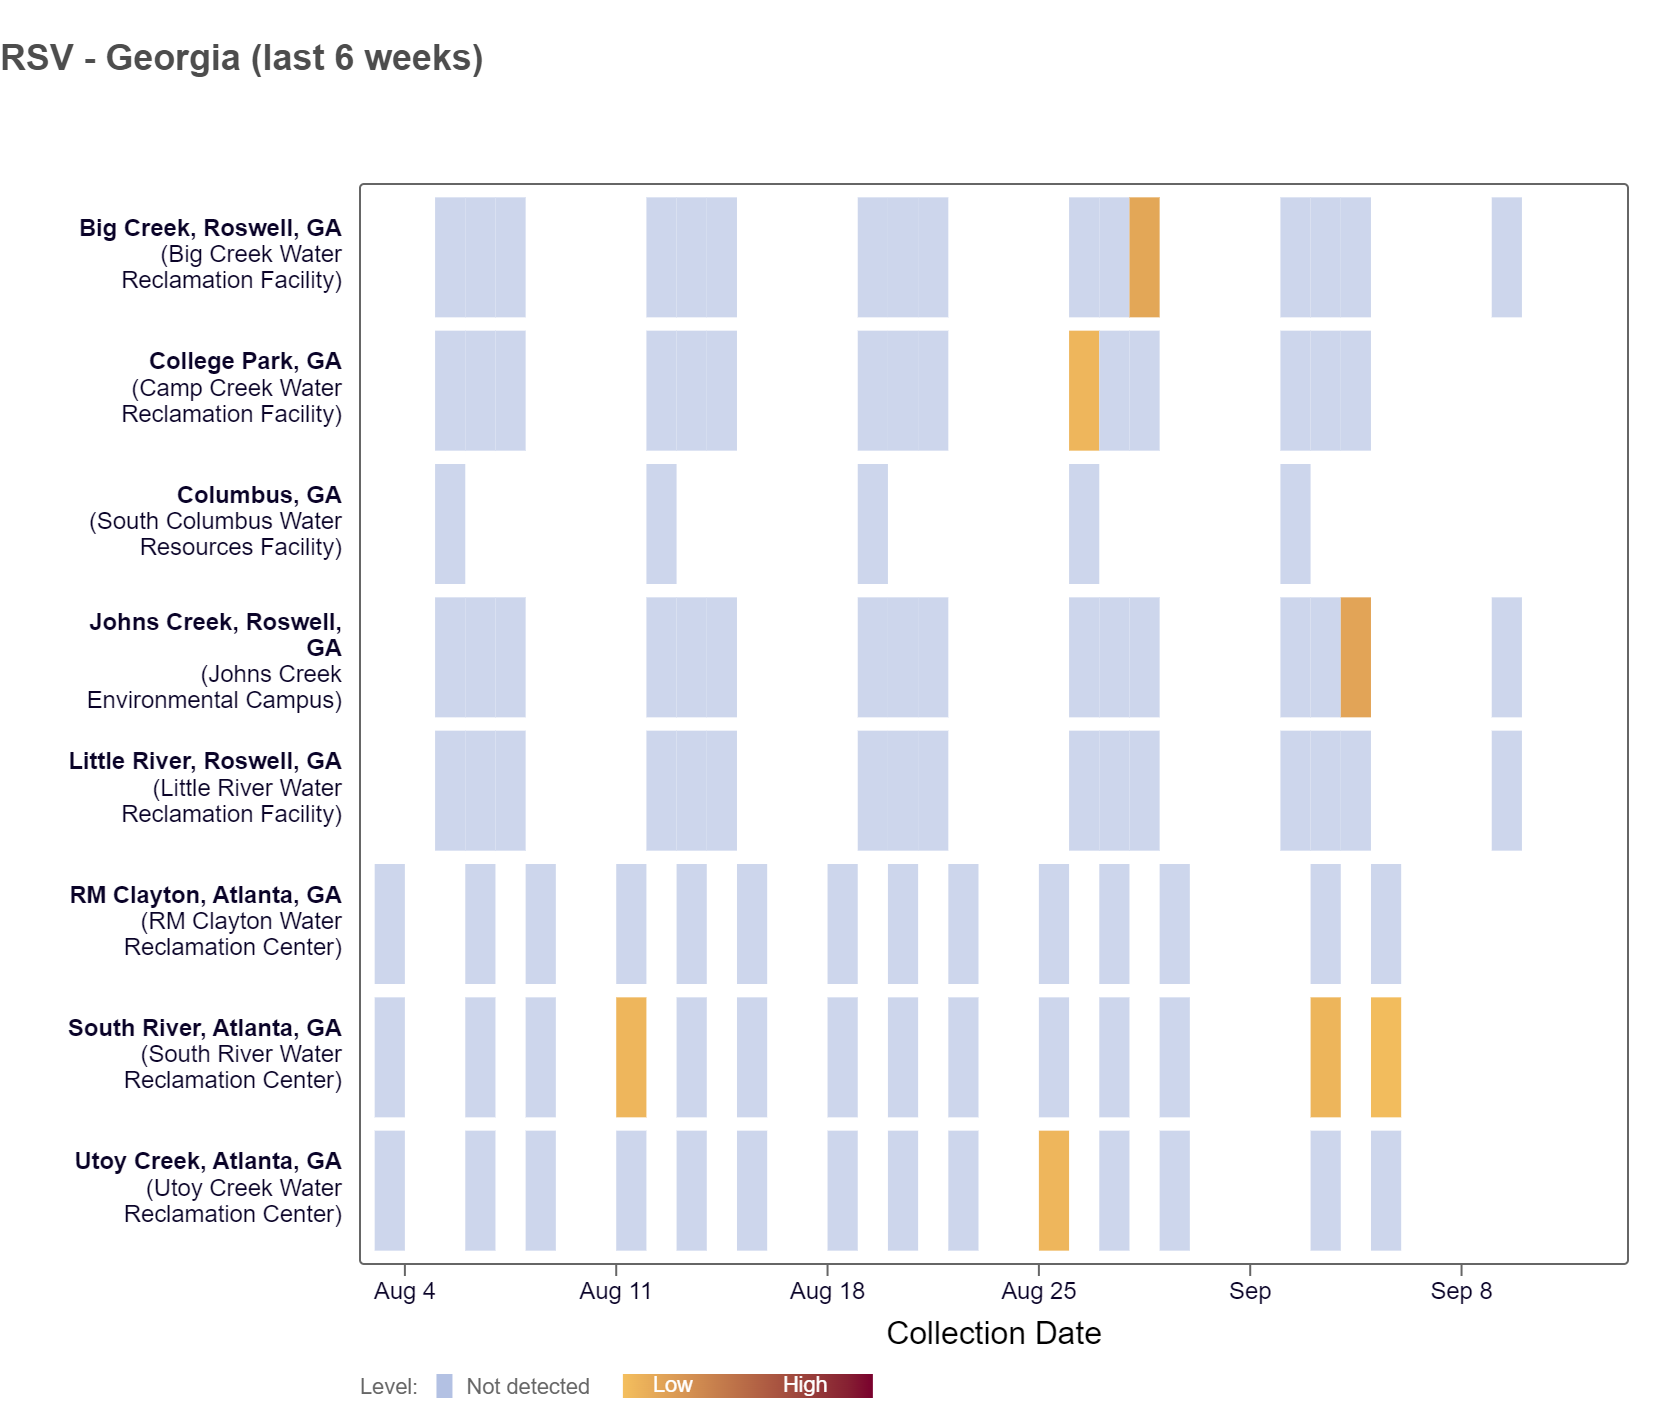
Respiratory syncytial virus (RSV) RNA was detected at the Johns Creek and South River sites over the last two weeks, according to the heat map below. As of 9/13/24, Big Creek, Johns Creek, and Little River are in the LOW (3 sites) wastewater category. There was not enough data to calculate a category for RM Clayton, South River, Utoy Creek, College Park, and Columbus.
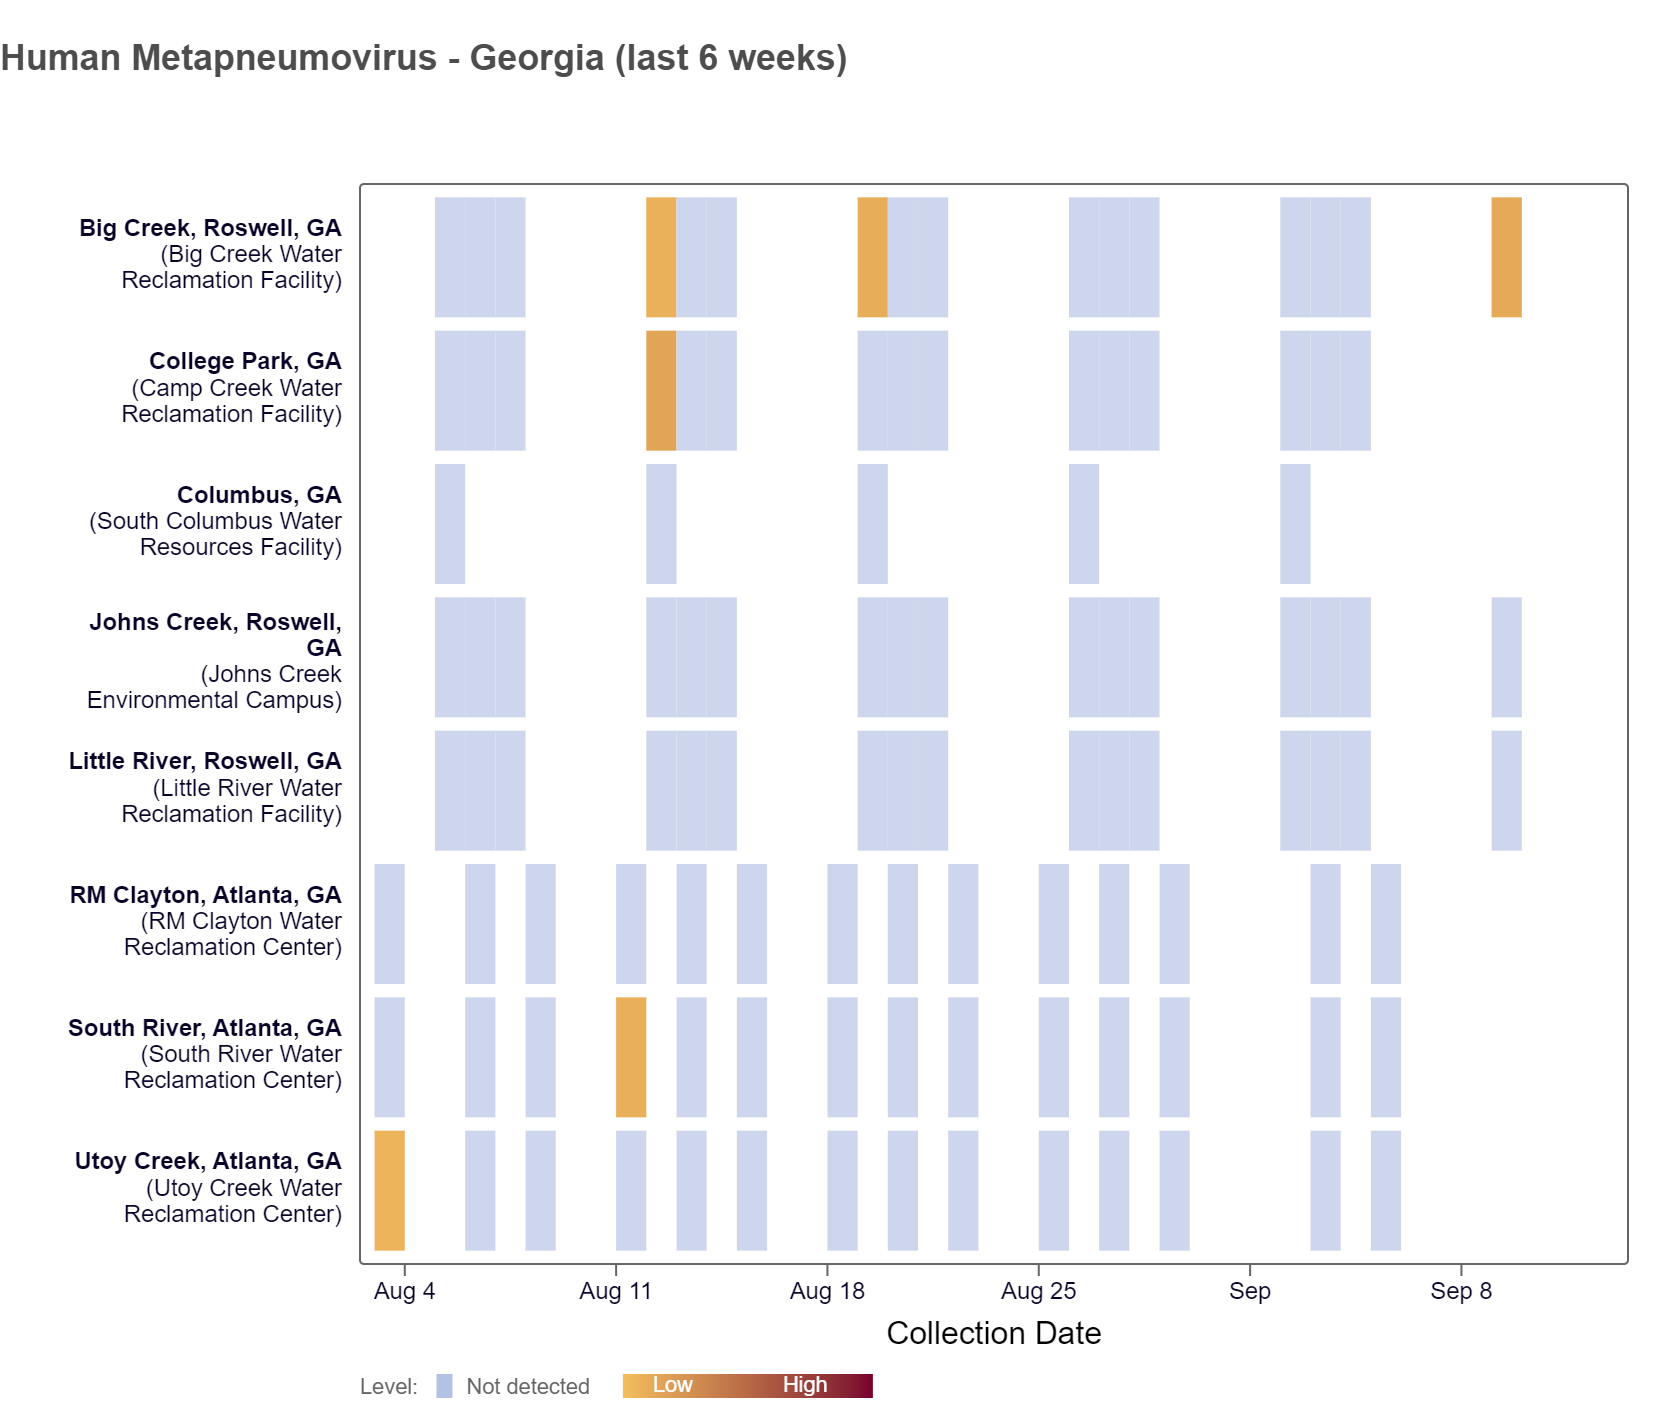
HMPV (human metapneumovirus) RNA was detected at the Big Creek site in the last two weeks, based on the heat map below. As of 9/13/24, Big Creek, Johns Creek, and Little River are in the LOW (3 sites) wastewater category. There was not enough data to calculate a category for RM Clayton, South River, Utoy Creek, College Park, and Columbus.
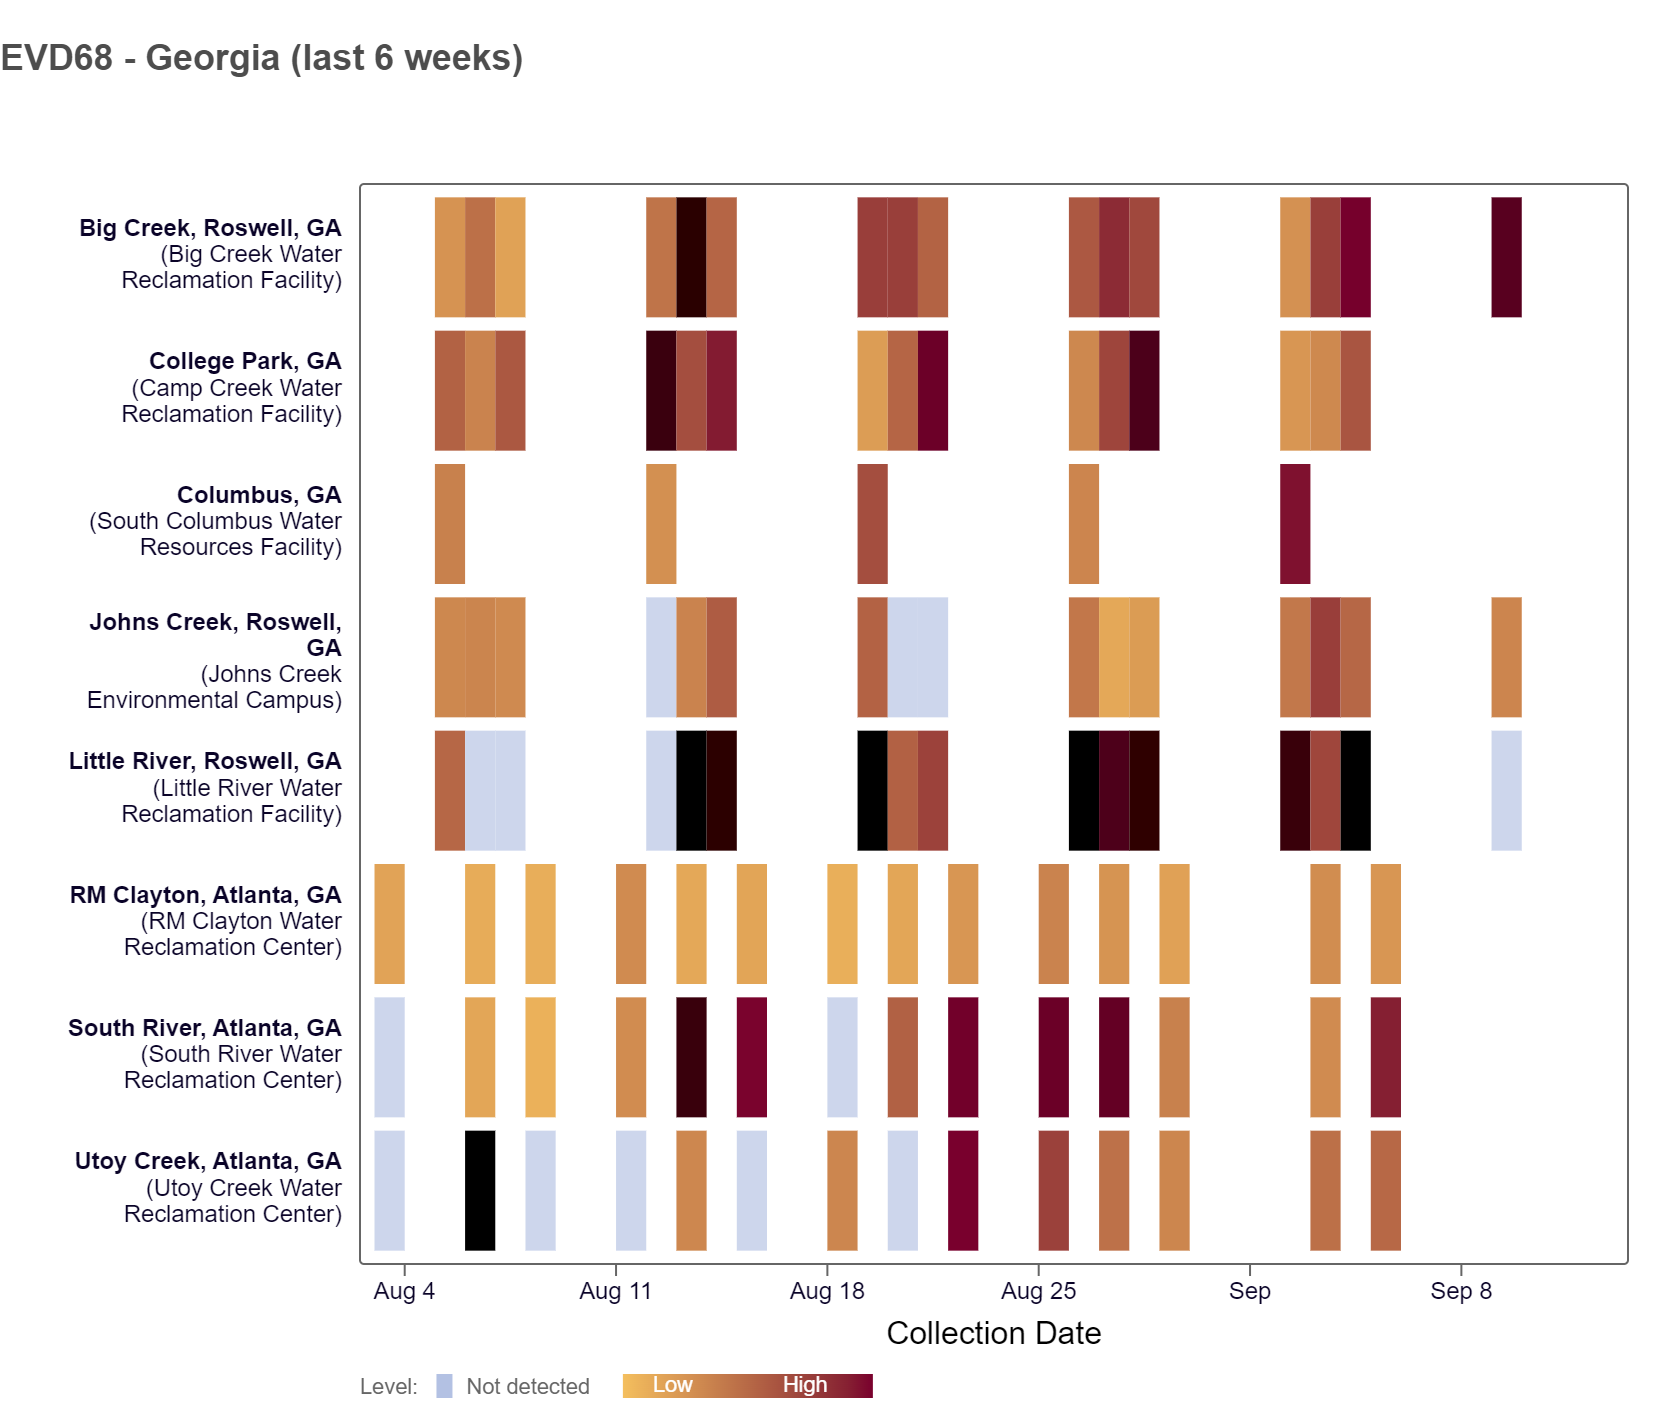
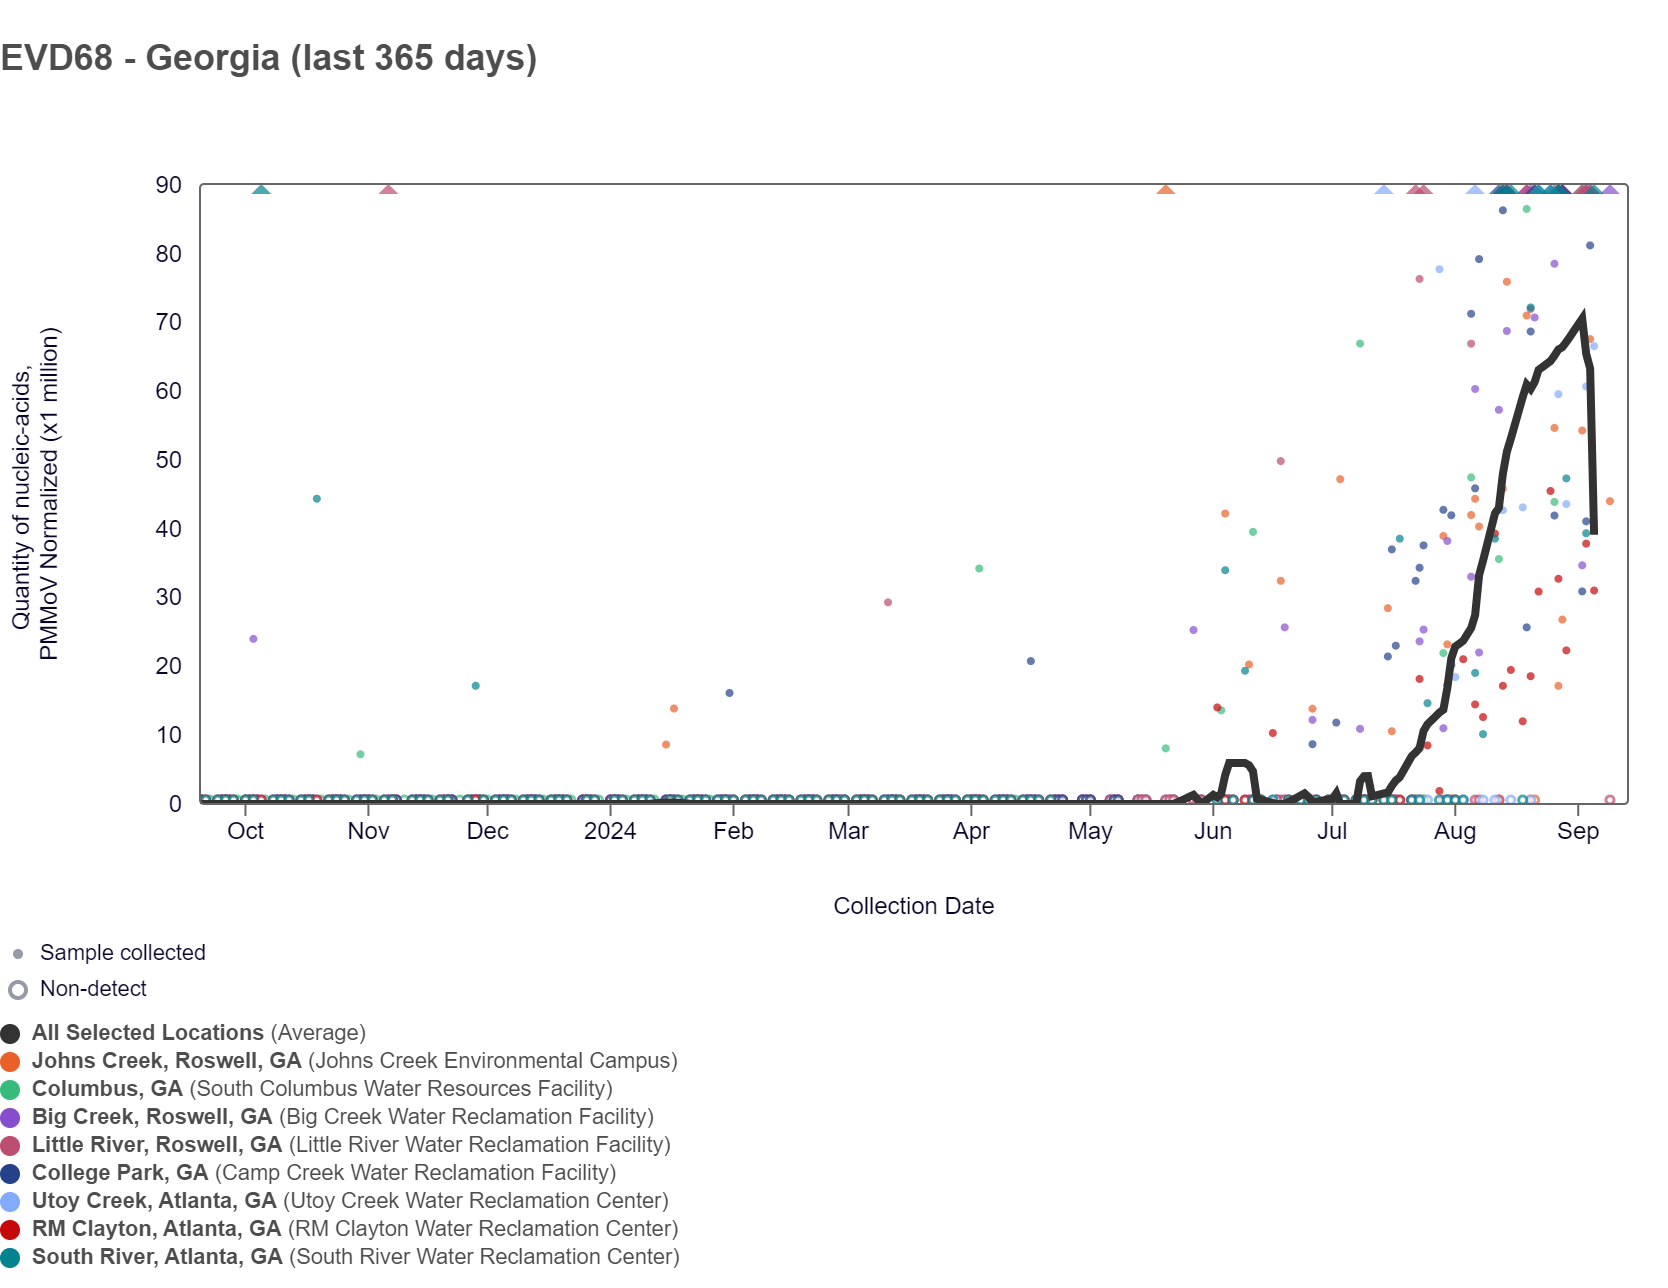
EV-D68 RNA concentrations are between 7,500 and 48,000 copies/g over the last two weeks. There are frequent detections at all 8 Georgia WWSCAN sites ranging from lower to higher concentrations, according to the heat map below. As a reminder, the color blue means the sample was non-detect for EV-D68 RNA and the colors get darker orange with higher concentrations. As of 9/13/24, Big Creek, Johns Creek, and Little River are in the MEDIUM (3 sites) wastewater category. There was not enough data to calculate a category for RM Clayton, South River, Utoy Creek, College Park, and Columbus.
The chart below shows the raw data and the population-weighted aggregated trend line for all 8 Georgia sites when the data is normalized by PMMoV.
Gastrointestinal Pathogens
Norovirus GII and Rotavirus
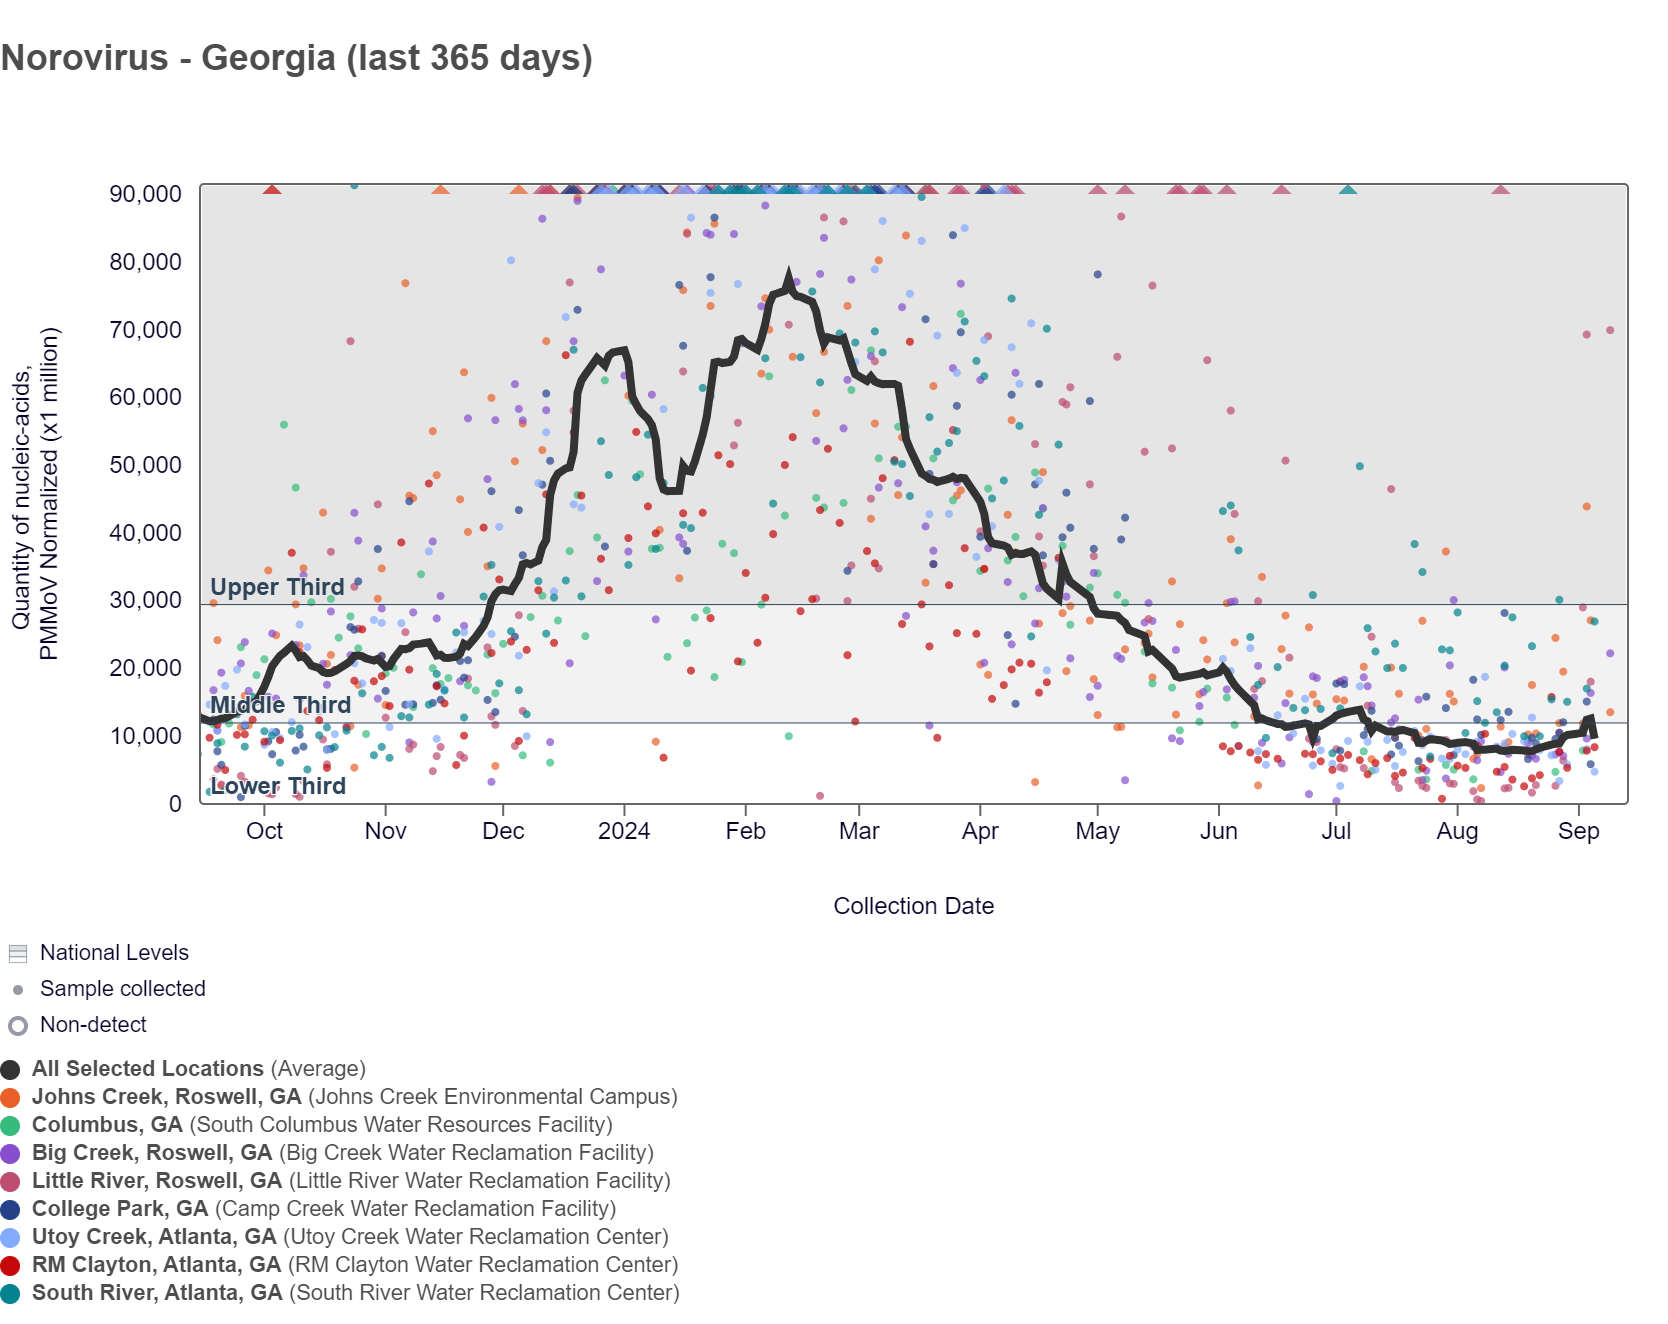
Norovirus GII (HuNoV GII) RNA concentrations range between 800,000 - 12,000,000 copies/g, and the population-weighted average line when the data is normalized by PMMoV for the 8 Georgia sites is within the lower third level. HuNoV GII RNA chart below also shows the raw data. As of 9/13/24, Big Creek and Little River are in the HIGH (2 sites) wastewater category. Johns Creek is in the MEDIUM (1 site) category. There was not enough data to calculate a category for South River, Utoy Creek, College Park, Columbus, and RM Clayton.
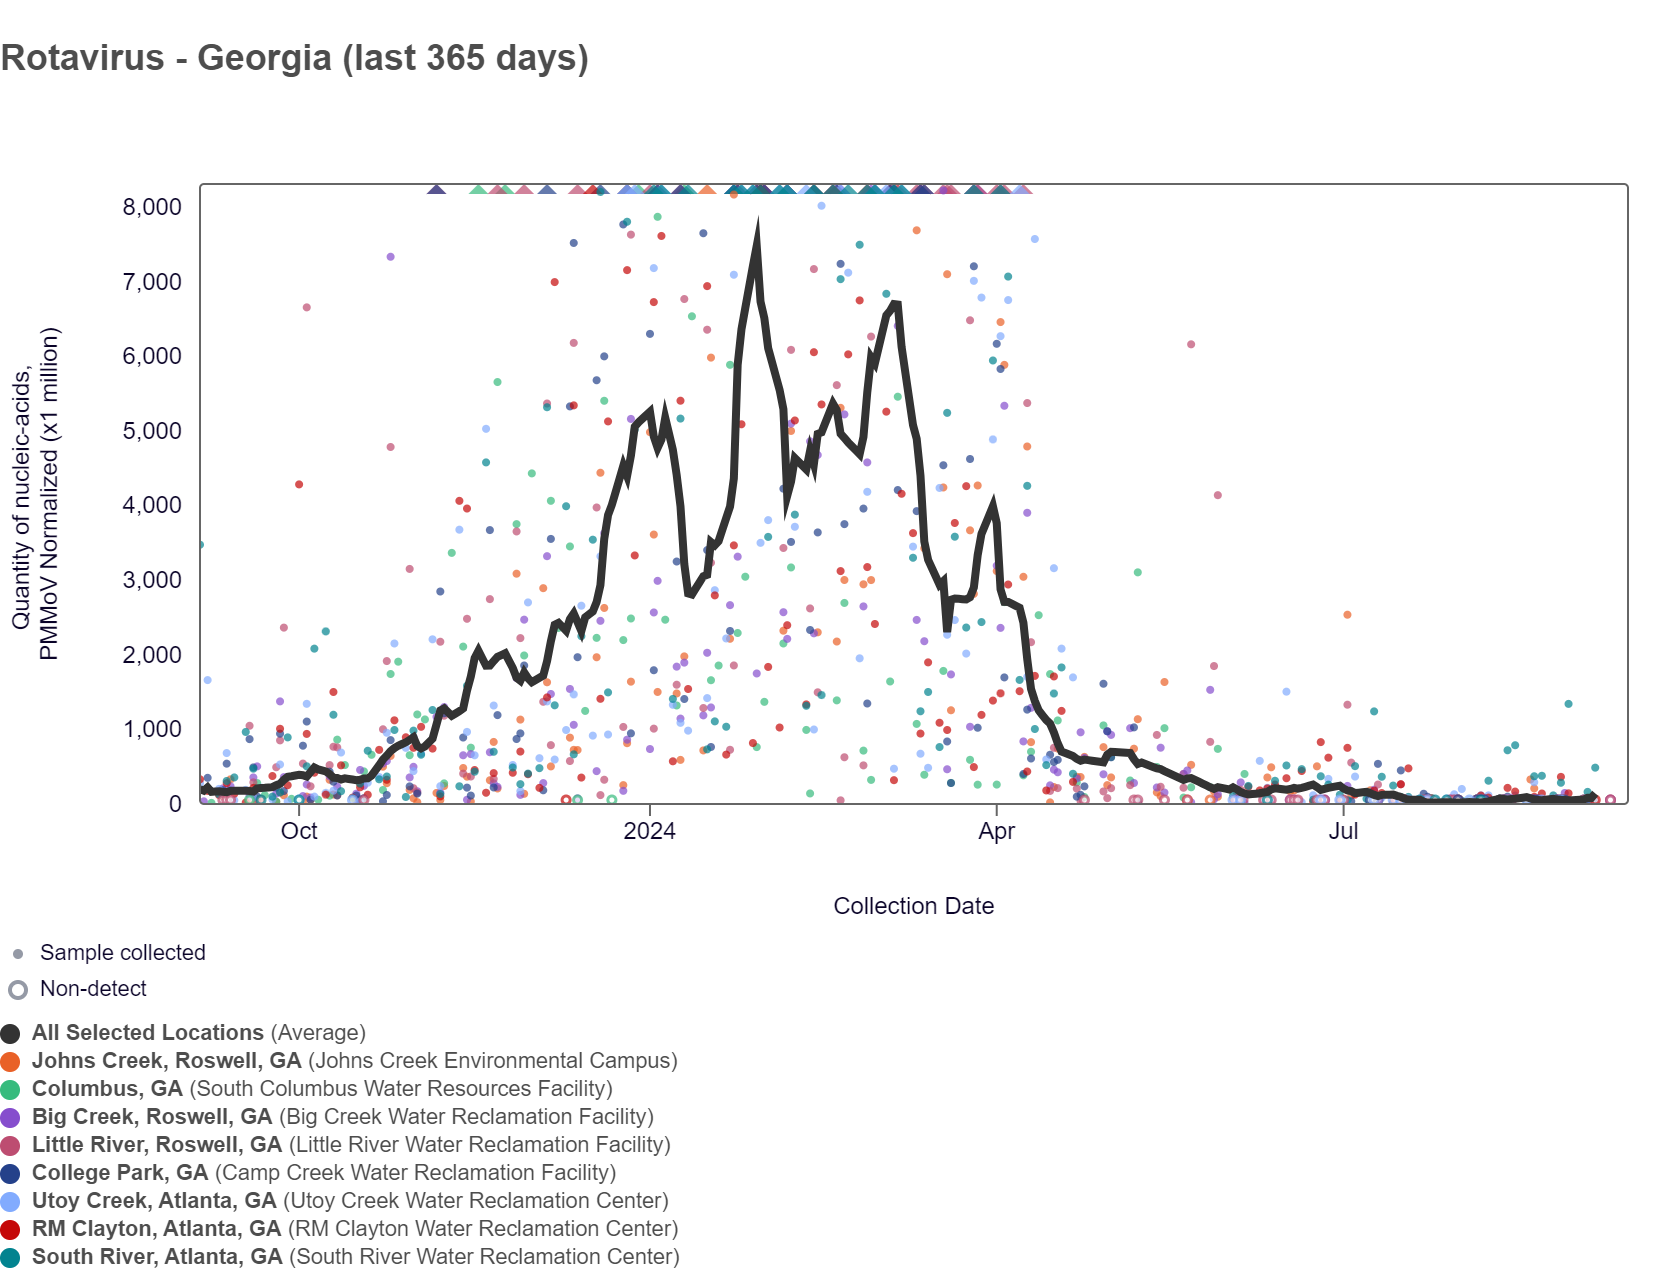
Rotavirus RNA concentrations have been below 61,000 copies/g over the last two weeks. The chart below shows data since September 2023, including the population-weighted average line is shown in black plus the raw data for each site. As of 9/13/24, Big Creek, Johns Creek, and Little River are in the LOW (3 sites) wastewater category. There was not enough data to calculate a category for RM Clayton, South River, Utoy Creek, College Park, and Columbus.
Other Pathogens of Concern
Mpox, Candida auris, and Hepatitis A
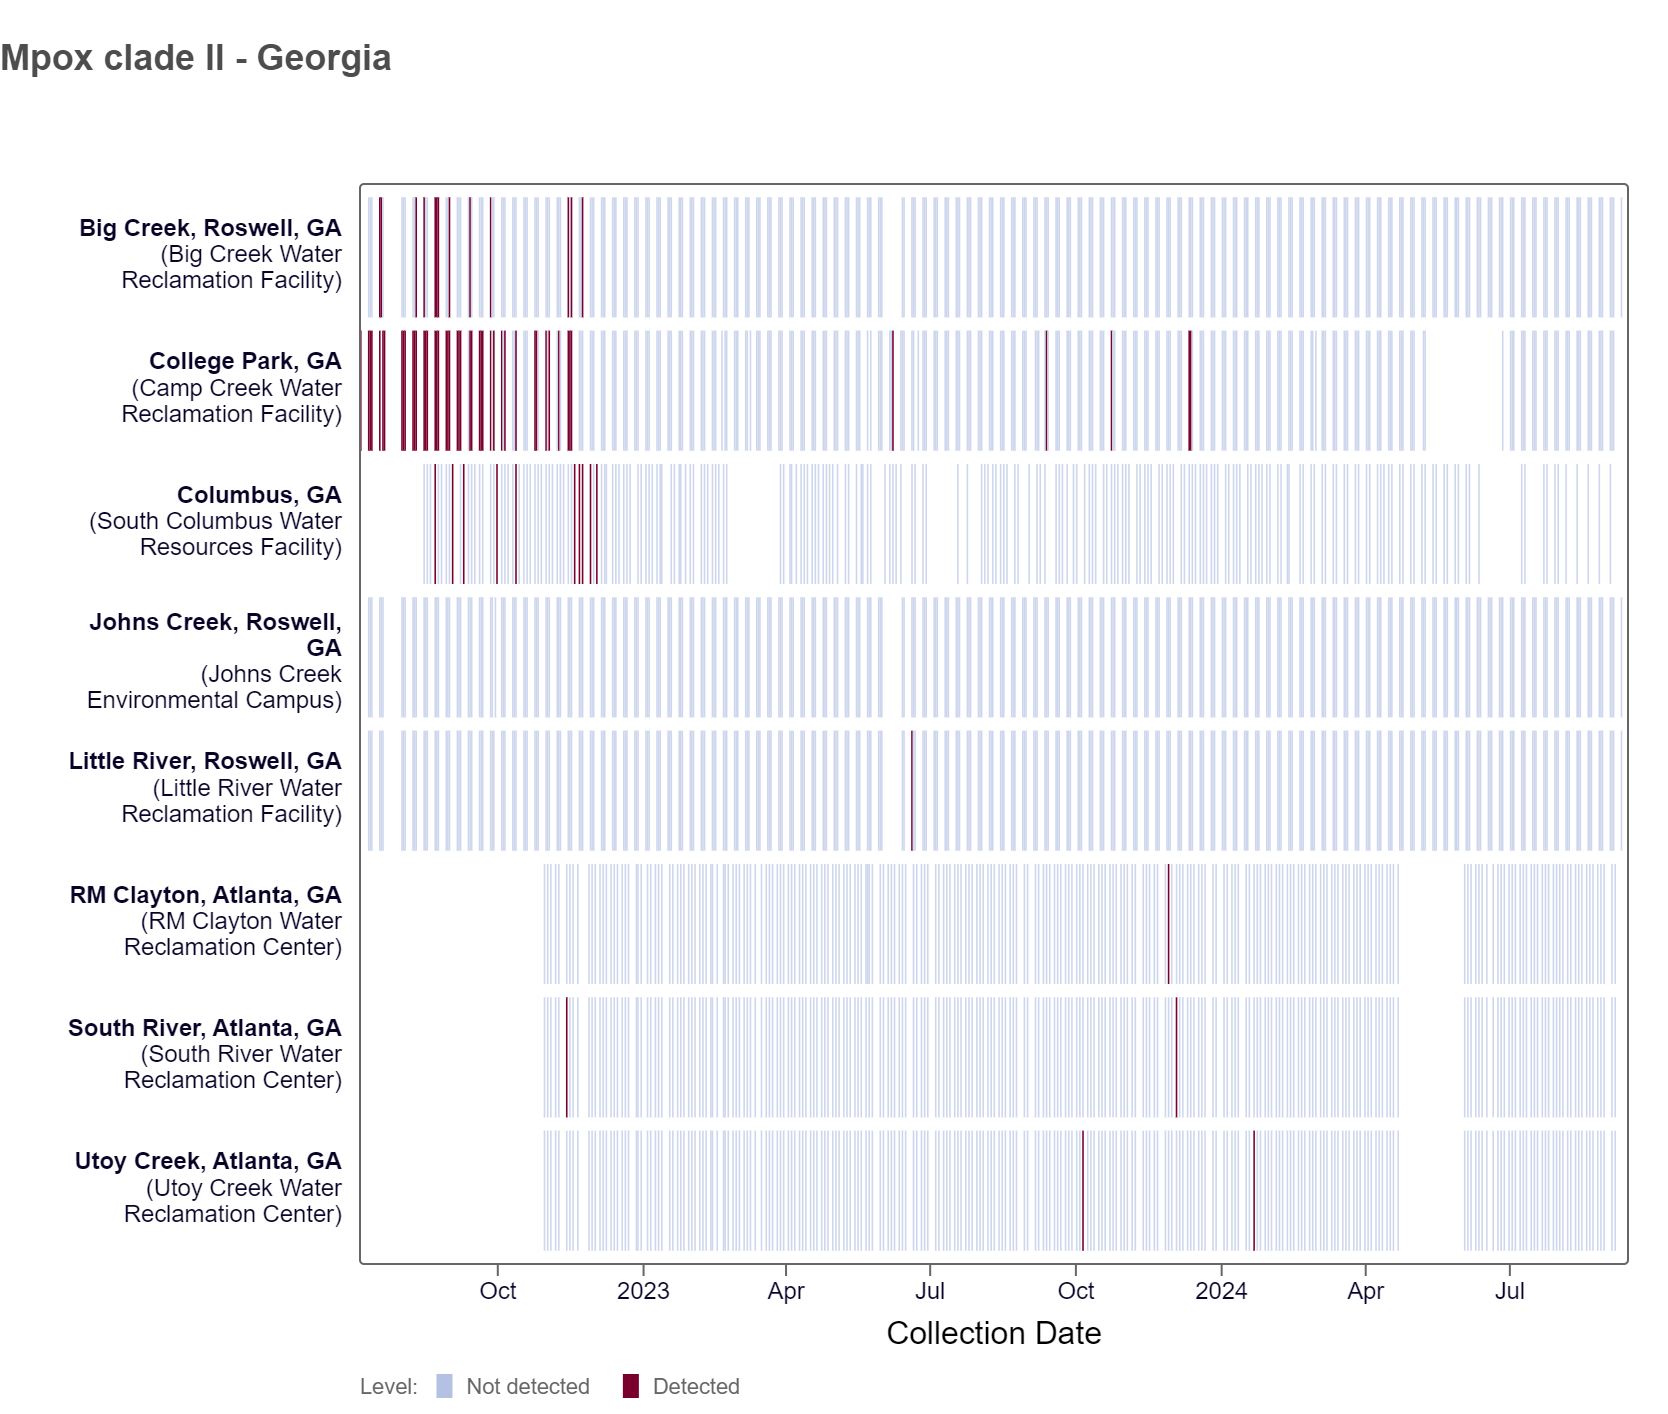
Mpox clade II DNA results have been non-detect at all Georgia sites in the last 21 days. This heat map shows data since July 2022. Sites are labeled in the rows and each date a sample was collected as a column. The color blue means the sample was non-detect for mpox DNA and the color maroon means Mpox DNA was detected. White indicates no sample was collected. As of 9/13/24, Big Creek, Johns Creek, and Little River are in the LOW (3 sites) wastewater category. There was not enough data to calculate a category for RM Clayton, South River, Utoy Creek, College Park, and Columbus.
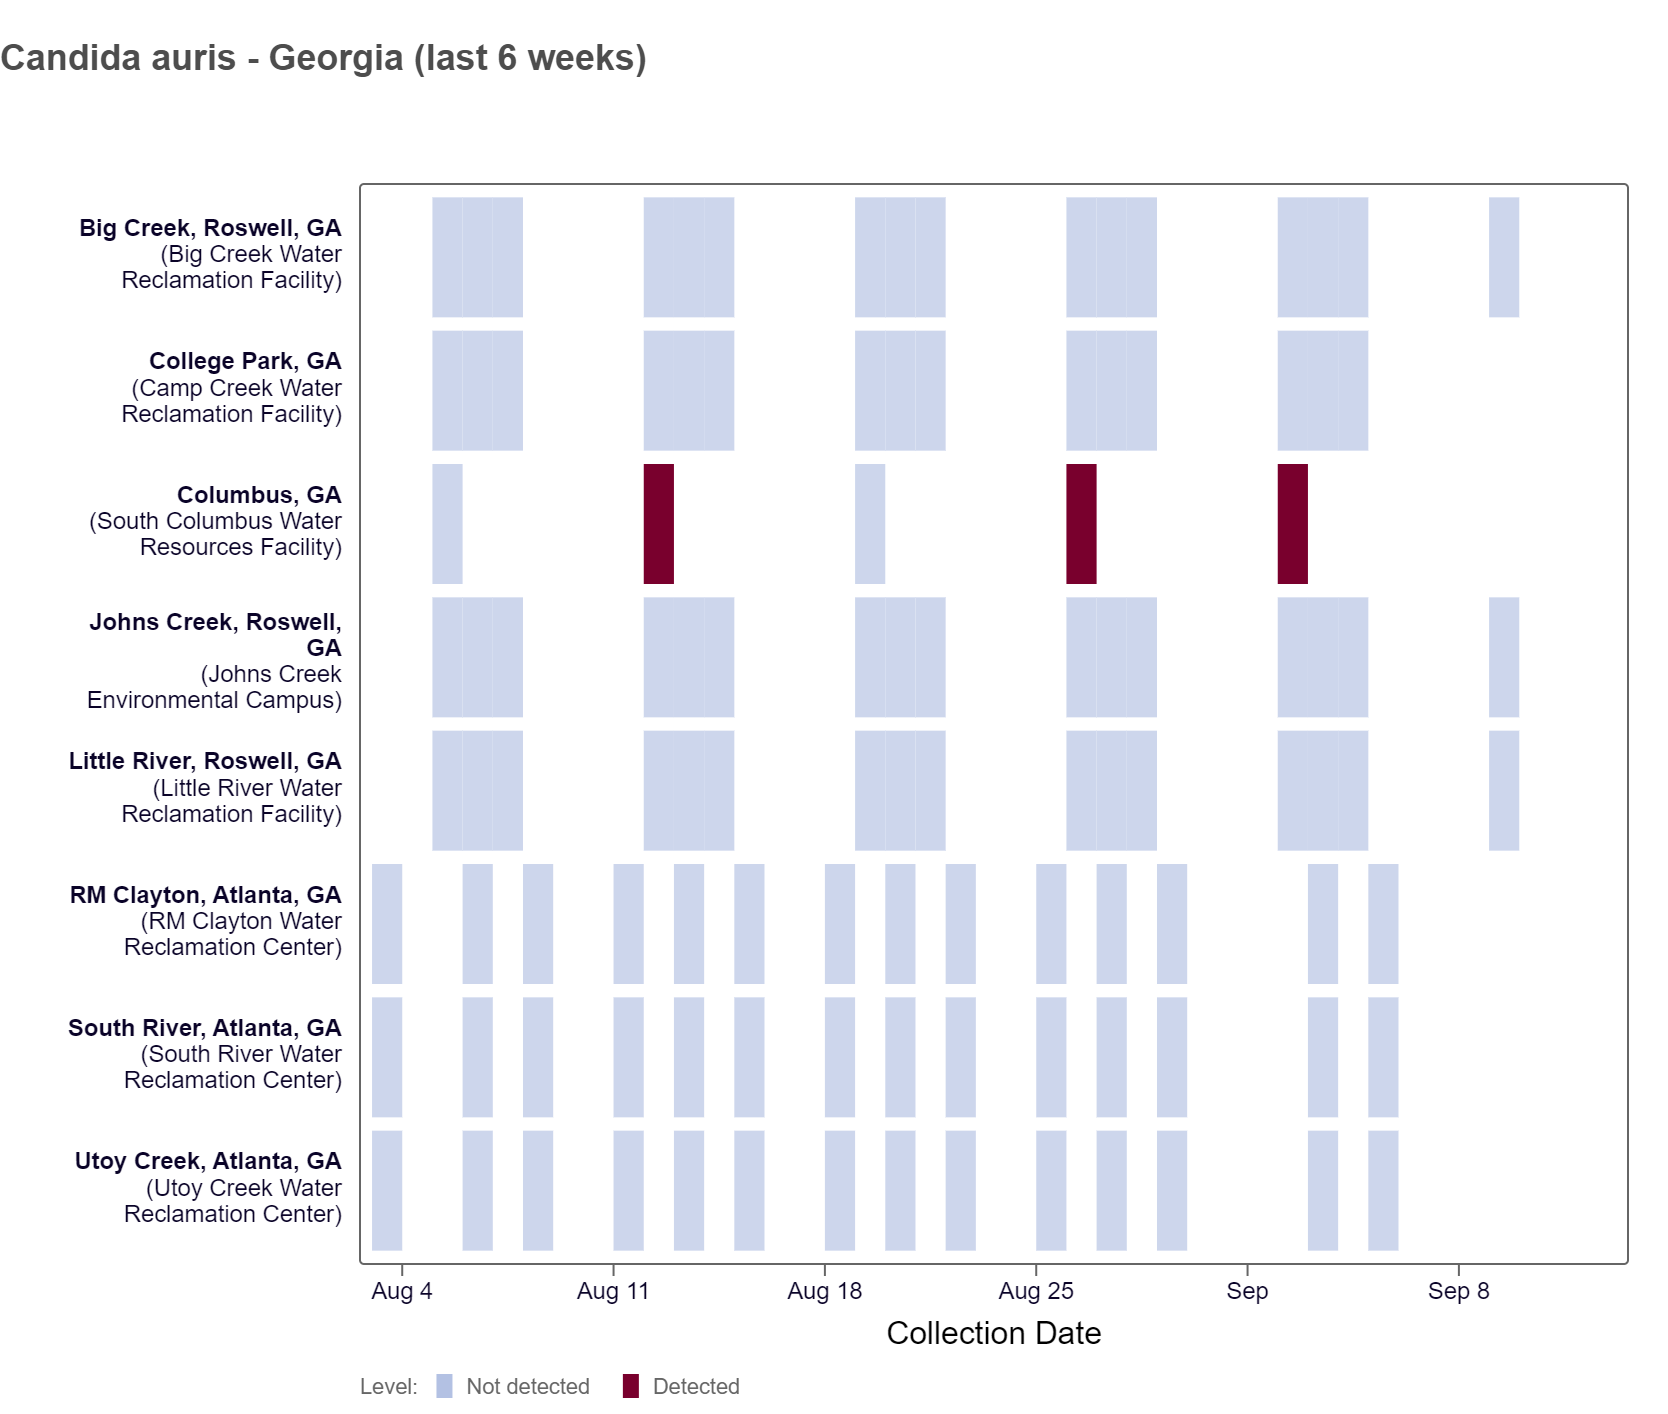
Candida auris DNA has been detected at the Columbus site in the last two weeks, based on the heat map below. As of 9/13/24, Big Creek, Johns Creek, and Little River are in the LOW (3 sites) wastewater category. There was not enough data to calculate a category for RM Clayton, South River, Utoy Creek, College Park, and Columbus.
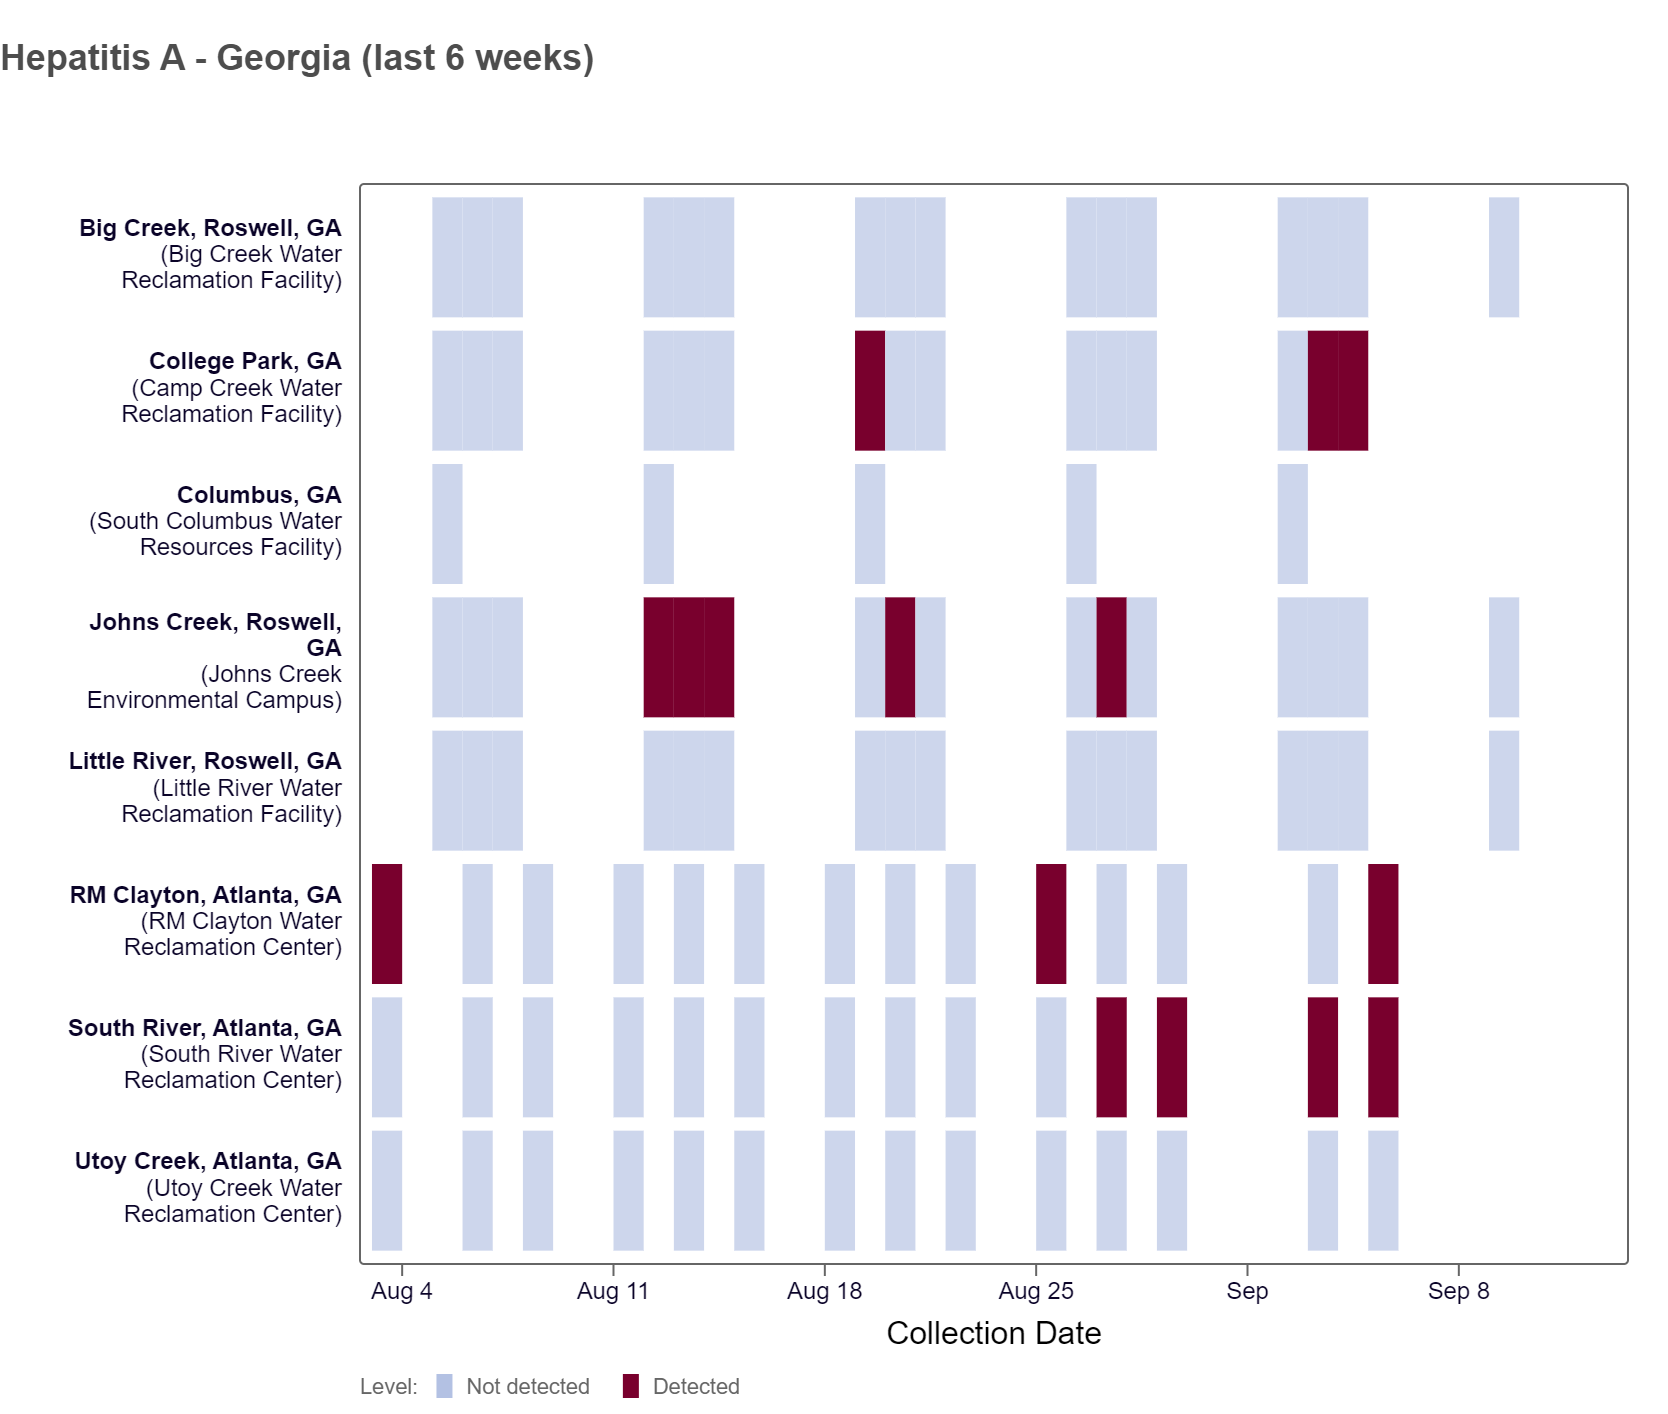
Hepatitis A RNA was detected at the College Park, RM Clayton and South River sites over the last two weeks, according to the heat map. As of 8/30/24, all Georgia WWSCAN sites are in the LOW (8 sites) wastewater category.
WWSCAN protocols and methods in peer reviewed publications
Protocols (Pre-analytical methods and SARS-CoV-2 analytical methods including controls):
- High Throughput RNA Extraction and PCR Inhibitor Removal of Settled Solids for Wastewater Surveillance of SARS-CoV-2 RNA
- High Throughput pre-analytical processing of wastewater settled solids for SARS-CoV-2 RNA analyses
- Quantification of SARS-CoV-2 variant mutations (HV69-70, E484K/N501Y, del156-157/R158G, del143-145, LPPA24S, S:477-505, and ORF1a Del 141-143) in settled solids using digital RT-PCR
- High Throughput SARS-COV-2, PMMoV, and BCoV quantification in settled solids using digital RT-PCR
Pre-prints and peer-reviewed publications provided WWSCAN methods:
- SARS-CoV-2
- Influenza, Human metapneumovirus, Respiratory syncytial virus, Human parainfluenza
- Mpox
- Norovirus GII
- Adenovirus group F, Rotavirus, Candida auris, Hepatitis A
- Enterovirus D68
Newly published papers are available here
- Detection of Hemagglutinin H5 Influenza A Virus Sequence in Municipal Wastewater Solids at Wastewater Treatment Plants with Increases in Influenza A in Spring, 2024
- Prospective study of Candida auris nucleic acids in wastewater solids in 190 wastewater treatment plants in the United States suggests widespread occurrence
Public Health Factsheets:
- Influenza A Fact Sheet: Provides a summary of a November 2023 paper exploring how to analyze wastewater data to extract relevant public health insights on Influenza A. Click here to access the IAV fact sheet.
- RSV Fact Sheet: Provides a summary of a March 2024 paper exploring how to analyze wastewater data to extract relevant public health insights on RSV. Click here to access the RSV fact sheet.
New WastewaterSCAN Published Body of Work document:
- We are excited to share a new document that provides an overview of the program’s peer-reviewed scientific literature, organized by topics and themes. Click here to access the WastewaterSCAN published body of work.
Related News
The next stakeholder meeting will take place on Friday, October 11th @ 12PM EST. You can use this zoom link to join. Hope to see you there!