
Georgia WWSCAN biweekly update 6/9/2023
Welcome to the bi-weekly update for WWSCAN partners in Georgia! All samples provided up through 6/5/23 have been processed in the lab and data are on the site at data.wastewaterscan.org.
During today's stakeholder call, we did a deeper dive into all the features of the website and its use. If you missed that, we will make the slides and recording available on Monday.
If you notice any bugs on the site or have any comments about it, please continue to send your feedback via email Amanda Bidwell at albidwel@stanford.edu. We appreciate your partnership!
COVID-19
SARS-CoV-2 and Variants
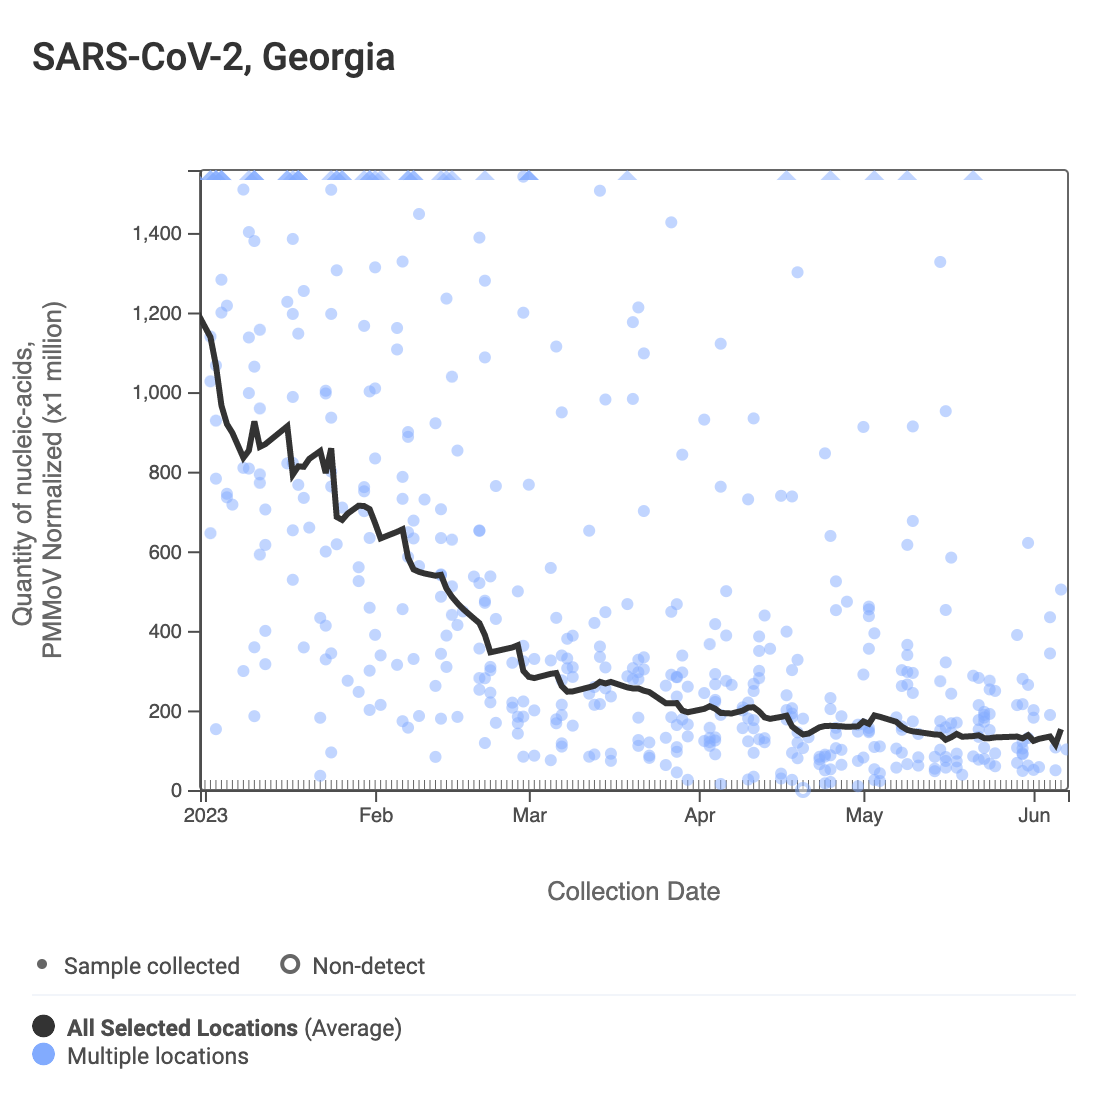
SARS-CoV-2 N gene RNA concentrations at Georgia sites still remain low. Concentrations range from 12,000-85,000 copies per gram. The dark gray line in the chart below is a population-weighted aggregated trend line for all 8 Georgia sites when the data is normalized by PMMoV. There is additional information on the methodology behind this trend line available here. Clicking each chart will redirect you to the WWSCAN website to interact with a chart.
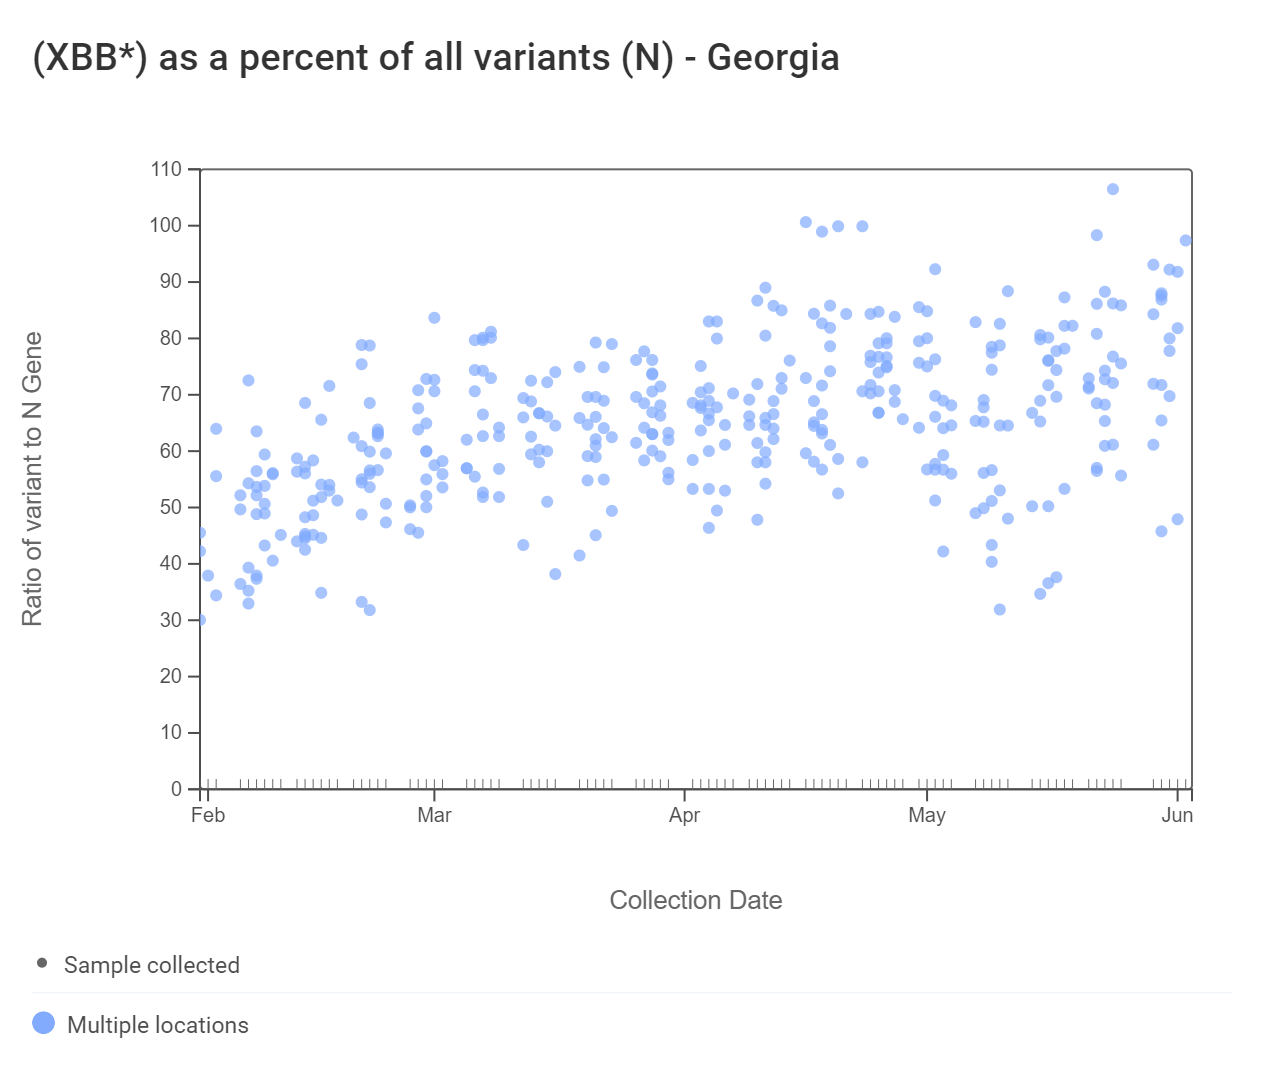
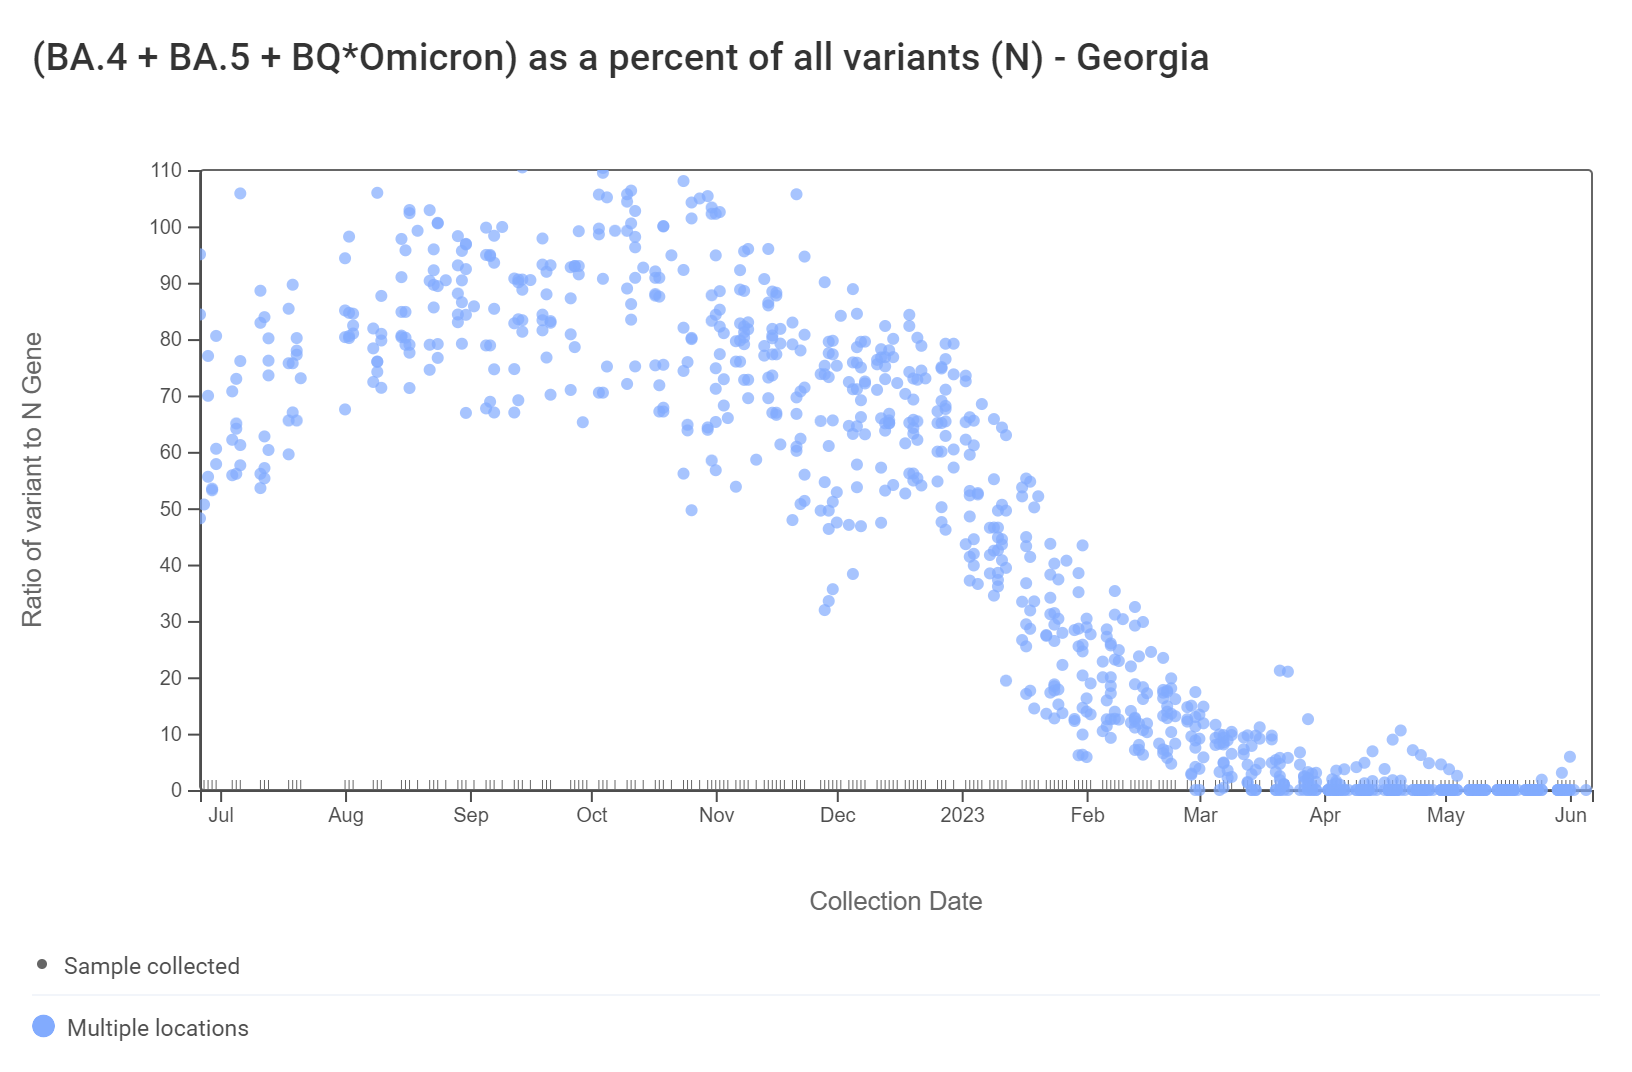
Early in 2023, WWSCAN started testing for XBB* and these results are available to view by selecting 'SARS-CoV-2 View by Variant' on data.wastewaterscan.org. For Georgia sites, data dates back to early February 2023. The ratio of the XBB* mutations/N across all Georgia plants is shown in the chart below. As the ratio reaches 100%, it suggests that all the SARS-CoV-2 genomes in wastewater have the XBB* mutations. These estimates have not changed much since our last update, and data indicate that the average ratio XBB* mutations/N is ~75% but has ranged from 40-100% recently. This suggests the majority of infections across the communities are caused by XBB*. The next chart below shows the ratio of the BA.5, BA.4, and BQ* mutation/N across all Georgia plants. It can be read the same way as the XBB* chart. The average ratio is close to 0%. Note that our XBB* assay will also detect XBB.1.16, XBB.1.9, and FD.2 (XBB.1.5.15.2*).
For most targets, we are also including a trend analysis of their concentrations in wastewater solids (normalized by PMMoV) based on the most recent estimates compared to the recent past. In order to calculate a trend, we require 3 points over the last 21 days. We test for linear trends between log10-transformed concentration (target/PMMoV) and time; the trend must be classified as statistically significant (p<0.1). To read more about our methods for trend analysis click the link here.
Analysis of SARS-CoV-2 concentrations, across the 8 Georgia sites, shows no trend at all sites except Johns Creek, which has a significant downward trend. This can be interpreted to mean that over the last 21 days, concentrations of SARS-CoV-2 RNA have generally not changed at most sites.
Other Respiratory Viruses
IAV, IBV, RSV, and HMPV
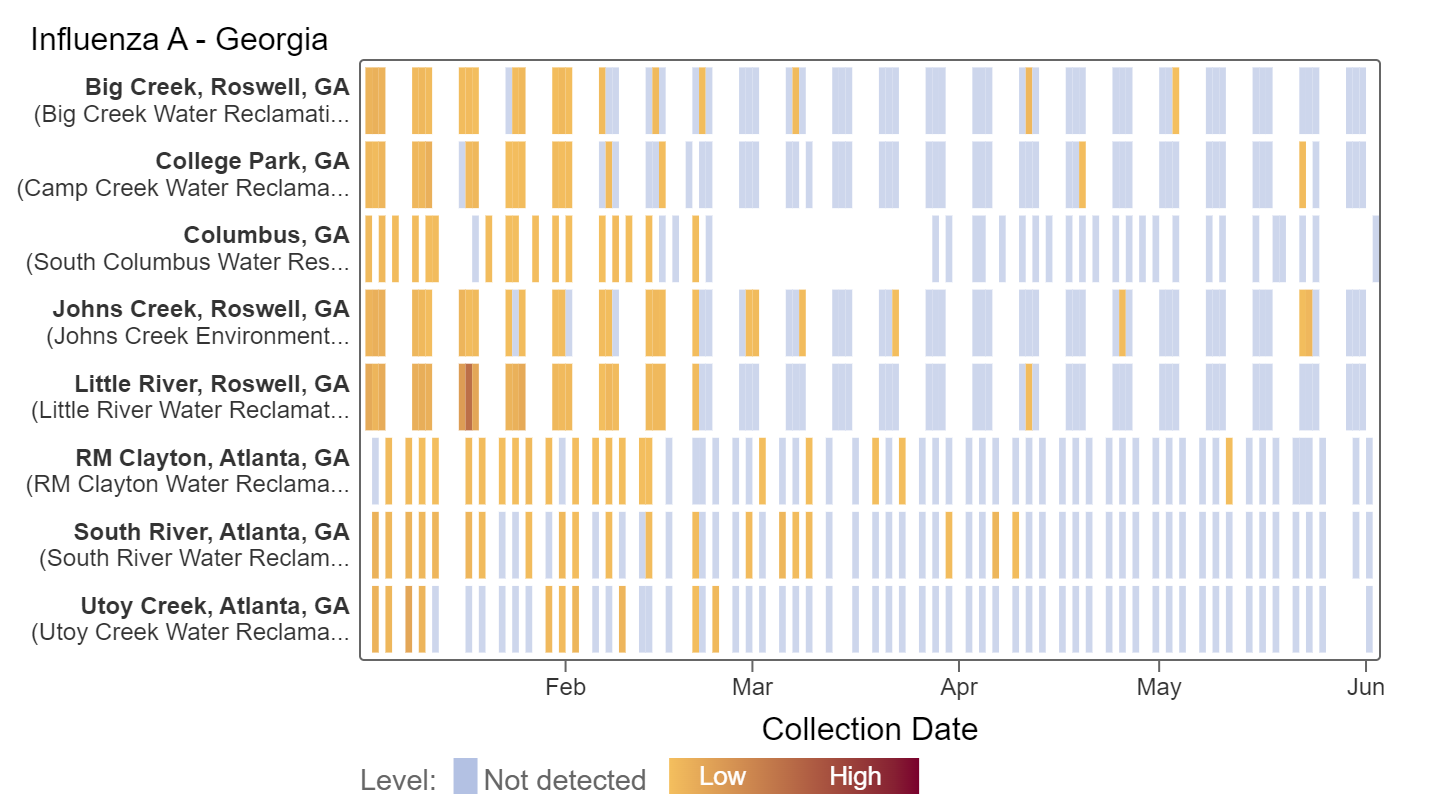
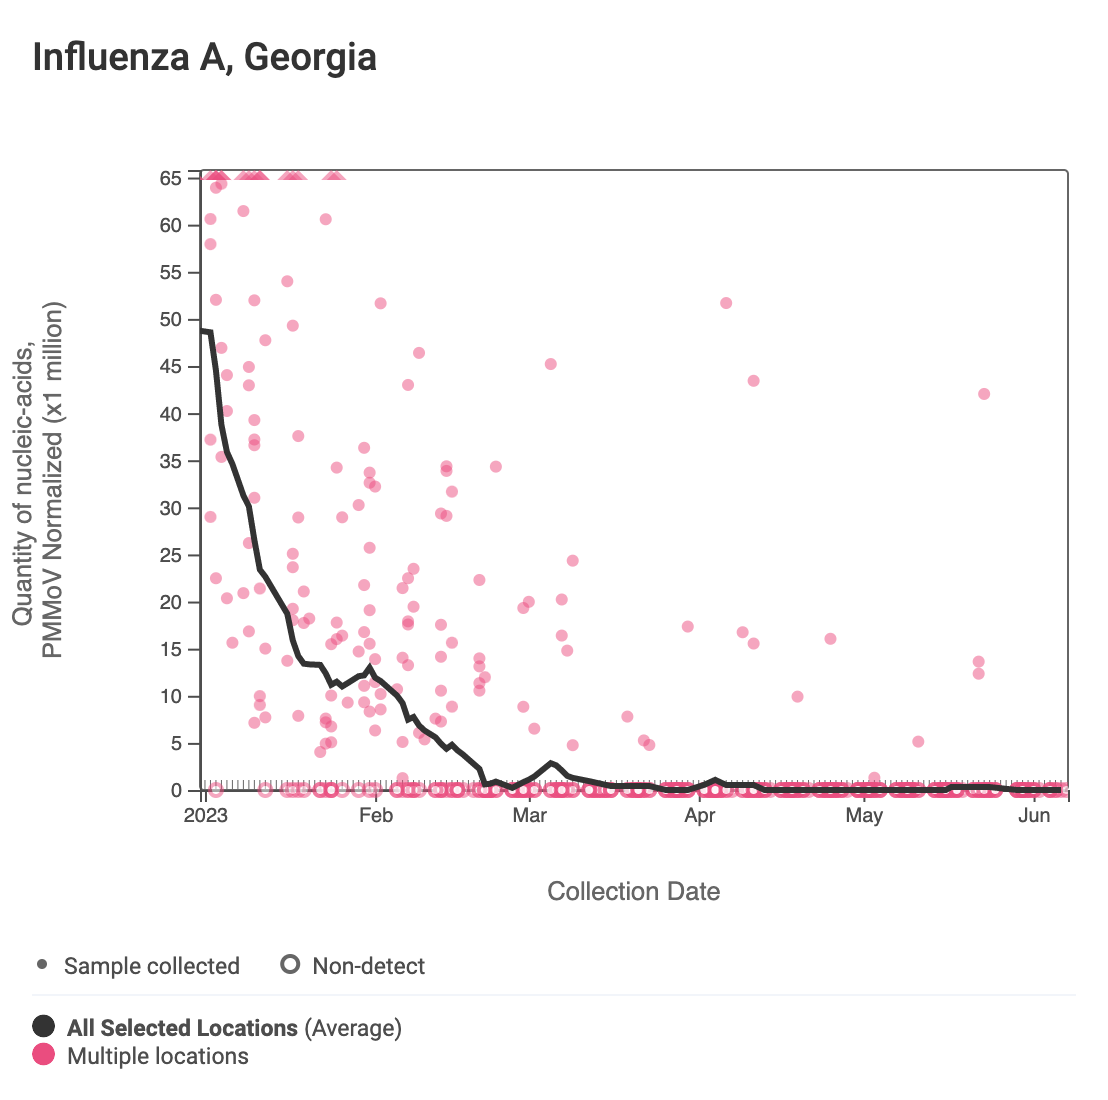
Influenza A (IAV) RNA IAV was sporadically detected last month at decreasing rates. Based on analysis of IAV concentrations normalized by PMMoV at all sites, there is no significant trend over the last 21 days at all sites but Johns Creek, which has a significant downward trend.
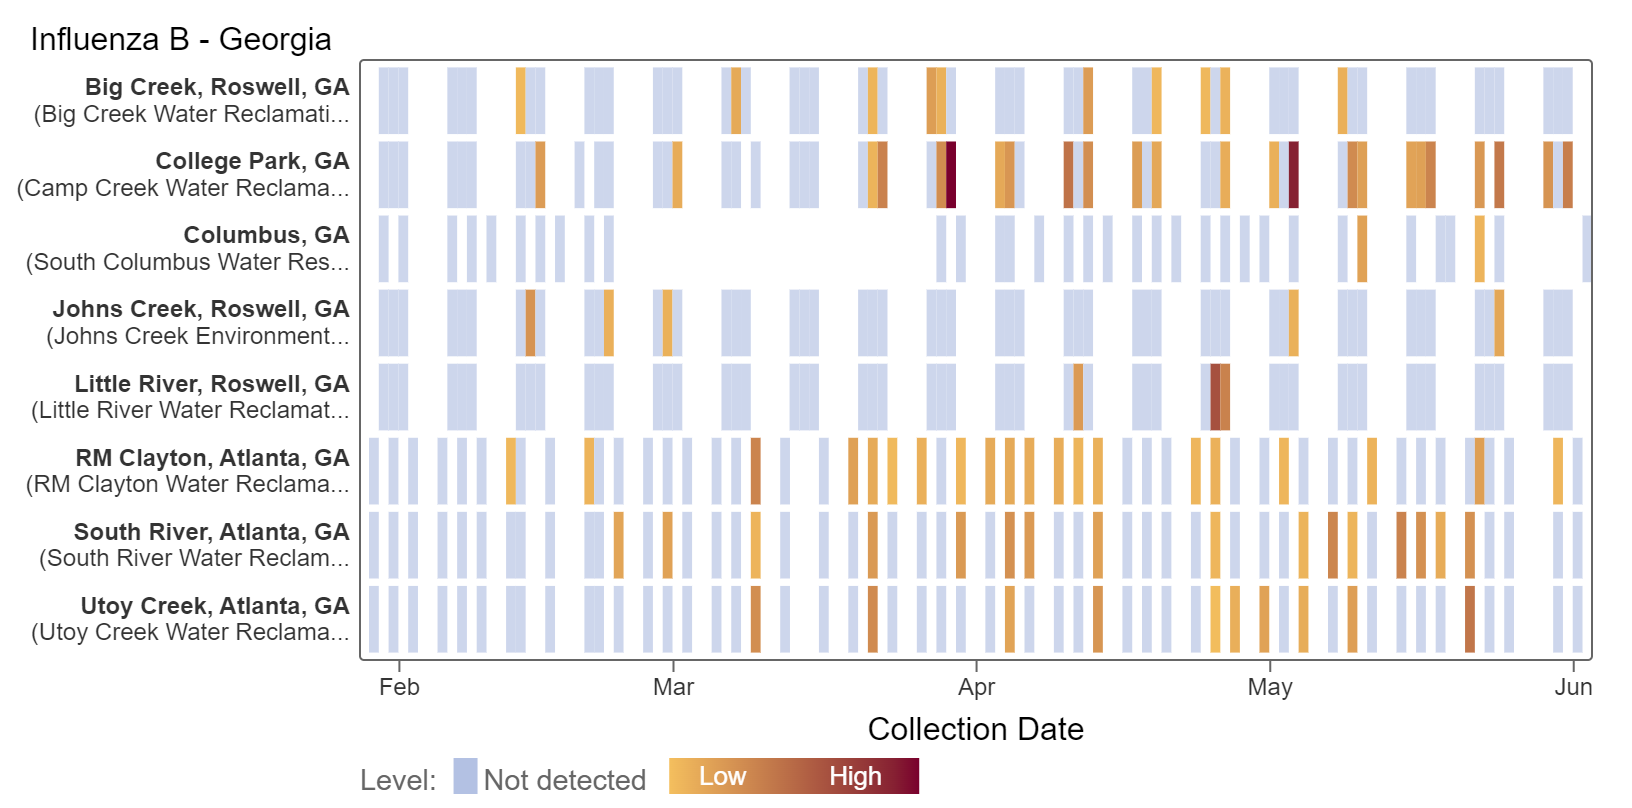
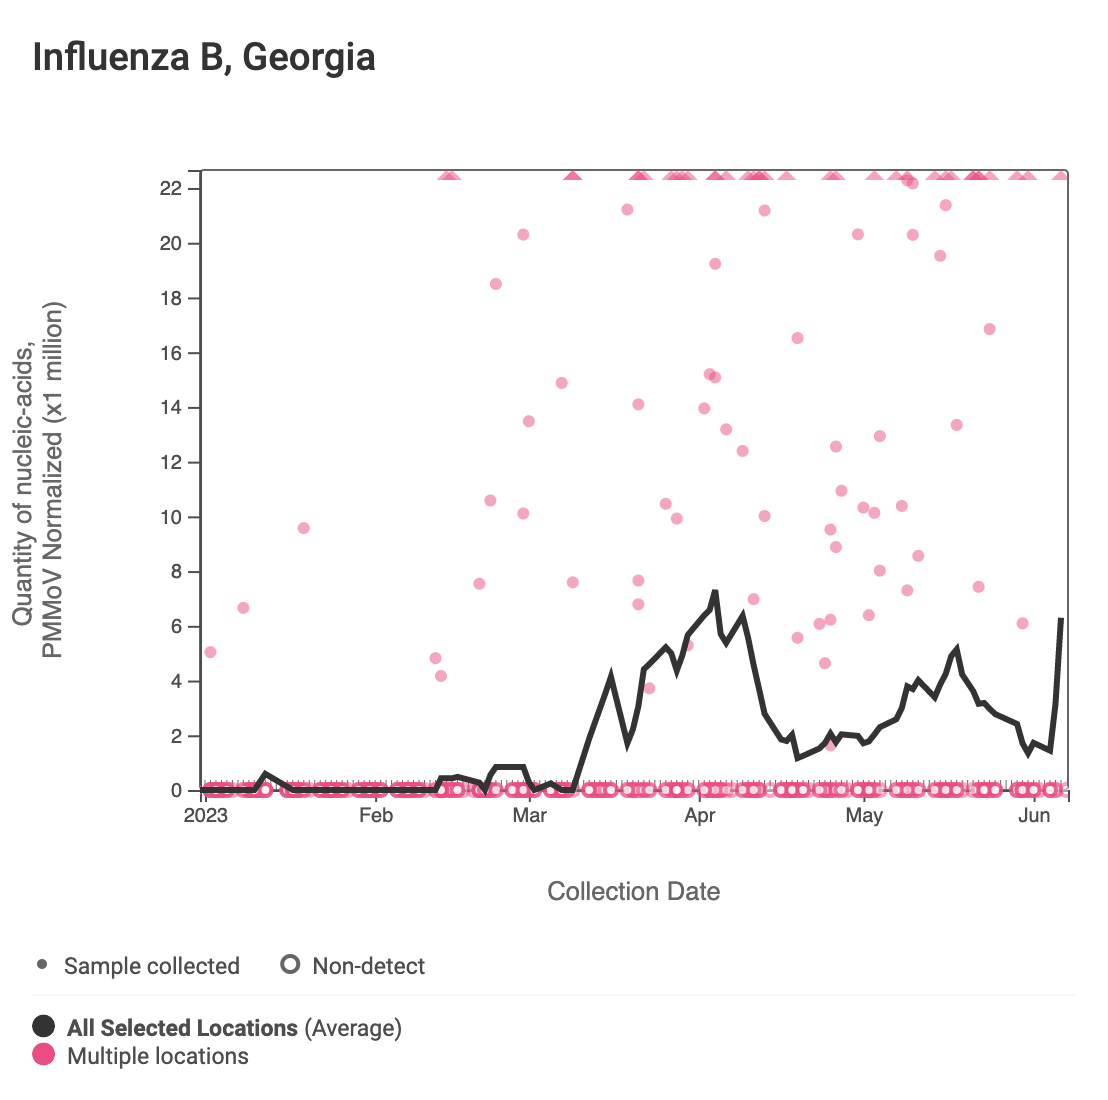
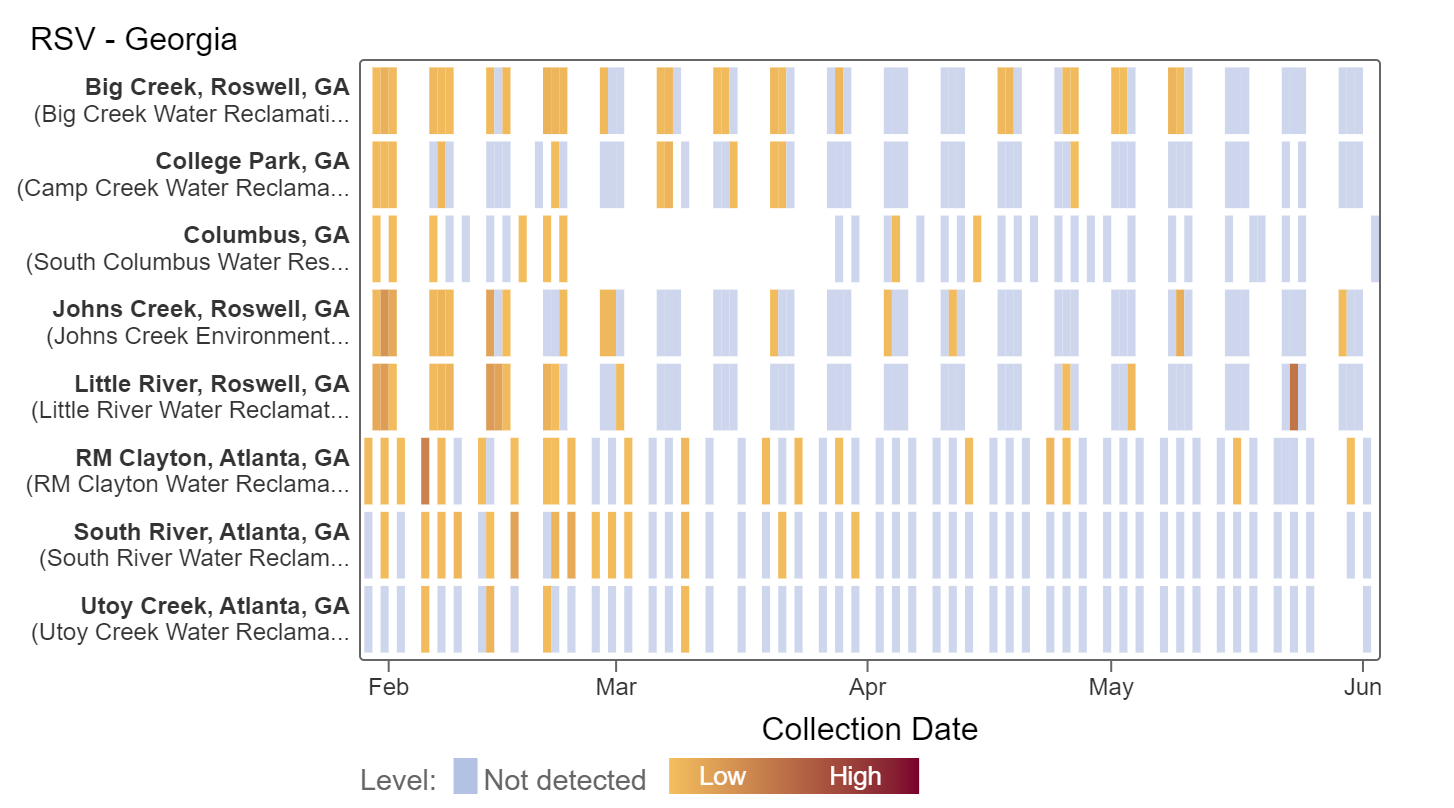
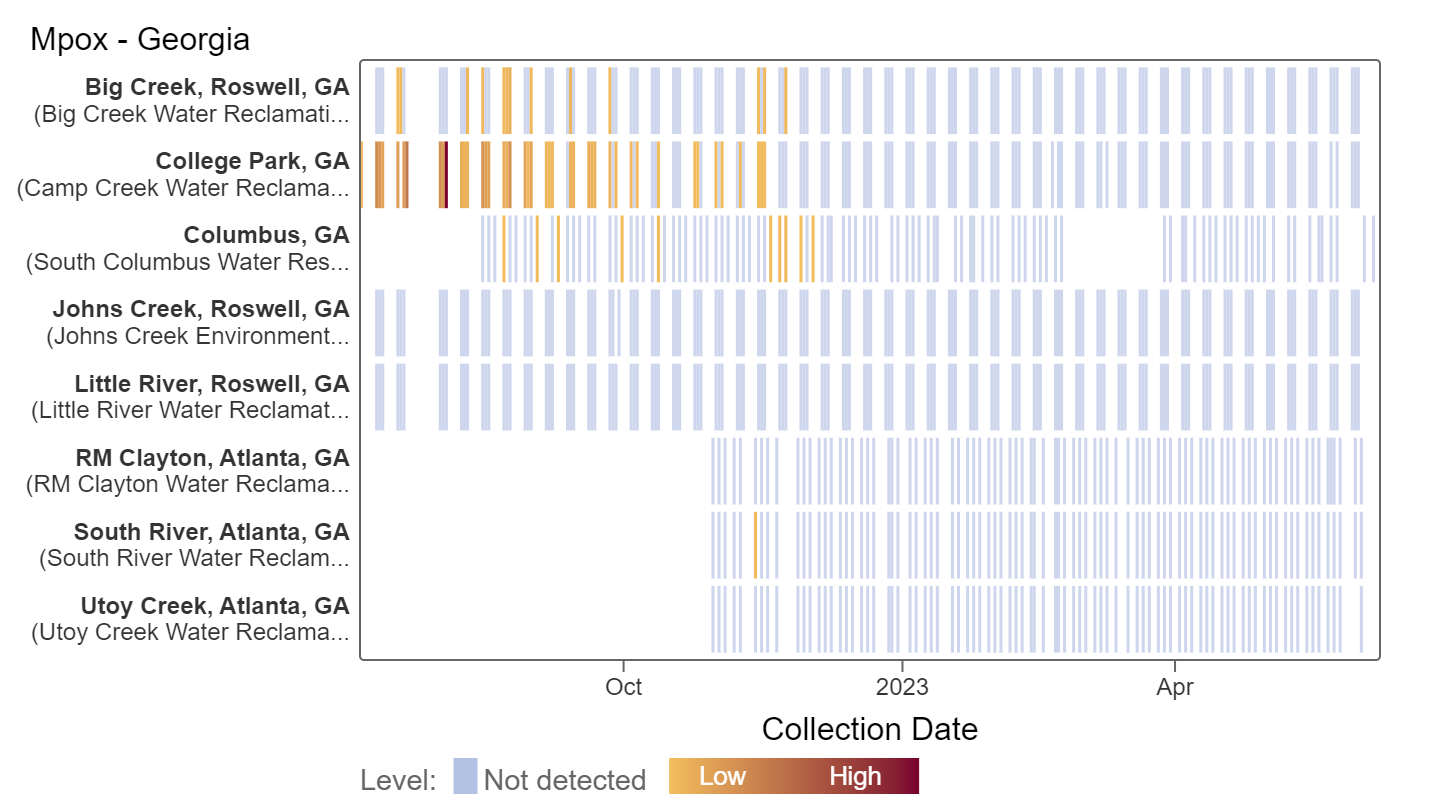
When samples are non-detect, this means that the amount of viral RNA in the wastewater is below the limit of detection of our methods. This means that there are likely very few people shedding that pathogen into wastewater in these communities. In the heat maps below, each plant is represented by a row (y-axis), and dates are shown along the x-axis. Blue indicates a non-detect and darker orange/red is proportional to concentration with the highest values being the darkest. White means no sample was collected.
Influenza B (IBV) RNA concentrations have slightly decreased and are below 11,000 copies/g. Detections have also been sporadic for IBV.
RSV RNA concentrations have steadily decreased and detection has become more and more sporadic across Georgia since February 2023. For all 8 sites, there is no significant trend over the past 21 days.
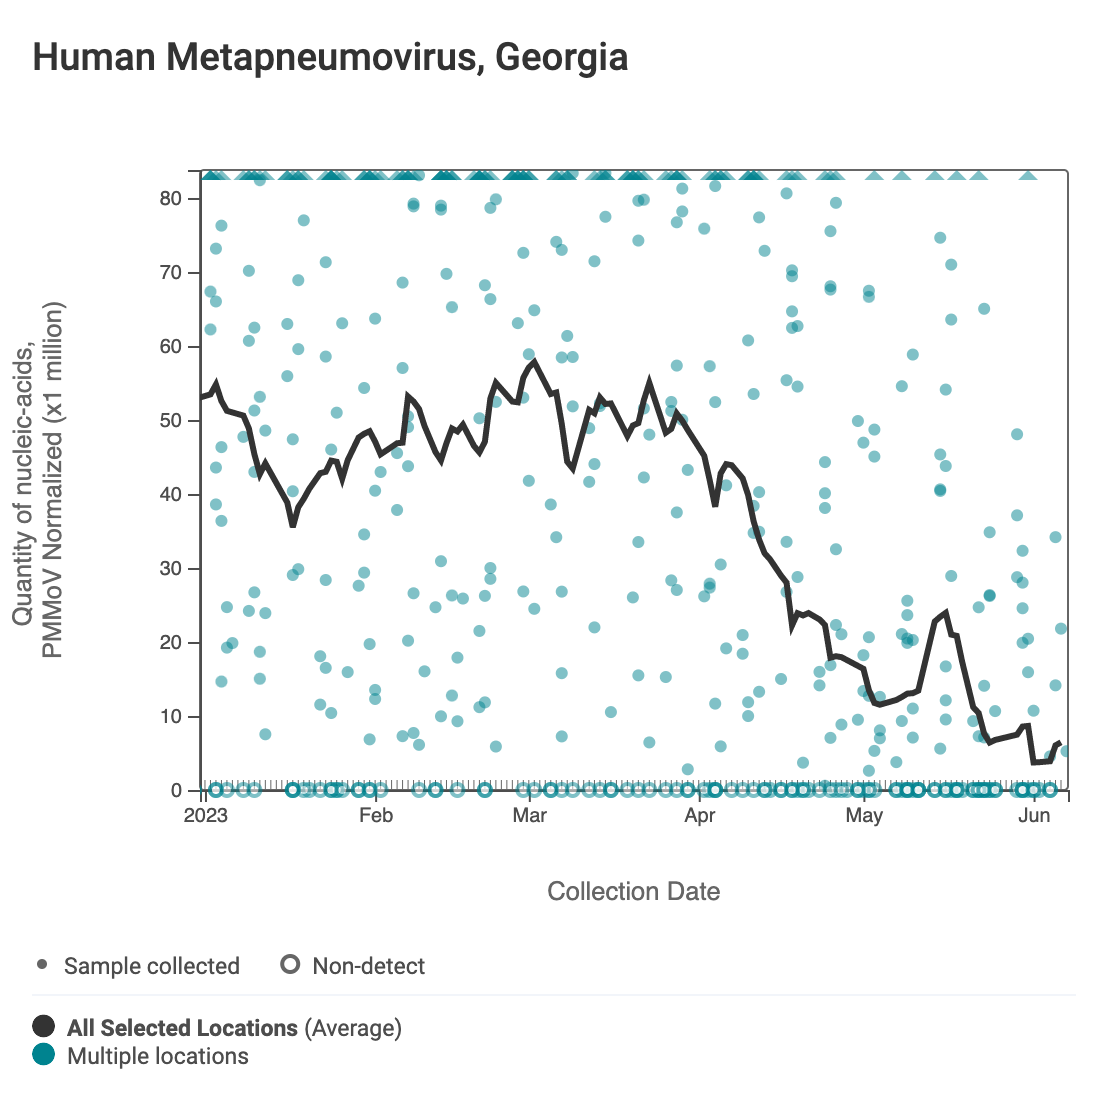
HMPV (human metapneumovirus) RNA concentrations are less than 13,000 copies/g. Concentrations have decreased compared to two weeks ago. For HMPV at all 8 sites, there is no significant trend over the past 21 days.
Norovirus
Assay detects human norovirus GII
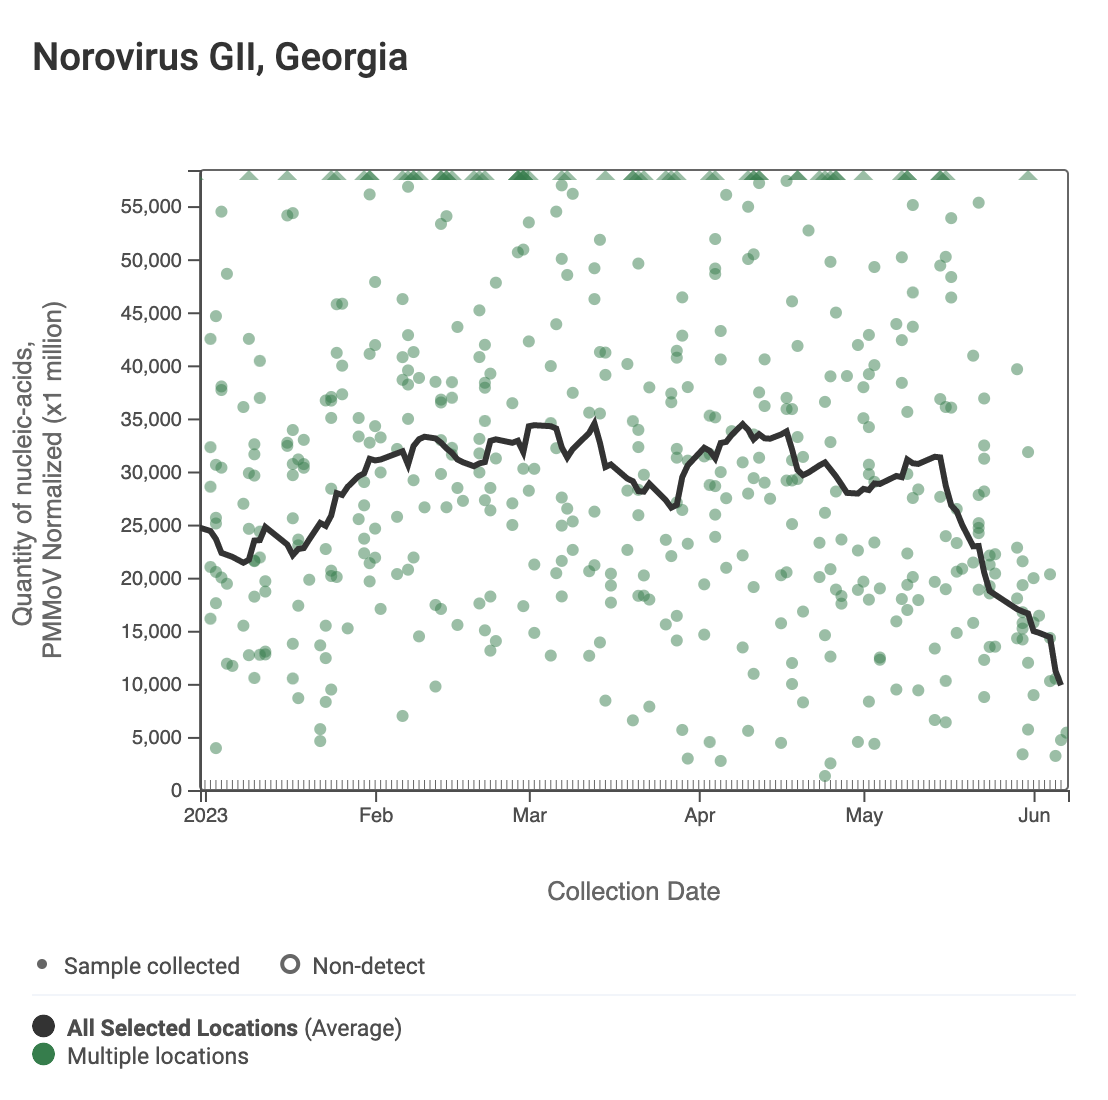
Norovirus GII (HuNoV GII) RNA are less than concentrations two weeks ago ranging from 3,000,000 - 10,000,000 copies per gram. There is no significant trend over the past 21 days at most sites, while Camp Creek and Columbus show a significant downward trend.
Mpox
Results continue to remain non-detect for mpox at all Georgia plants. The last detection at a Georgia site was in December 2022. This heat map shows data since July 2022. Sites are labeled in the rows and each date a sample was collected as a column. Again, the color blue means the sample was non-detect for mpox DNA and the colors get darker with higher concentrations.
Related News
Dr. Wolfe will be in Houston for the ASM Microbe Conference next week; please reach out if you will be there.