
Georgia WWSCAN Biweekly Update 8/18/2023
Welcome to the bi-weekly update for WWSCAN partners in Georgia! The samples provided up through 8/14/23 have been processed in the lab and data are on the site at data.wastewaterscan.org.
If you notice any bugs on the site or have any comments about it, please continue to send your feedback via email Amanda Bidwell at albidwel@stanford.edu. We thank you for your partnership!
COVID-19
SARS-CoV-2 and Variants
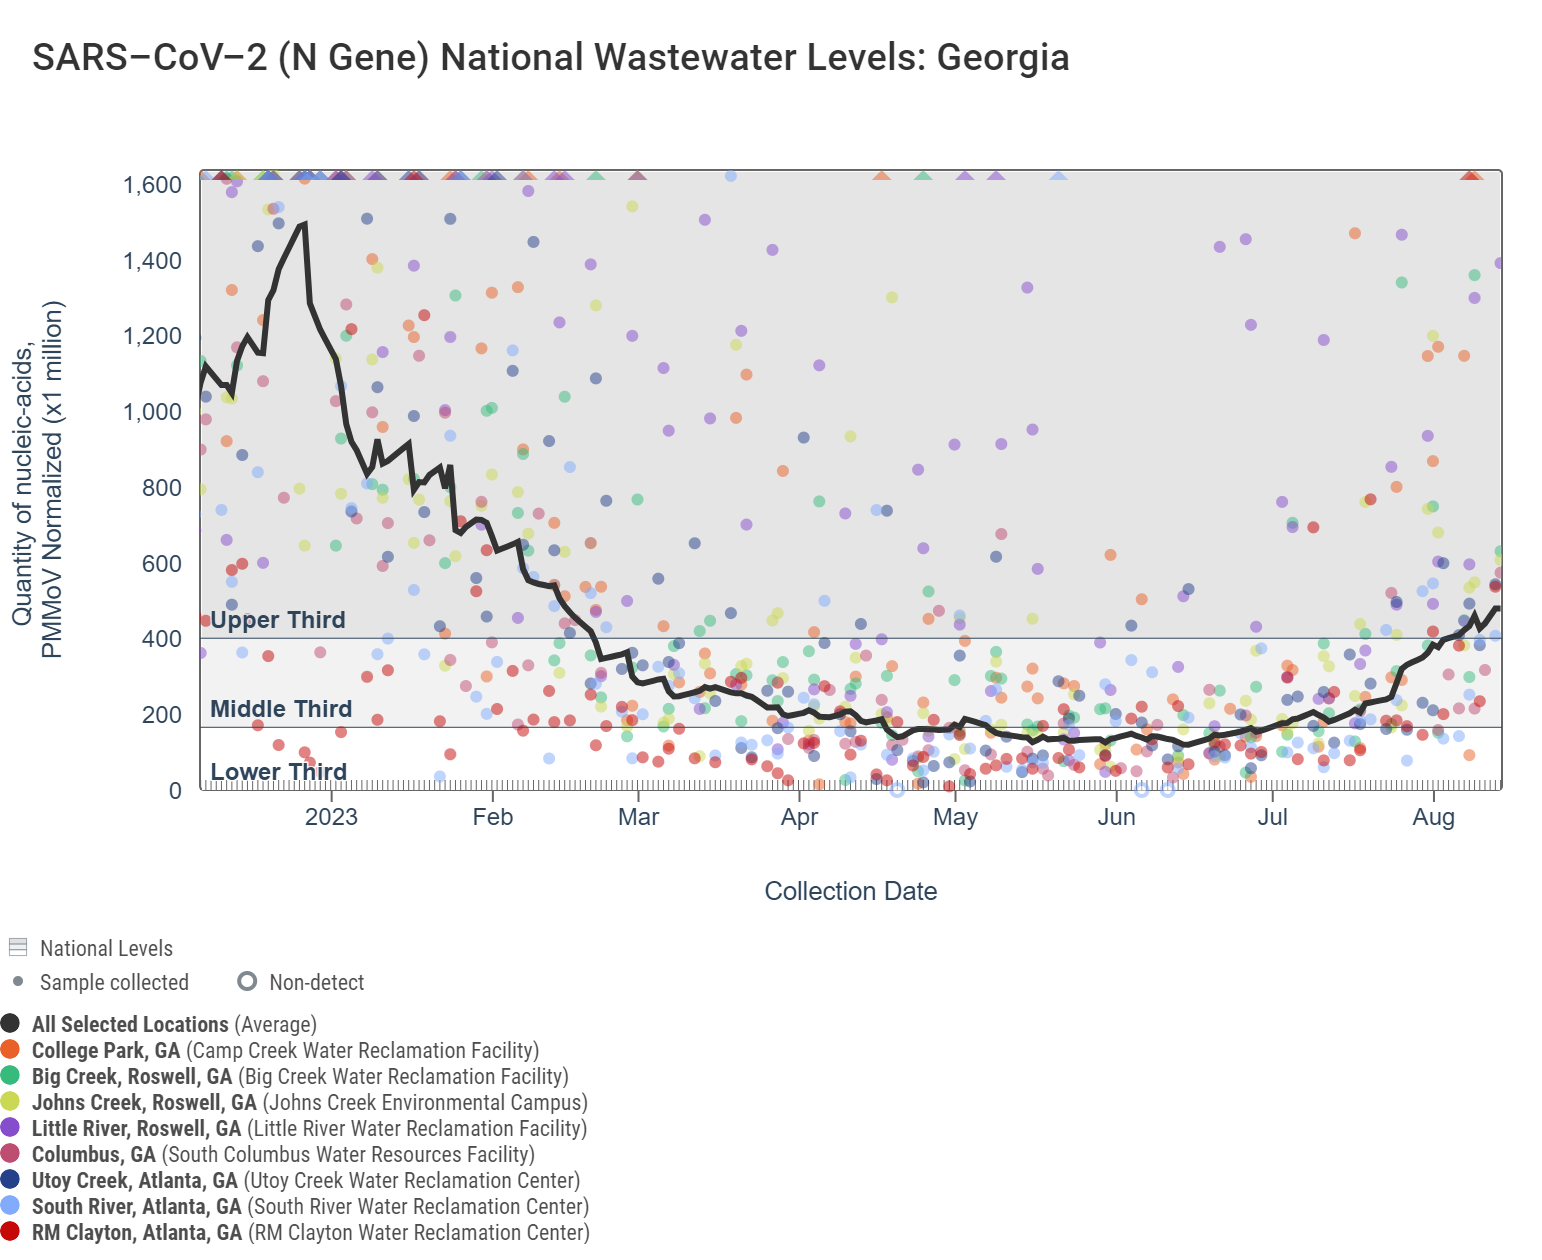
SARS-CoV-2 N gene RNA concentrations range between 33,000 - 280,000 copies/g and continue to slightly increase.
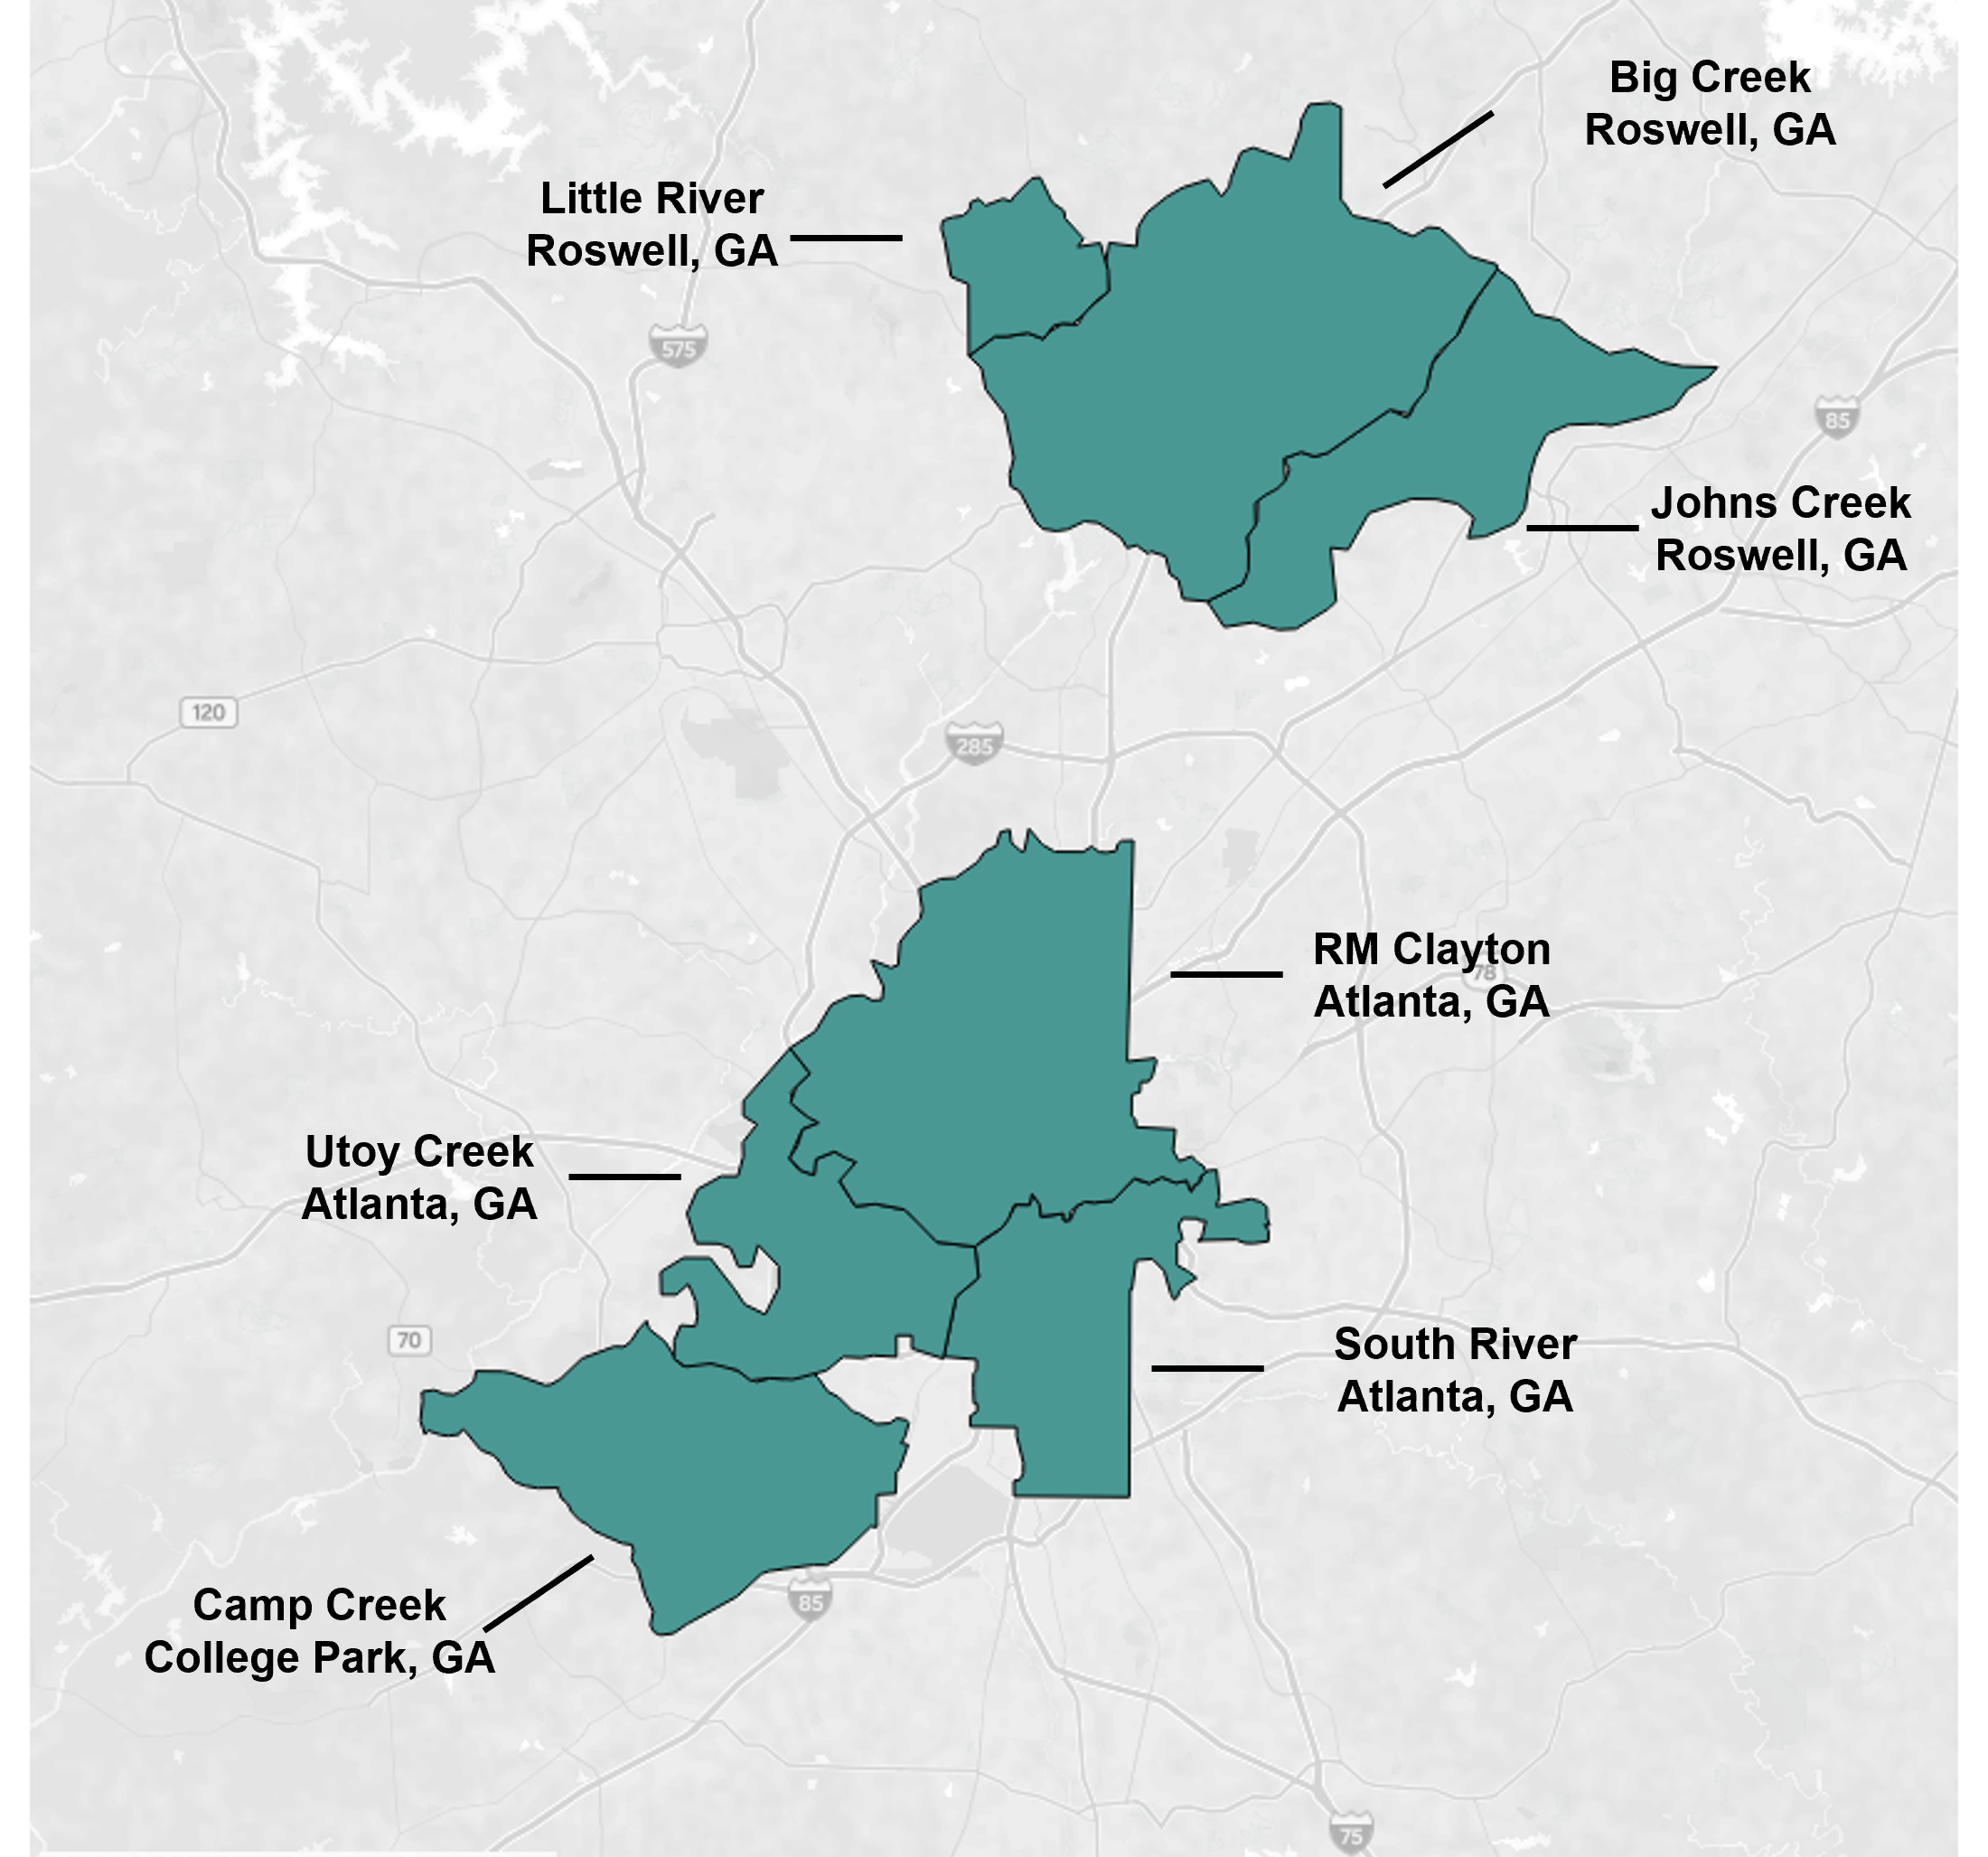
The dark gray line in each chart is a population-weighted aggregated trend line for all 8 Georgia sites when the data is normalized by PMMoV. "National levels" visually benchmark where concentrations fall compared to previously recorded measurements for each pathogen. The aggregated line in the chart below shows that SARS-CoV-2 N gene RNA concentrations are now within the upper third level of all concentrations measured in the last year. Additional information on the methodology behind this trend line is available here in the "How are aggregated trendlines determined?" section. More details can be found under the "How are national levels determined?" section here.
For most targets, we are also including a trend analysis of their concentrations in wastewater solids (normalized by PMMoV) based on the most recent estimates compared to the recent past. In order to calculate a trend, we require 3 points over the last 21 days. We test for linear trends between log10-transformed concentration (target/PMMoV) and time; the trend must be classified as statistically significant (p<0.1). To read more about our methods for trend analysis click the link here. Analysis of SARS-CoV-2 concentrations across the 8 Georgia sites shows there is no significant trend at Georgia sites with the exception of a significant upward trend at Utoy Creek. However, you can see in the plot below that the aggregated trend line shows a rise from the lower third of concentrations in late June to the upper third of concentrations in August.
Click on each chart to further interact with them on data.wastewaterscan.org.
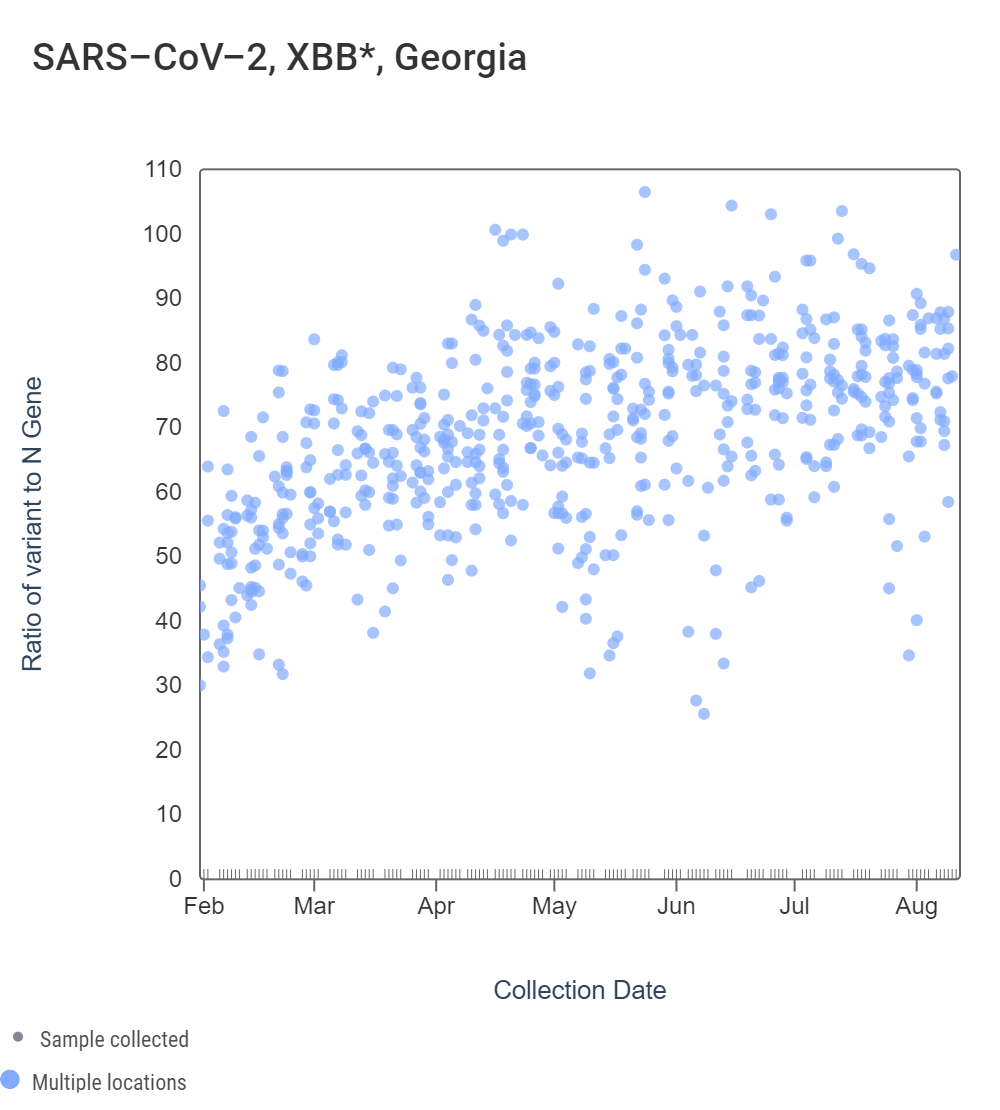
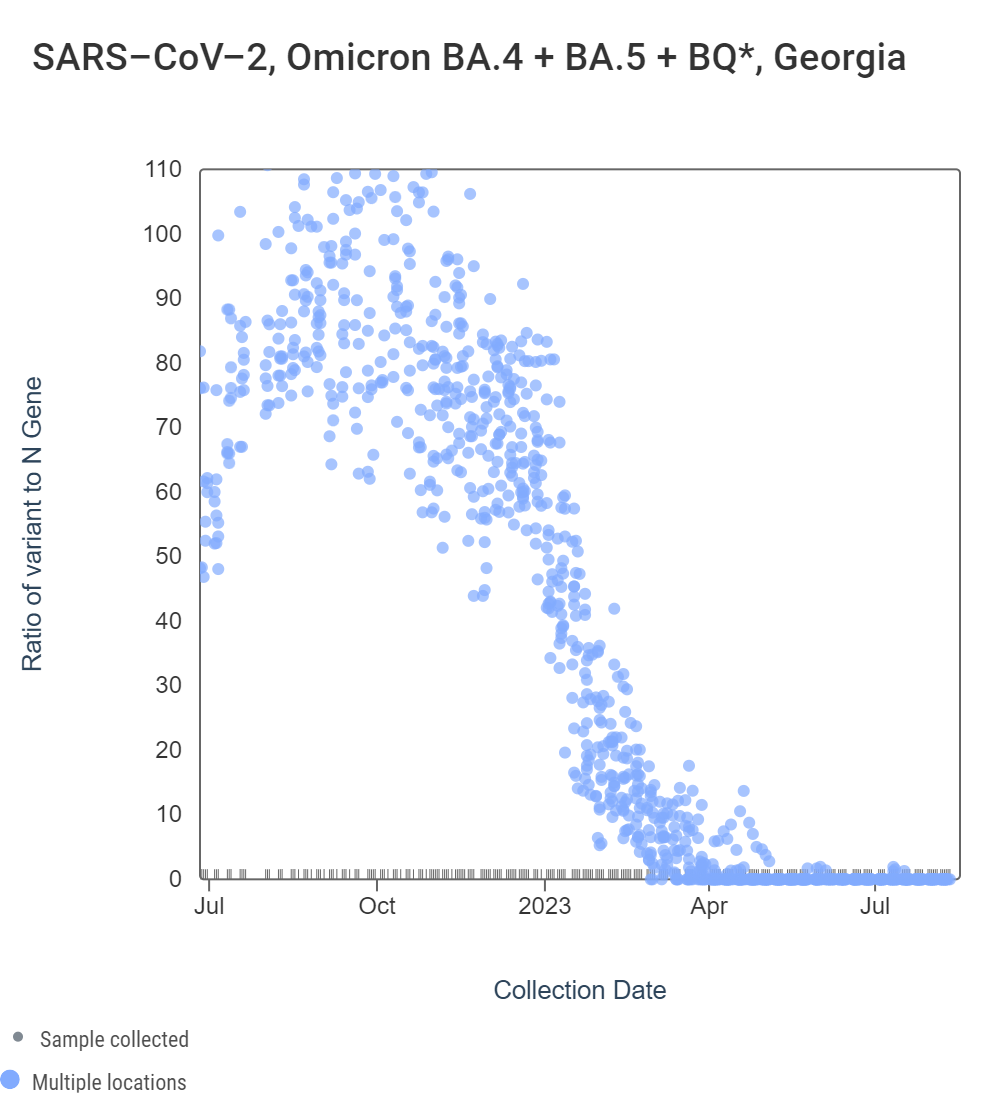
Early in 2023, WWSCAN started testing for XBB* and these results are available to view by selecting 'SARS-CoV-2 View by Variant' on data.wastewaterscan.org. For Georgia sites, data dates back to early February 2023. The ratio of the XBB* mutations/N across all Georgia plants is shown in the left chart below. As the ratio reaches 100%, it suggests that all the SARS-CoV-2 genomes in wastewater have the XBB* mutations. These estimates have not changed much since our last update, and data indicate that the average ratio XBB* mutations/N is ~75% but has ranged from 40-100% recently. This suggests the majority of infections across the communities are caused by XBB*. The right chart below shows the ratio of the BA.5, BA.4, and BQ* mutation/N across all Georgia plants. It can be read the same way as the XBB* chart. The average ratio is close to 0%. Note that our XBB* assay will also detect XBB.1.16, XBB.1.9, and FD.2 (XBB.1.5.15.2*).
Other Respiratory Targets
Influenza A & B, Respiratory Syncytial Virus, and Human metapneumovirus
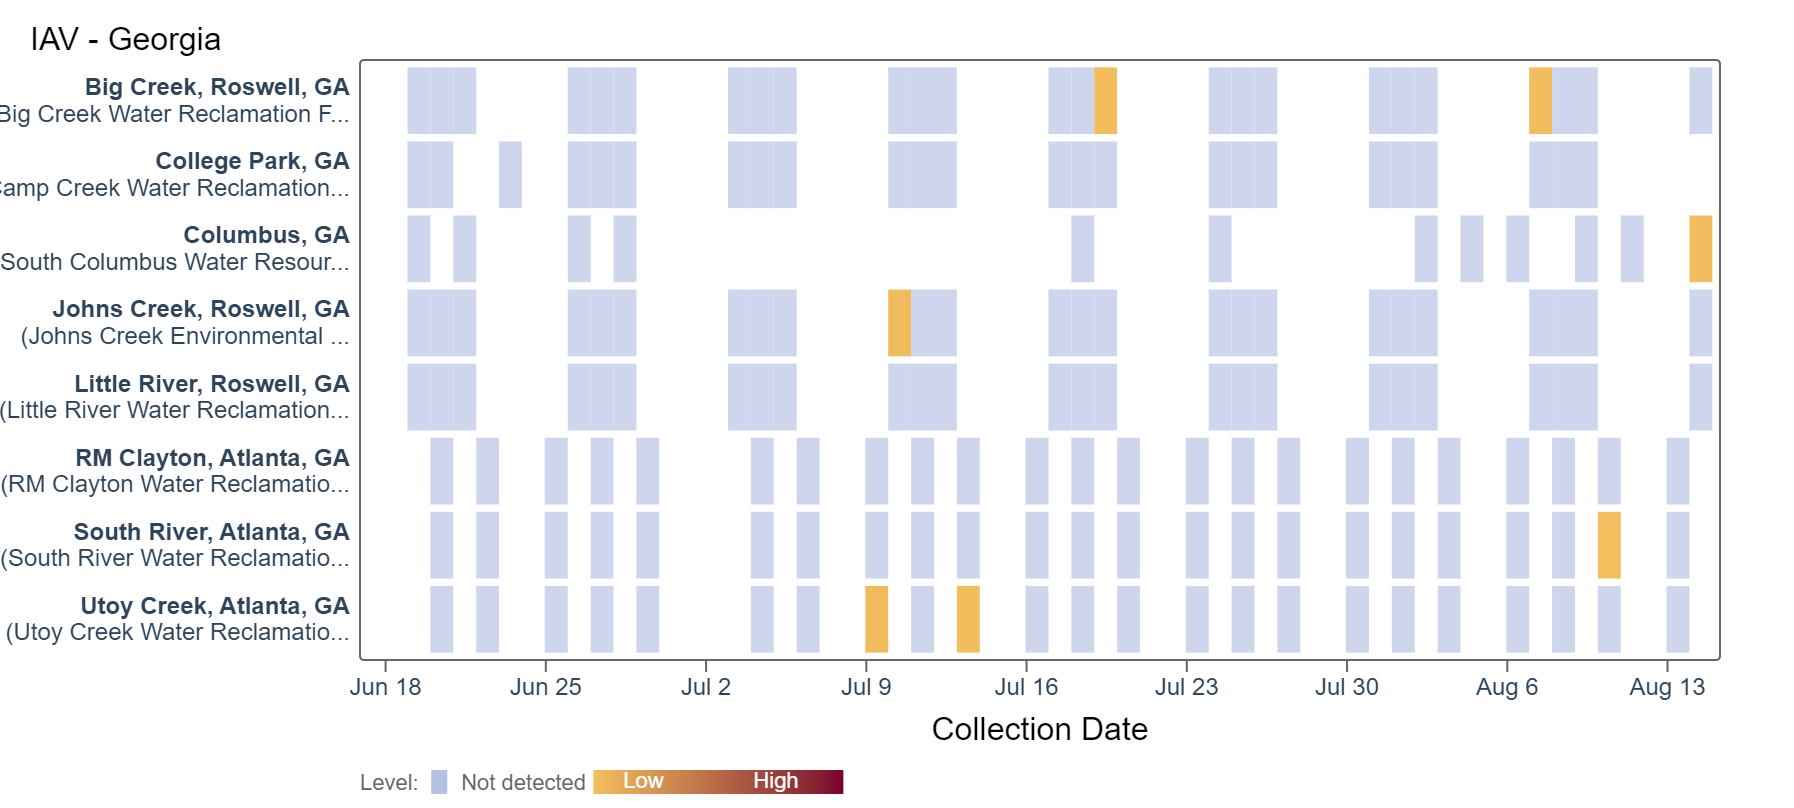
Influenza A (IAV) RNA has been rarely detected in the last two weeks. Based on the heat map below, some sites have not detected IAV in over a month. An analysis of IAV RNA concentrations showed there is no trend across Georgia sites.
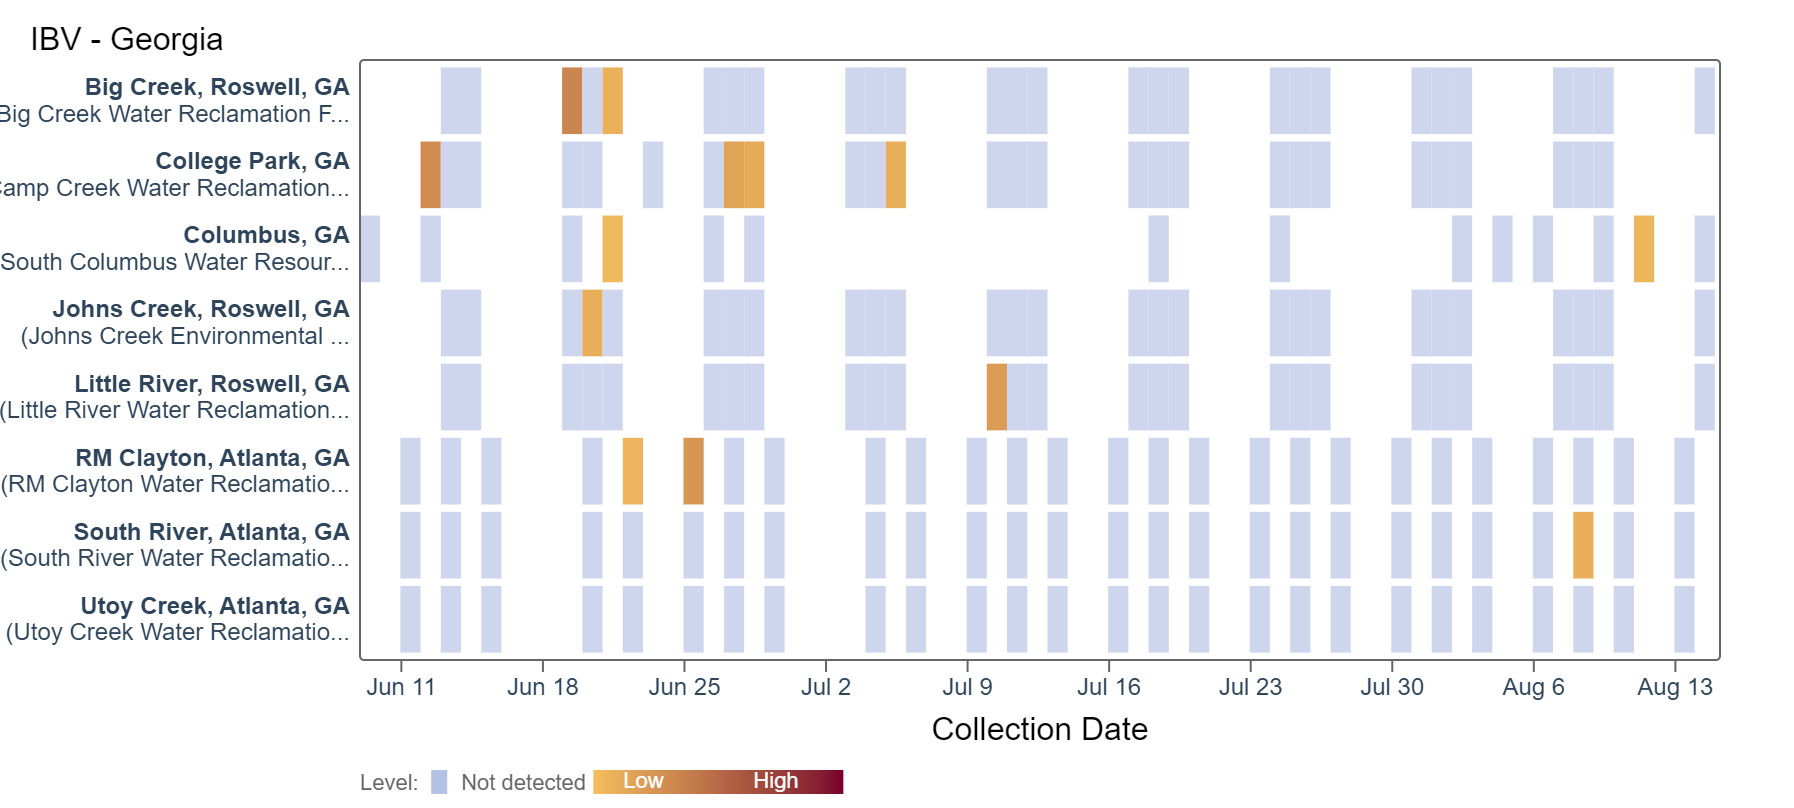
Influenza B (IBV) RNA has been rarely detected, with a single detection in the last two weeks at the Columbus and South River sites, respectively. An analysis of IBV RNA concentrations showed there is no trend across Georgia sites.
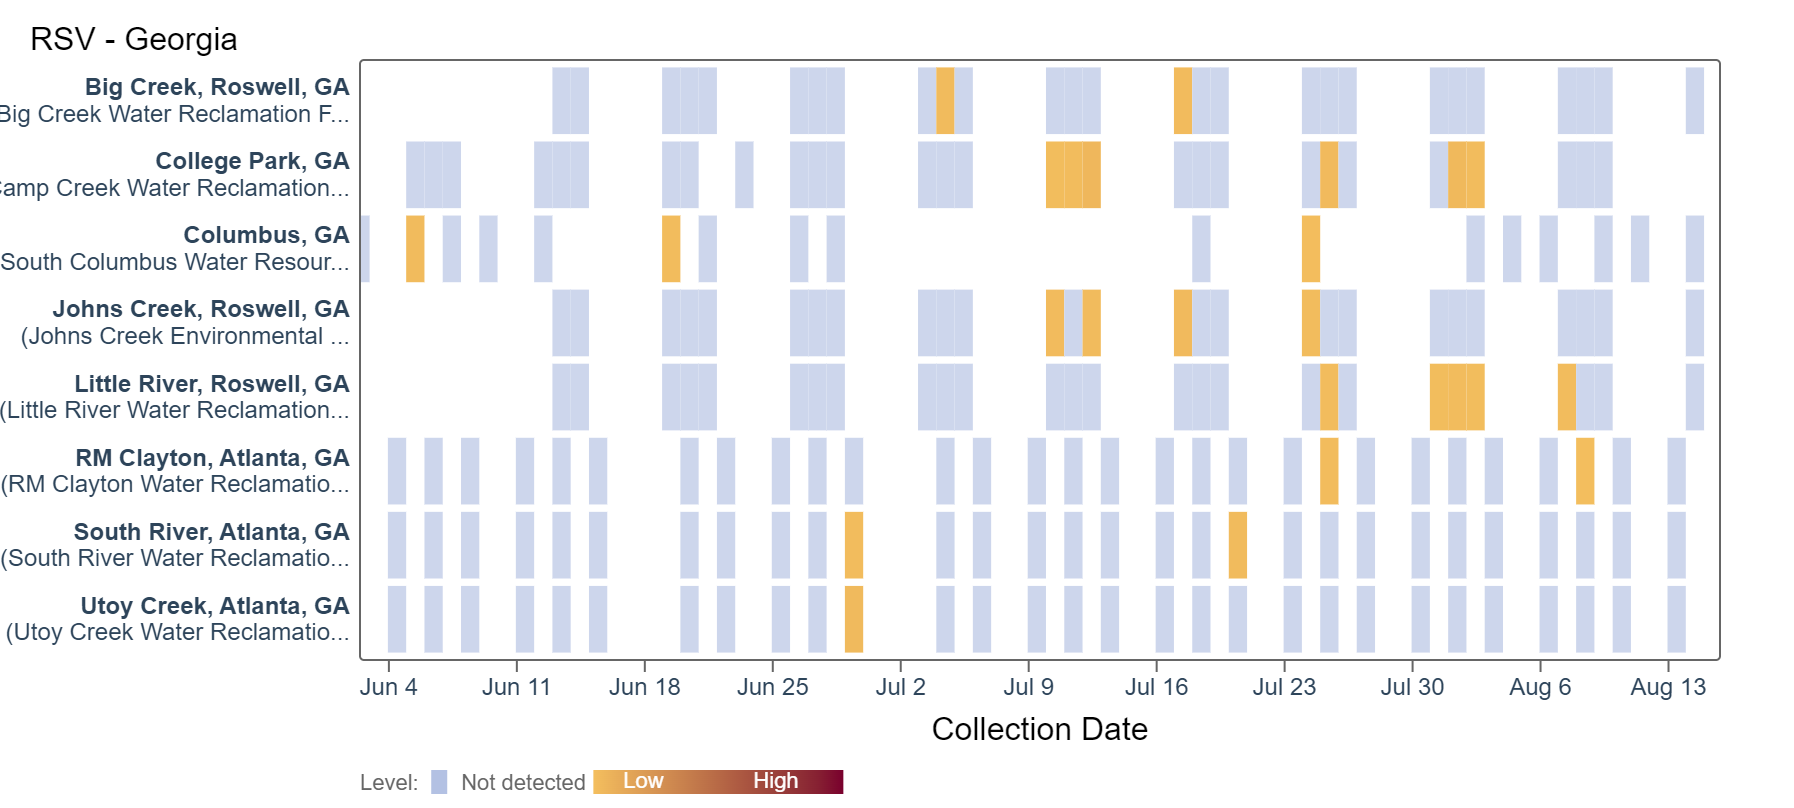
RSV RNA detection continues to be sporadic at low concentrations at some sites. Big Creek, Columbus, Johns Creek, South River, and Utoy Creek did not detect RSV in samples collected over the past two weeks. An analysis of RSV RNA concentrations showed there is no trend across Georgia sites.
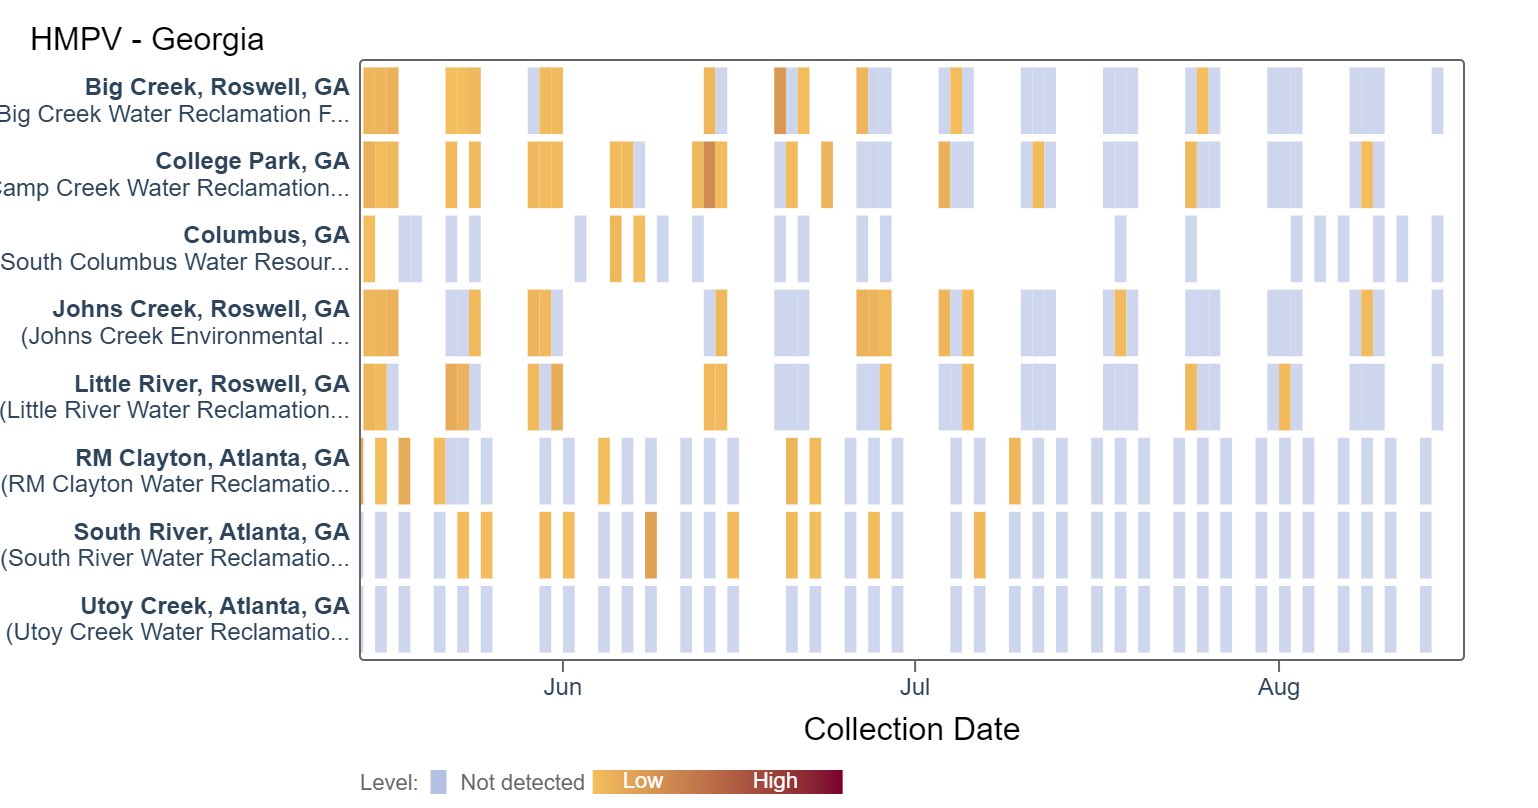
HMPV (human metapneumovirus) RNA concentrations are currently in the lower third level. According to the heat map, HMPV RNA has sporadically been detected at mainly lower concentrations. An analysis of HMPV RNA concentrations showed there is no trend across Georgia sites.

Gastrointestinal Targets
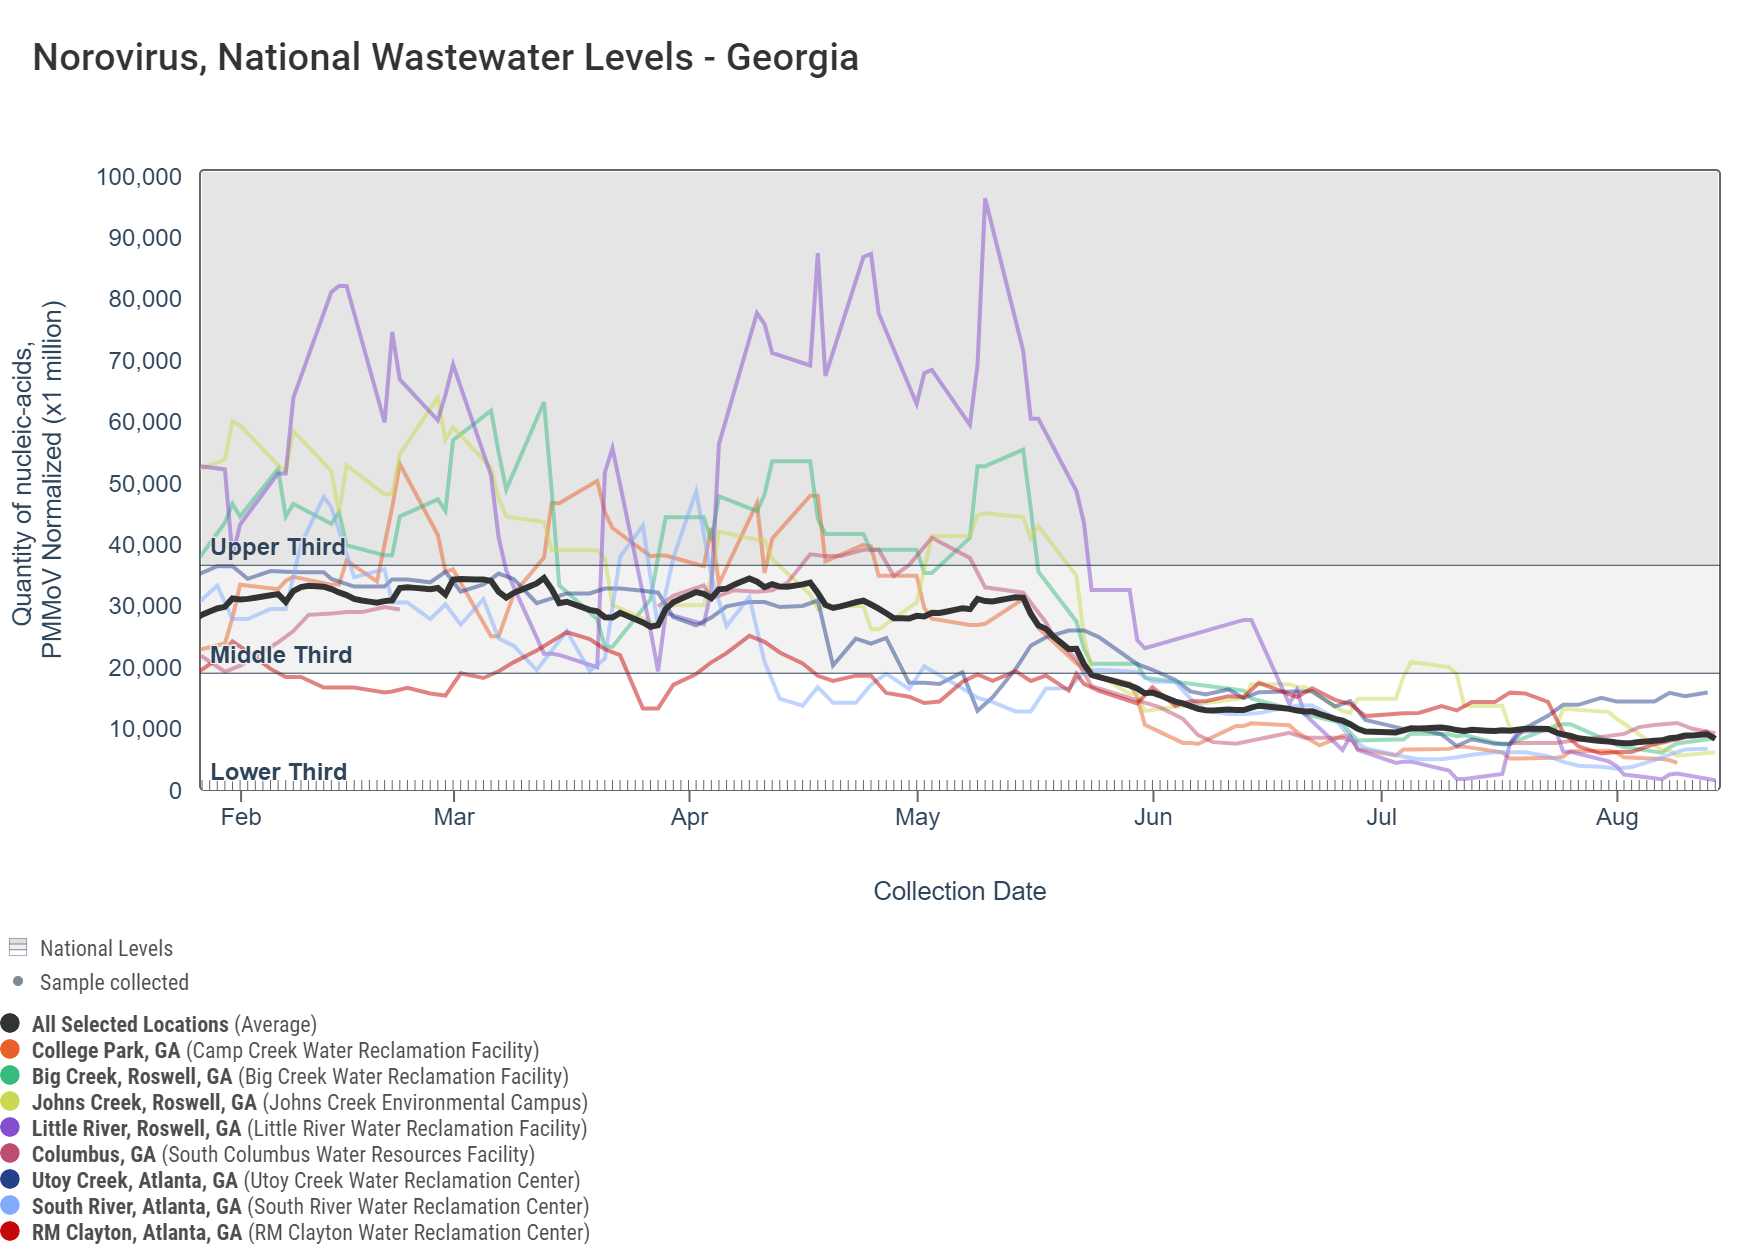
Norovirus GII
Norovirus GII (HuNoV GII) RNA concentrations range between 330,000 and 3,200,000 copies/g and are in the bottom third level for all 8 sites. An analysis of HuNoV GII concentrations showed there is no trend across Georgia sites, with the exception of a significant downward trend at South River.
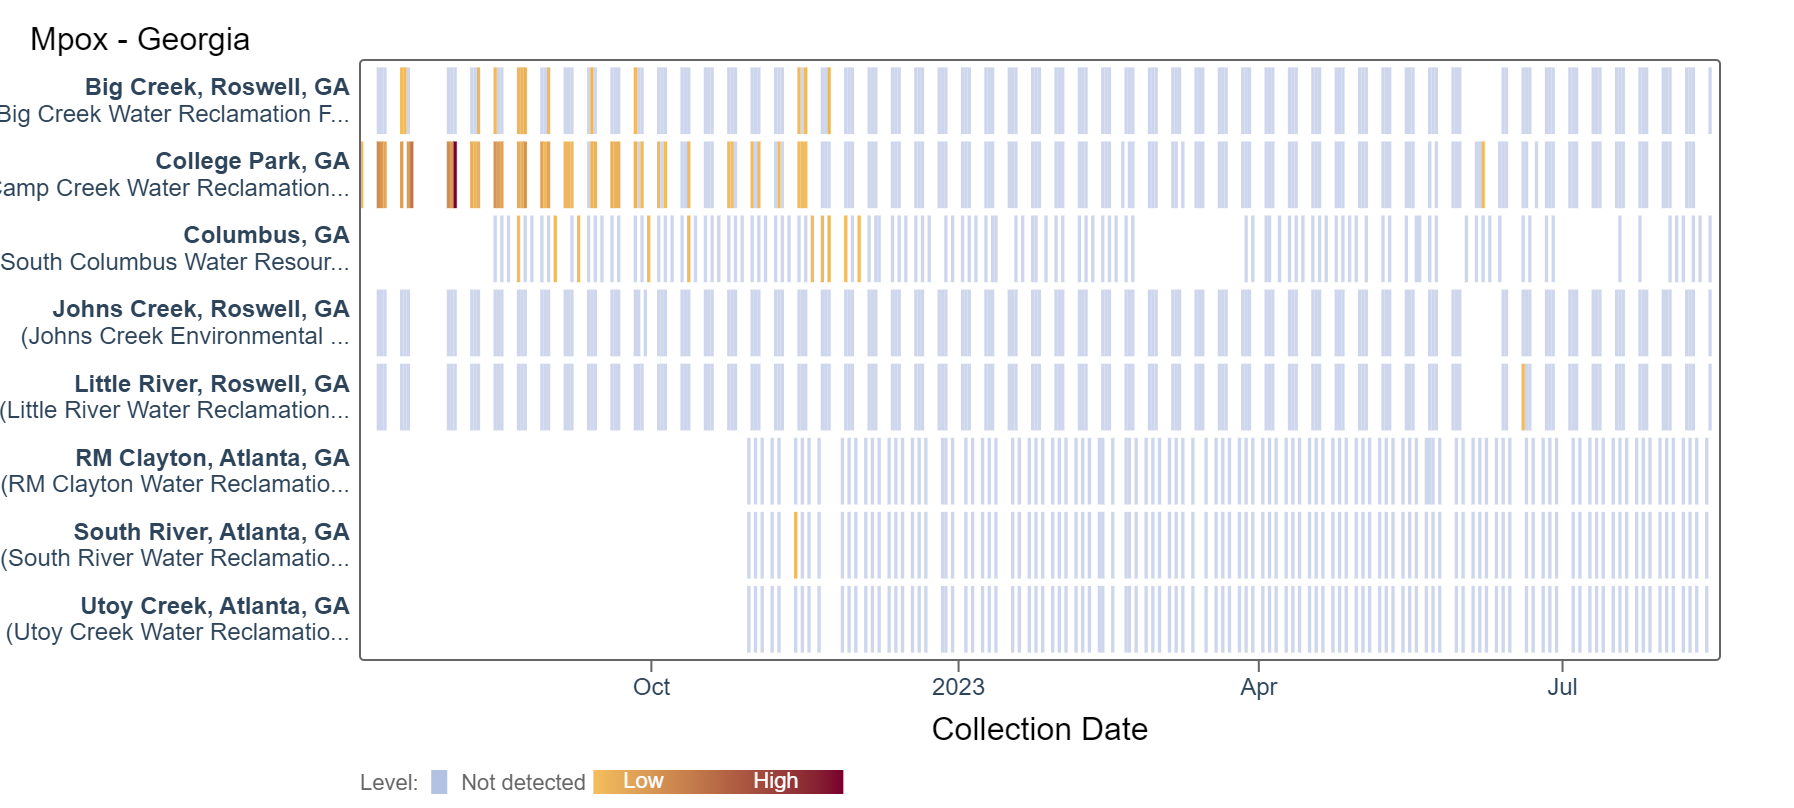
Mpox
Results are non-detect for mpox for the past 21 days at Georgia plants. This heat map shows data since July 2022. Sites are labeled in the rows and each date a sample was collected as a column. The color blue means the sample was non-detect for mpox DNA and the colors get darker with higher concentrations.
Related News
The next stakeholder meeting will take place Friday, September 8th @ 12 PM EST.