
Nationwide WastewaterSCAN July 2026 Update
Hi Everyone,
This newsletter contains updates on the WastewaterSCAN program with wastewater samples analyzed by the lab through July 31, 2026. Below you will find information on the program in terms of participating partners, review of targets being measured, as well as current wastewater categories (low, medium, high) of the infectious disease targets.
Best,
WastewaterSCAN Team
Participating Plants
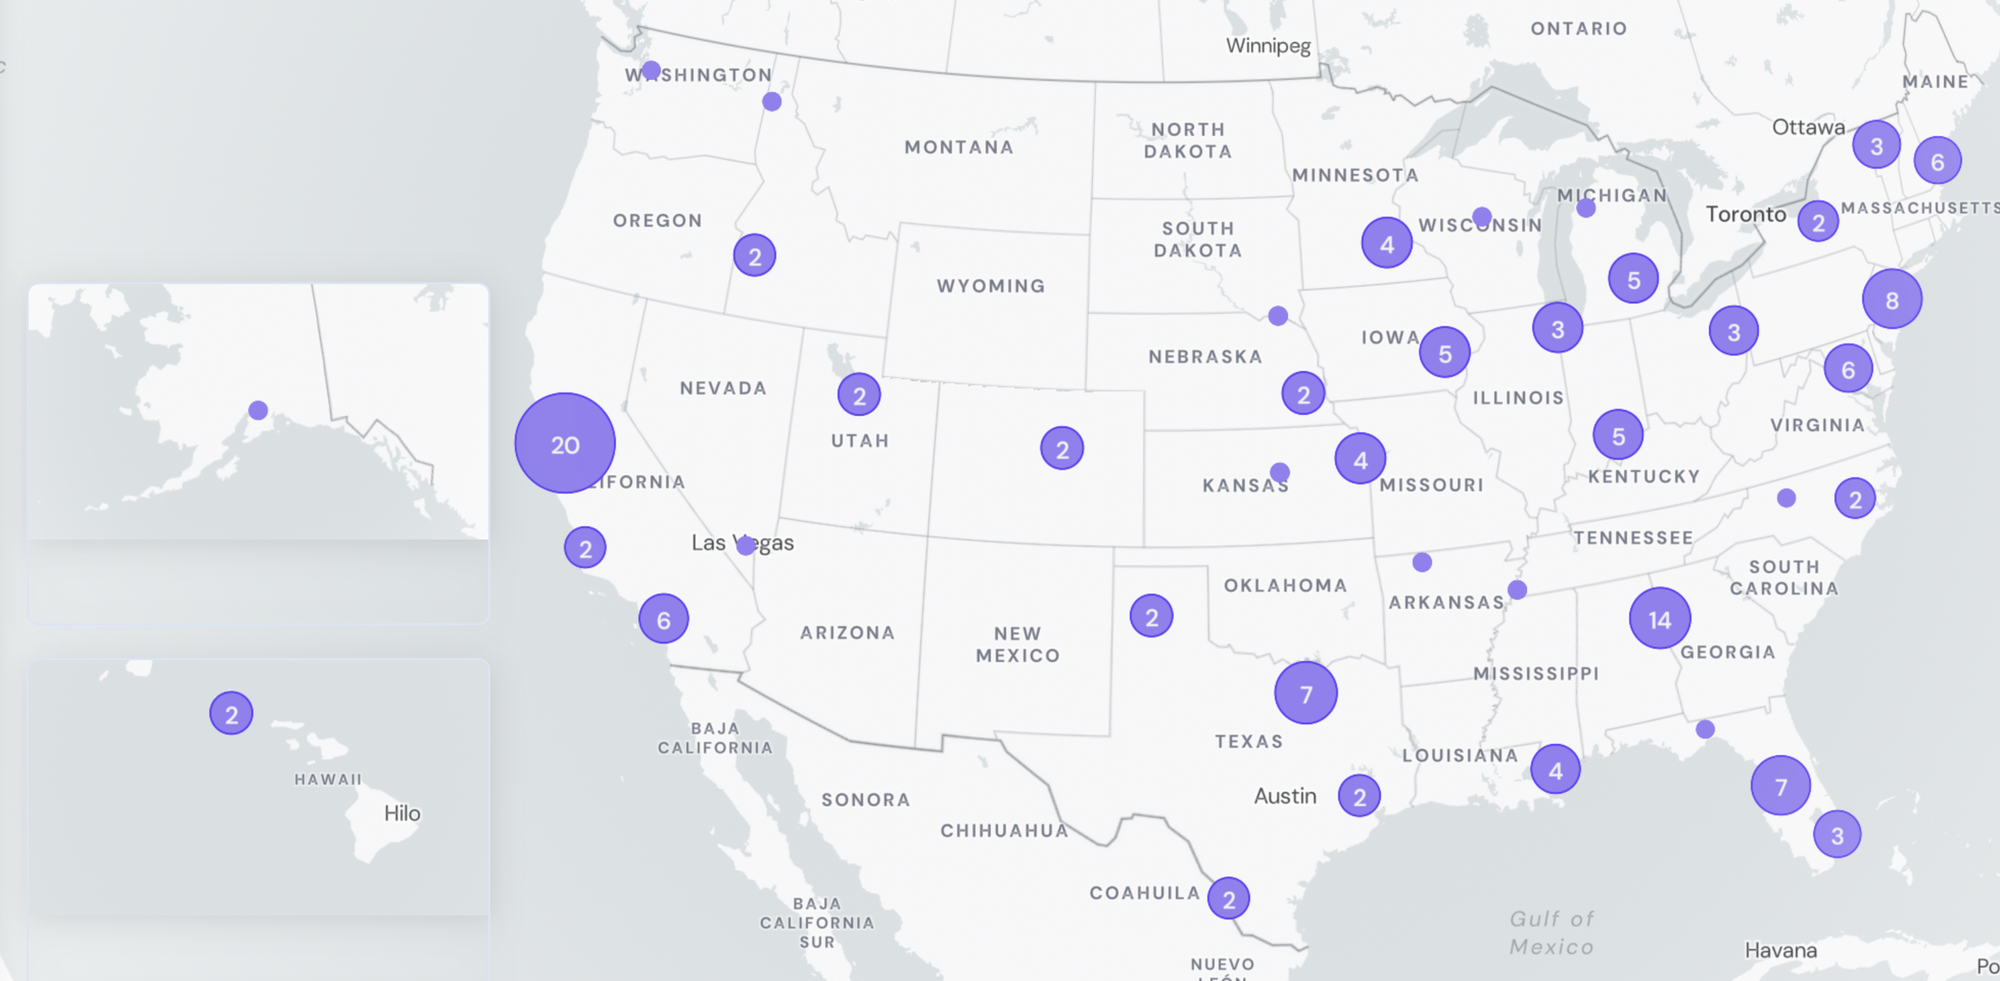
>38 million people covered across 40 states
Infectious Disease Target Review
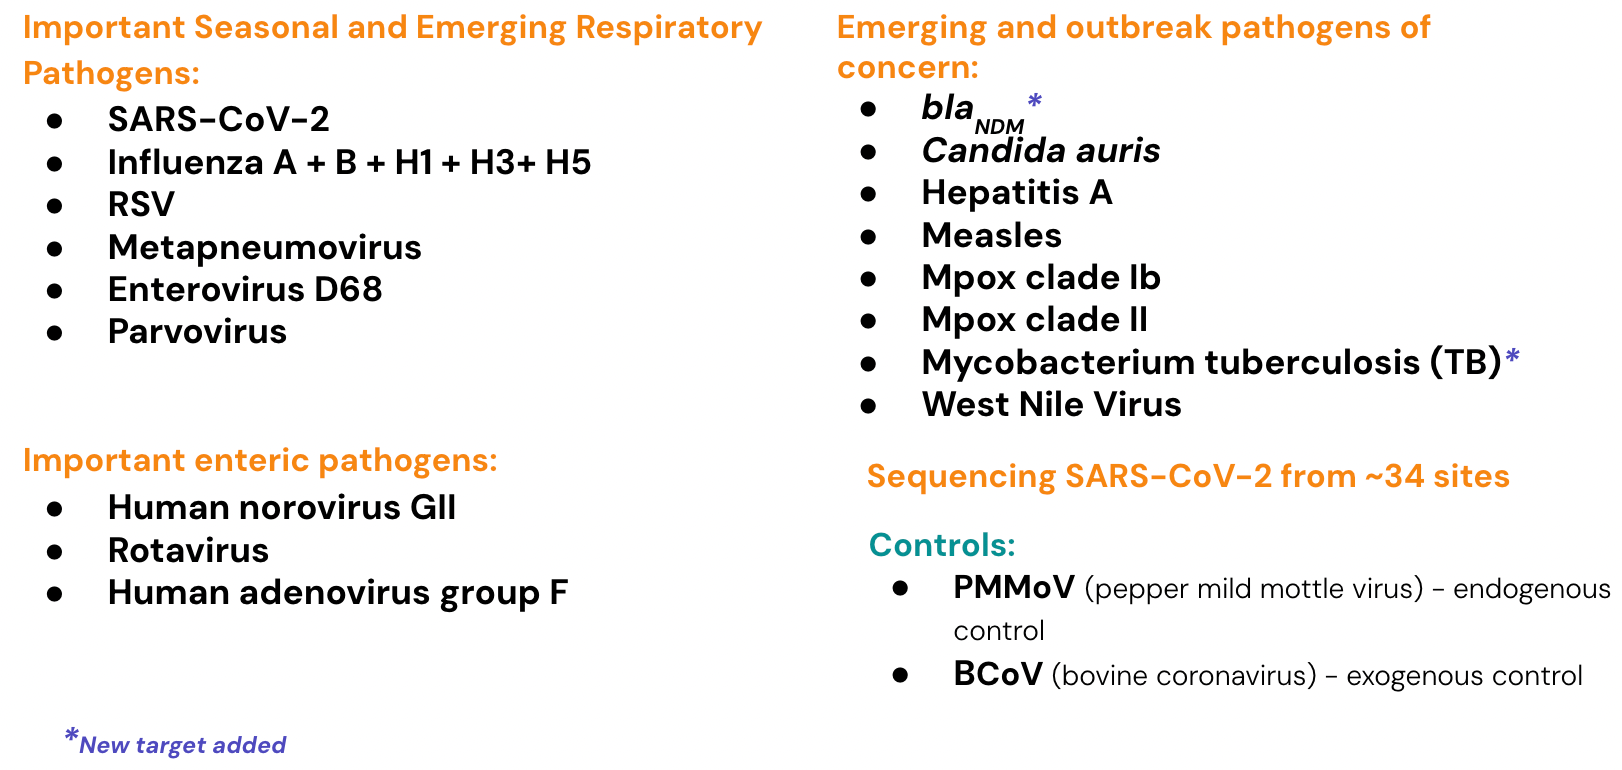
Currently monitoring a suite of Respiratory, Gastrointestinal and Outbreak Pathogens of Concern
The methods for our assays are in the public domain and links for these are provided at the end of the newsletter.
In mid-July 2026, blaNDM (an antibiotic-resistance gene) and Mycobacterium tuberculosis (TB) were added to the pathogen panel WWSCAN monitors for in early July 2026.
Program Publications
Recent publications, factsheets, FAQs, and more!
WWSCAN Published Body of Work document:
- We are excited to share a document that provides an overview of the program’s peer-reviewed scientific literature, organized by topics and themes. Click here to access the WastewaterSCAN published body of work.
WWSCAN FAQs:
- Frequently Asked Questions on WWSCAN Measurements of blaNDM nucleic acids in Wastewater Solids
- Frequently Asked Questions on Measurements of Candida auris (C. auris) in Wastewater Solids
- Frequently Asked Questions on WWSCAN Measurements of H5 Marker in Wastewater Solids
- Frequently Asked Questions on WWSCAN Measurements of Hepatitis A Virus (HAV) RNA in Wastewater Solids
- Frequently Asked Questions on WWSCAN Measurements of Measles RNA in Wastewater Solids
- Frequently Asked Questions on WWSCAN Measurements of Mpox clade Ib in Wastewater Solids
- Frequently Asked Questions on WWSCAN Measurements of Mycobacterium tuberculosis (TB) nucleic acids in Wastewater Solids
- Frequently Asked Questions on WWSCAN Measurements of West Nile Virus in Wastewater Solids
WWSCAN Factsheets and Guidance Documents can be found here.
Wastewater Category Logic
As a reminder, WWSCAN categorizes sites based on Levels + Trends + Frequency of detection. We adopted this methodology back in 2023 as a way to clearly communicate what wastewater is telling us about community disease circulation. The wastewater categorization helps us quickly understand if the recent measurements for a infectious disease fall into a low, medium, or high category and are determined based on a combination of the following variables:
- Trends tell us how concentrations are changing (⬆up,⬇down, ━ no change) over the last 21 days
- Levels tell us whether concentrations are relatively lower or higher (based on national tertiles over last 365 days)
- Frequency of detection indicates how often a pathogen is detected in wastewater (important for pathogens that are not commonly detected)
There are 3 Archetypes for WWSCAN Pathogens:
- Pathogens that are commonly detected (regardless of season - includes SARS-CoV-2, Norovirus, Rotavirus)
- Seasonal pathogens (rarely detected outside of season/outbreaks - includes Influenza A + B, RSV, HMPV, EV-D68)
- Pathogens that are not commonly detected (rare regardless of season - includes C. auris, HepA, H5 influenza marker, Measles, Mpox clade Ib, Mpox clade II, Parvovirus, West Nile Virus)
*Categories are not currently being calculated for H1 and H3 Influenza markers, Adenovirus Group F, blaNDM, or Mycobacterium tuberculosis.
To learn more about WWSCAN's categorization logic, please see: https://data.wastewaterscan.org/about/#8
COVID-19
SARS-CoV-2 concentration in wastewater and sequencing for variants
SARS-CoV-2 N gene RNA was detected in ~74% of samples in July 2026. The median SARS-CoV-2 concentration in July 2026 was up ~122% compared to June 2026. SARS-CoV-2 concentrations are still lower across all regions compared to this time last year, but are trending upwards.
Below is the population weighted average SARS-CoV-2 N gene concentrations (normalized by PMMoV) is shown in black from all participating WWSCAN sites across the country over the last 365 days. Evident in this is plot is an increasing in SARS-CoV-2 concentrations starting mid-June 2026. SARS-CoV-2 concentrations are continuing to climb across all regions and in the West region this summer's SARS-CoV-2 concentrations have already surpassed peak SARS-CoV-2 concentrations from this past winter's peak. In past years we have seen the summer SARS-CoV-2 peak start around mid June so we are seeing a later start to this years' summer wave.
Nationally, SARS-CoV-2 is in the 'MEDIUM' category with aggregated measurements showing medium concentrations and an upward trend over the last 3 weeks.
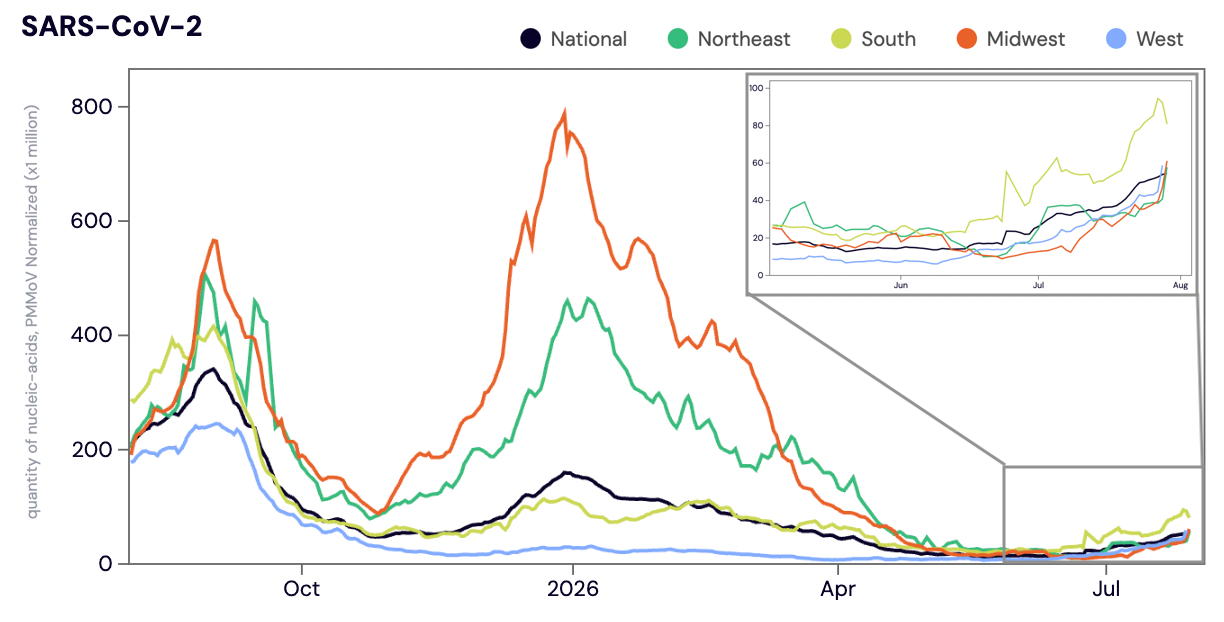
Midwest states: IA, IL, IN, KS, MI, MN, NE, OH, SD, WI. Northeast states: CT, MA, ME, NH, NJ, NY, PA, VT. Southern states: AL, AR, DE, FL, GA, KY, LA, MD, MS, NC, TN, TX, VA, and WV. Western States: AK, CA, CO, HI, ID, NV, UT, WA. In the top right corner is a zoomed in plot of SARS-CoV-2 contractions over the last 3 months, which shows an increase across all regions from the late spring/early summer lull.
Sequencing of SARS-CoV-2 from wastewater is available for a select number of individual sites. The sequencing protocol is available on protocol.io. The plots below show the relative proportions of different variants inferred from sequencing the entire genome of SARS-CoV-2. Results are based on sequencing of 2 samples per week, combined to provide a weekly value.
It is important to note that concentrations of SARS-CoV2 RNA in samples have been on the lower end, and with low concentrations it is hard to obtain high quality, high confidence sequences.
Sequencing data is also available in aggregate across all sites in WWSCAN with sequencing data. That plot is shown below and also suggests that XFG (shown in orange) is the most abundant variant across all sites at 47.8% followed by LF.7 (shown in yellow) at 15.7% and NB.1.8.1 (shown in mauve) at 15.1%. The hashed lines indicate weeks with lower confidence sequencing results.
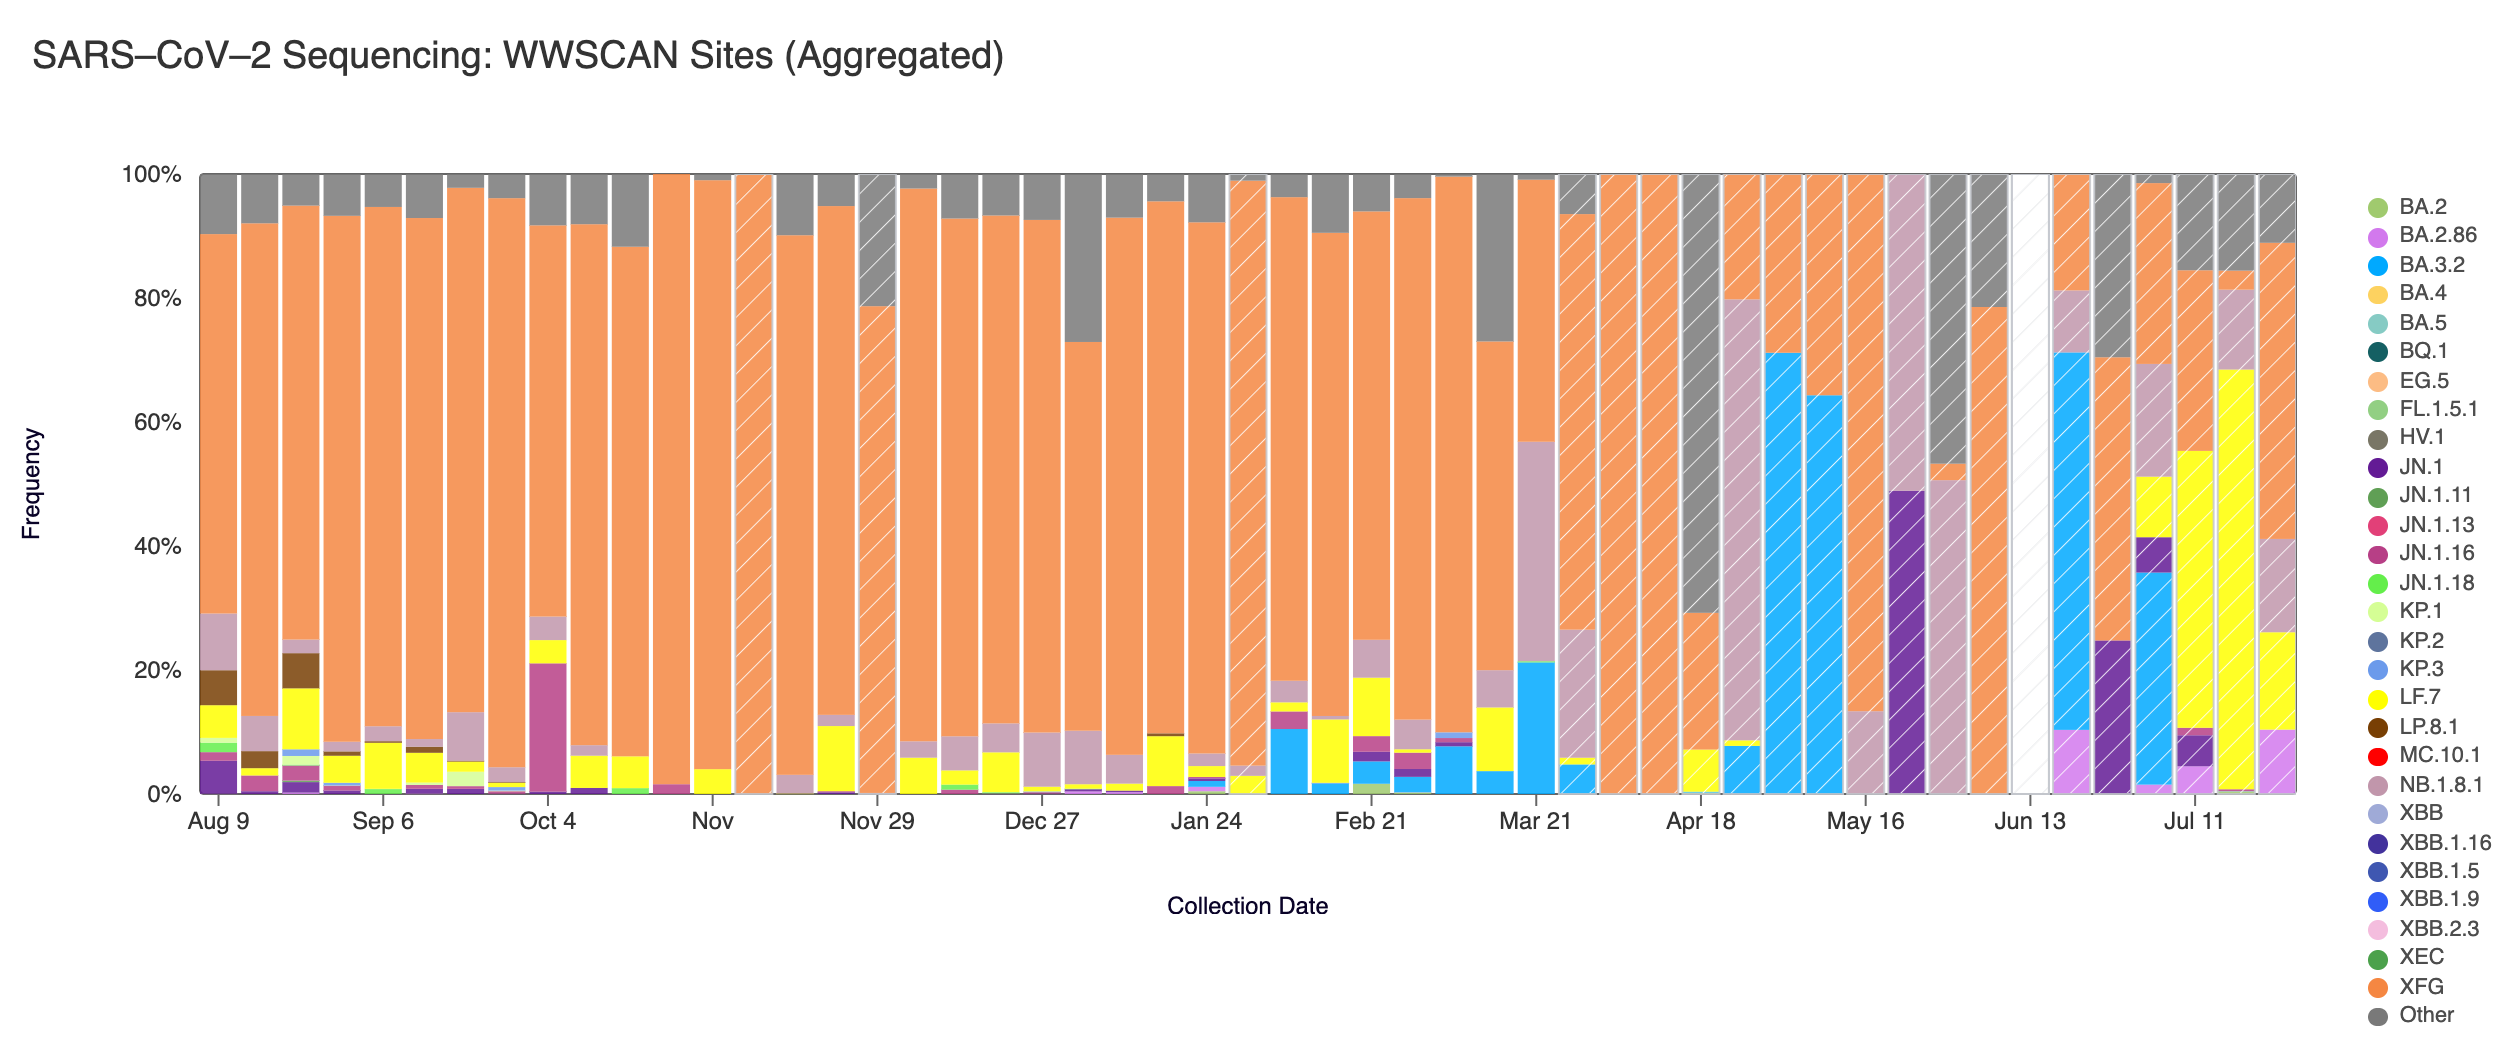
SARS-CoV-2 sequencing data from the last 12 months. This plot includes data through the week of July 25, 2026. The hashed lines indicate lower confidence sequencing results.
Other Respiratory Pathogens
Influenza A & B, Respiratory Syncytial Virus, Human metapneumovirus, EV-D68 & Parvovirus
Influenza A (IAV) RNA was detected in 9.6% of samples in July 2026. The median IAV RNA concentration across all sites in July 2026 was below the limit of detection. IAV concentrations have been trending down over since February (with most sites seeing consistent non-detects).
Below is the population weighted average IAV concentrations (normalized by PMMoV) is shown in black from all participating WWSCAN sites across the country over the last 365 days. Evident in the plot are IAV wastewater concentrations peaking in early January 2026 across all regions. Nationally, Influenza A is in the 'LOW' Wastewater Category due to no longer being in seasonal onset.
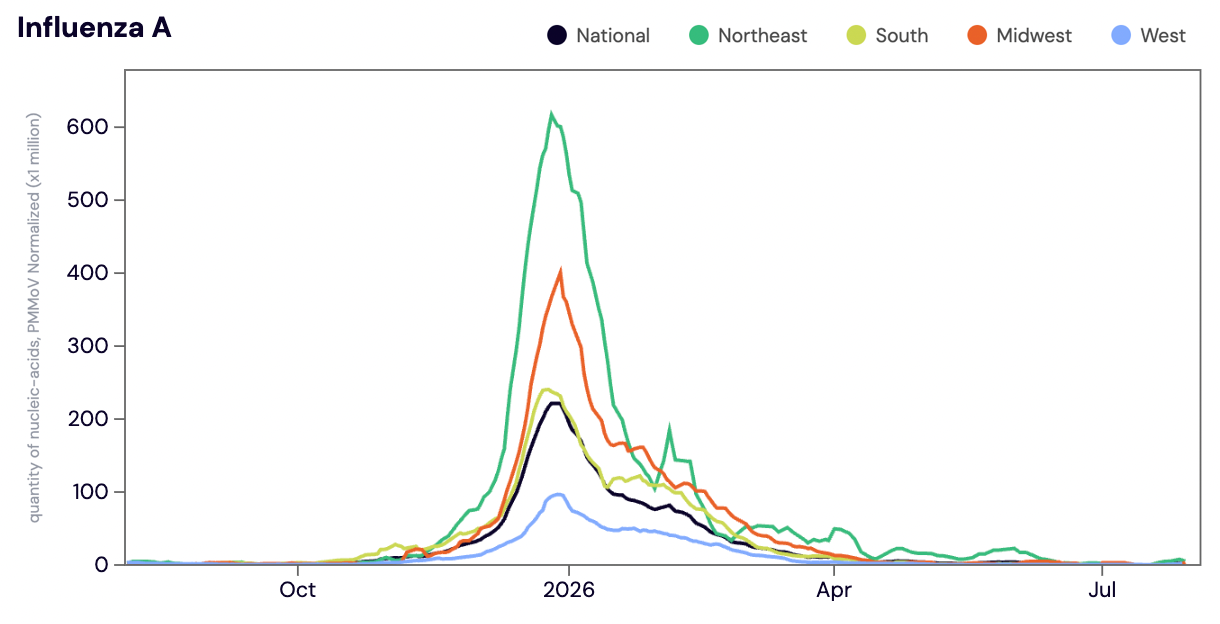
Midwest states: IA, IL, IN, KS, MI, MN, NE, OH, SD, WI. Northeast states: CT, MA, ME, NH, NJ, NY, PA, VT. Southern states: AL, AR, DE, FL, GA, KY, LA, MD, MS, NC, TN, TX, VA, and WV. Western States: AK, CA, CO, HI, ID, NV, UT, WA.
H1 Marker in Influenza A (IAV) The H1 marker in Influenza A was detected in ~3% of samples in July 2026. The H1 median concentration across all sites in July 2026 was below the limit of detection. You can find a heat map of positive H1 detections here. This past flu season (2025-2026) we saw very low detections of the H1 influenza marker compared to the H3 influenza marker.
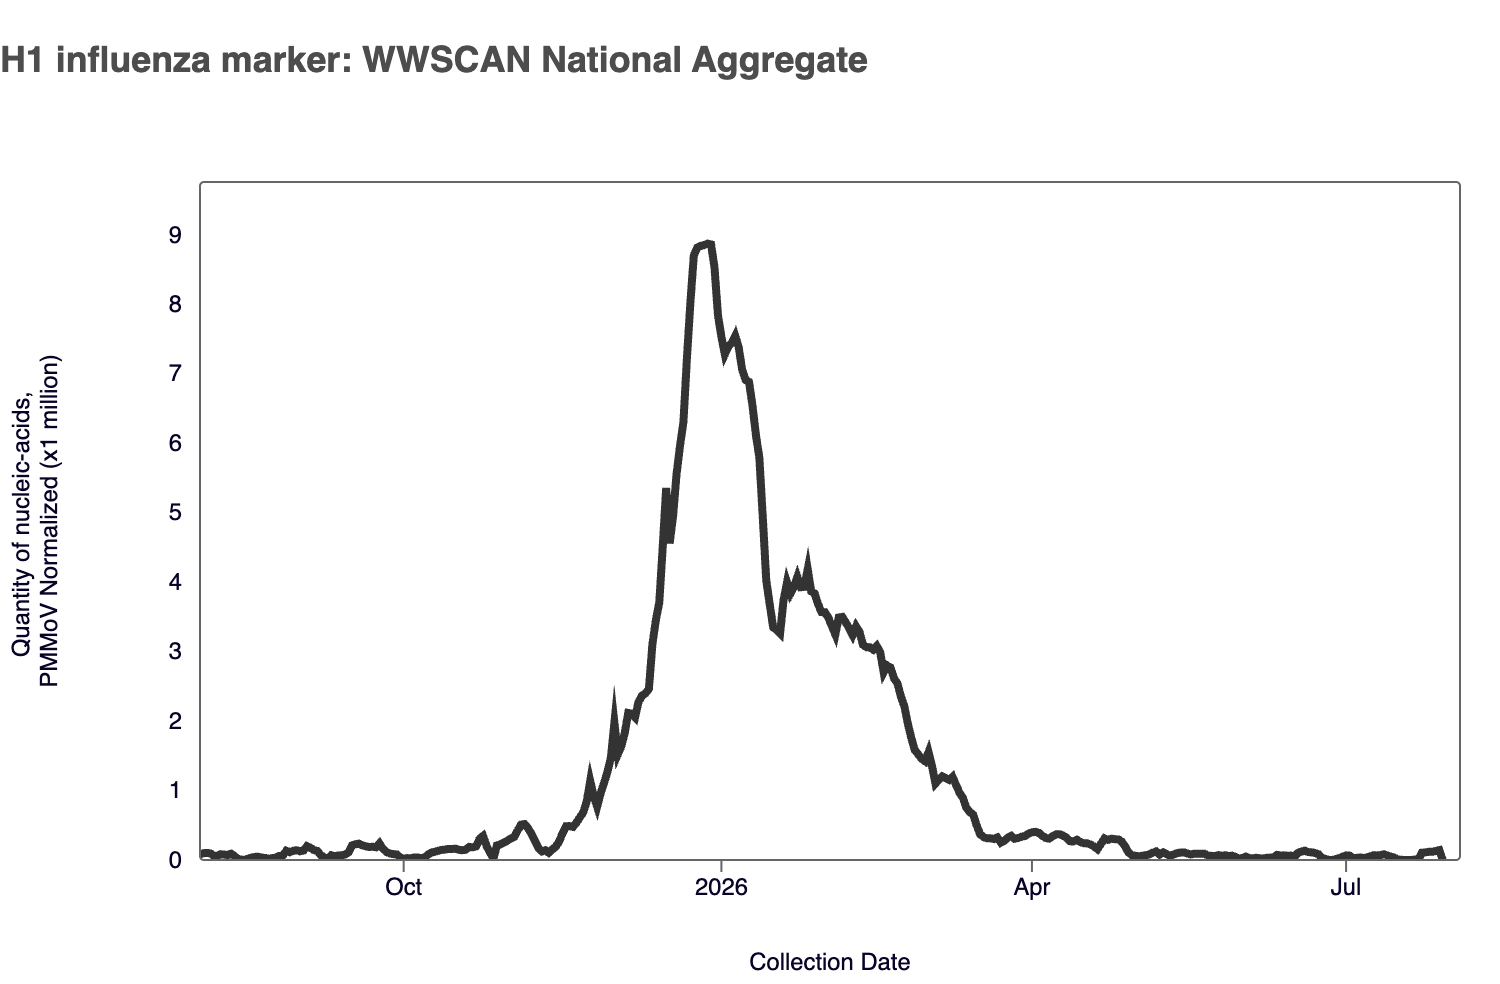
Plot shows last 12 months of data for the WWSCAN national aggregate of the H1 marker. Note the y-axis scale shows normalized wastewater concentrations for the H1 influenza marker.
H3 Marker in Influenza A (IAV) In July 2026, the H3 marker in influenza A was detected in ~1.9% of samples. The H3 median concentration across all sites in July 2026 was below the limit of detection. During the 2025-2026 respiratory virus season, the H3 marker appeared to increasingly drive the higher influenza A concentrations. You can find a heat map of positive H3 detections here.
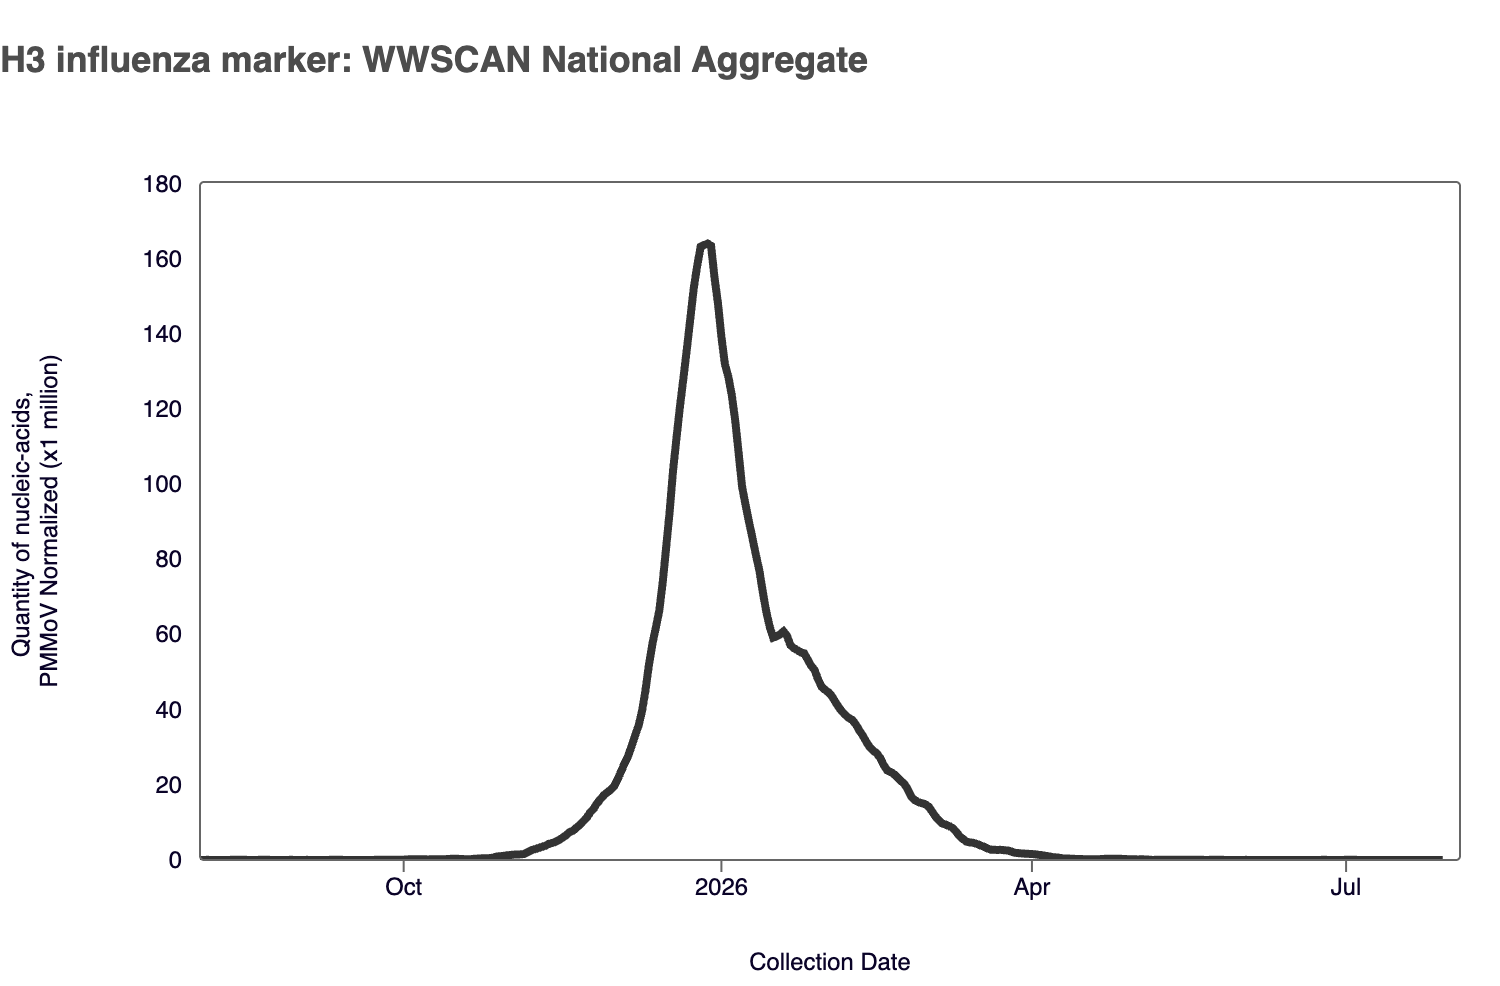
Plot shows last 12 months of data for the WWSCAN national aggregate. Note the y-axis scale shows normalized wastewater concentrations for the H3 influenza marker.
H5 Marker in Influenza A (IAV) As of July 31, 2026, WWSCAN sites across 28 states (AK, AR, CA, CO, CT, DE, FL, IA, ID, IL, KS, KY, MA, ME, MD, MI, MN, NC, NE, NH, NJ, NV, SD, TN, TX, UT, VA and VT) have seen positive detections for the H5 marker in influenza A. Since prospective monitoring began, 1,102/52,383 samples have tested positive (~2.1% detection rate). In July 2026, there were 3 positive H5 marker detection (1 in CA, and 2 in ME). You can find a heat map of positive detections here.
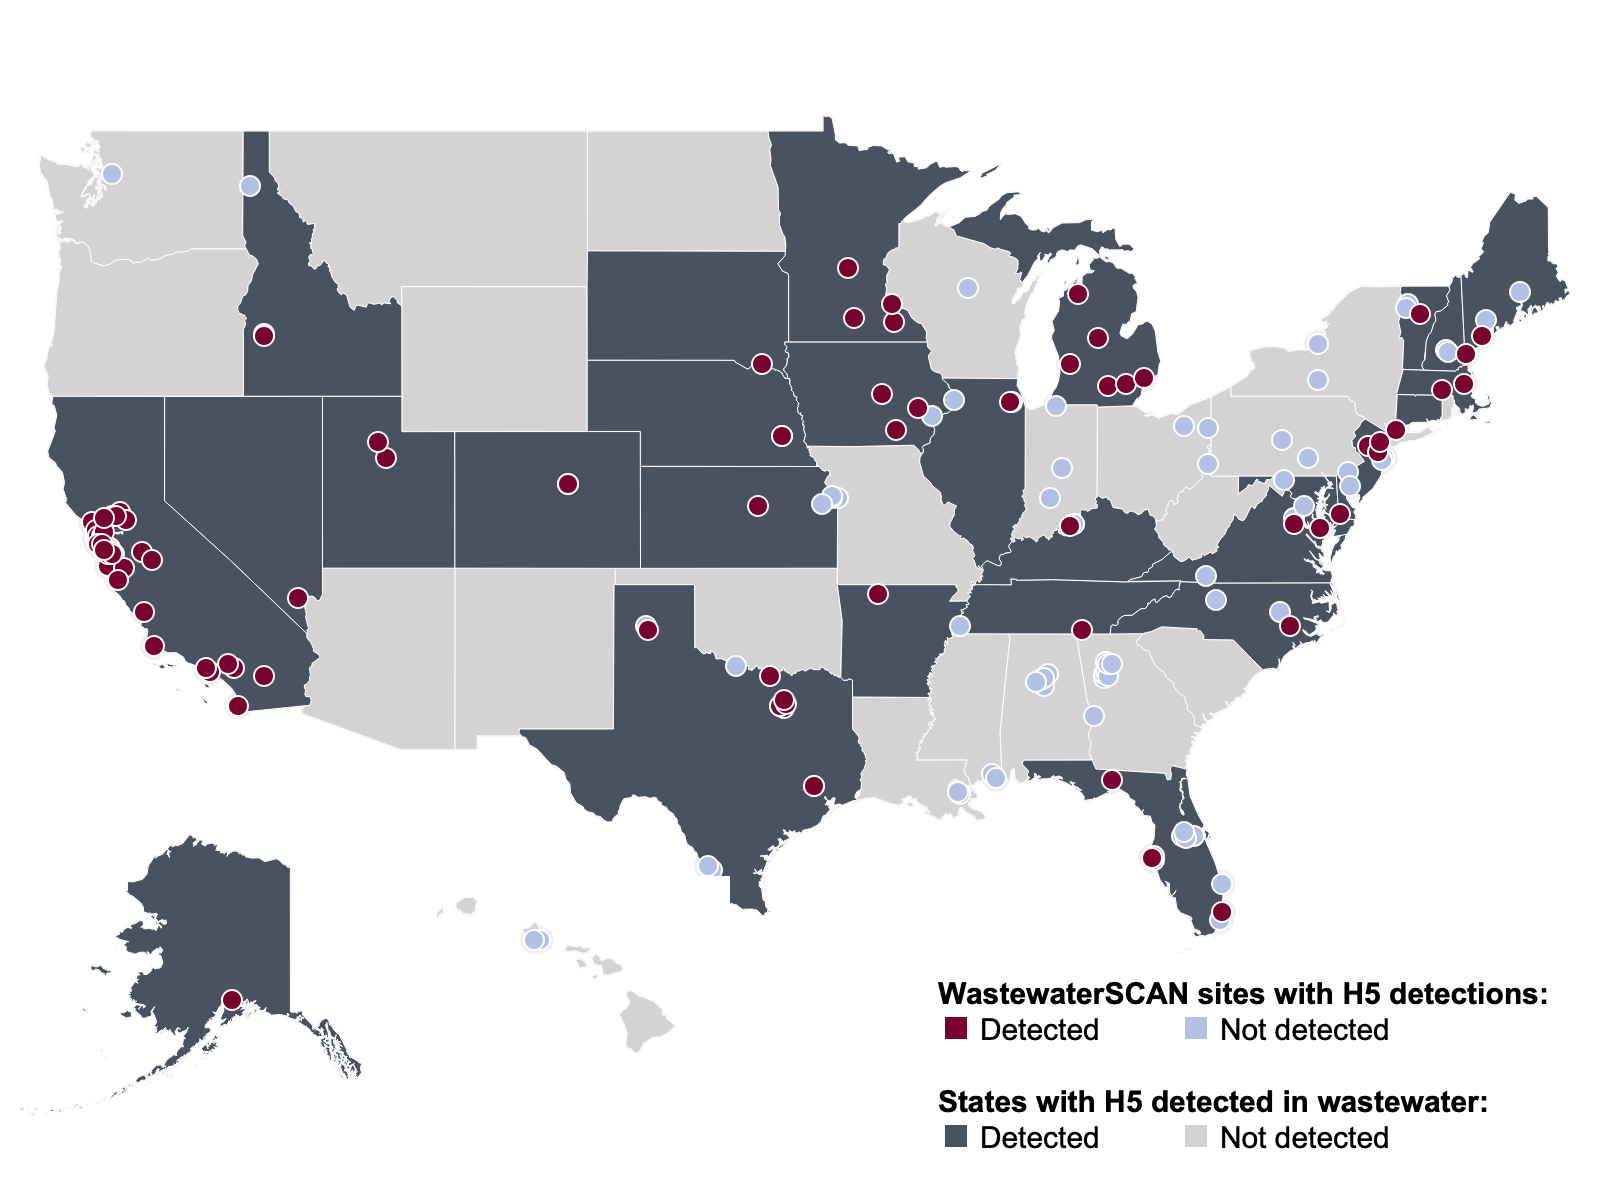
In January 2026 WWSCAN started calculating a wastewater category for the H5 influenza marker. The H5 marker is now assigned to the 'Pathogens that are not commonly detected ' category logic. Nationally, the H5 influenza marker is in the 'LOW' category due to limited detections.
Influenza B (IBV) RNA was detected in ~5.6% of samples in July 2026. The median IBV RNA concentration across all sites in July 2026 was below the limit of detection. Concentrations of IBV have been trending down since early March 2026.
Below is the population-weighted average IBV RNA concentrations (normalized by PMMoV) is shown in black from all participating WWSCAN sites across the country over the last 365 days. Nationally, Influenza B is in the 'LOW' Wastewater Category due to no longer being in seasonal onset.
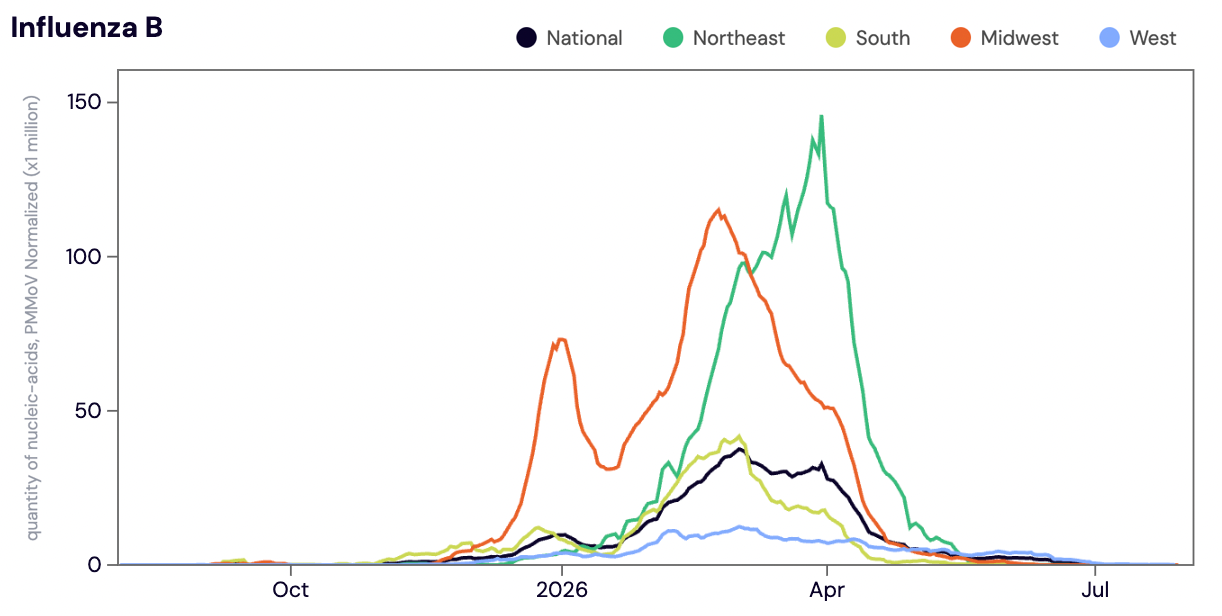
Midwest states: IA, IL, IN, KS, MI, MN, NE, OH, SD, WI. Northeast states: CT, MA, ME, NH, NJ, NY, PA, VT. Southern states: AL, AR, DE, FL, GA, KY, LA, MD, MS, NC, TN, TX, VA, and WV. Western States: AK, CA, CO, HI, ID, NV, UT, WA.
Respiratory syncytial virus (RSV) RNA was detected in ~7.3% of samples in July 2026. The RSV RNA median concentration across all sites in July 2026 was below the limit of detection. As a reminder, during last years respiratory virus season the WWSCAN network hit seasonal onset for RSV in early December 2024 and peaked in late January/early February 2025. We saw a slower start to the RSV wastewater wave this year (2025-2026) compared to last year (2024-2025). Concentrations of RSV have been trending down since early April 2026.
Below the population-weighted average RSV RNA concentrations (normalized by PMMoV) is shown in black from all participating WWSCAN sites across the country over the last 365 days. Nationally, RSV is in the 'LOW' Wastewater Category due to no longer being in seasonal onset.
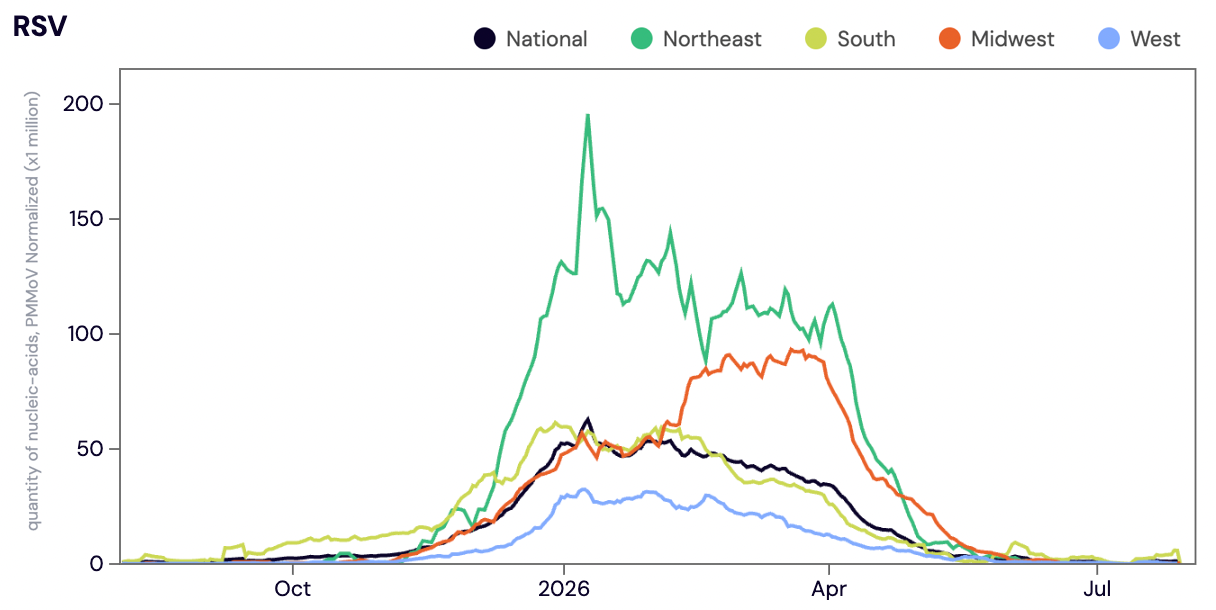
Midwest states: IA, IL, IN, KS, MI, MN, NE, OH, SD, WI. Northeast states: CT, MA, ME, NH, NJ, NY, PA, VT. Southern states: AL, AR, DE, FL, GA, KY, LA, MD, MS, NC, TN, TX, VA, and WV. Western States: AK, CA, CO, HI, ID, NV, UT, WA.
HMPV (human metapneumovirus) RNA was detected in ~16% of samples in July 2026. The median HMPV RNA concentrations across all sites in July 2026 was below the limit of detection. HMPV concentrations began decreasing mid April 2026.
Below is the population weighted average HMPV RNA concentrations (normalized by PMMoV) shown in black from all participating WWSCAN sites across the country over the last 365 days. Evident in the plot HMPV concentrations over the 2025-2026 respiratory virus seasons began decreasing mid April. Nationally, HMPV is in the 'LOW' Wastewater Category due to no longer being in seasonal onset.
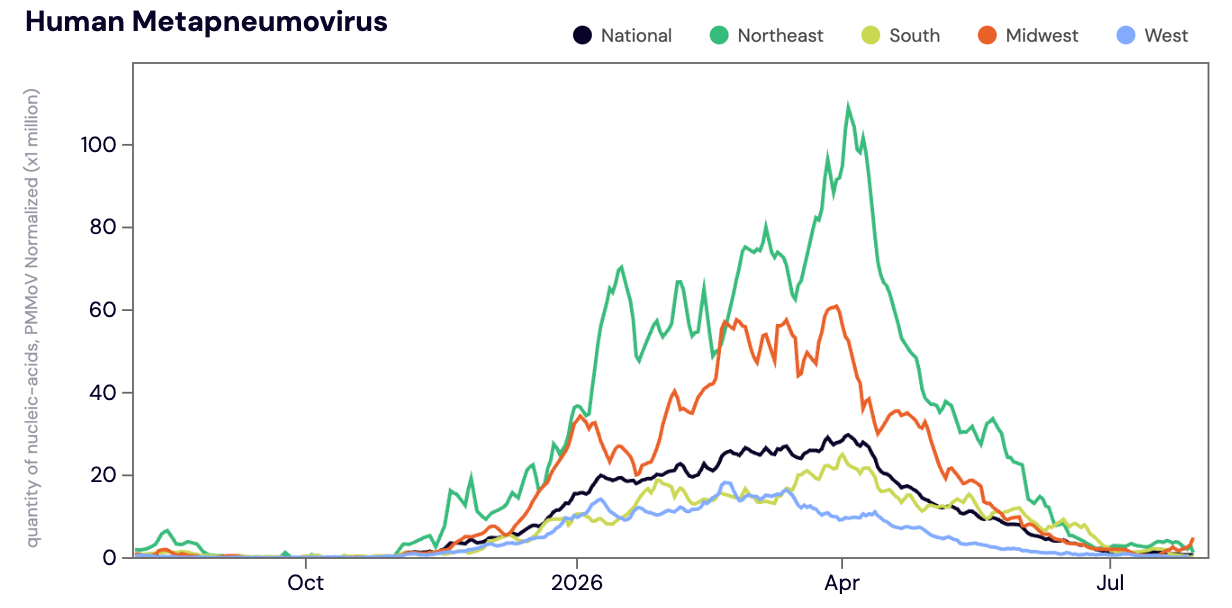
Midwest states: IA, IL, IN, KS, MI, MN, NE, OH, SD, WI. Northeast states: CT, MA, ME, NH, NJ, NY, PA, VT. Southern states: AL, AR, DE, FL, GA, KY, LA, MD, MS, NC, TN, TX, VA, and WV. Western States: AK, CA, CO, HI, ID, NV, UT, WA.
Enterovirus D68 (EV-D68) RNA was detected in ~2.2% of samples collected in July 2026. The median concentration across all sites in July 2026 was below the limit of detection. Nationally, EV-D68 is in the 'LOW' Wastewater Category and not in onset.
Below is the population-weighted average EV-D68 RNA (normalized by PMMoV) shown in black from all participating WWSCAN sites across the country over the last 24 months. In this plot you can see elevated EV-D68 concentrations across all regions during the 2024-2025 season. EV-D68 concentrations in the Midwest (shown in red) rose again in mid August 2025 before coming down in November 2025, and concentrations in the West (shown in blue) rose in late September 2025 and have come down since the beginning of January 2026. We will continue to monitor EV-D68 levels as we move through the summer season to see if detections start to take off or not.
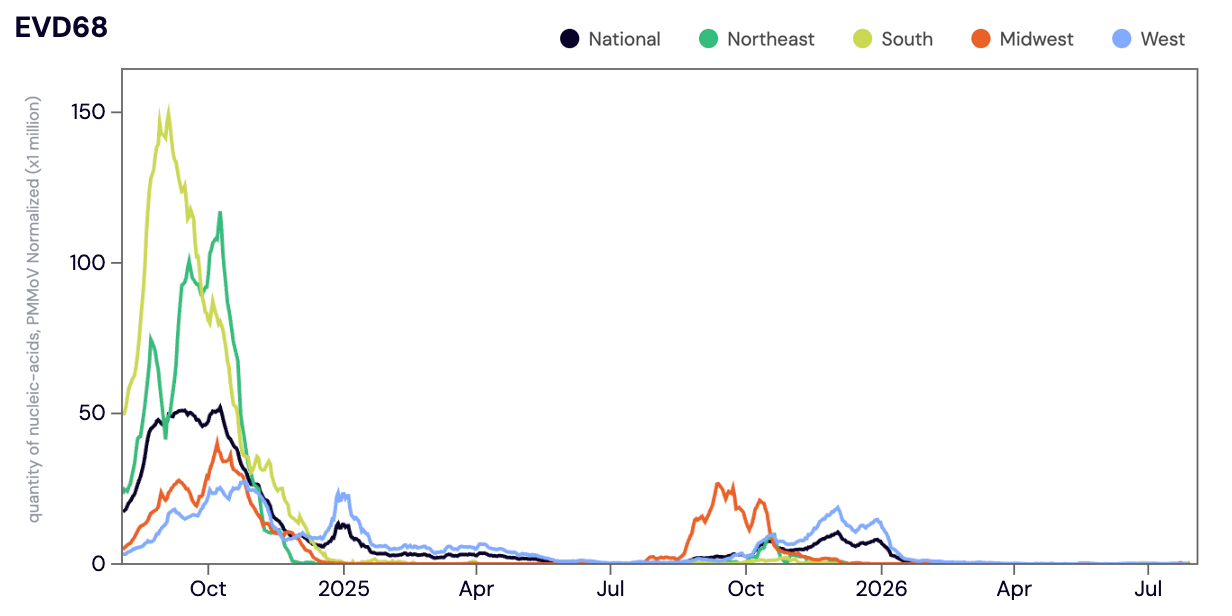
Midwest states: IA, IL, IN, KS, MI, MN, NE, OH, SD, WI. Northeast states: CT, MA, ME, NH, NJ, NY, PA, VT. Southern states: AL, AR, DE, FL, GA, KY, LA, MD, MS, NC, TN, TX, VA, and WV. Western States: AK, CA, CO, HI, ID, NV, UT, WA.
Parvovirus (Parvo) DNA was detected Parvo DNA in ~8.5% of samples from all WWSCAN sites in July 2026. In March 2026 WWSCAN started calculating a wastewater category for Parvo. Parvo is now assigned to the 'Pathogens that are not commonly detected ' category logic. Nationally, Parvo is in the 'LOW' category due to limited detections.
The chart below shows each WWSCAN plant in Iowa as rows, and days as columns (labeled at the bottom axis). White indicates no samples, blue is a non-detect for Parvo DNA and red is a detection for Parvo DNA. Evident in the plot is limited detections at some sites and frequent detections at other sites.
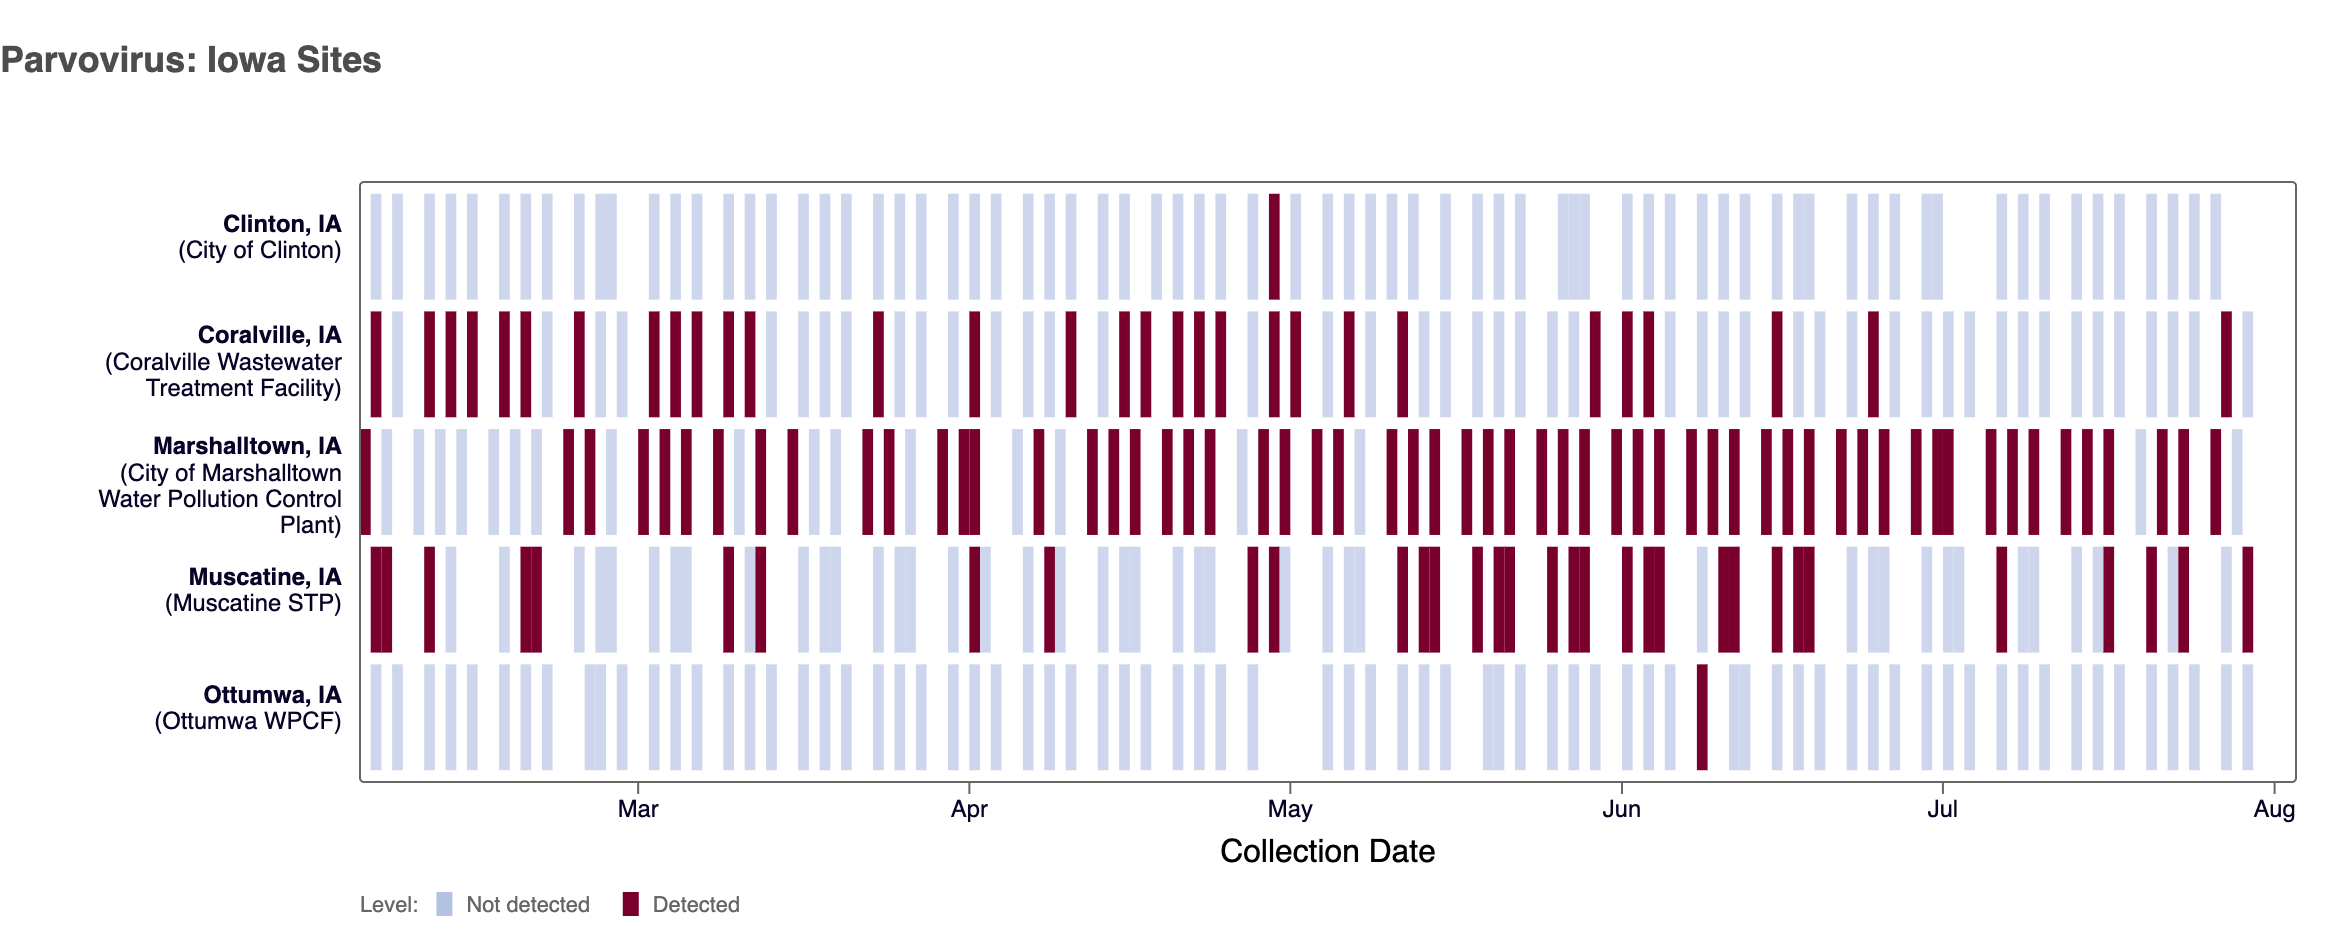
Heat map of positive Parvovirus detections (in red) across sites in Iowa participating in WWSCAN over the last 6 months. Blue indicates non-detect.
Gastrointestinal Pathogens
Norovirus GII, Human Adenovirus Group F, & Rotavirus
Norovirus GII (HuNoV GII) RNA was detected in 100% of samples analyzed in July 2026. The median Norovirus concentration in July 2026 was down ~45% compared to June 2026. Last year, we saw Norovirus concentrations start to increase in early October 2024 and peak early February 2025. While we saw a slower start to the winter Norovirus wave this year (2025-2026), the pattern is similar to what we observed during the 2023-2024 winter Norovirus wave.
Below is the population weighted average HuNoV GII RNA concentrations (normalized by PMMoV) shown in black from all participating WWSCAN sites across the country over the last 24 months. Nationally, Norovirus is in the 'LOW' Wastewater Category with aggregated measurements showing low concentrations and no trend in the last 21 days.
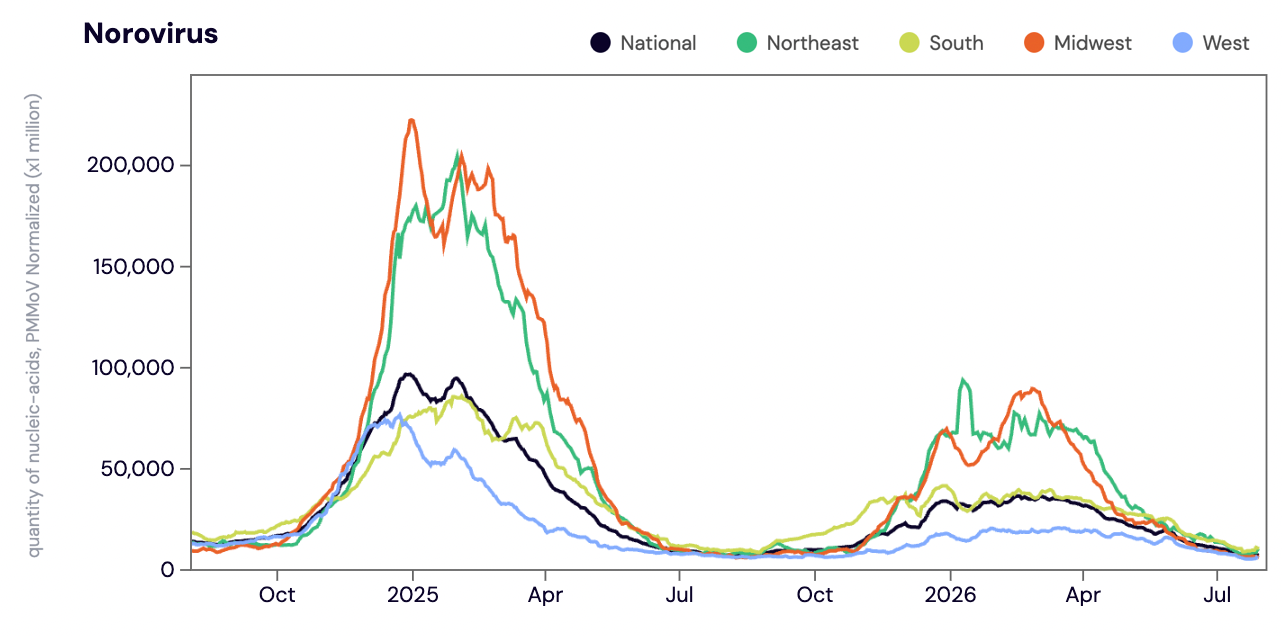
Midwest states: IA, IL, IN, KS, MI, MN, NE, OH, SD, WI. Northeast states: CT, MA, ME, NH, NJ, NY, PA, VT. Southern states: AL, AR, DE, FL, GA, KY, LA, MD, MS, NC, TN, TX, VA, and WV. Western States: AK, CA, CO, HI, ID, NV, UT, WA.
Human Adenovirus Group F (HAdV-F) RNA - In mid May 2025, WWSCAN began prospectively monitoring for HAdV-F.
HAdV-F RNA was detected in 100% of samples from all WWSCAN sites in July 2026. The median HAdV-F concentration in July 2026 was down ~29% compared to June 2026.
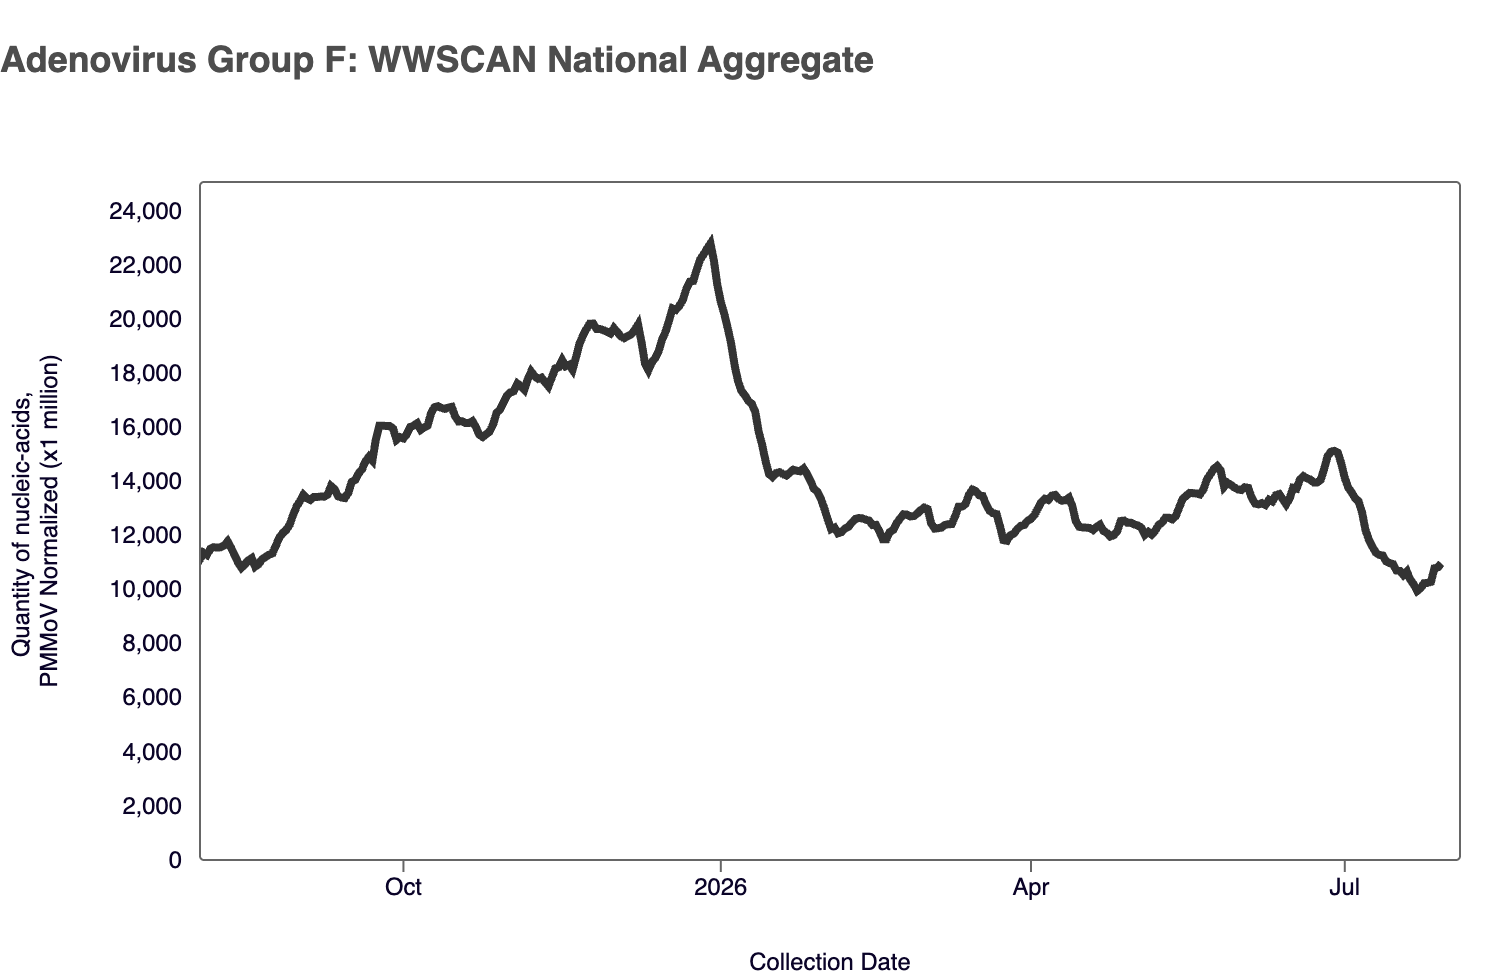
Plot shows last 12 months of HAdV-F for the WWSCAN national aggregate since monitoring resumed. Note the y-axis scale shows normalized wastewater concentrations for HAdV-F.
As a reminder, we are not currently calculating wastewater categories for HAdV-F. In order to calculate wastewater categories we need a longer time series of data to examine trends and levels.
Rotavirus (Rota) RNA - In mid May 2025, we started measuring Rotavirus again. We previously paused measurements of Rota in December 2024 in order to being measuring Mpox clade Ib. In March 2026 WWSCAN started calculating a wastewater category for Rota. Rota is now assigned to the 'Commonly detected' category logic.
Rota RNA was detected in ~81% of samples from all WWSCAN sites in July 2026. The median concentrations across all sites in July 2026 was 12,670 copies/gram, down ~81% from June 2026. Rotavirus concentrations peaked in April 2026 and have been decreasing ever since, which is what we would typically expect to see this time of year.
Below is the is the population weighted average Rota RNA concentrations (normalized by PMMoV) shown in black from all participating WWSCAN sites across the country over the last 24 months. The dashed black lines indicate the period of time the Rota assay was paused (~6 months). Evident in the plot is rotavirus concentrations decreasing across all regions. Nationally, Rotavirus is in the 'LOW' Wastewater Category with aggregated measurements showing low concentrations and a downward trend in the last 21 days.
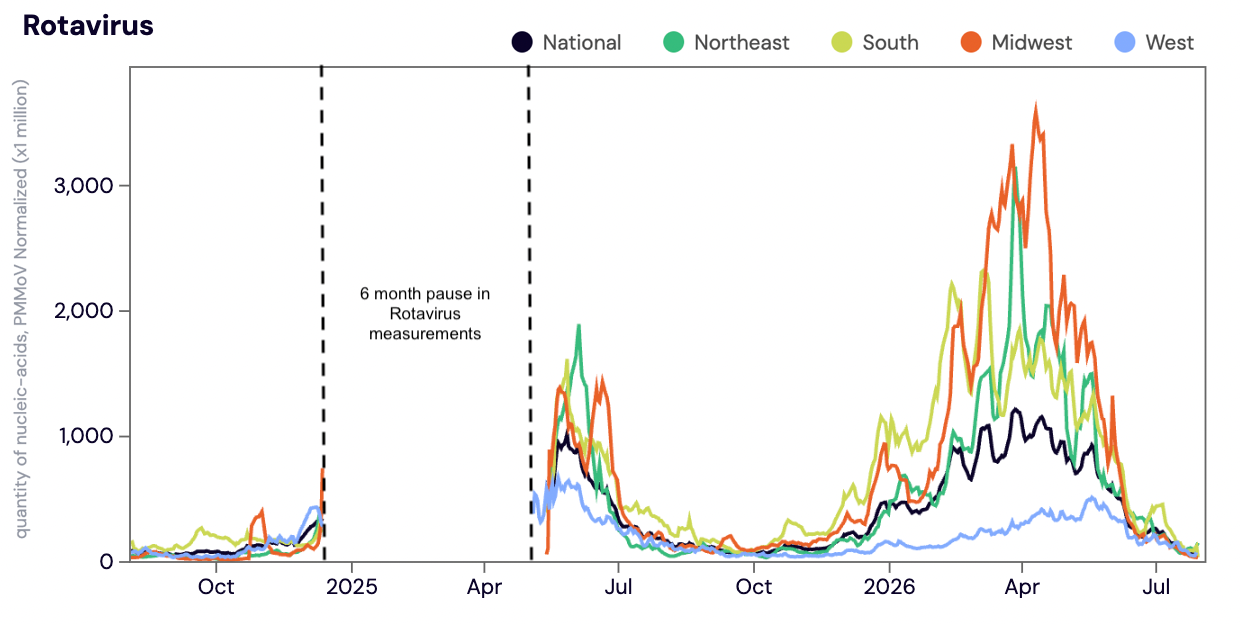
The dashed black lines indicate the period of time the Rota assay was paused (~6 months).
Other Pathogens of Concern
blaNDM, Candidozyma auris, Hepatitis A, Measles, Mpox clade Ib, Mpox clade II, Mycobacterium tuberculosis, and West Nile Virus
blaNDM RNA/DNA- New Delhi metallo-beta lactamase (blaNDM) data went live to the WWSCAN dashboard in early July 2026. blaNDM is an antibiotic-resistance gene that makes bacteria resistant to nearly all beta-lactam antibiotics by producing NDM, an enzyme that inactivates these antibiotics. It is extremely versatile in inactivating a broad class of antibiotics and its high genetic mobility. The assay we run will detect blaNDM variants 1-15, 17-31, and 33-47 (Chavda et al., 2016).
As we just started measuring this new pathogen, we are not currently calculating wastewater categories for blaNDM. In order to calculate wastewater categories we need a longer time series of data to examine trends, levels and differences in prevalence across regions. For now, this data can only be viewed in chart mode on the data dashboard. For more information on blaNDM please see: Frequently Asked Questions on WWSCAN Measurements of blaNDM nucleic acids in Wastewater Solids.
Candidozyma auris (C. auris) DNA was detected C. auris DNA in ~4.2% of samples from all WWSCAN sites in July 2026. Nationally, C. auris is in the 'LOW' category due to limited detections.
The chart below shows plants in Texas as rows, and days as columns (labeled at the bottom axis). White indicates no samples, blue is non-detect for C. auris DNA and red is detect for C. auris DNA. Evident in the plot below is most sites have few to no detections of C. auris.
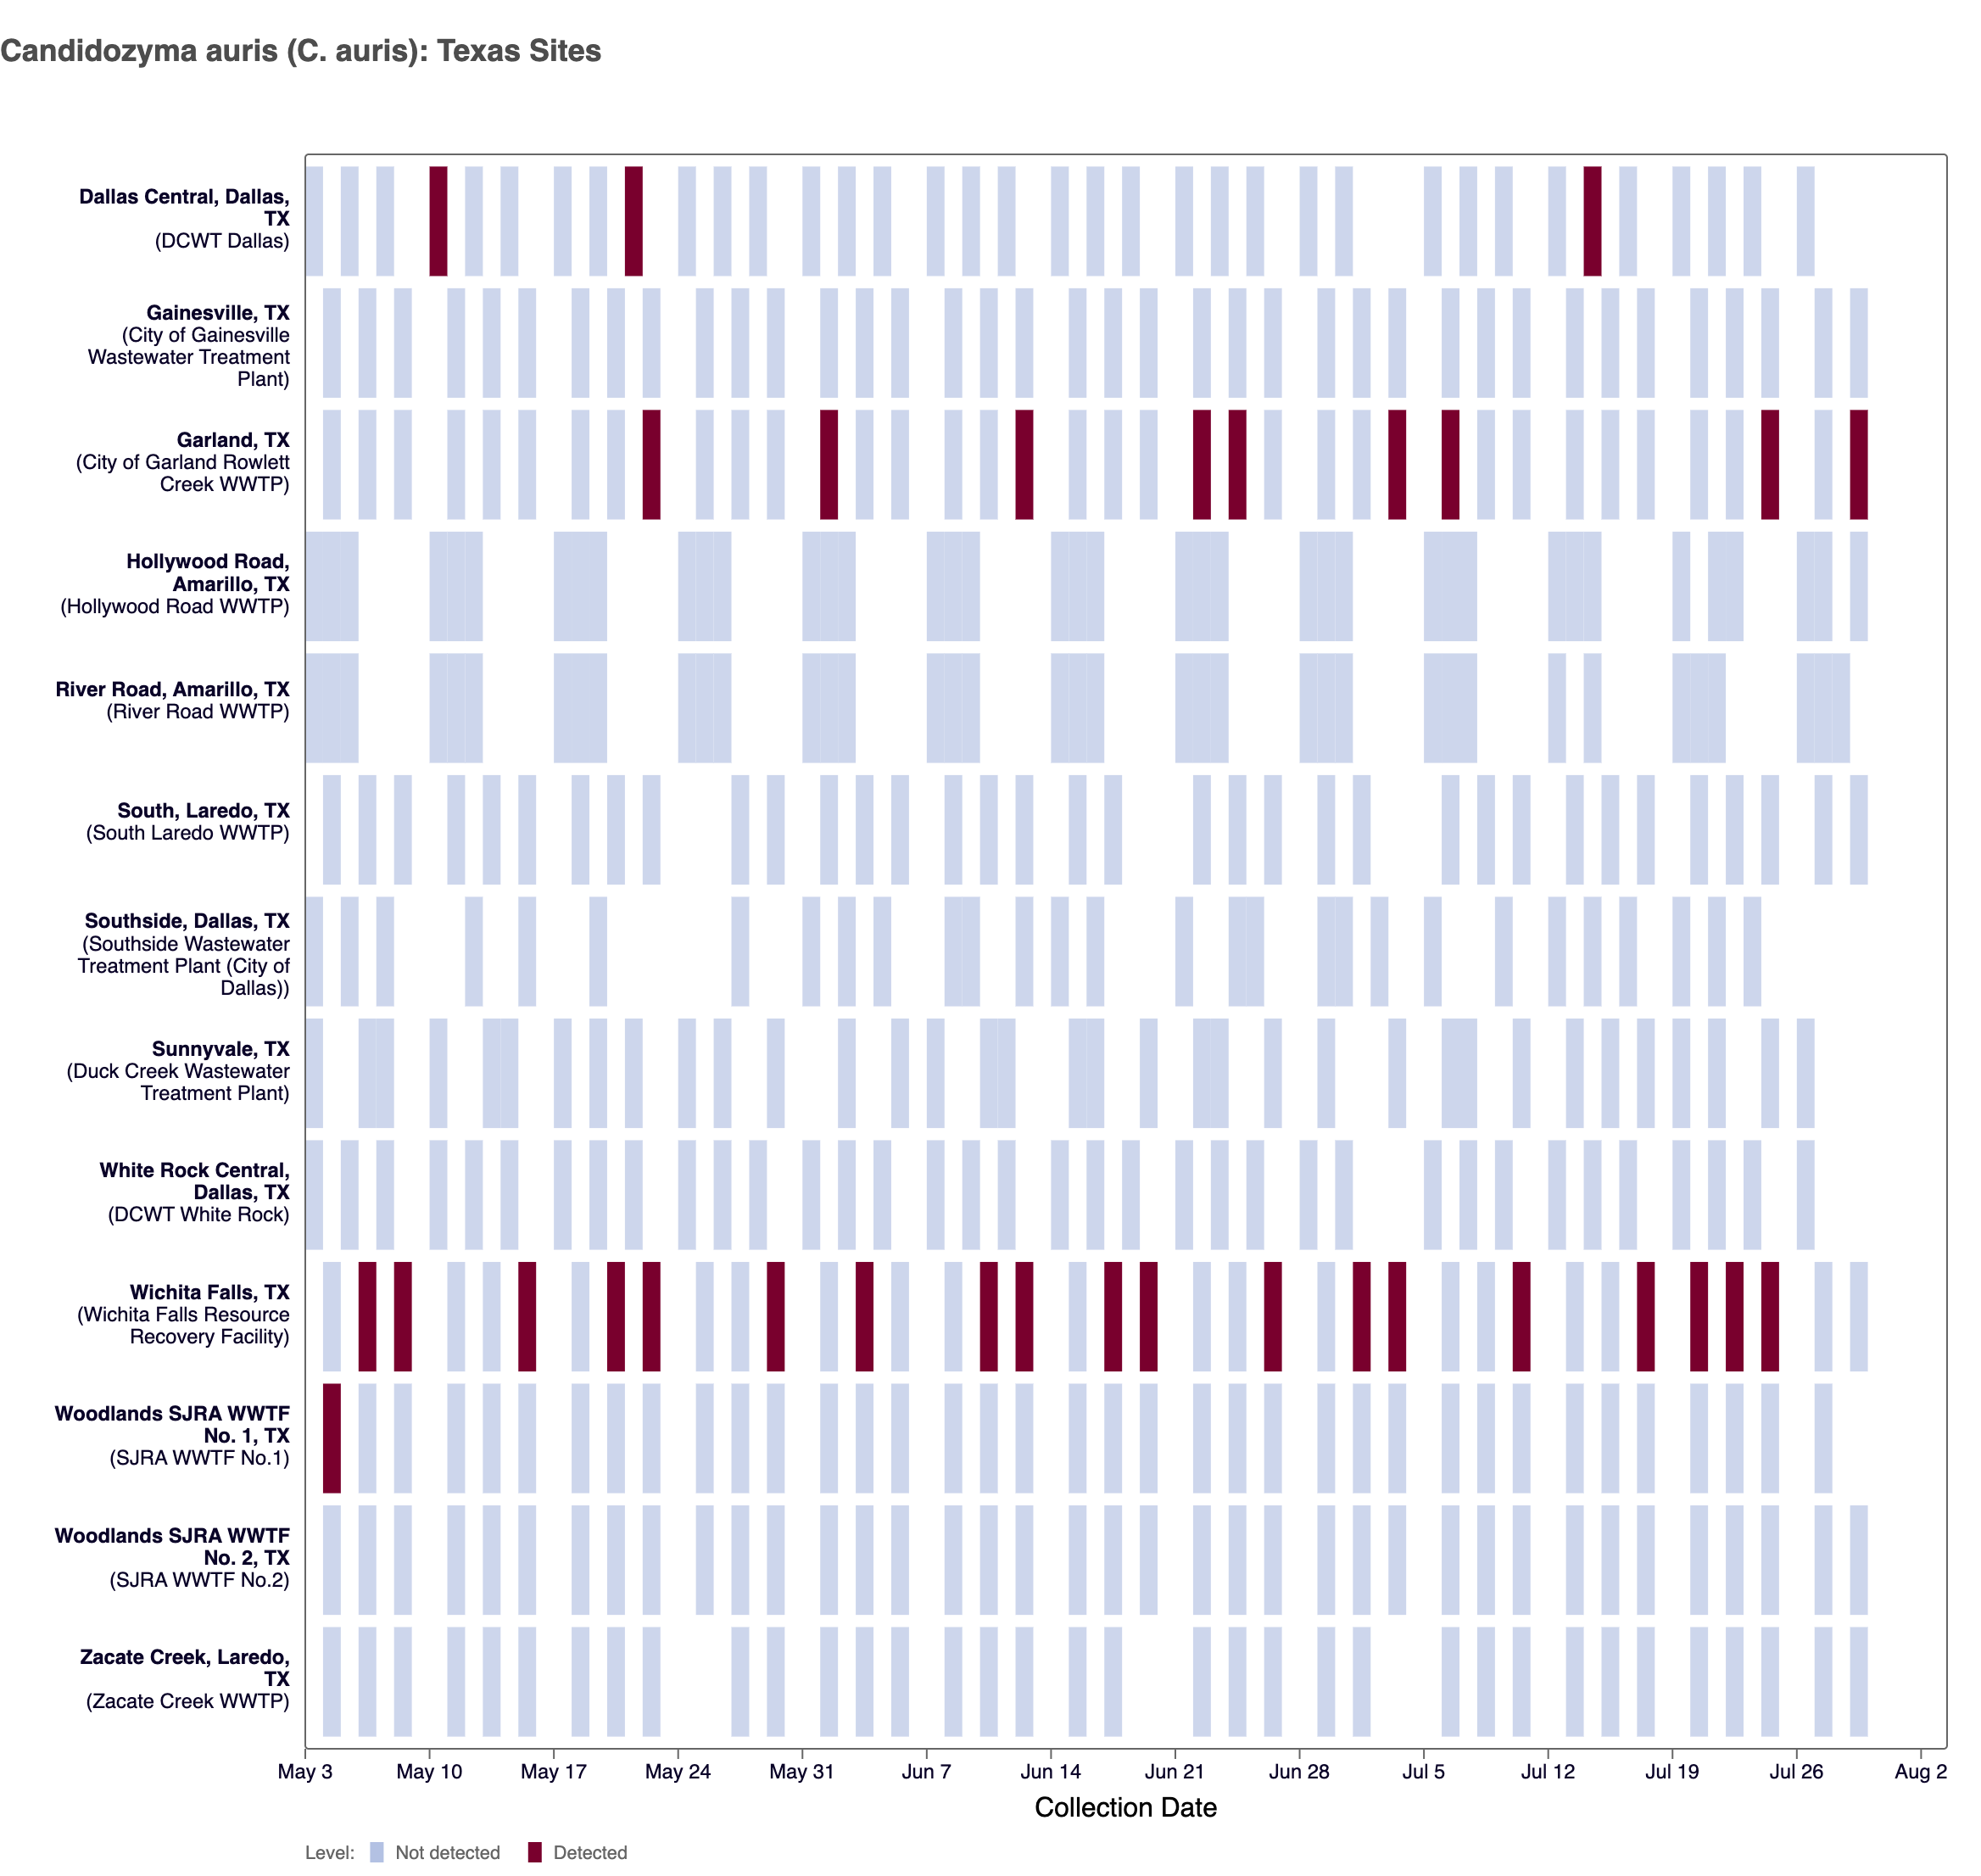
Heat map shows last 3 months of C. auris wastewater data from WWSCAN sites in Texas. Blue indicates non-detect.
Hepatitis A (HepA) RNA was detected Hep A RNA in ~5.5% of samples from all WWSCAN sites in July 2026. Nationally, HepA is in 'LOW' category due to limited detections.
The chart below shows each WWSCAN plant in HHS Region 4 as rows, and days as columns (labeled at the bottom axis). White indicates no samples, blue is a non-detect for Hep A RNA and red is a detection for Hep A RNA. Evident in the plot below is some sites have consistent detections while others have few to no detections of HepA.
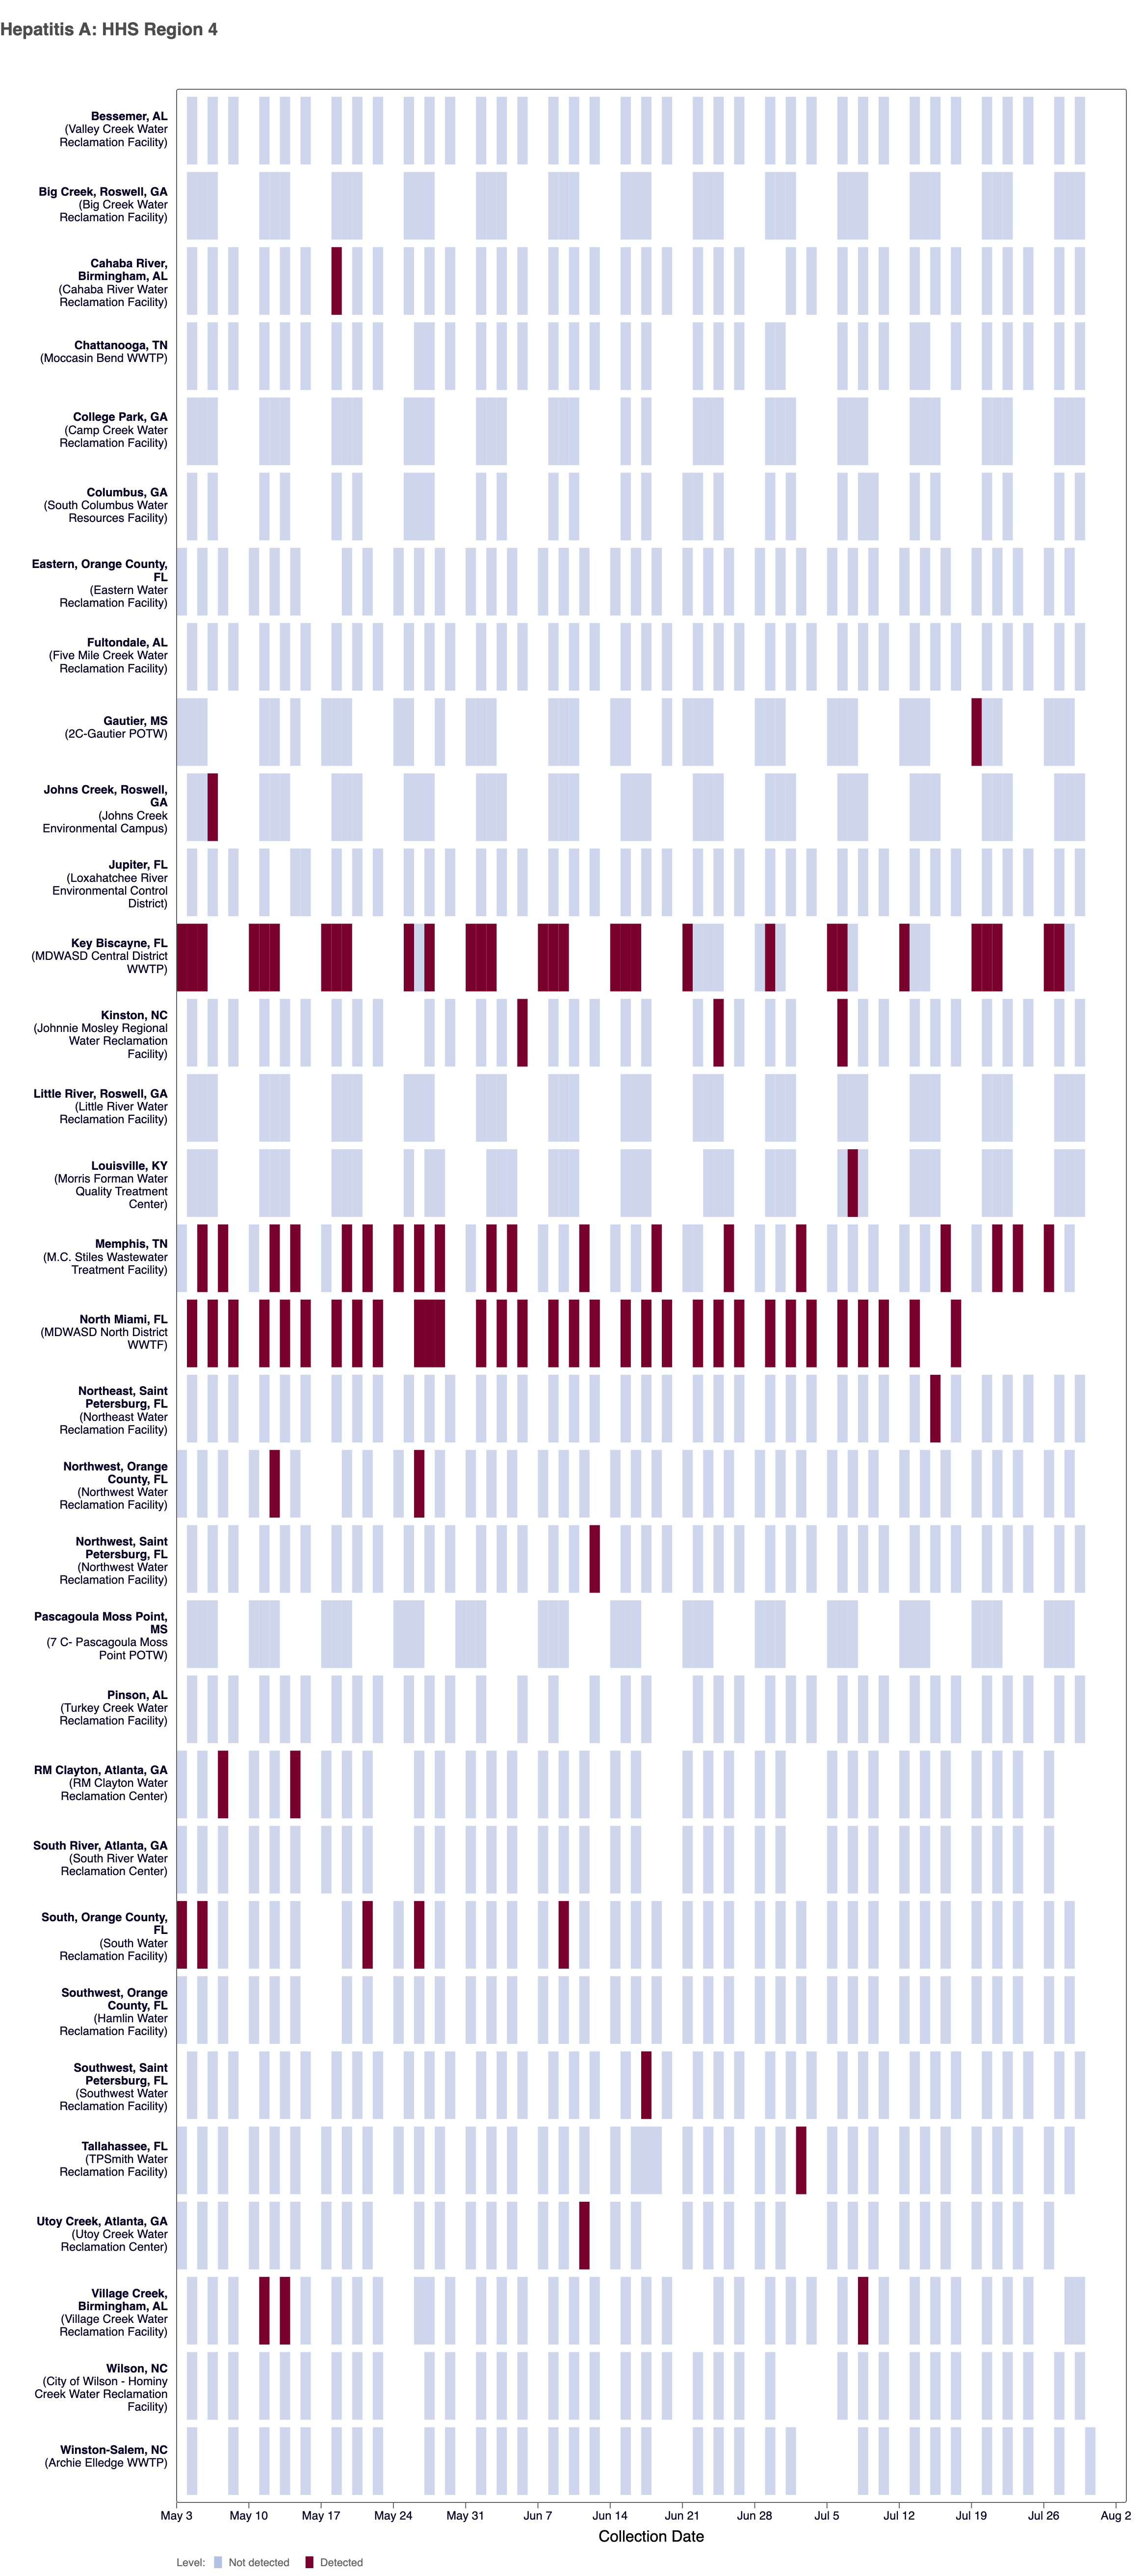
Heat map shows last 3 months of Hepatitis A wastewater data from WWSCAN sites in HHS Region 4. Blue indicates non-detect.
Measles (MeV) RNA - In mid-May 2025, WWSCAN began prospectively monitoring for MeV. Since prospective monitoring began, 232/28,599 samples have tested positive (~0.8% detection rate). In July 2026, there were 18 positive detections of MeV in wastewater samples (6 in KS, 4 in KY, 1 in PA, 2 in TX and 5 in UT). Nationally, MeV is in the 'LOW' category due to limited detections.
Since monitoring began, 52 sites across 24 states (AK, CA, CO, CT, FL, GA, IA, ID, IL, IN, KS, KY, MD, MI, MN, NE, NJ, NV, NY, PA, TX, UT, VA, and VT) have had at least 1 positive detection of MeV in wastewater samples collected. Below is a map of sites with MeV detections in wastewater since prospective monitoring began.
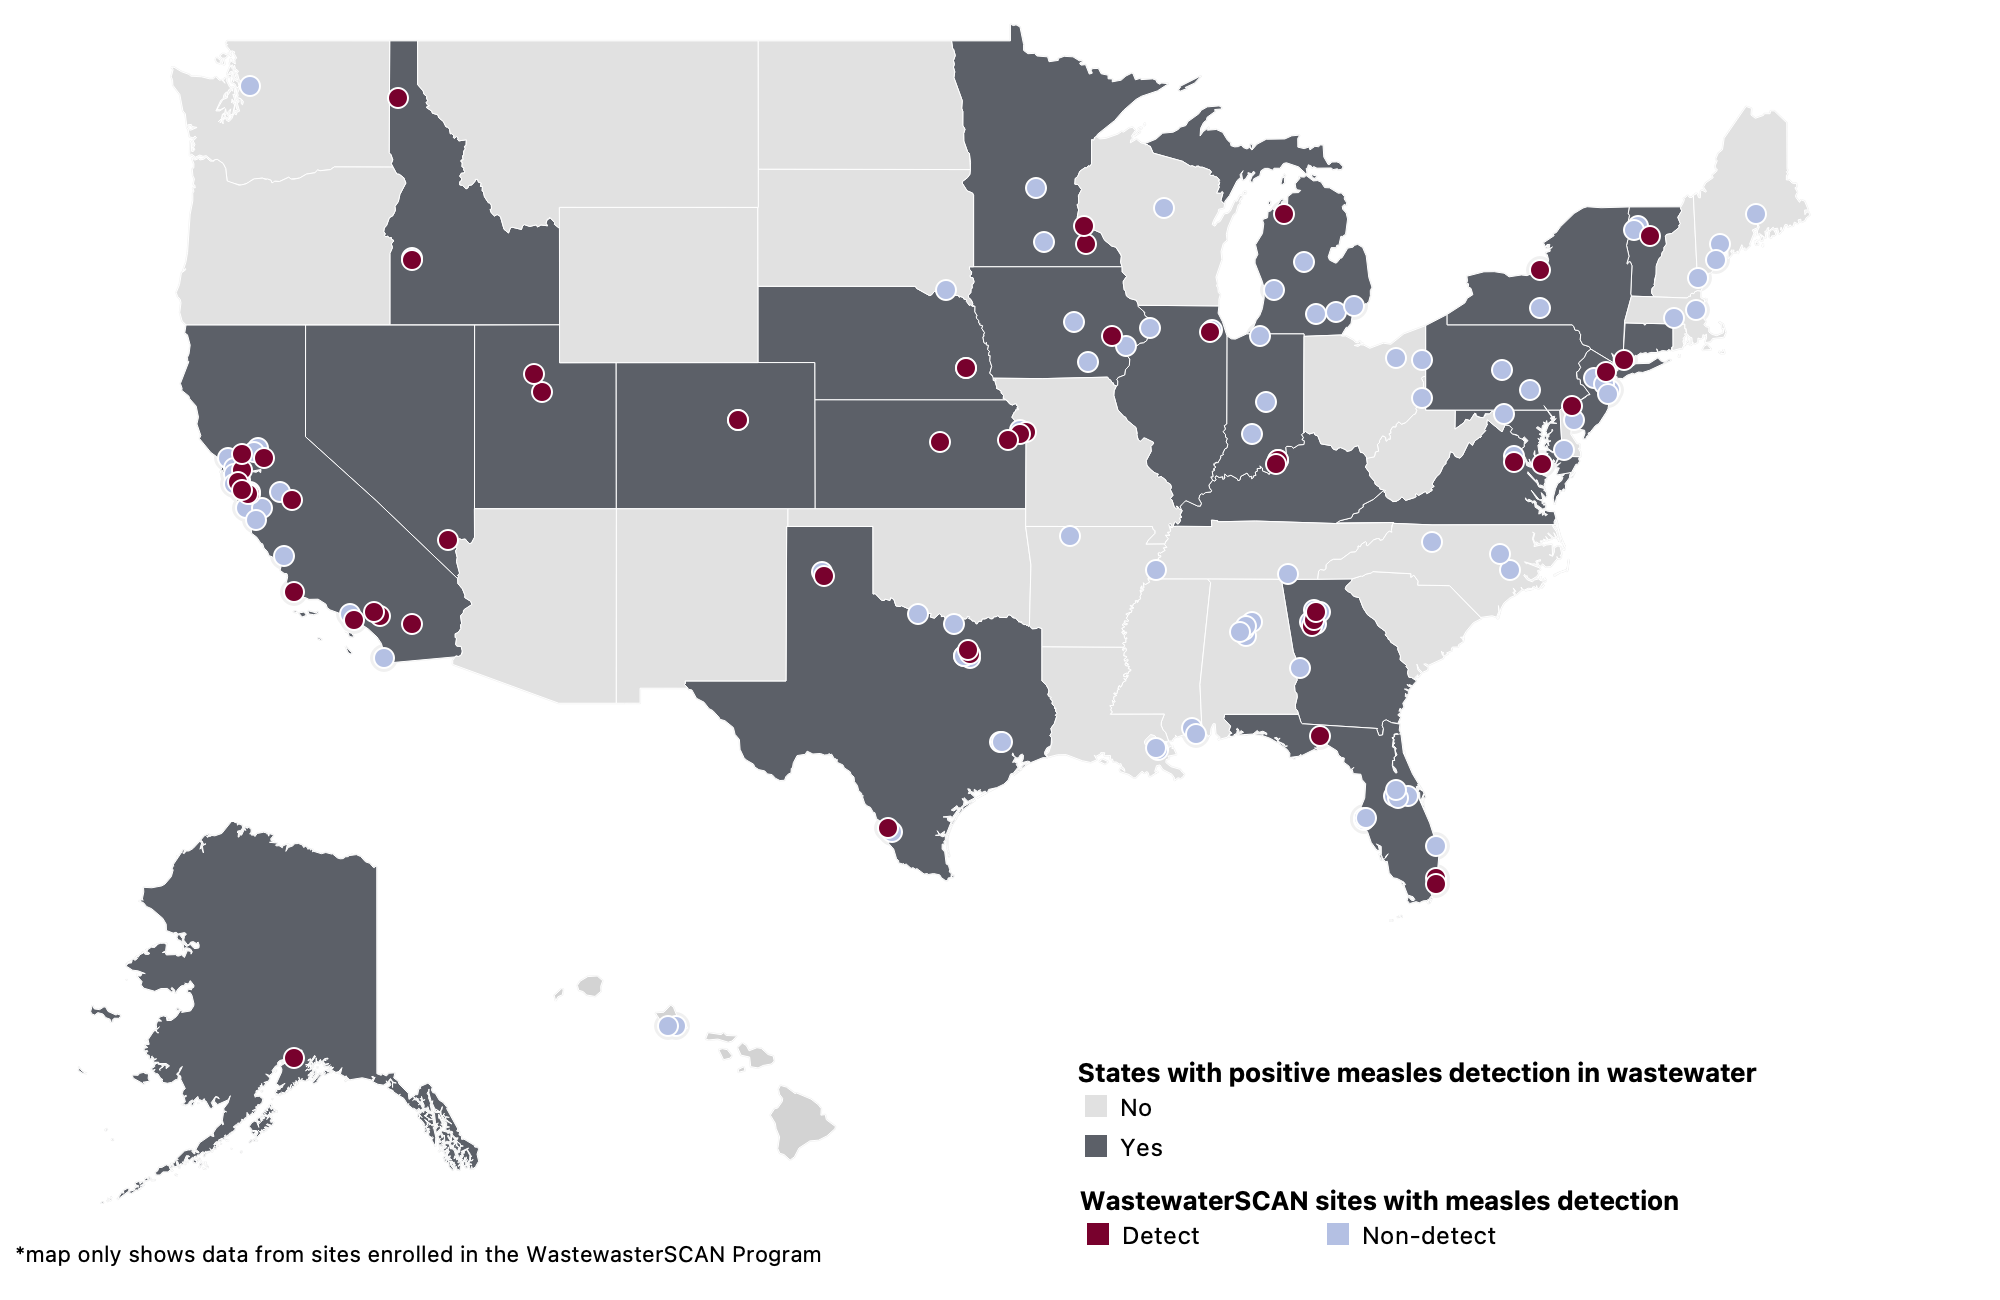
The WWSCAN program began monitoring for measles in wastewater start mid May 2025. This map only shows data from the sites/states that are covered by the WWSCAN program.
Mpox clade Ib DNA - In mid December 2024, WWSCAN began prospective monitoring for Mpox clade Ib. You can find a heat map of the Mpox clade Ib data here. In July 2026, there were no positive detections of Mpox clade Ib. Nationally, Mpox clade Ib is in the 'NOT-DETECTED' category due to no recent detections.
Mpox clade II DNA - There were 5 positive detections of Mpox clade II in July 2026. Nationally, Mpox clade II is in the 'LOW' category due to limited detections.
Mycobacterium tuberculosis (TB) RNA/DNA - Mycobacterium tuberculosis (TB) data went live to the WWSCAN dashboard in early July 2026. Globally, TB cases have increased in recent years after having previously fallen. There were more than 1 million deaths from TB in 2024. Monitoring TB nucleic-acids in wastewater can help shed light on TB infections across sewersheds in the WWSCAN network.
As we just started measuring this new pathogen, we are not currently calculating wastewater categories for TB. In order to calculate wastewater categories we need a longer time series of data to examine trends, levels, and frequency of detection. For now, this data can only be viewed in chart mode on the data dashboard. For more information on TB please see: Frequently Asked Questions on WWSCAN Measurements of Mycobacterium tuberculosis (TB) nucleic acids in Wastewater Solids
West Nile Virus RNA - In mid October 2025, WWSCAN began prospective monitoring for West Nile Virus (WNV). Nationally, WNV in the 'NOT-DETECTED' category due to no recent detections. There were no positive detections of WNV in July 2026.
WWSCAN protocols and methods
Protocols (Pre-analytical methods and SARS-CoV-2 analytical methods including controls):
- High Throughput RNA Extraction and PCR Inhibitor Removal of Settled Solids for Wastewater Surveillance of SARS-CoV-2 RNA
- High Throughput pre-analytical processing of wastewater settled solids for SARS-CoV-2 RNA analyses
- Quantification of SARS-CoV-2 variant mutations (HV69-70, E484K/N501Y, del156-157/R158G, del143-145, LPPA24S, S:477-505, and ORF1a Del 141-143) in settled solids using digital RT-PCR
- High Throughput SARS-COV-2, PMMoV, and BCoV quantification in settled solids using digital RT-PCR
- High Throughput wild type measles quantification in settled solids using digital RT-PCR
Peer-reviewed publications provided WWSCAN methods:
- SARS-CoV-2
- Influenza, Human metapneumovirus, Respiratory syncytial virus, Human parainfluenza
- Mpox clade Ib
- Mpox clade II
- Norovirus GII
- Adenovirus group F, Rotavirus
- Candida auris
- Hepatitis A
- Enterovirus D68
- Parovirus
Questions about WastewaterSCAN?
If you have questions about the website or anything else, please email: wwscan_stanford_emory@lists.stanford.edu