
Nationwide WWSCAN April 2025 Update
Hi everyone,
This newsletter contains updates on the WastewaterSCAN program with wastewater samples analyzed by the lab through April 30, 2025. Below you will find information on the program in terms of participating partners, review of targets being measured, as well as current wastewater categories (low, medium, high) of the infectious disease targets.
Best,
WastewaterSCAN Team
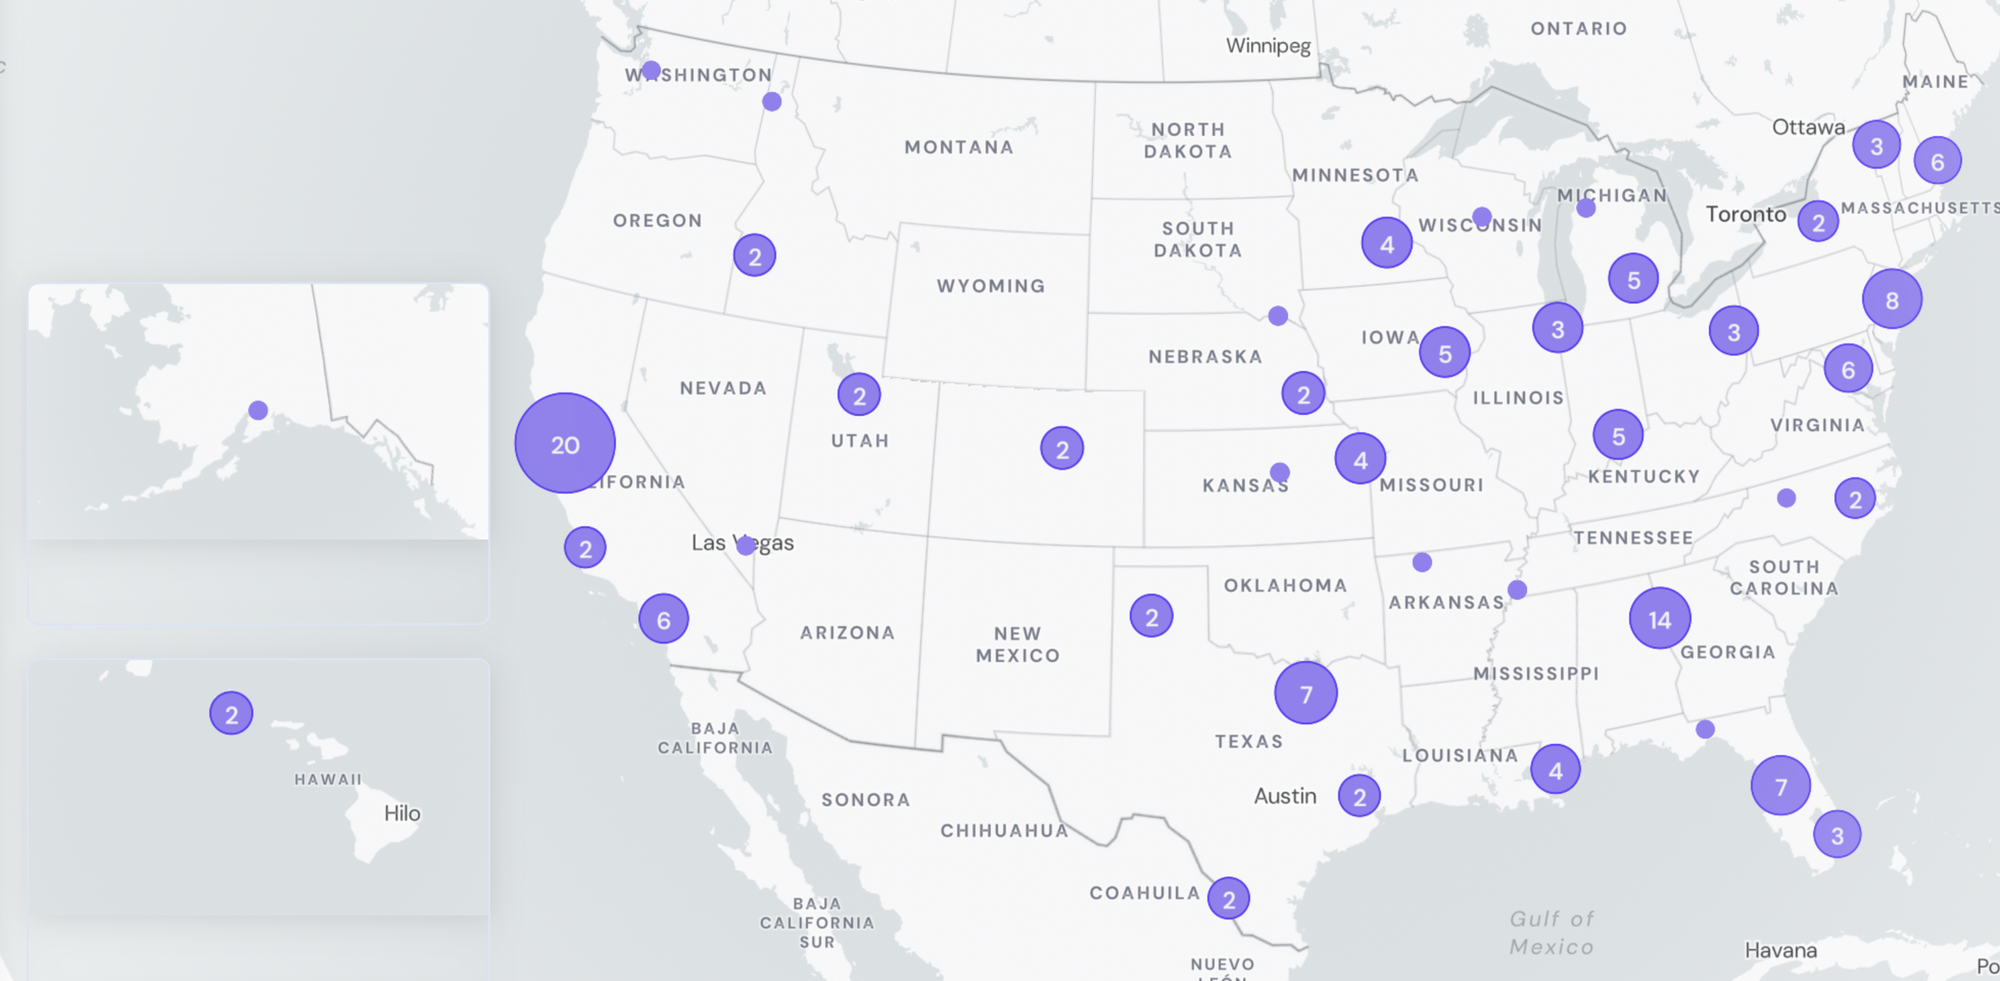
Participating Plants
147 WWTPs plants sampling across 40 states
WastewaterSCAN Participant Stats:
- 147 plants sampling
- >37 million people covered through sampling efforts
- 40 states
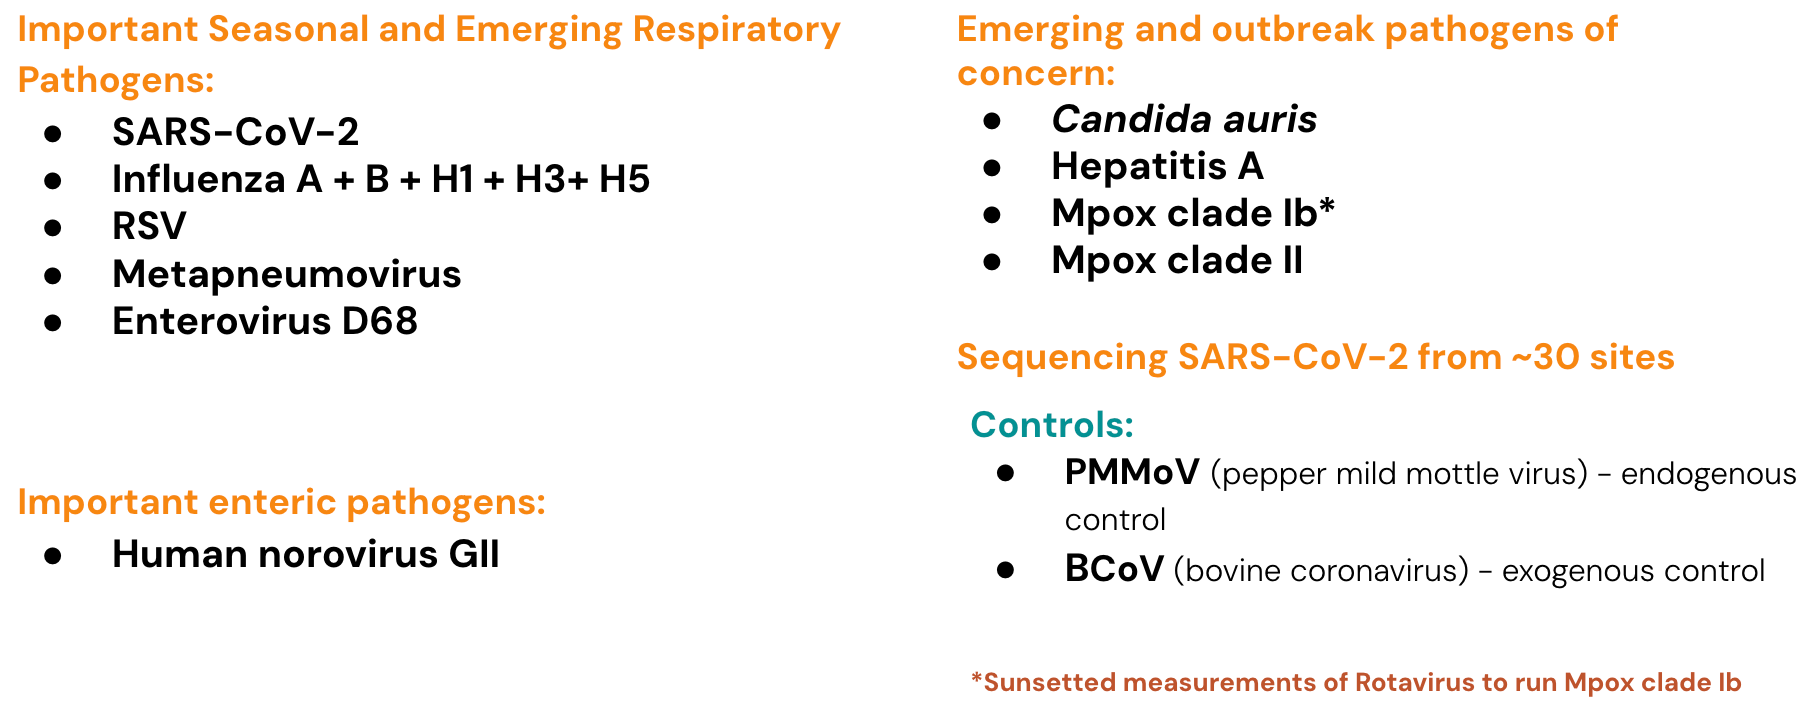
Infectious Disease Target Review
Currently monitoring a suite of Respiratory, Gastrointestinal and Outbreak Pathogens of Concern
The methods for our assays are in the public domain and links for these are provided at the end of the newsletter.
Program Publications
Recent publications, factsheets, FAQs and more!
WastewaterSCAN Published Body of Work document:
- We are excited to share a document that provides an overview of the program’s peer-reviewed scientific literature, organized by topics and themes. Click here to access the WastewaterSCAN published body of work.
WastewaterSCAN FAQs:
- Frequently Asked Questions on Measurements of Candida auris (C. auris) in Wastewater Solids
- Frequently Asked Questions on WWSCAN Measurements of H5 Marker in Wastewater Solids
- Frequently Asked Questions on WWSCAN Measurements of Hepatitis A Virus (HAV) RNA in Wastewater Solids
- Frequently Asked Questions on WWSCAN Measurements of Mpox clade Ib in Wastewater Solids
WastewaterSCAN Factsheets and Guidance Documents can be found here.
COVID-19
SARS-CoV-2 concentration in wastewater and sequencing for variants
SARS-CoV-2 N gene RNA median concentration across all sites in past 3 weeks was 30,569 copies/gram, down ~33% from March 2025. Below is the population weighted average SARS-CoV-2 N gene concentrations (normalized by PMMoV) is shown in black from all participating WWSCAN sites across the country over the last 365 days.
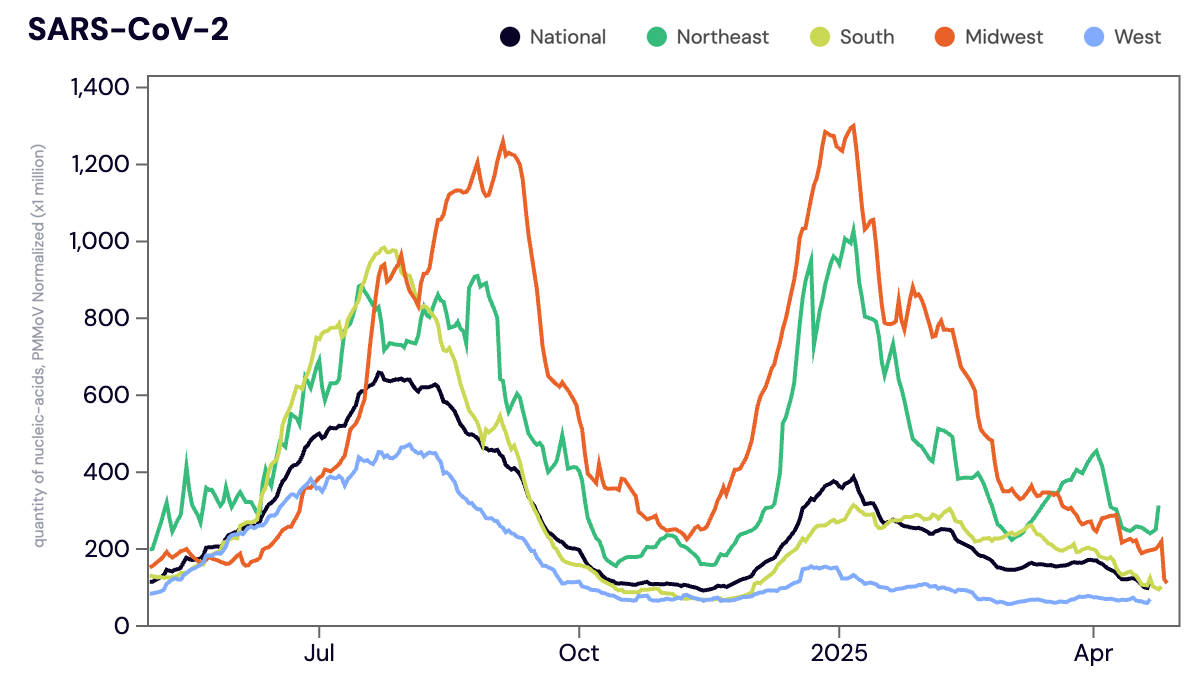
Midwest states: IA, IL, IN, KS, MI, MN, NE, OH, SD, WI. Northeast states: CT, MA, ME, NH, NJ, NY, PA, VT. Southern states: AL, AR, DE, FL, GA, KY, LA, MD, MS, NC, TN, TX, VA, and WV. Western States: AK, CA, CO, HI, ID, NV, UT, WA.
Nationally, SARS-CoV-2 is in the 'MEDIUM' category with aggregated measurements showing medium concentrations and no trend over the last 3 weeks.
Below are the current SARS-CoV-2 wastewater categories for all WWSCAN sites (recall the category is determined by both the trend and the level):
- 82 are in the LOW Wastewater Category
- 41 are in the MEDIUM Wastewater Category
- 11 are in the HIGH Wastewater Category
- 13 do not have enough data to calculate
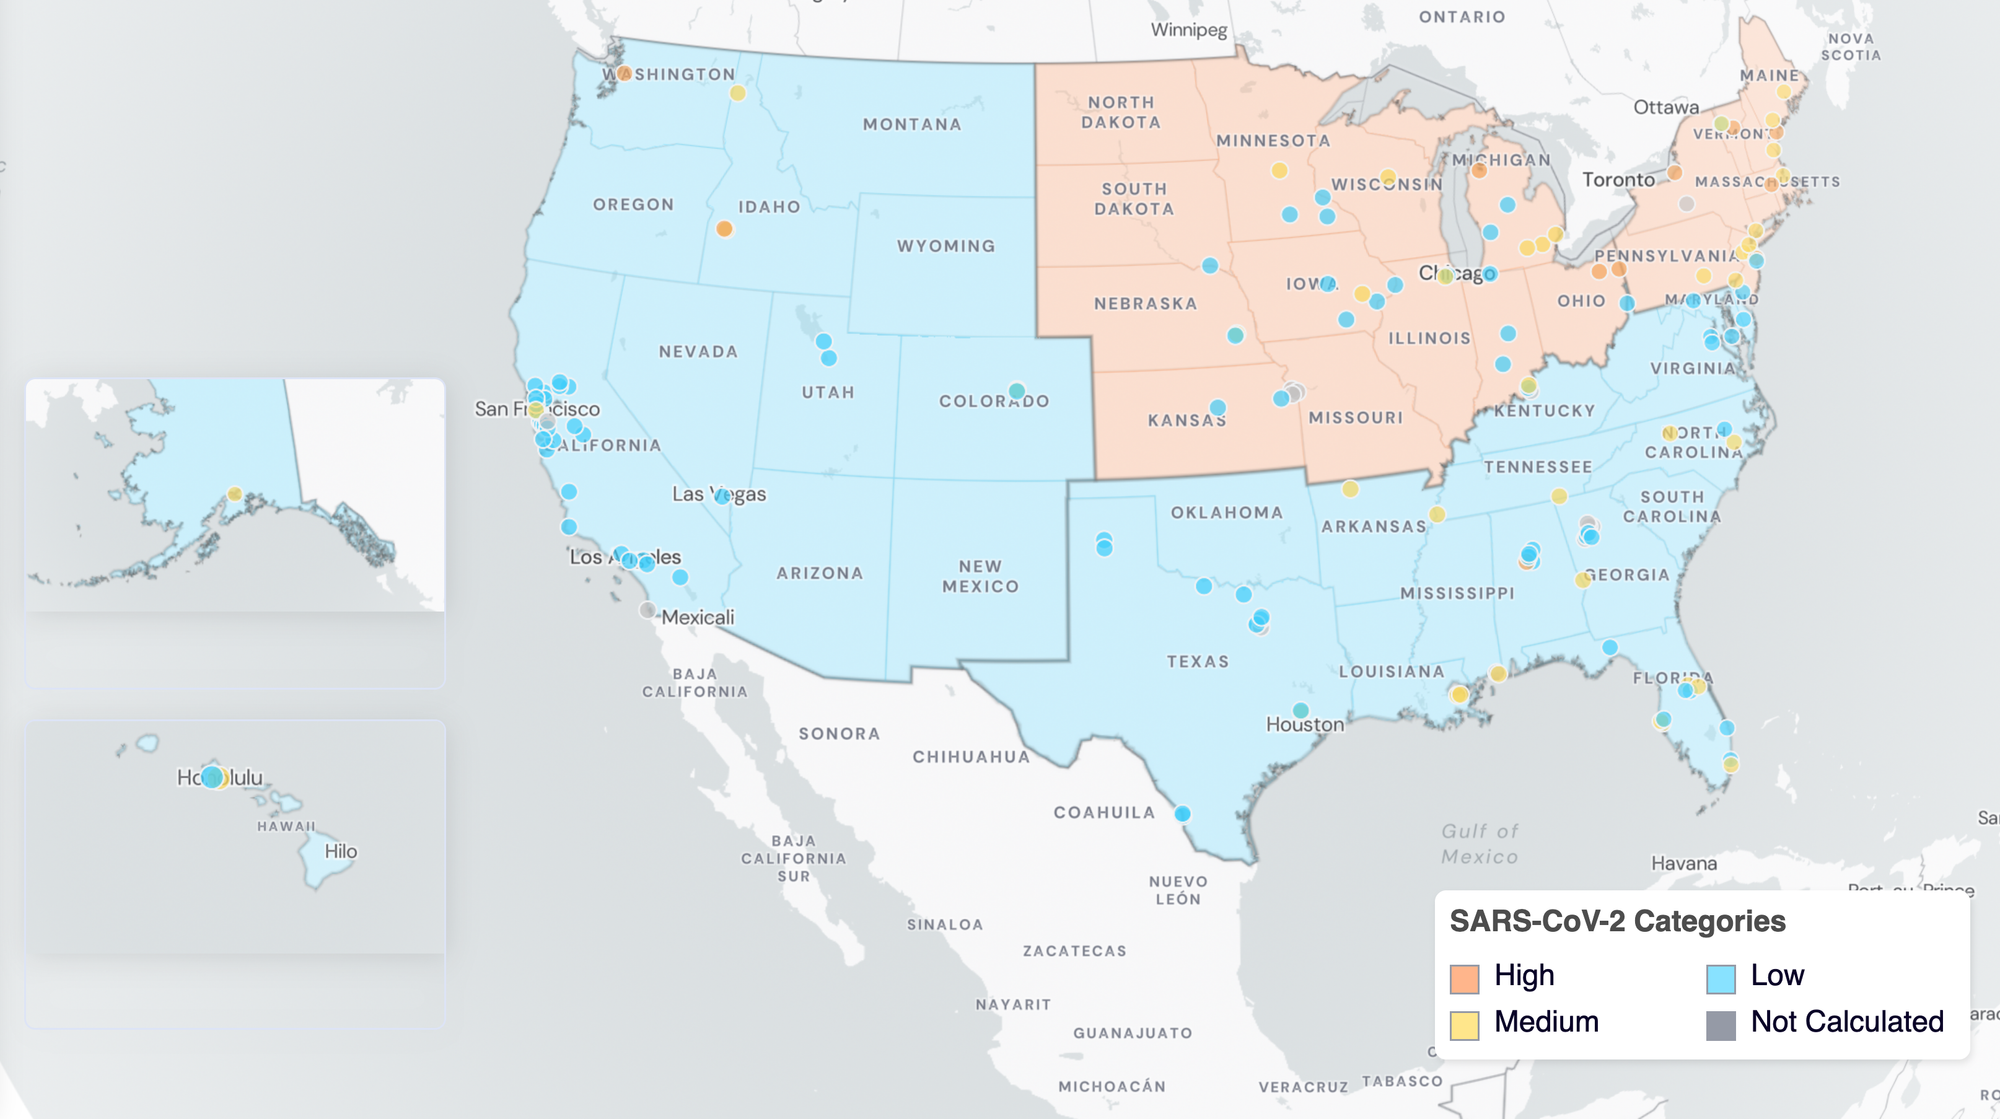
SARS-COV-2 Wastewater Categories. This map includes sample collection data through April 30, 2025. Each dot represents a single site and the four US Census regions are outlined in gray. Midwest Region includes: IA, IL, IN, KS, MI, MN, NE, OH, SD, WI. Northeast Region includes: CT, MA, ME, NH, NJ, NY, PA, VT. Southern Region includes: AL, AR, DE, FL, GA, KY, LA, MD, MS, NC, TN, TX, VA, and WV. Western Region includes: AK, CA, CO, HI, ID, NV, UT, WA.
Sequencing of SARS-CoV-2 from wastewater is available for a select number of individual sites. The sequencing protocol is available on protocol.io. The plots below show the relative proportions of different variants inferred from sequencing the entire genome of SARS-CoV-2. Results are based on sequencing of 2 samples per week, combined to provide a weekly value.
Sequencing data is also available in aggregate across all sites in WastewaterSCAN with sequencing data. That plot is shown below and also suggests that KP.1 (shown in lime green) is the most abundant variant across all sites at 77.9%, followed by KP.3 (shown in blue) at 10.2%.
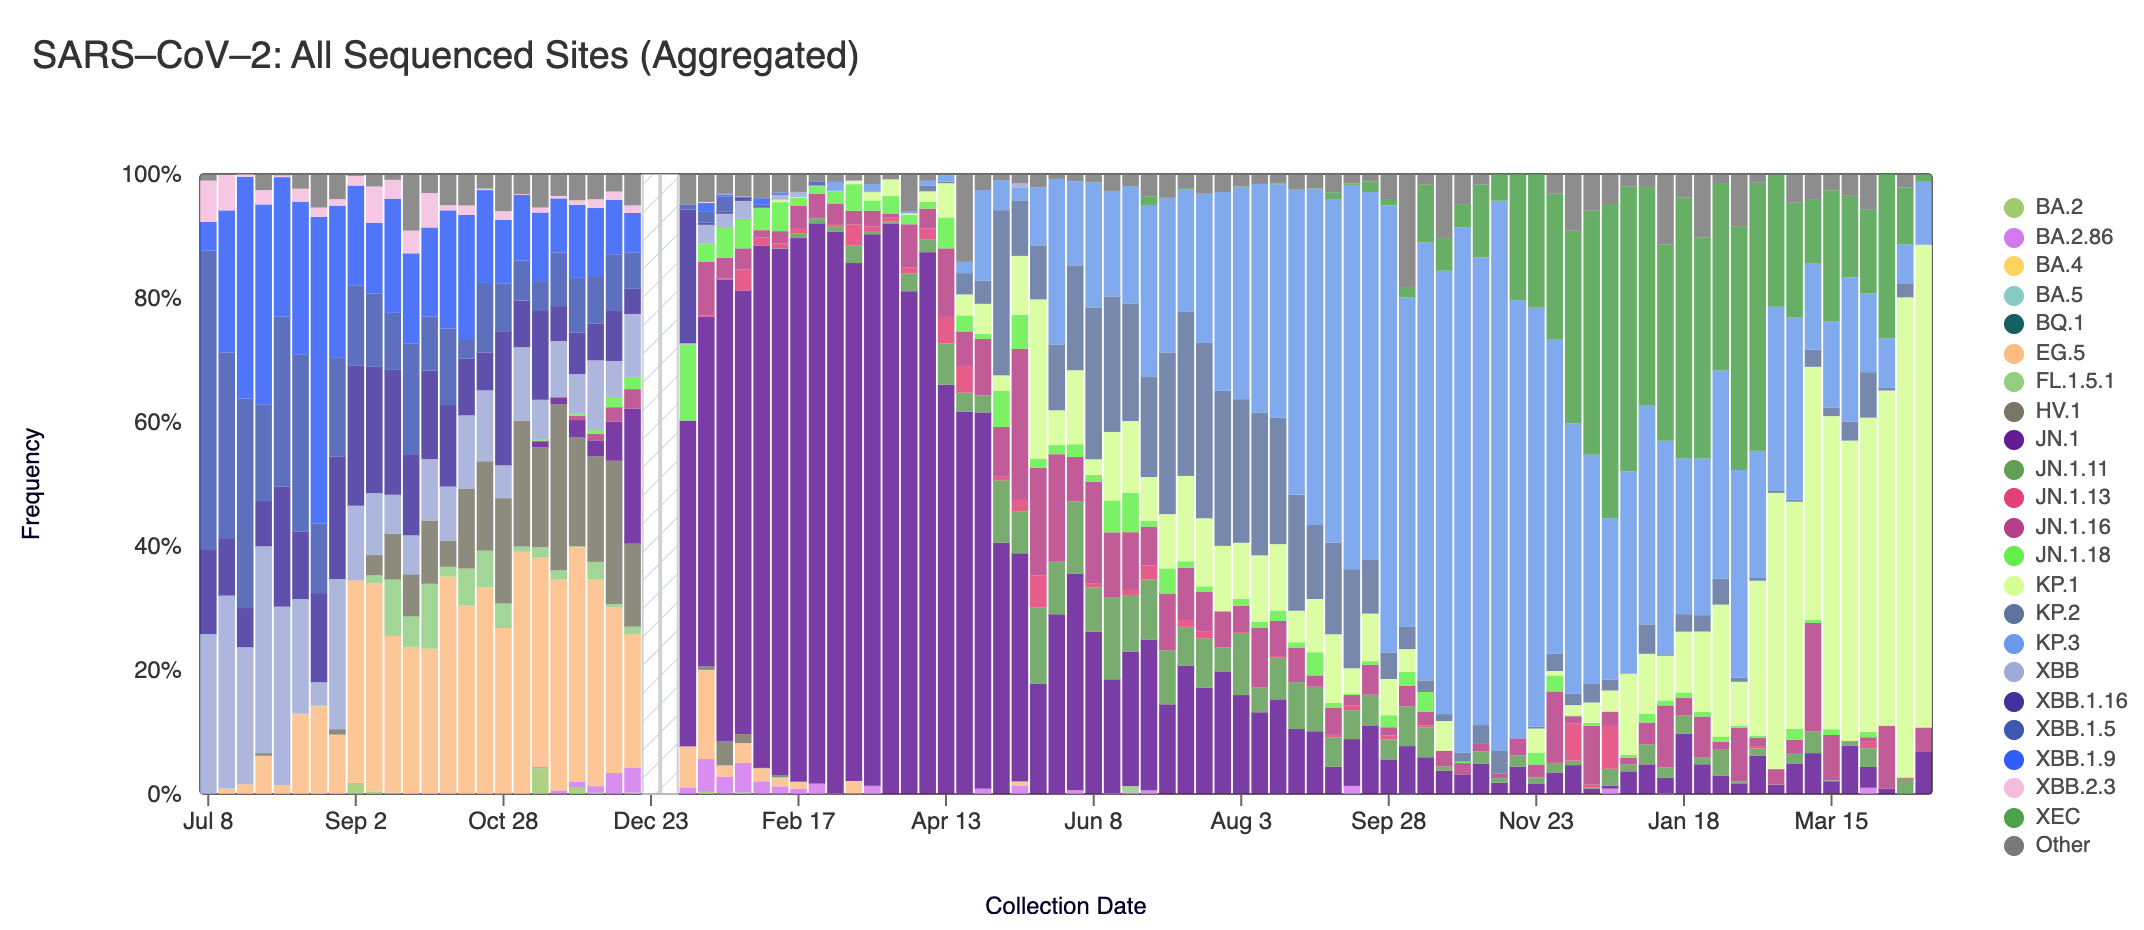
SARS-CoV-2 sequencing data through the week of April 12, 2025
Other Respiratory Pathogens
Influenza A & B, Respiratory Syncytial Virus, Human metapneumovirus, Human Parainfluenza & EV-D68
Influenza A (IAV) RNA was detected in ~45% of samples in past 3 weeks. IAV RNA median concentration across all sites in the past 3 weeks was below the limit of detection. Below is the population weighted average IAV concentrations (normalized by PMMoV) is shown in black from all participating WWSCAN sites across the country over the last 365 days.
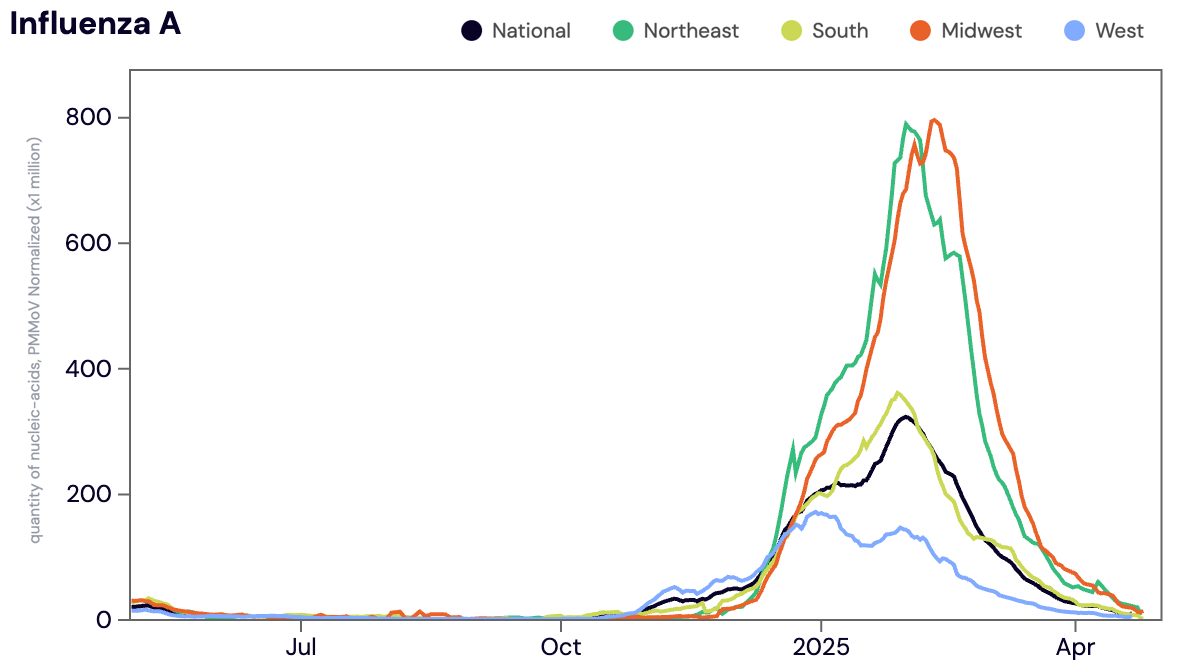
Midwest states: IA, IL, IN, KS, MI, MN, NE, OH, SD, WI. Northeast states: CT, MA, ME, NH, NJ, NY, PA, VT. Southern states: AL, AR, DE, FL, GA, KY, LA, MD, MS, NC, TN, TX, VA, and WV. Western States: AK, CA, CO, HI, ID, NV, UT, WA.
Nationally, Influenza A is in the 'LOW' Wastewater Category with >50% of sites now in seasonal offset of IAV in wastewater.
Below are the current Influenza A wastewater categories for all WWSCAN sites (recall the category is determined by both the trend and the level when in seasonal onset):
- 99 are in the LOW Wastewater Category
- 24 are in the MEDIUM Wastewater Category
- 11 are in the HIGH Wastewater Category
- 13 do not have enough data to calculate
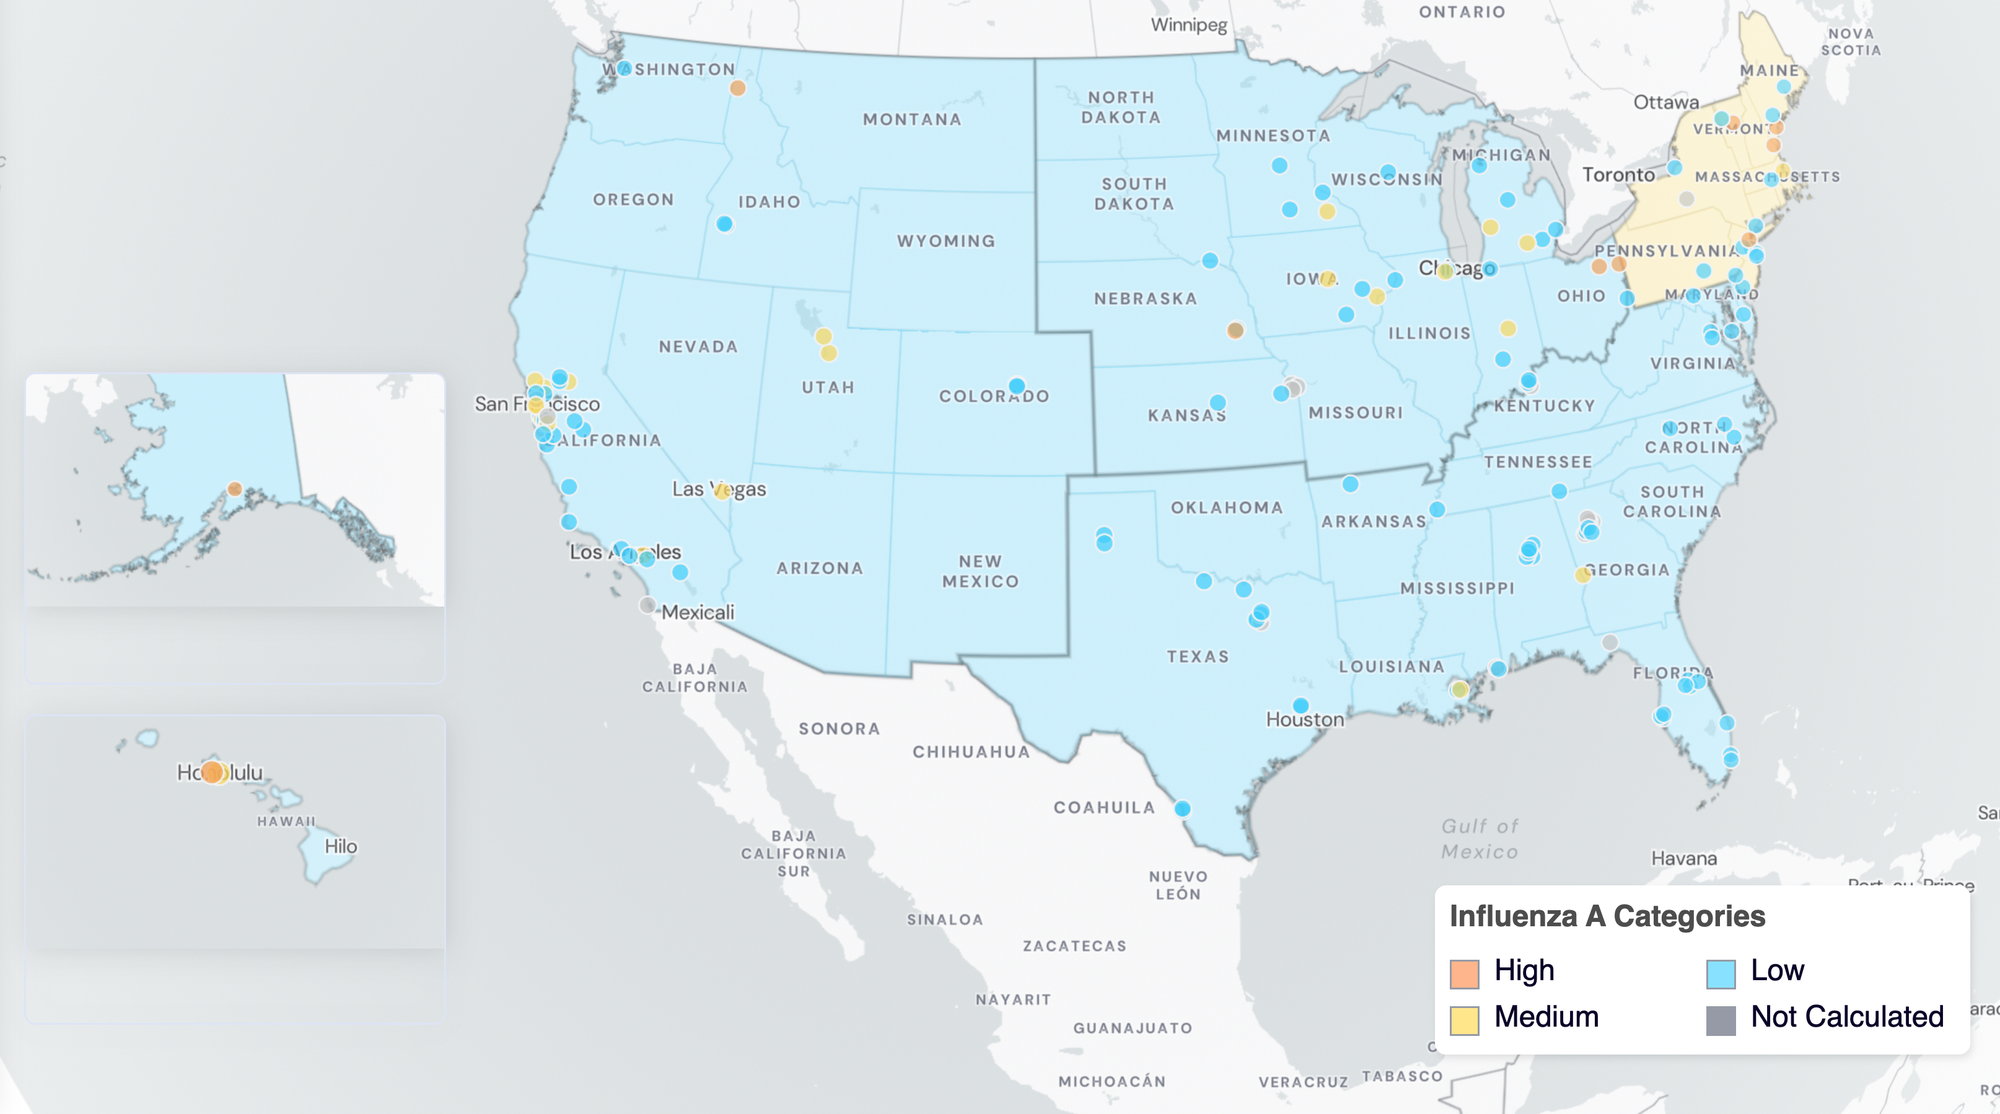
Influenza A Wastewater Categories. This map includes sample collection data through April 30, 2025. Each dot represents a single site and the four US Census regions are outlined in gray. Midwest Region includes: IA, IL, IN, KS, MI, MN, NE, OH, SD, WI. Northeast Region includes: CT, MA, ME, NH, NJ, NY, PA, VT. Southern Region includes: AL, AR, DE, FL, GA, KY, LA, MD, MS, NC, TN, TX, VA, and WV. Western Region includes: AK, CA, CO, HI, ID, NV, UT, WA.
H1 Marker in Influenza A (IAV) The H1 marker in influenza A has been detected in ~27% of samples over the last 3 weeks. The H1 median concentration across all sites in the past 3 weeks was below the limit of detection. You can find a heat map of positive detections here.
H3 Marker in Influenza A (IAV) In the last 3 weeks, the H3 marker in influenza A was detected in ~7% of samples. You can find a heat map of positive detections here.
H5 Marker in Influenza A (IAV) As of April 30, 2025, 77 WastewaterSCAN sites across 26 states (AK, AR, CA, CO, CT, DE, FL, IA, ID, IL, KS, KY, MA, ME, MD, MI, MN, NE, NH, NJ, NV, SD, TN, TX, UT, VT) have seen positive detections for the H5 marker in influenza A. Since prospective monitoring began, 1,003/20,982samples have tested positive (~4.5% detection rate). In April 2025, positive H5 marker detections have been in CA, IA, MD, MN, and NJ. You can find a heat map of positive detections here.
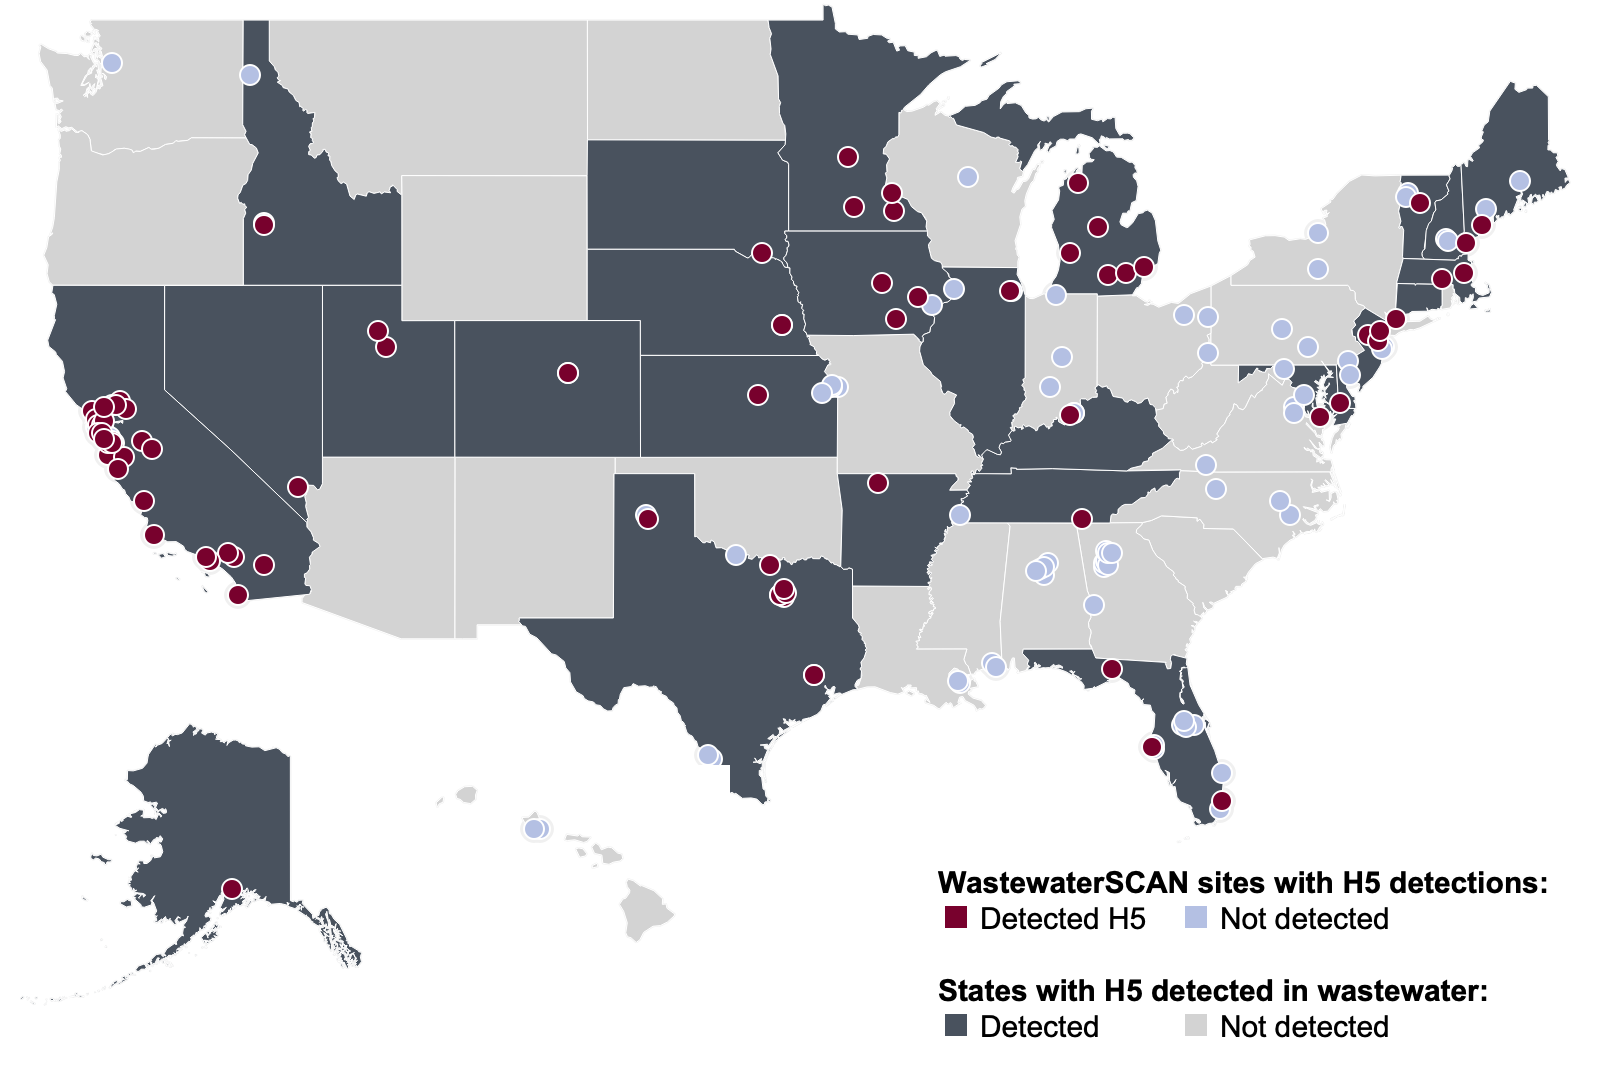
Map showing the location of the 77 WastewaterSCAN sites that have had positive detection(s) of the H5 marker in Influenza A as of April 30, 2025
Influenza B (IBV) RNA was detected in ~61% of samples in past 3 weeks. IBV RNA median concentration across all sites in the last 3 weeks was 3,988 copies per gram, up ~30% from March 2025. Below the population-weighted average IBV RNA concentrations (normalized by PMMoV) is shown in black from all participating WWSCAN sites across the country over the last 365 days.
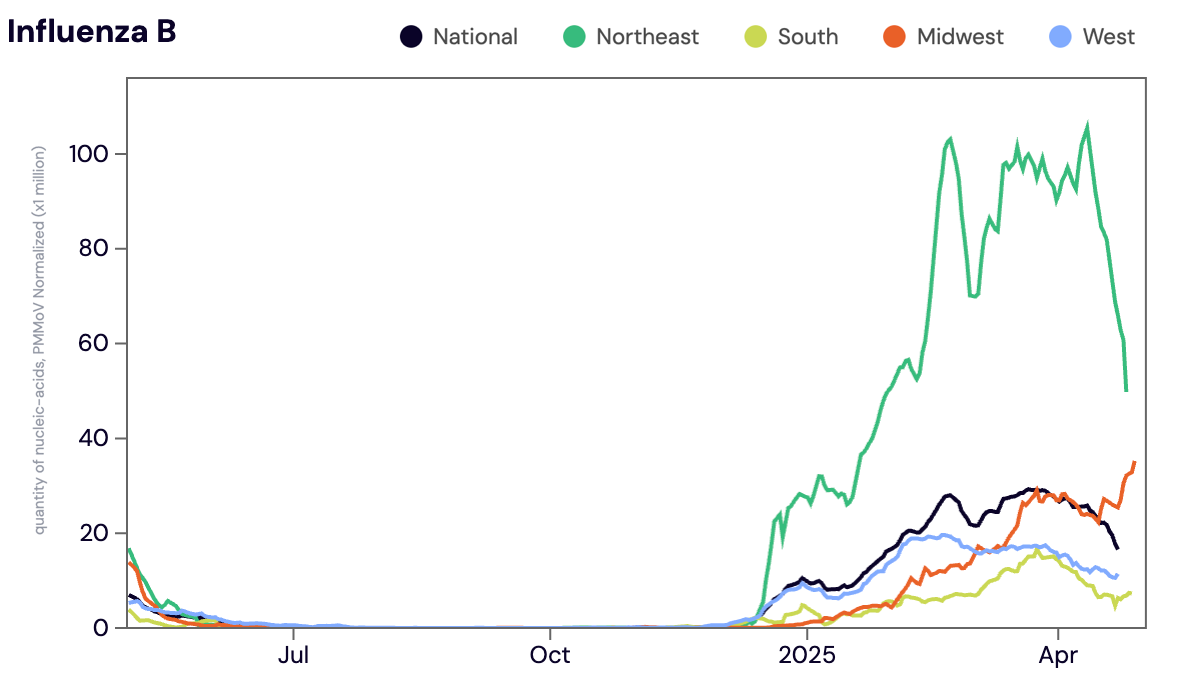
Midwest states: IA, IL, IN, KS, MI, MN, NE, OH, SD, WI. Northeast states: CT, MA, ME, NH, NJ, NY, PA, VT. Southern states: AL, AR, DE, FL, GA, KY, LA, MD, MS, NC, TN, TX, VA, and WV. Western States: AK, CA, CO, HI, ID, NV, UT, WA.
Nationally, Influenza B is in the 'HIGH' Wastewater Category with >50% of sites showing onset of IBV in wastewater, and with aggregated measurements showing high concentrations and a downward trend over the last 3 weeks.
Below are the current Influenza B wastewater categories for all WWSCAN sites (recall the category is determined by both the trend and the level when in seasonal onset):
- 71 are in the LOW Wastewater Category
- 0 are in the MEDIUM Wastewater Category
- 63 are in the HIGH Wastewater Category
- 13 do not have enough data to calculate
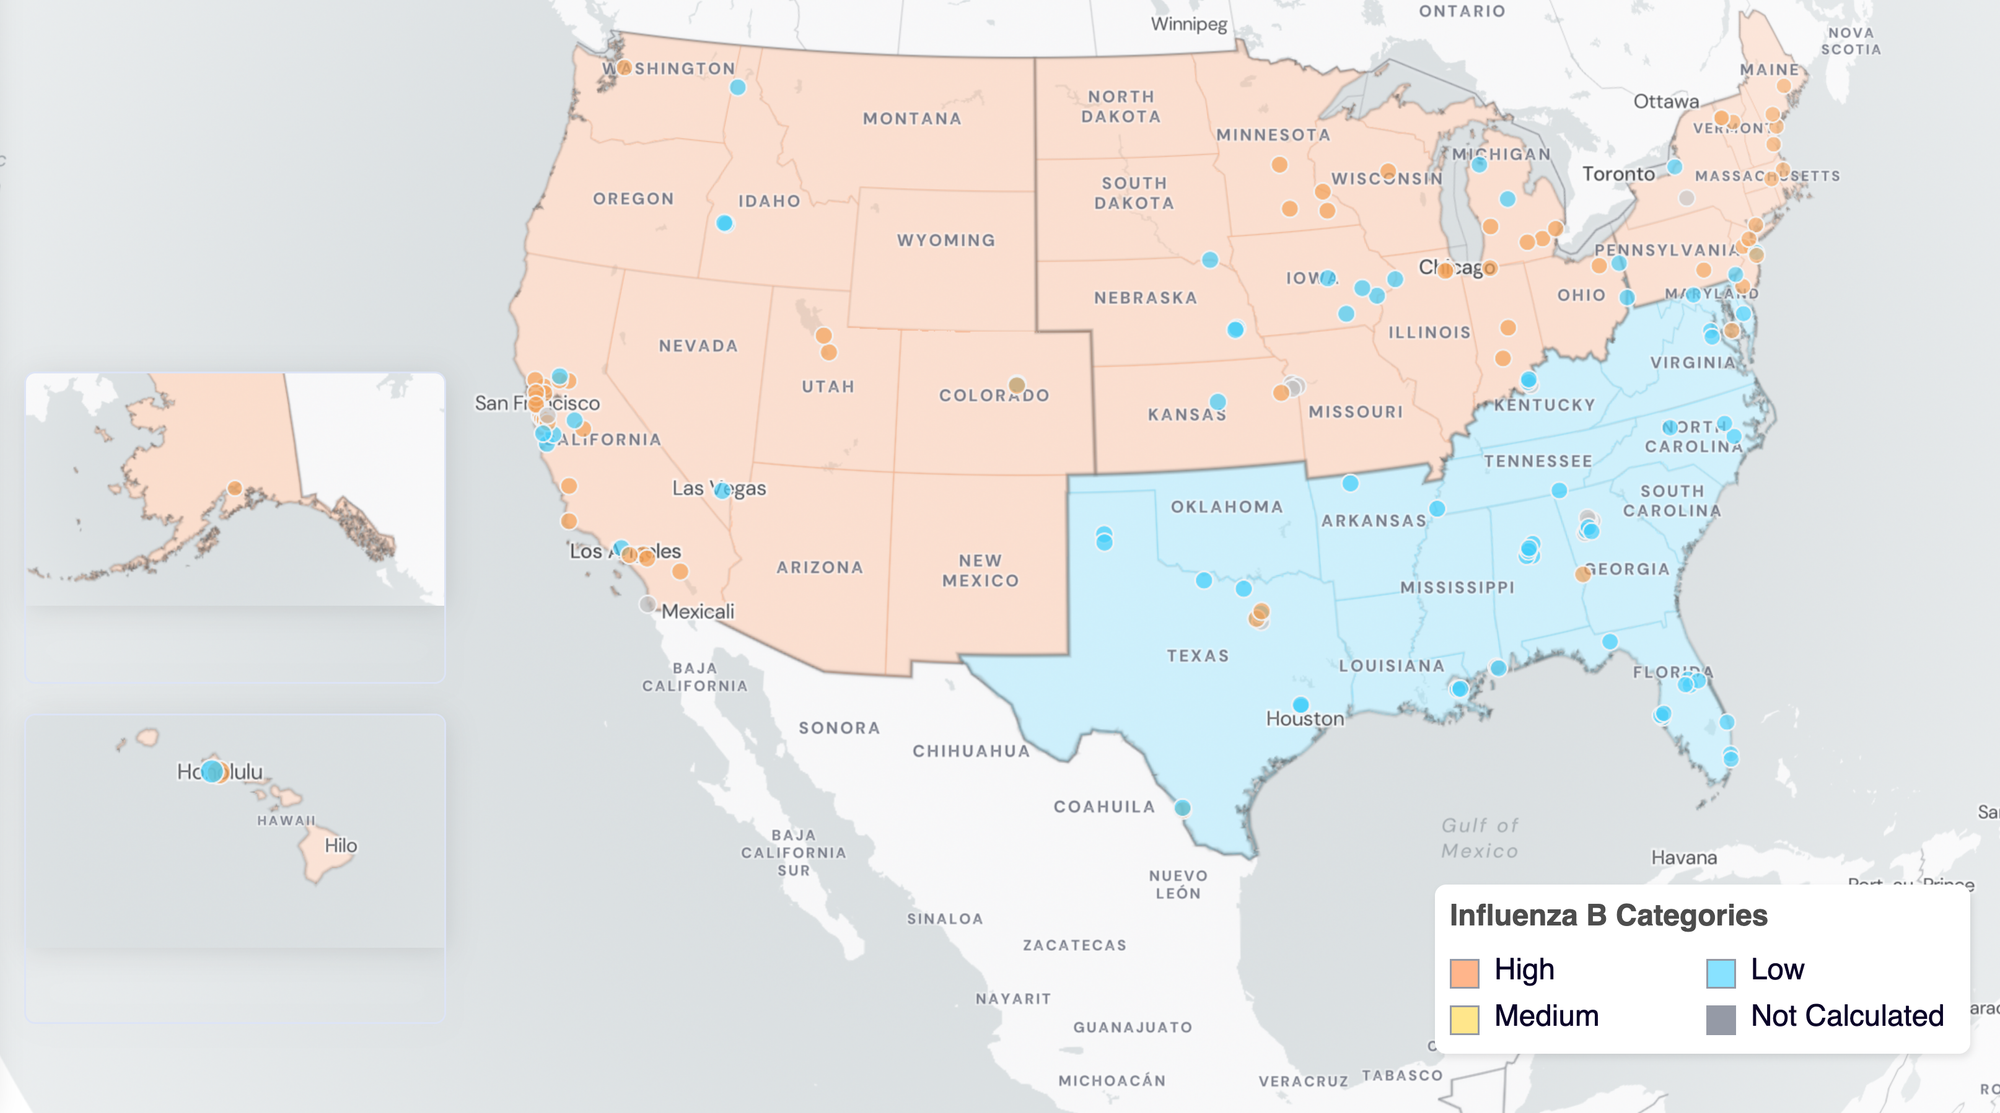
IBV Wastewater Categories. This map includes sample collection data through April 30, 2025. Each dot represents a single site and the four US Census regions are outlined in gray. Midwest Region includes: IA, IL, IN, KS, MI, MN, NE, OH, SD, WI. Northeast Region includes: CT, MA, ME, NH, NJ, NY, PA, VT. Southern Region includes: AL, AR, DE, FL, GA, KY, LA, MD, MS, NC, TN, TX, VA, and WV. Western Region includes: AK, CA, CO, HI, ID, NV, UT, WA.
Respiratory syncytial virus (RSV) RNA was detected in ~47% of samples in past 3 weeks. RSV RNA median concentration across all sites in the last 3 weeks was below the limit of detection. Below the population-weighted average RSV RNA concentrations (normalized by PMMoV) is shown in black from all participating WWSCAN sites across the country over the last 365 days.
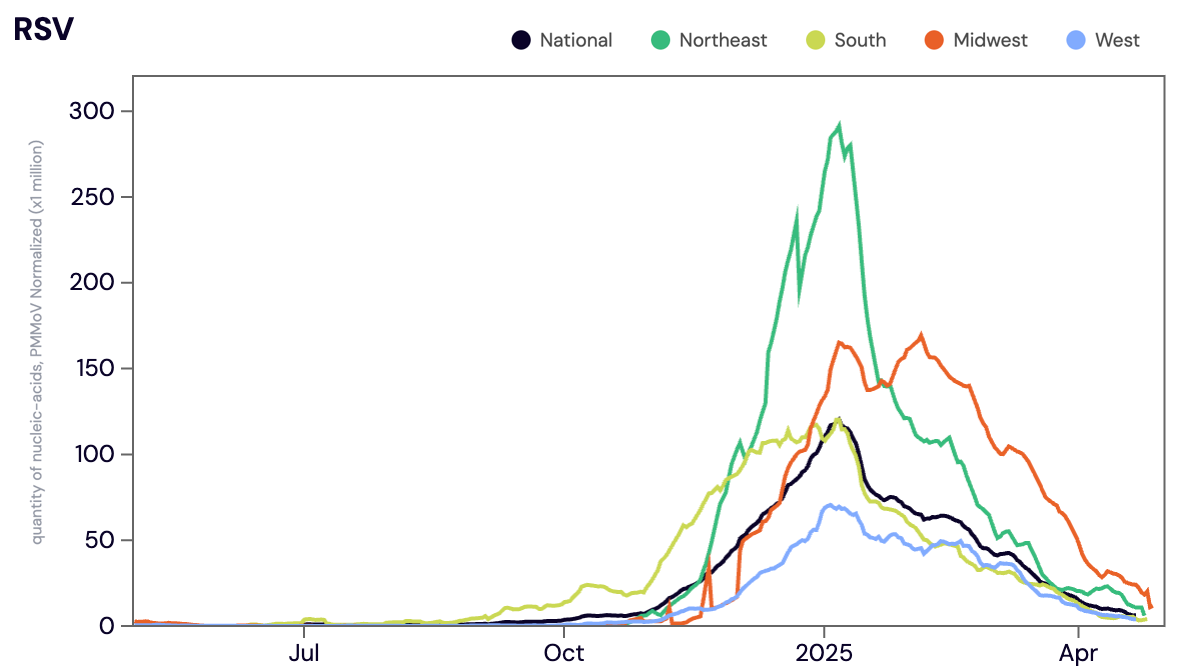
Midwest states: IA, IL, IN, KS, MI, MN, NE, OH, SD, WI. Northeast states: CT, MA, ME, NH, NJ, NY, PA, VT. Southern states: AL, AR, DE, FL, GA, KY, LA, MD, MS, NC, TN, TX, VA, and WV. Western States: AK, CA, CO, HI, ID, NV, UT, WA.
Nationally, RSV is in the 'LOW' Wastewater Category with >50% of sites now in seasonal offset of RSV in wastewater.
Below are the current RSV wastewater categories for all WWSCAN sites (recall the category is determined by both the trend and the level when in seasonal onset):
- 103 are in the LOW Wastewater Category
- 16 are in the MEDIUM Wastewater Category
- 15 are in the HIGH Wastewater Category
- 13 do not have enough data to calculate
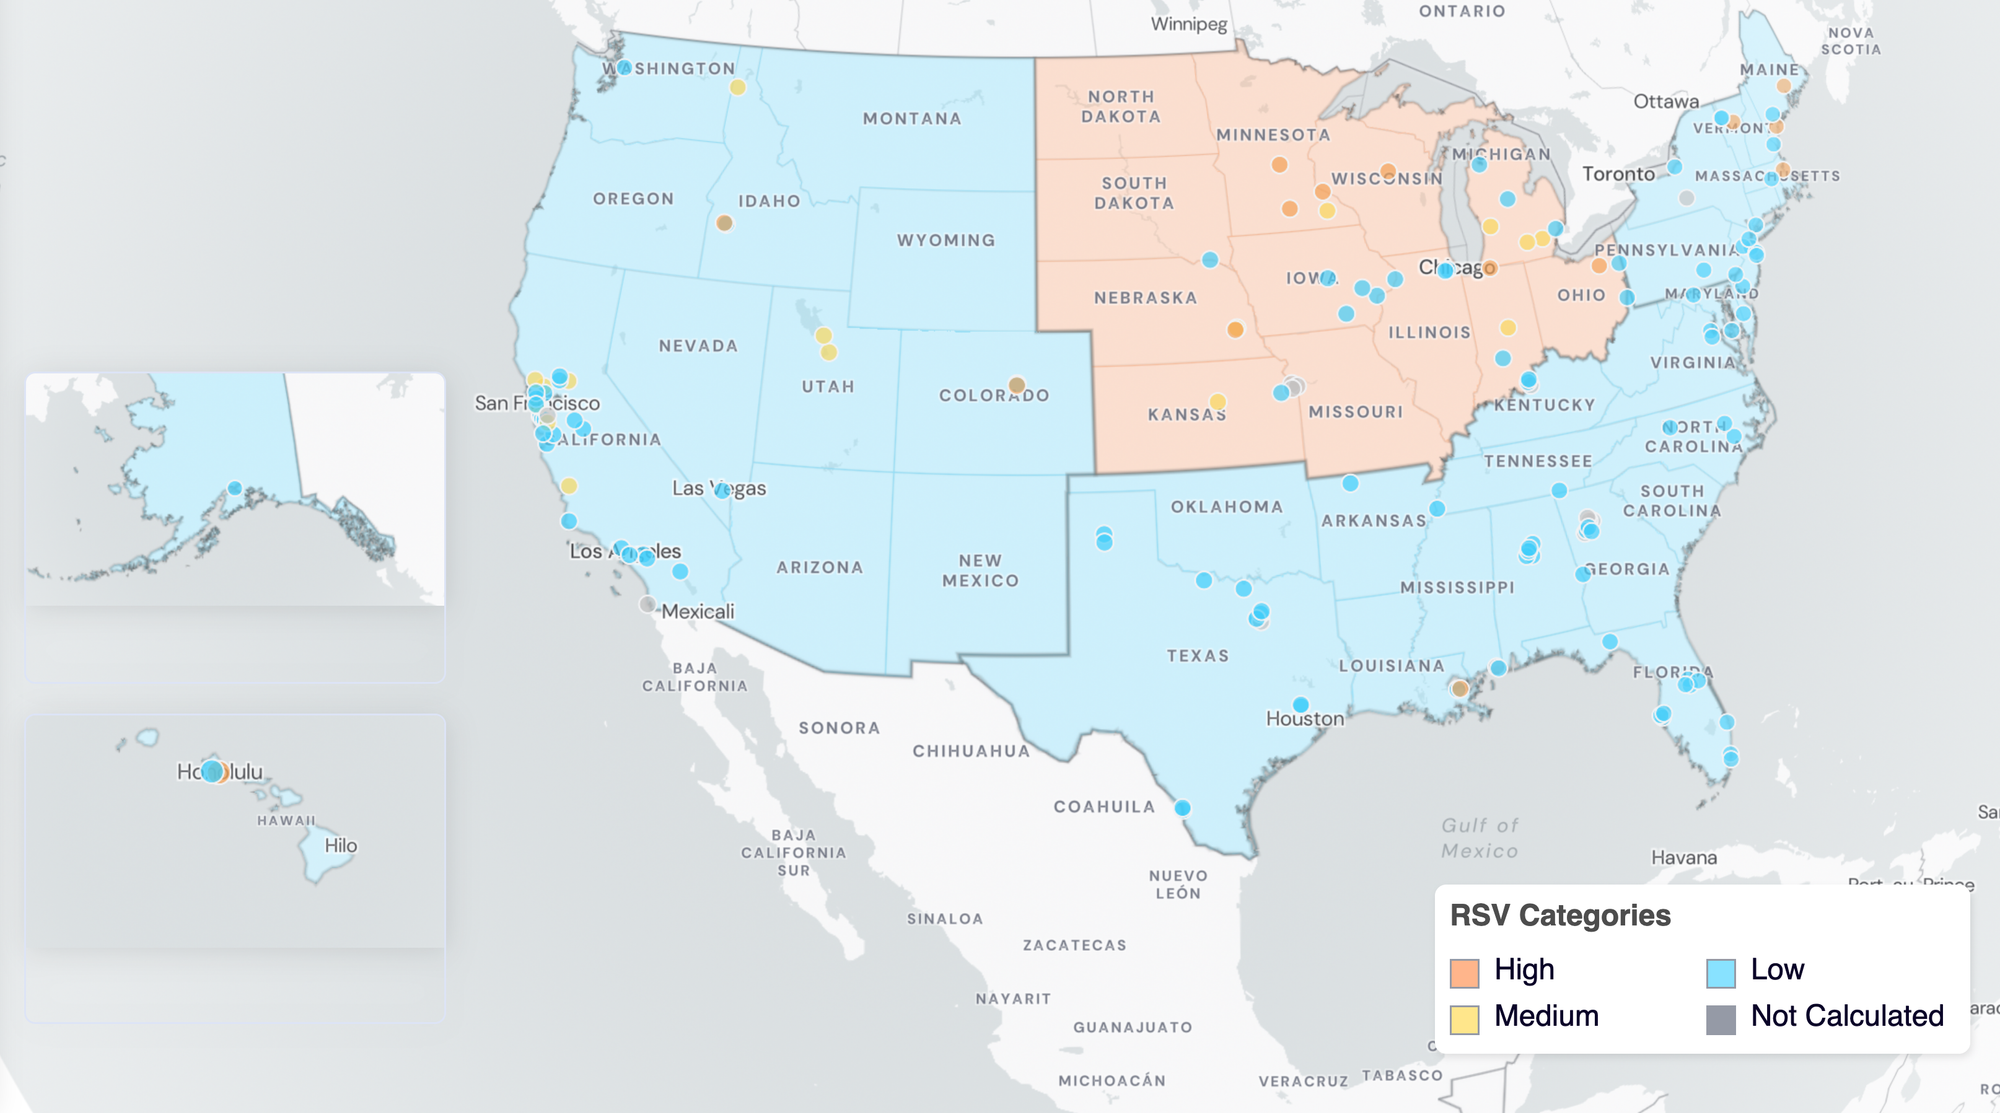
RSV Wastewater Categories. This map includes sample collection data through April 30, 2025. Each dot represents a single site and the four US Census regions are outlined in gray. Midwest Region includes: IA, IL, IN, KS, MI, MN, NE, OH, SD, WI. Northeast Region includes: CT, MA, ME, NH, NJ, NY, PA, VT. Southern Region includes: AL, AR, DE, FL, GA, KY, LA, MD, MS, NC, TN, TX, VA, and WV. Western Region includes: AK, CA, CO, HI, ID, NV, UT, WA.
HMPV (human metapneumovirus) RNA was detected in ~65% of samples in the last 3 weeks. The median HMPV RNA concentrations across all sites in the last 3 weeks was 5,566 copies per gram, up ~22% from March 2025. Below is the population weighted average HMPV RNA concentrations (normalized by PMMoV) shown in black from all participating WWSCAN sites across the country over the last 365 days.
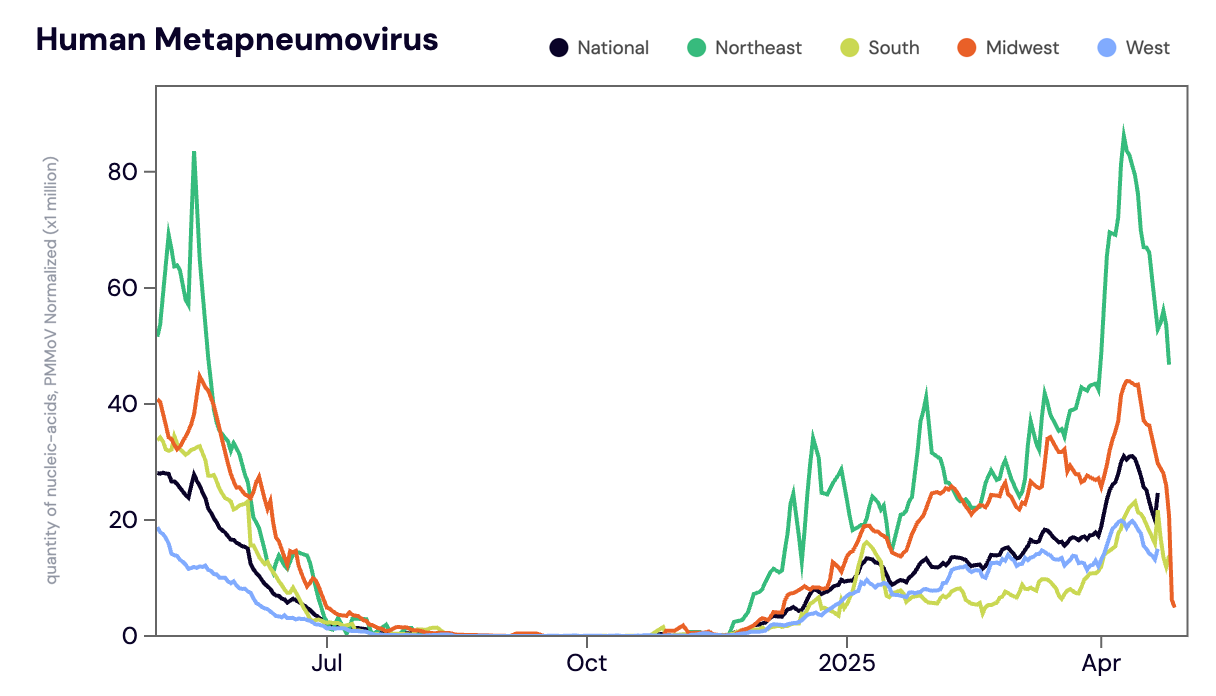
Midwest states: IA, IL, IN, KS, MI, MN, NE, OH, SD, WI. Northeast states: CT, MA, ME, NH, NJ, NY, PA, VT. Southern states: AL, AR, DE, FL, GA, KY, LA, MD, MS, NC, TN, TX, VA, and WV. Western States: AK, CA, CO, HI, ID, NV, UT, WA.
Nationally, HMPV is in the 'LOW' Wastewater Category with <50% of sites showing onset of HMPV in wastewater.
Below are the current HMPV wastewater categories for all WWSCAN sites (recall the category is determined by both the trend and the level):
- 77 are in the LOW Wastewater Category
- 0 are in the MEDIUM Wastewater Category
- 57 are in the HIGH Wastewater Category
- 13 do not have enough data to calculate
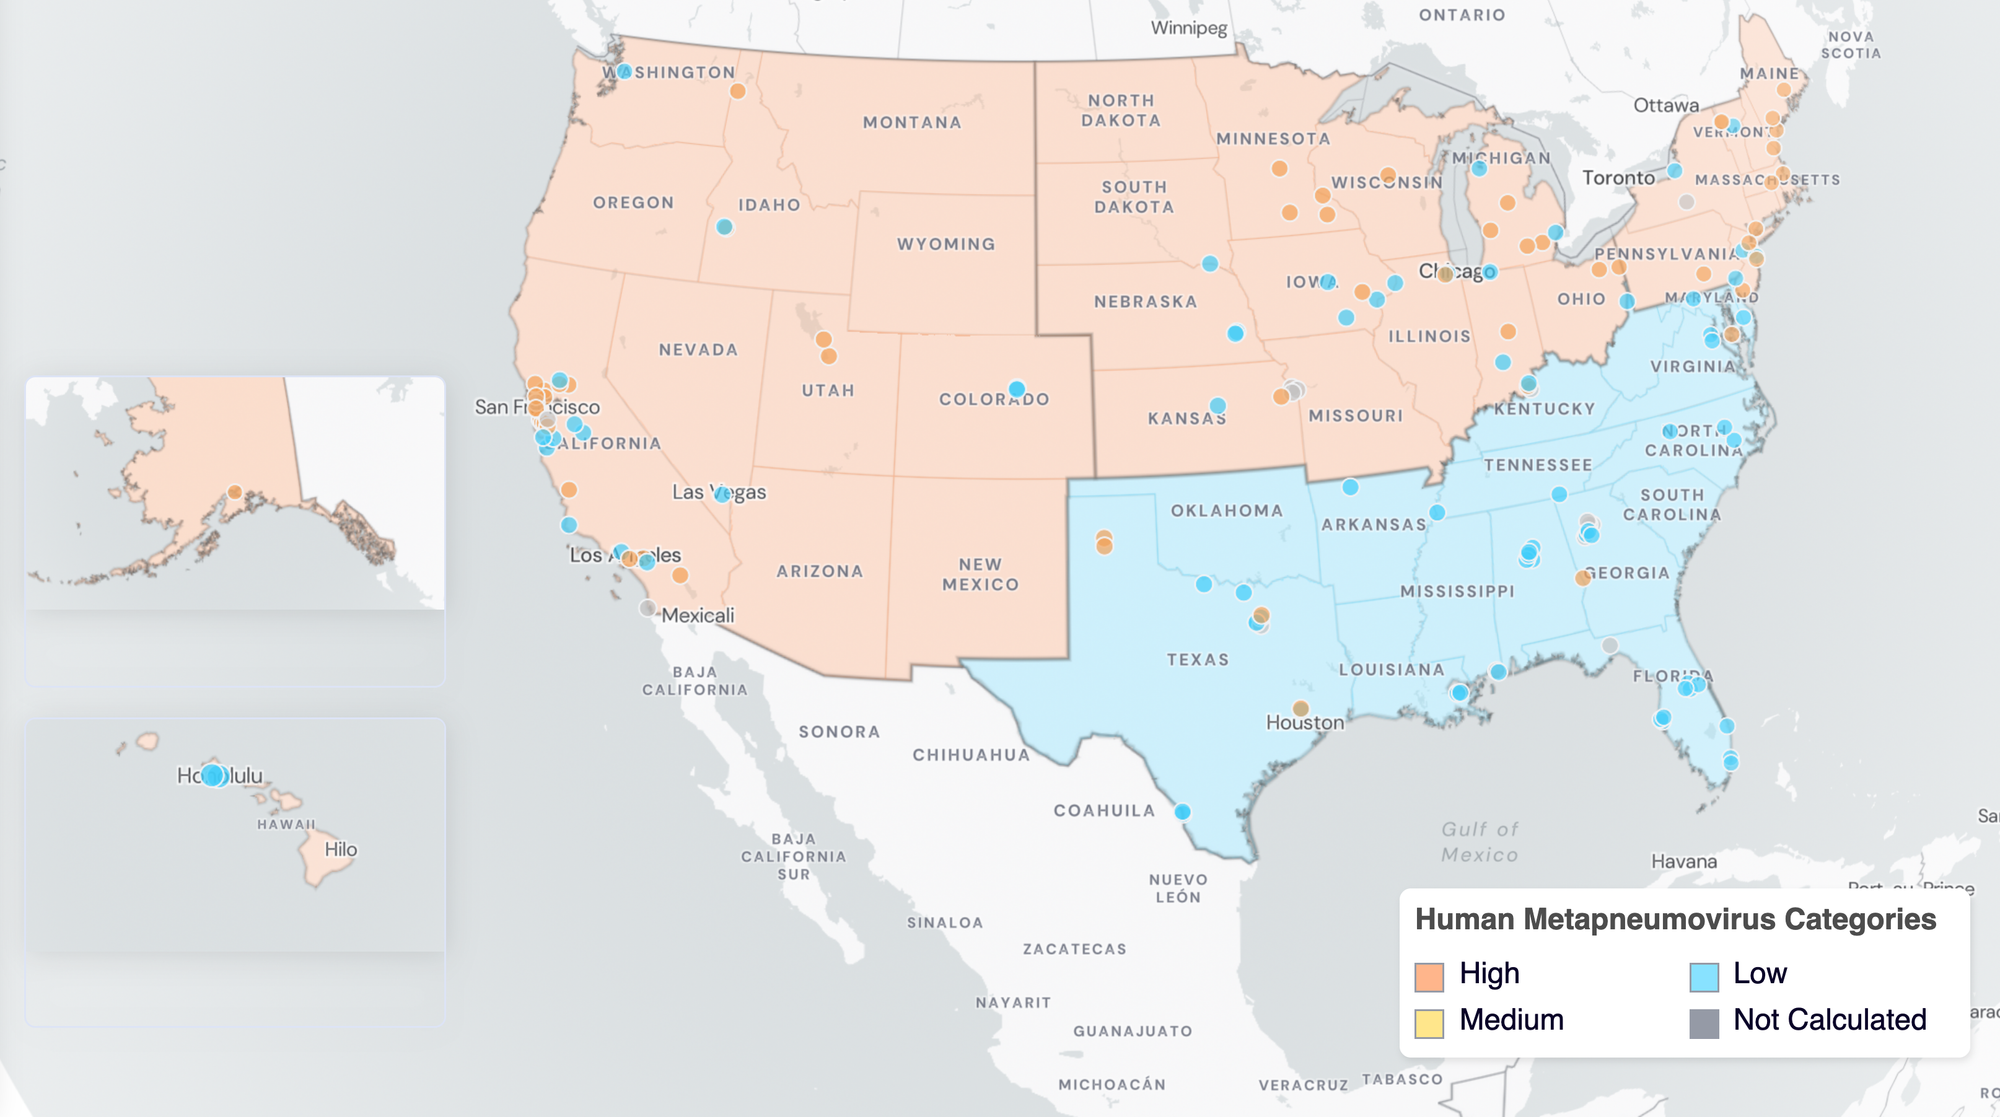
HMPV Wastewater Categories. This map includes sample collection data through April 30, 2025. Each dot represents a single site and the four US Census regions are outlined in gray. Midwest Region includes: IA, IL, IN, KS, MI, MN, NE, OH, SD, WI. Northeast Region includes: CT, MA, ME, NH, NJ, NY, PA, VT. Southern Region includes: AL, AR, DE, FL, GA, KY, LA, MD, MS, NC, TN, TX, VA, and WV. Western Region includes: AK, CA, CO, HI, ID, NV, UT, WA.
Enterovirus D68 (EV-D68) RNA was detected in ~17% of samples collected in the last 3 weeks across WWSCAN sites (with most of the positive detections being in California). The median concentration across all sites was below the limit of detection in the last 3 weeks. For reference median concentration in March 2025 was also below the limit of detection. Below is the population-weighted average EV-D68 RNA(normalized by PMMoV) shown in black from all participating WWSCAN sites across the country over the last 365 days.
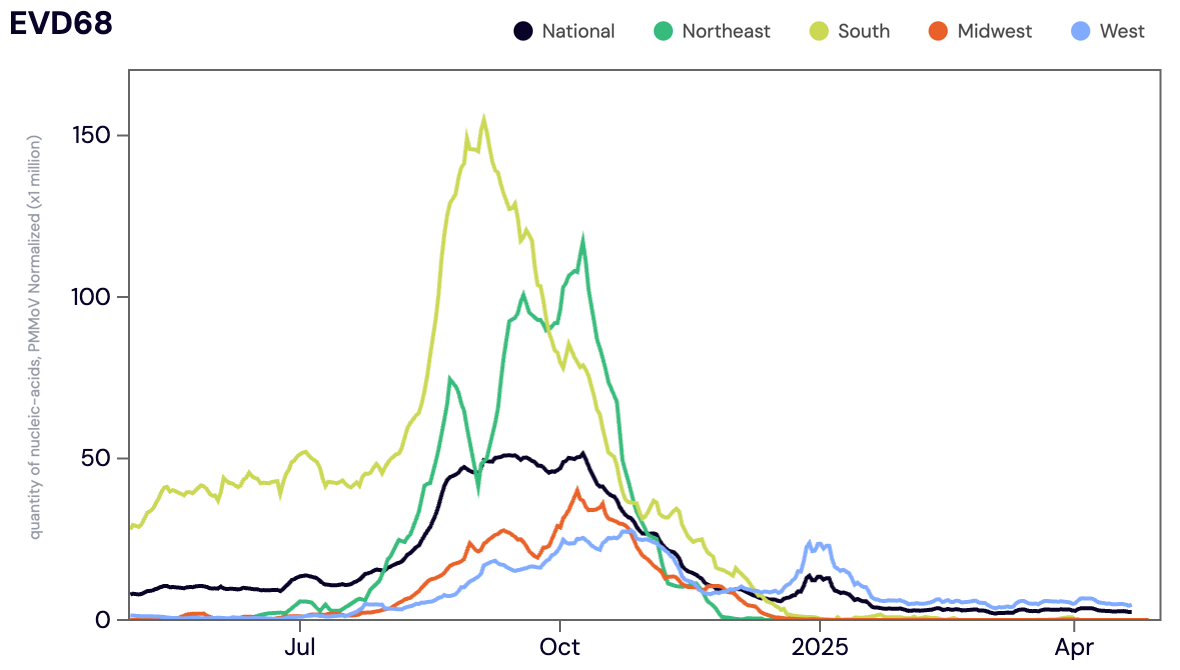
Midwest states: IA, IL, IN, KS, MI, MN, NE, OH, SD, WI. Northeast states: CT, MA, ME, NH, NJ, NY, PA, VT. Southern states: AL, AR, DE, FL, GA, KY, LA, MD, MS, NC, TN, TX, VA, and WV. Western States: AK, CA, CO, HI, ID, NV, UT, WA.
Nationally, EV-D68 is in the 'LOW' Wastewater Category with <50% sites showing onset of EV-D68 in wastewater.
Below are the current EV-D68 wastewater categories for all WWSCAN sites (recall the category is determined by both the trend and the level):
- 124 are in the LOW Wastewater Category
- 3 are in the MEDIUM Wastewater Category
- 7 are in the HIGH Wastewater Category
- 13 do not have enough data to calculate
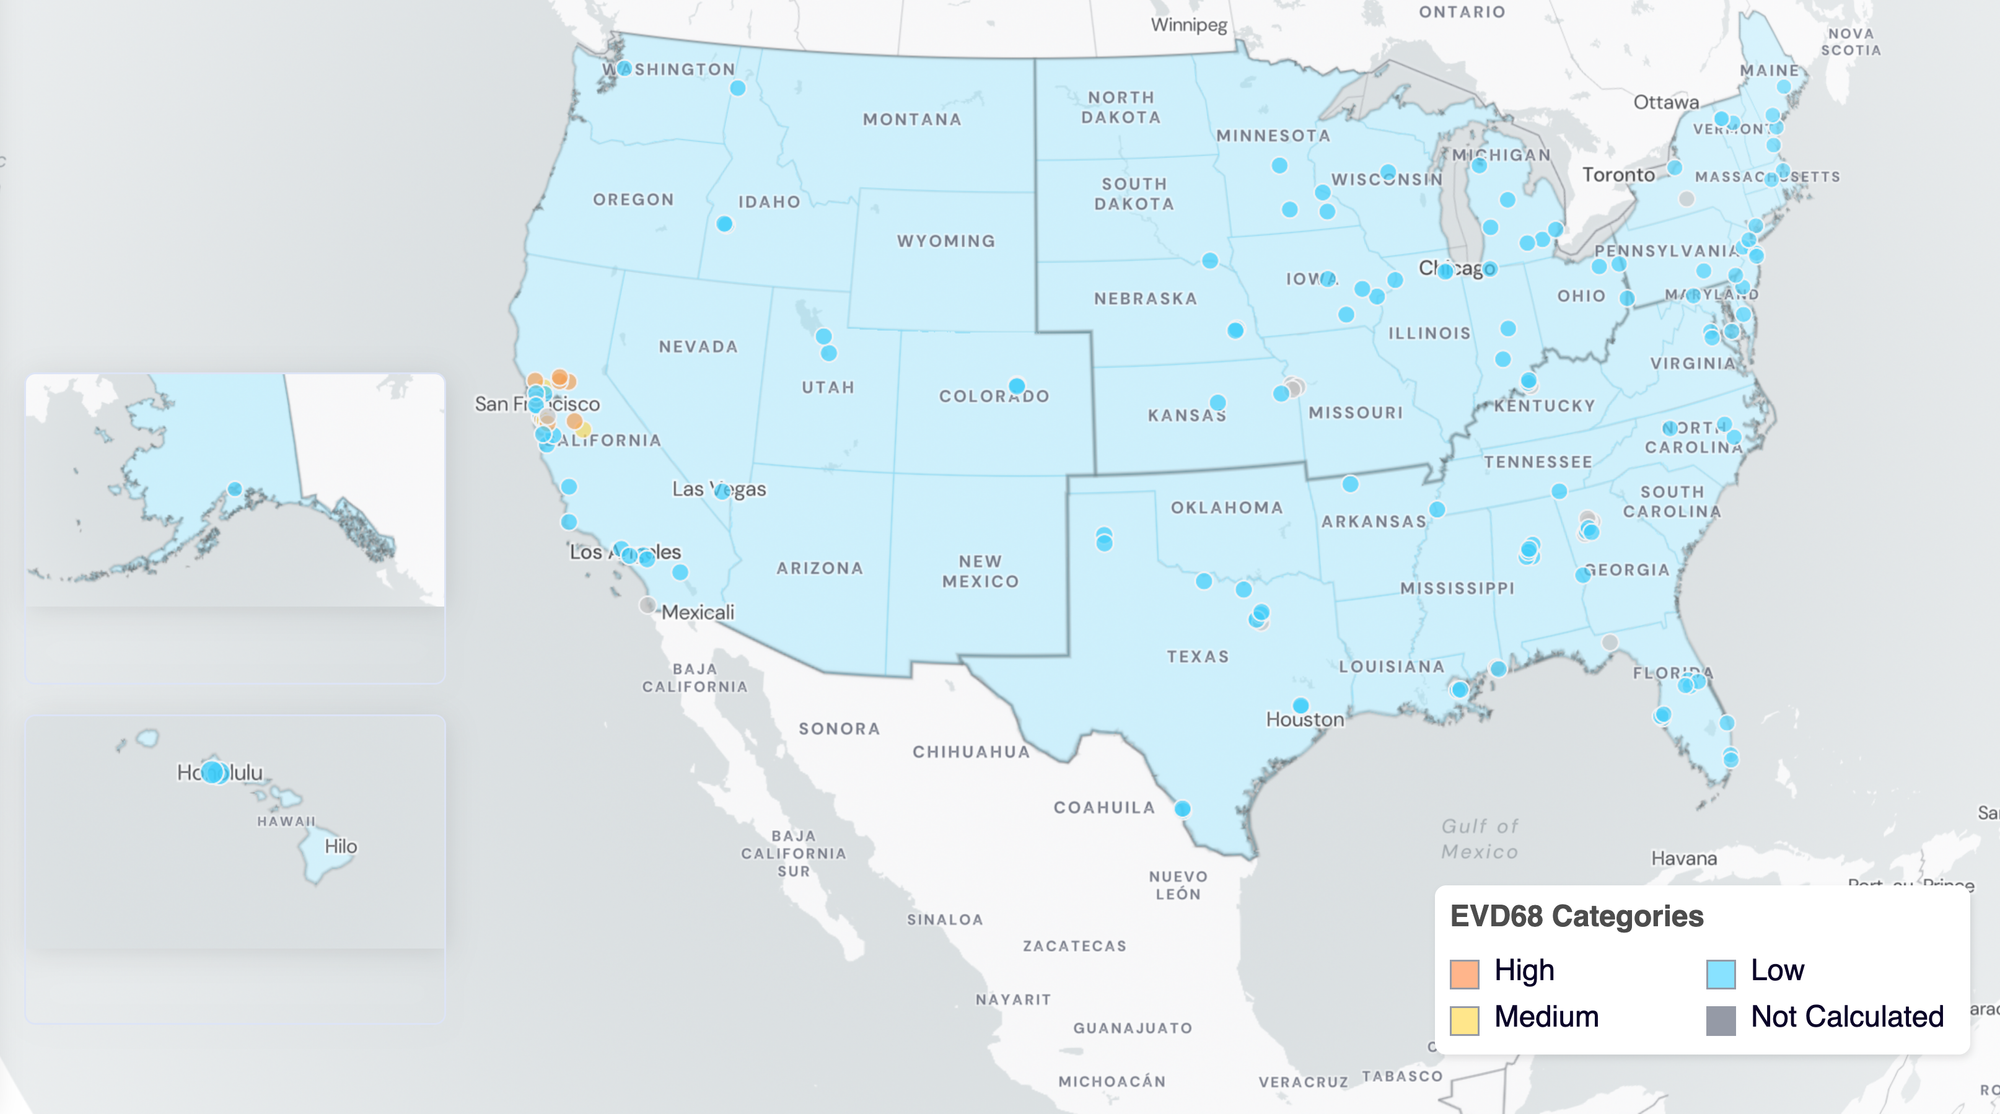
EV-D68 Wastewater Categories. This map includes sample collection data through April 30, 2025. Each dot represents a single site and the four US Census regions are outlined in gray. Midwest Region includes: IA, IL, IN, KS, MI, MN, NE, OH, SD, WI. Northeast Region includes: CT, MA, ME, NH, NJ, NY, PA, VT. Southern Region includes: AL, AR, DE, FL, GA, KY, LA, MD, MS, NC, TN, TX, VA, and WV. Western Region includes: AK, CA, CO, HI, ID, NV, UT, WA.
Gastrointestinal Pathogens
Norovirus GII
Norovirus GII (HuNoV GII) RNA was detected in 100% of samples analyzed in the last 3 weeks. The median concentrations across all sites in the last 3 weeks is 10,438,182 copies per gram, down ~50% from March 2025. Below is the population weighted average HuNoV GII RNA concentrations (normalized by PMMoV) shown in black from all participating WWSCAN sites across the country over the last 365 days.
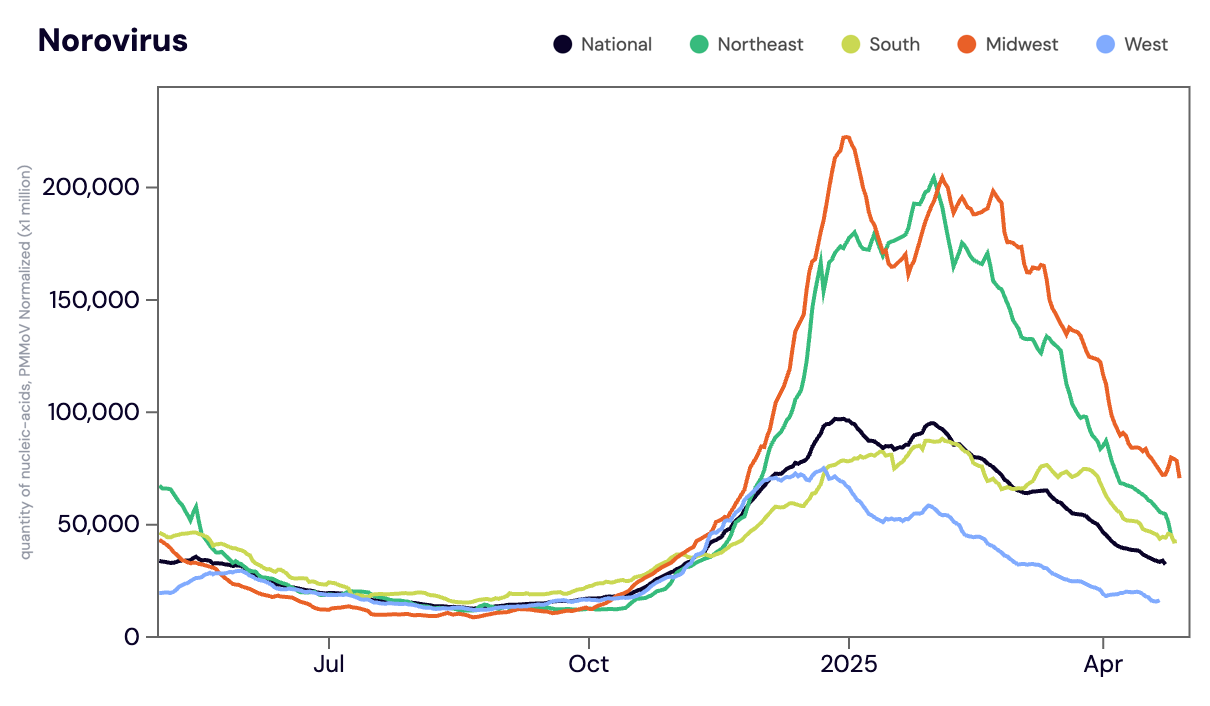
Midwest states: IA, IL, IN, KS, MI, MN, NE, OH, SD, WI. Northeast states: CT, MA, ME, NH, NJ, NY, PA, VT. Southern states: AL, AR, DE, FL, GA, KY, LA, MD, MS, NC, TN, TX, VA, and WV. Western States: AK, CA, CO, HI, ID, NV, UT, WA.
Nationally, Norovirus is in the 'HIGH' Wastewater Category with aggregated measurements showing high concentrations and a downward trend over the last 3 weeks.
Below are the current Norovirus wastewater categories for all WWSCAN sites (recall the category is determined by both the trend and the level):
- 34 are in the LOW Wastewater Category
- 45 are in the MEDIUM Wastewater Category
- 55 are in the HIGH Wastewater Category
- 13 do not have enough data to calculate
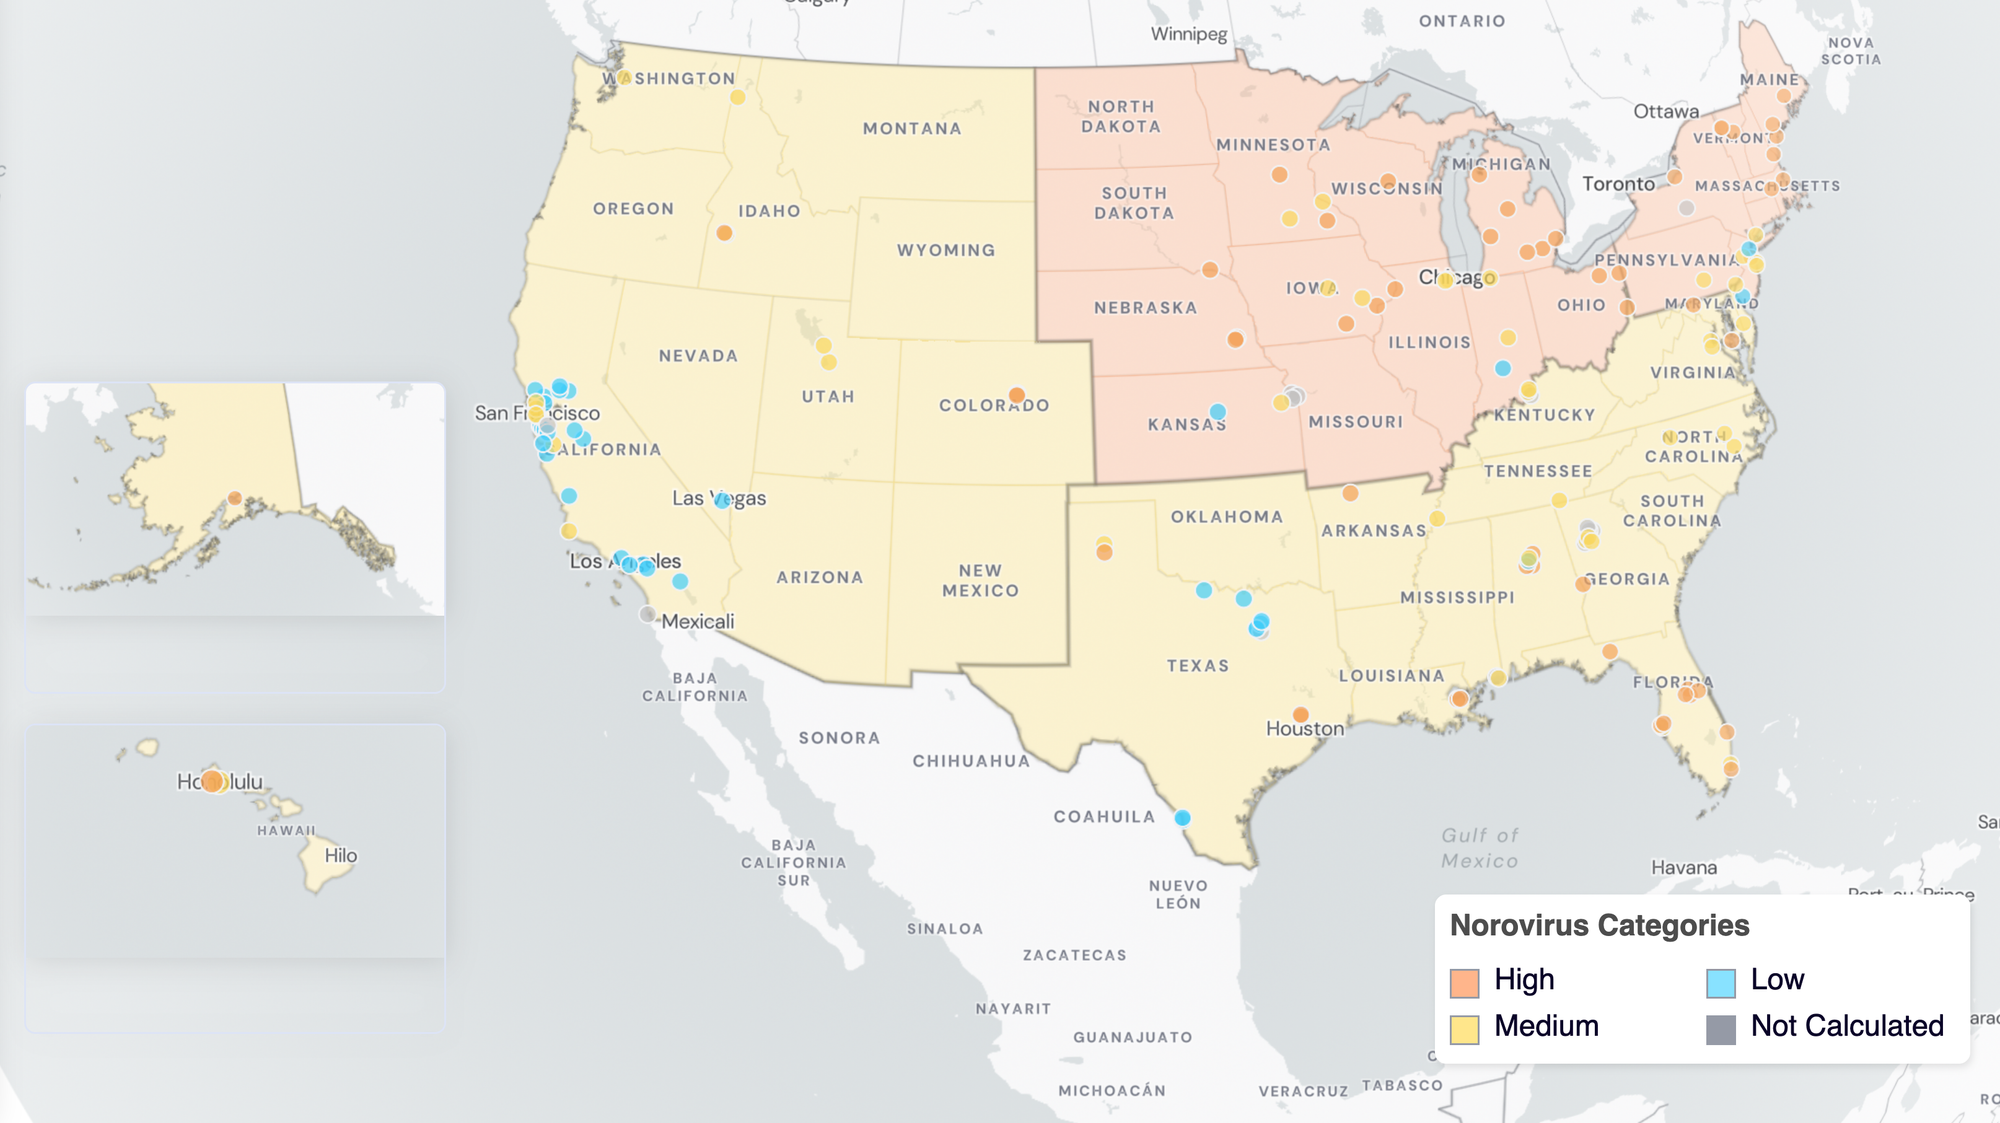
Norovirus Wastewater Categories. This map includes sample collection data through April 30, 2025. Each dot represents a single site and the four US Census regions are outlined in gray. Midwest states: IA, IL, IN, KS, MI, MN, NE, OH, SD, WI. Northeast states: CT, MA, ME, NH, NJ, NY, PA, VT. Southern states: AL, AR, DE, FL, GA, KY, LA, MD, MS, NC, TN, TX, VA, and WV. Western States: AK, CA, CO, HI, ID, NV, UT, WA.
Other Pathogens of Concern
Mpox clade Ib, Mpox clade II, Candida auris, and Hepatitis A
Mpox clade Ib DNA - In mid December 2024 we began prospective monitoring for Mpox clade Ib. You can find a heat map of the Mpox clade Ib data here. In the last 3 weeks, there was 1 positive detection of Mpox clade Ib. Nationally, Mpox clade Ib is in the 'LOW' category due to no detections.
Below are the Mpox clade Ib wastewater categories for all WastewaterSCAN sites (recall the category is determined by the frequency of detection):
- 134 are in the LOW Wastewater Category
- 0 are in the MEDIUM Wastewater Category
- 0 are in the HIGH Wastewater Category
- 13 do not have enough data to calculate
Mpox clade II DNA - There was 1 positive detection of Mpox clade II in the last 3 weeks. Nationally, Mpox clade II is in the 'LOW' category due to limited detections.
Below are the Mpox clade II wastewater categories for all WastewaterSCAN sites (recall the category is determined by the frequency of detection):
- 134 are in the LOW Wastewater Category
- 0 are in the MEDIUM Wastewater Category
- 0 are in the HIGH Wastewater Category
- 13 do not have enough data to calculate
Candida auris (C.auris) DNA - We have detected C. auris DNA in ~5.2% of samples from all WWSCAN sites in the last 3 weeks. Nationally, C. auris is in the 'LOW' category due to limited detections.
The chart below shows plants in Indiana as rows, and days as columns (labeled at the bottom axis). White indicates no samples, blue is non-detect for C. auris DNA and red is detect for C. auris DNA.
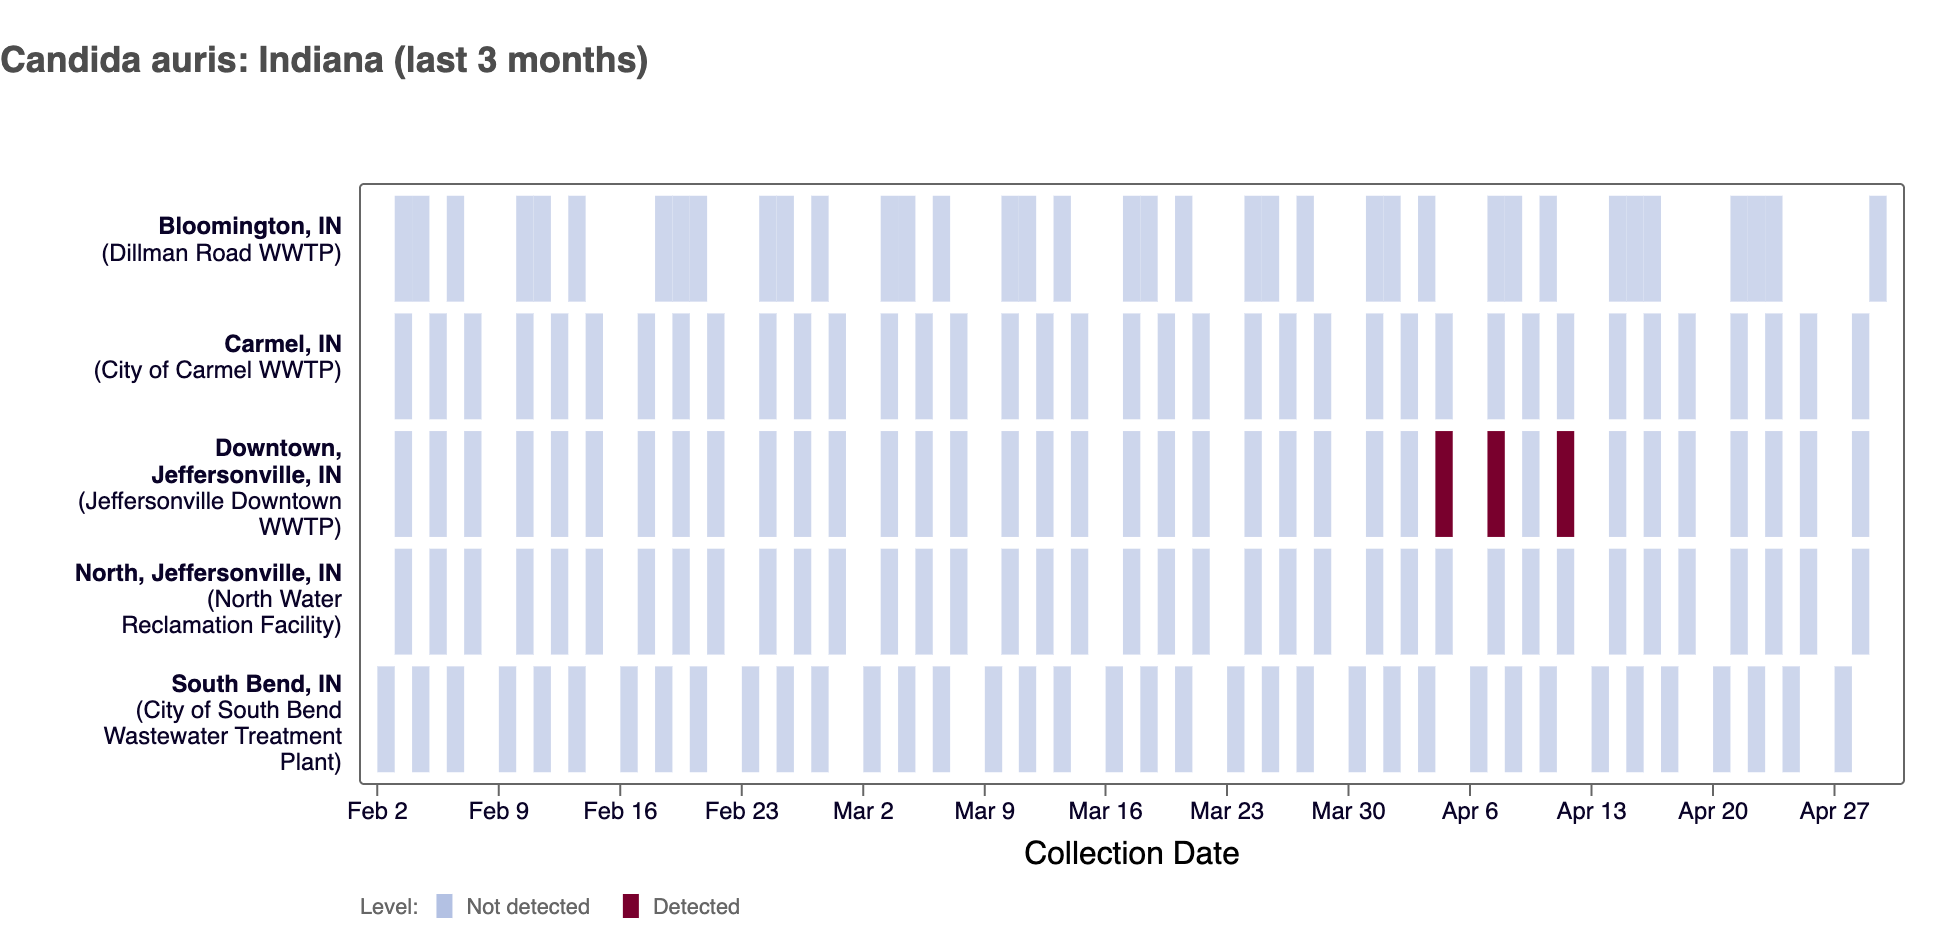
Below are the C. auris wastewater categories for all WastewaterSCAN sites (recall the category is determined by the frequency of detection):
- 128 are in the LOW Wastewater Category
- 6 are in the MEDIUM Wastewater Category
- 0 are in the HIGH Wastewater Category
- 13 do not have enough data to calculate
Hepatitis A (Hep A) RNA - We have detected Hep A RNA in ~9.5% of samples from all WWSCAN sites in the last 3 weeks. Nationally, HepA is in 'LOW' category due to limited detections.
The chart below shows each WWSCAN plant in the Greater Los Angeles Area as rows, and days as columns (labeled at the bottom axis). White indicates no samples, blue is a non-detect for Hep A RNA and red is a detection for Hep A RNA.
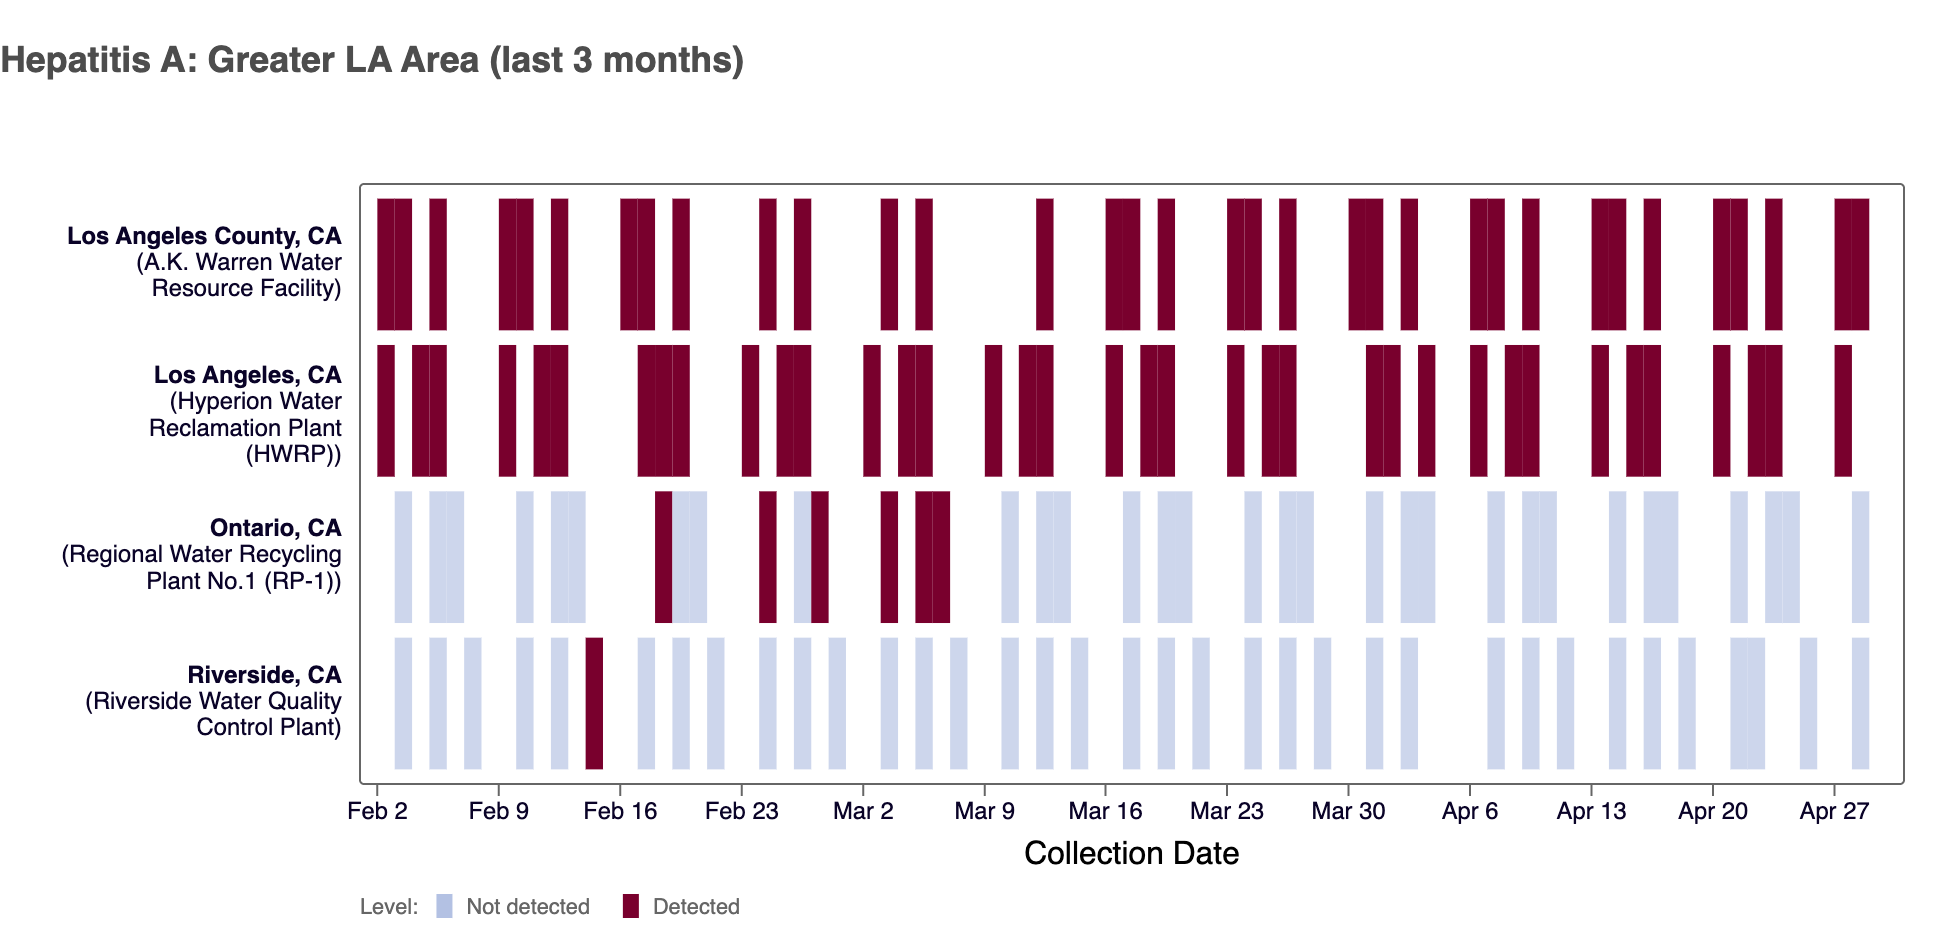
Below are the current HepA wastewater categories for all WWSCAN sites (the category is determined by the frequency of detection):
- 124 are in the LOW Wastewater Category
- 10 are in the MEDIUM Wastewater Category
- 0 are in the HIGH Wastewater Category
- 13 do not have enough data to calculate
WWSCAN protocols and methods
Protocols (Pre-analytical methods and SARS-CoV-2 analytical methods including controls):
- High Throughput RNA Extraction and PCR Inhibitor Removal of Settled Solids for Wastewater Surveillance of SARS-CoV-2 RNA
- High Throughput pre-analytical processing of wastewater settled solids for SARS-CoV-2 RNA analyses
- Quantification of SARS-CoV-2 variant mutations (HV69-70, E484K/N501Y, del156-157/R158G, del143-145, LPPA24S, S:477-505, and ORF1a Del 141-143) in settled solids using digital RT-PCR
- High Throughput SARS-COV-2, PMMoV, and BCoV quantification in settled solids using digital RT-PCR
Pre-prints and peer-reviewed publications provided WWSCAN methods:
- SARS-CoV-2
- Influenza, Human metapneumovirus, Respiratory syncytial virus, Human parainfluenza
- Mpox clade II
- Norovirus GII
- Adenovirus group F, Rotavirus
- Candida auris
- Hepatitis A
- Enterovirus D68
Join us at the next WWSCAN Stakeholder call May 9, 2025
If you have questions about the website or anything else, please email: wwscan_stanford_emory@lists.stanford.edu