
Nationwide WWSCAN Update 11/22/23
Hi everyone,
This newsletter contains updates on the WastewaterSCAN program with wastewater samples analyzed by the lab through November 21st, 2023. Below you will find information on the program in terms of participating partners, review of targets being measured, as well as current categories (low, medium, high) of the infectious disease targets.
Enjoy your weekend,
Ali & Marlene
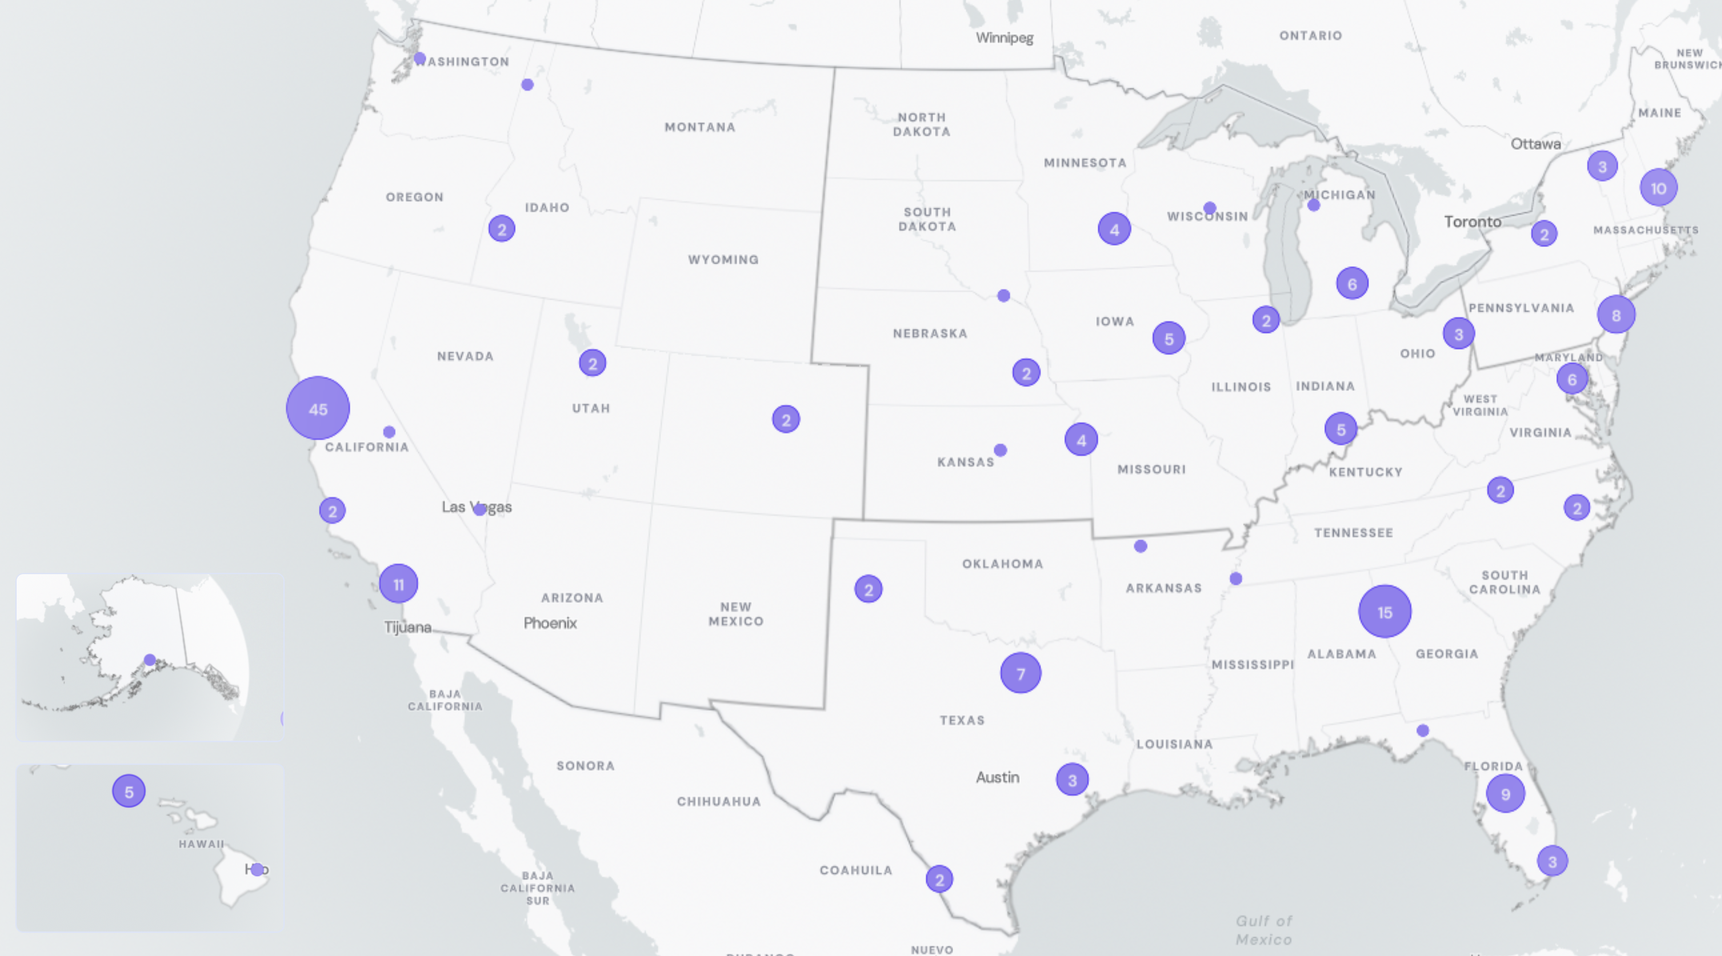
Participating Plants
188 plants from 41 states are sampling, which represents ~13.4% of the US population
WastewaterSCAN Participant Stats:
- 188 plants sampling
- 44,930,251 people covered through sampling efforts
- 41 states represented
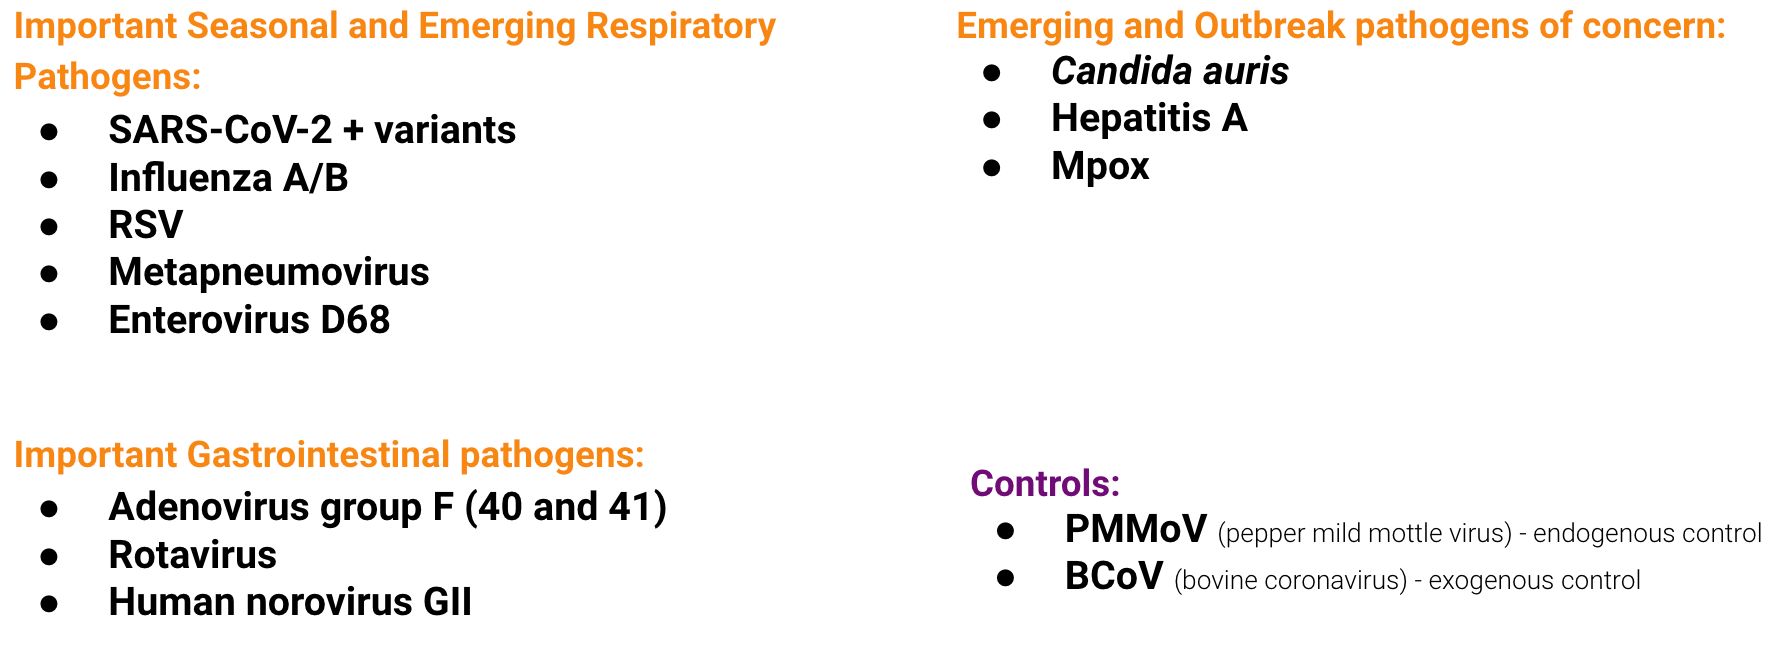
Infectious Disease Target Review
Currently monitoring a suite of Respiratory, Gastrointestinal and Outbreak Pathogens of Concern
The methods for our assays are in the public domain and links for these are provided at the end of the newsletter.
Program Updates
WWSCAN funding is secured through Spring 2024
WastewaterSCAN currently has funding to approximately continue monitoring until May 2024.
Respiratory Pathogens
SARS-CoV-2, Influenza A & B, Respiratory Syncytial Virus, Human metapneumovirus, Human Parainfluenza & EV-D68
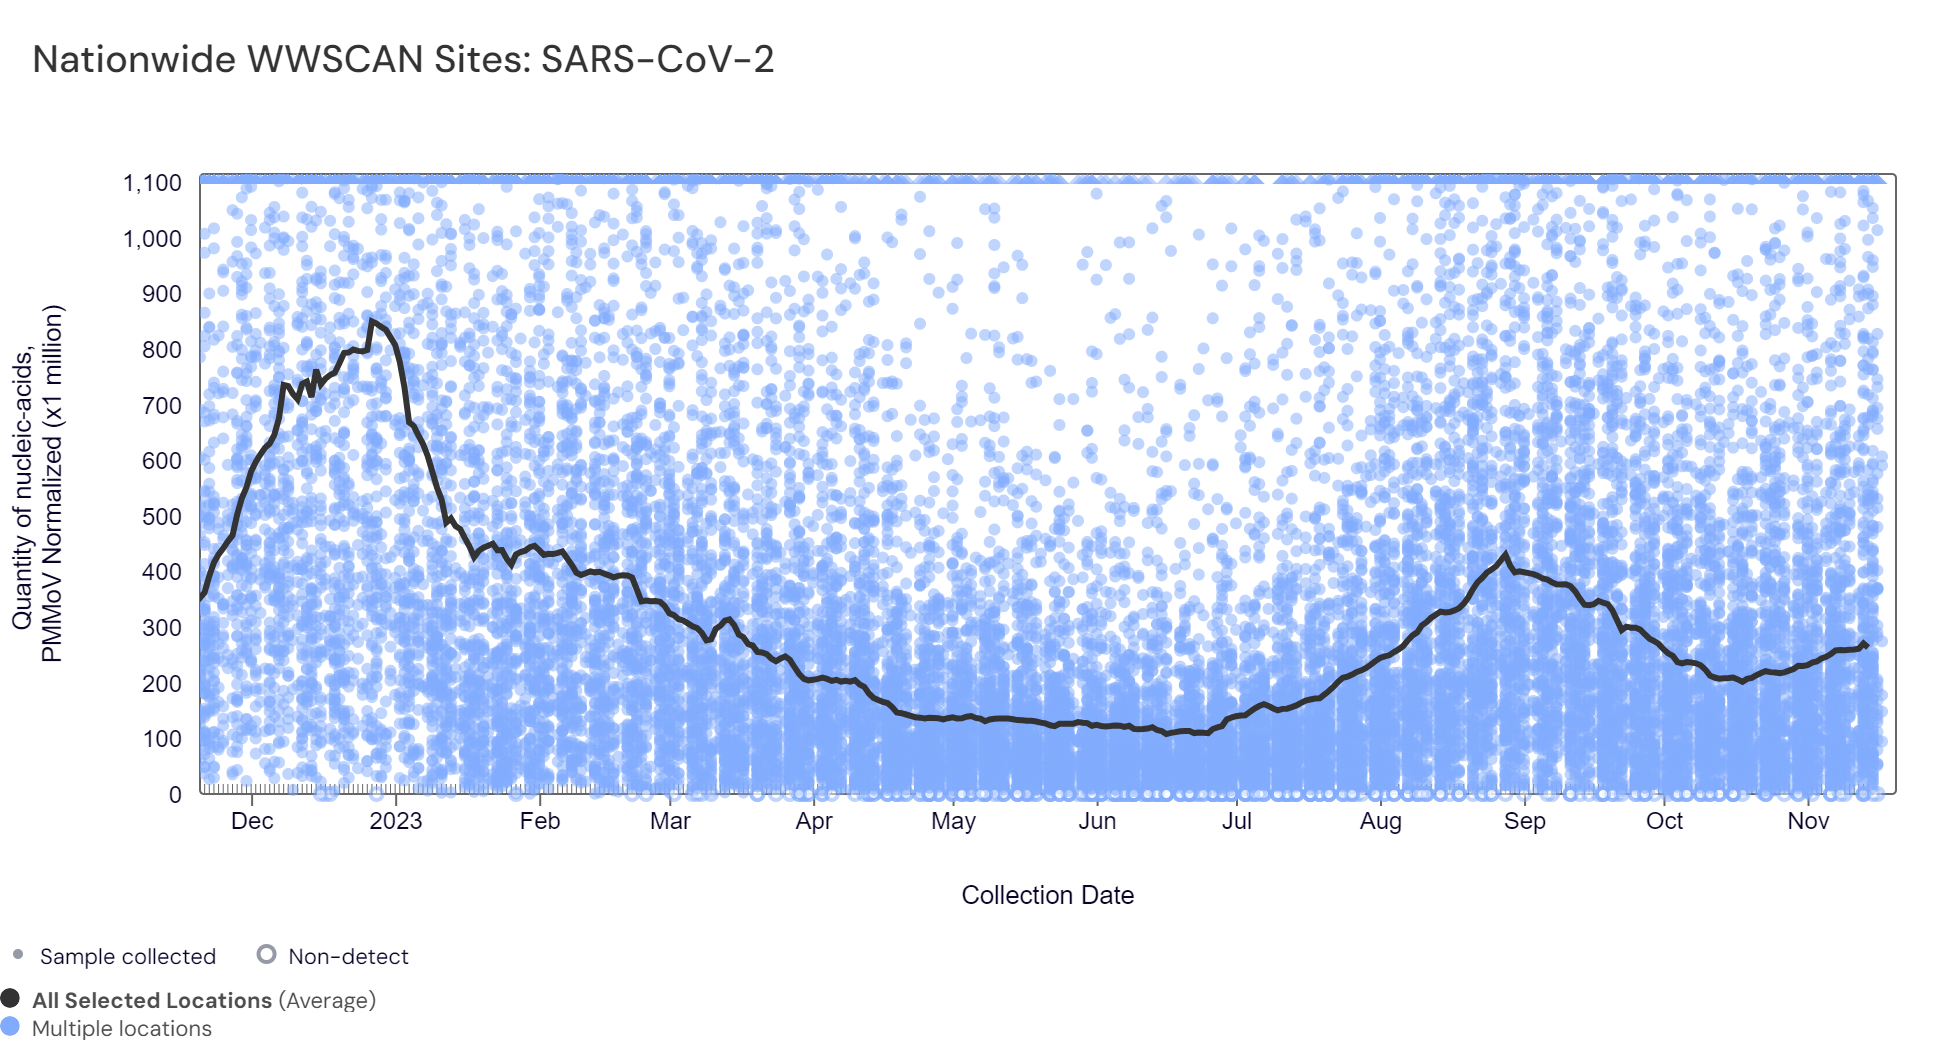
SARS-CoV-2 N gene RNA median concentration across all sites over the last 21 days is 85,215 copies/gram. For reference, median concentration in October 2023 was 75,000 copies/gram. Below are the SARS-CoV-2 N gene concentrations (normalized by PMMoV) from all participating WWSCAN sites across the country over the last 365 days. Raw data are shown as blue dots and the population weighted average of all sites is shown as a bold black line. Nationally, SARS-CoV-2 is in the "High" category with aggregated measurements showing high concentrations and an upward trend over the past 21 days.
Below are the SARS-CoV-2 N gene concentrations (normalized by PMMoV) from sites in the Midwest US (top left panel), Northeast US (top right panel), Southern US (bottom left panel) and Western US (bottom right panel) over the last 365 days. The population weighted average across the regional WWSCAN plants is shown in black, and the raw data are shown in blue.
The data shows a recent peak in concentrations around September across all US regions, and current high to medium concentration levels a along with an increase in concentrations across all regions. All regions are currently in the "High" category.
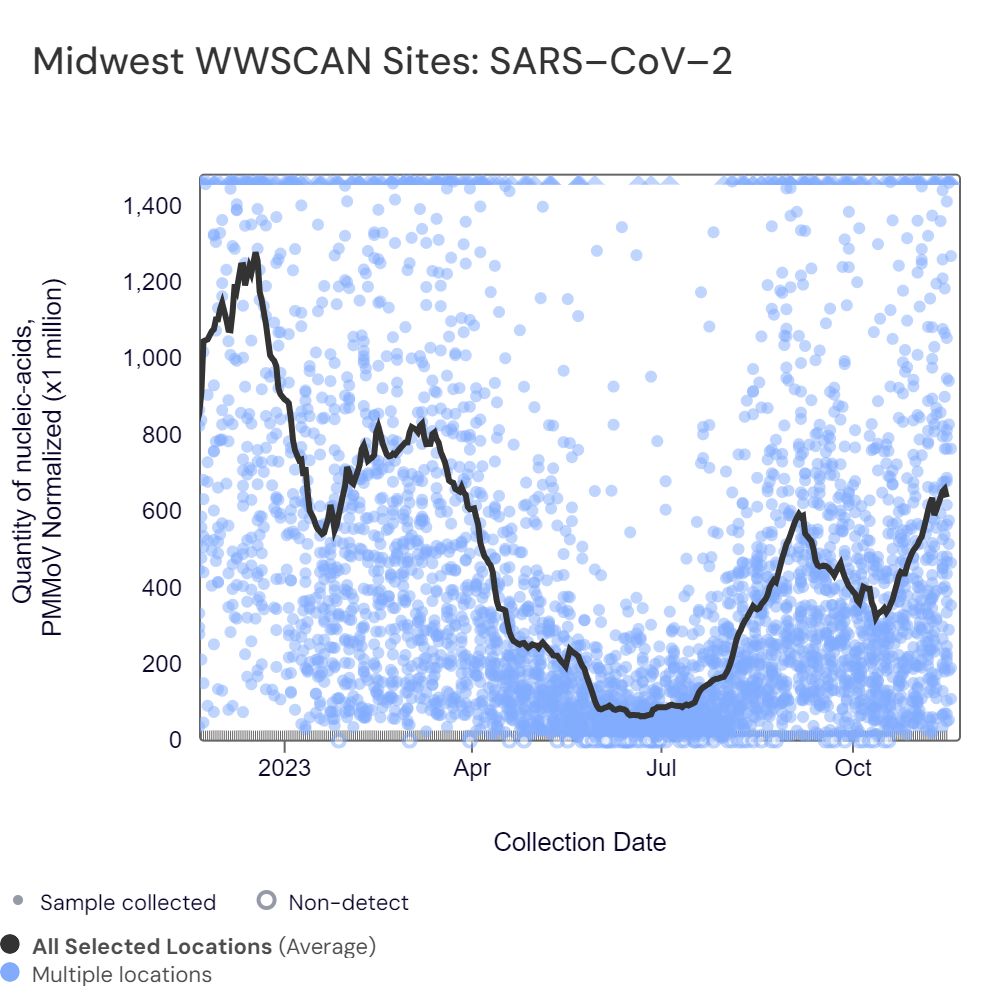
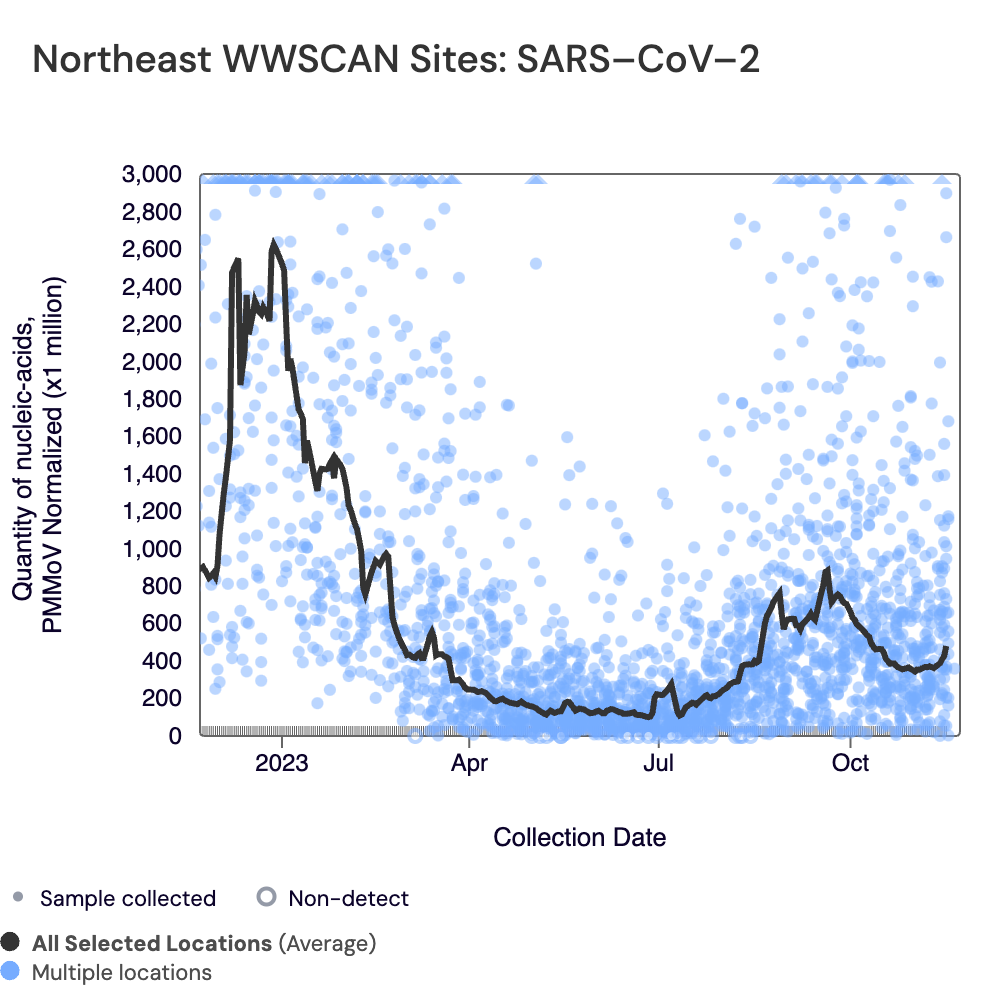
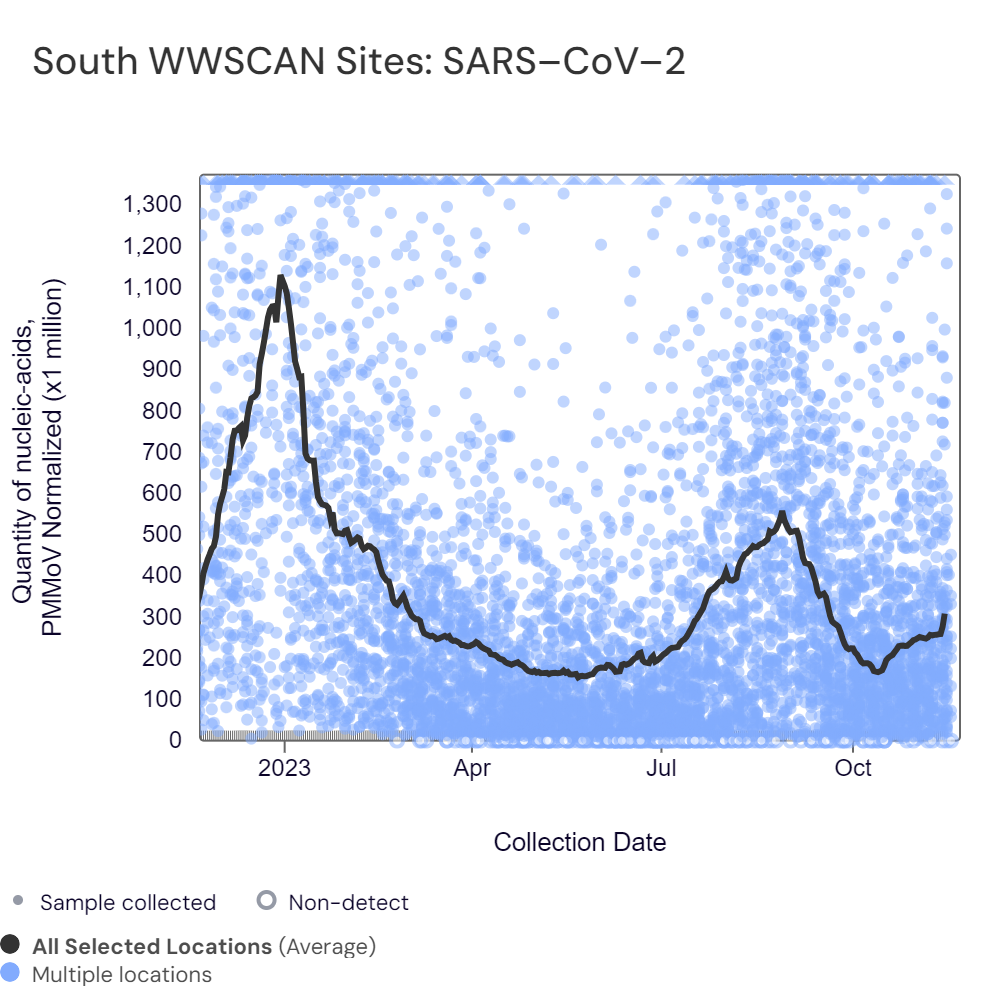
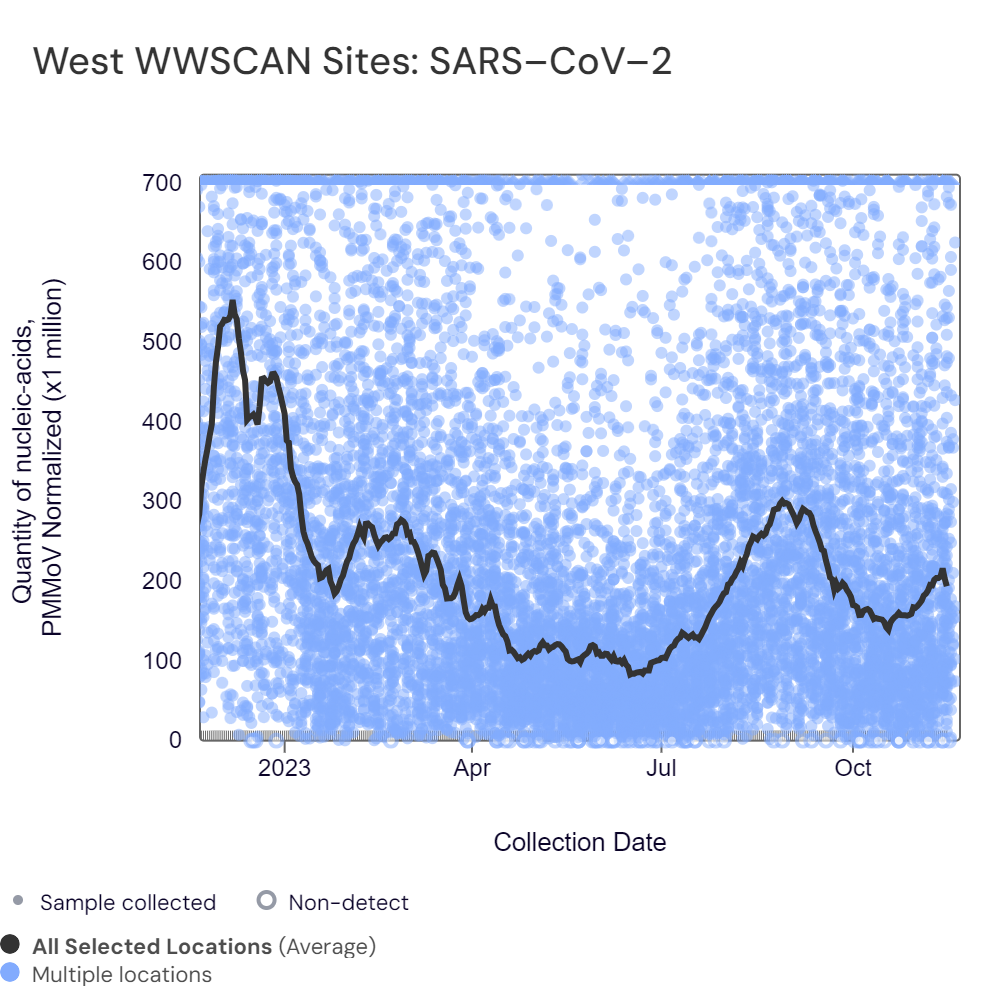
Midwest states: IA, IL, IN, KS, MI, MN, ND, OH, SD, WI. Northeast states: MA, ME, NH, NJ, NY, PA, VT. Southern states: AL, AR, DE, FL, GA, KY, MD, NC, TN, TX, VA, WV. Western States: AK, CA, CO, HI, ID, NV, UT.
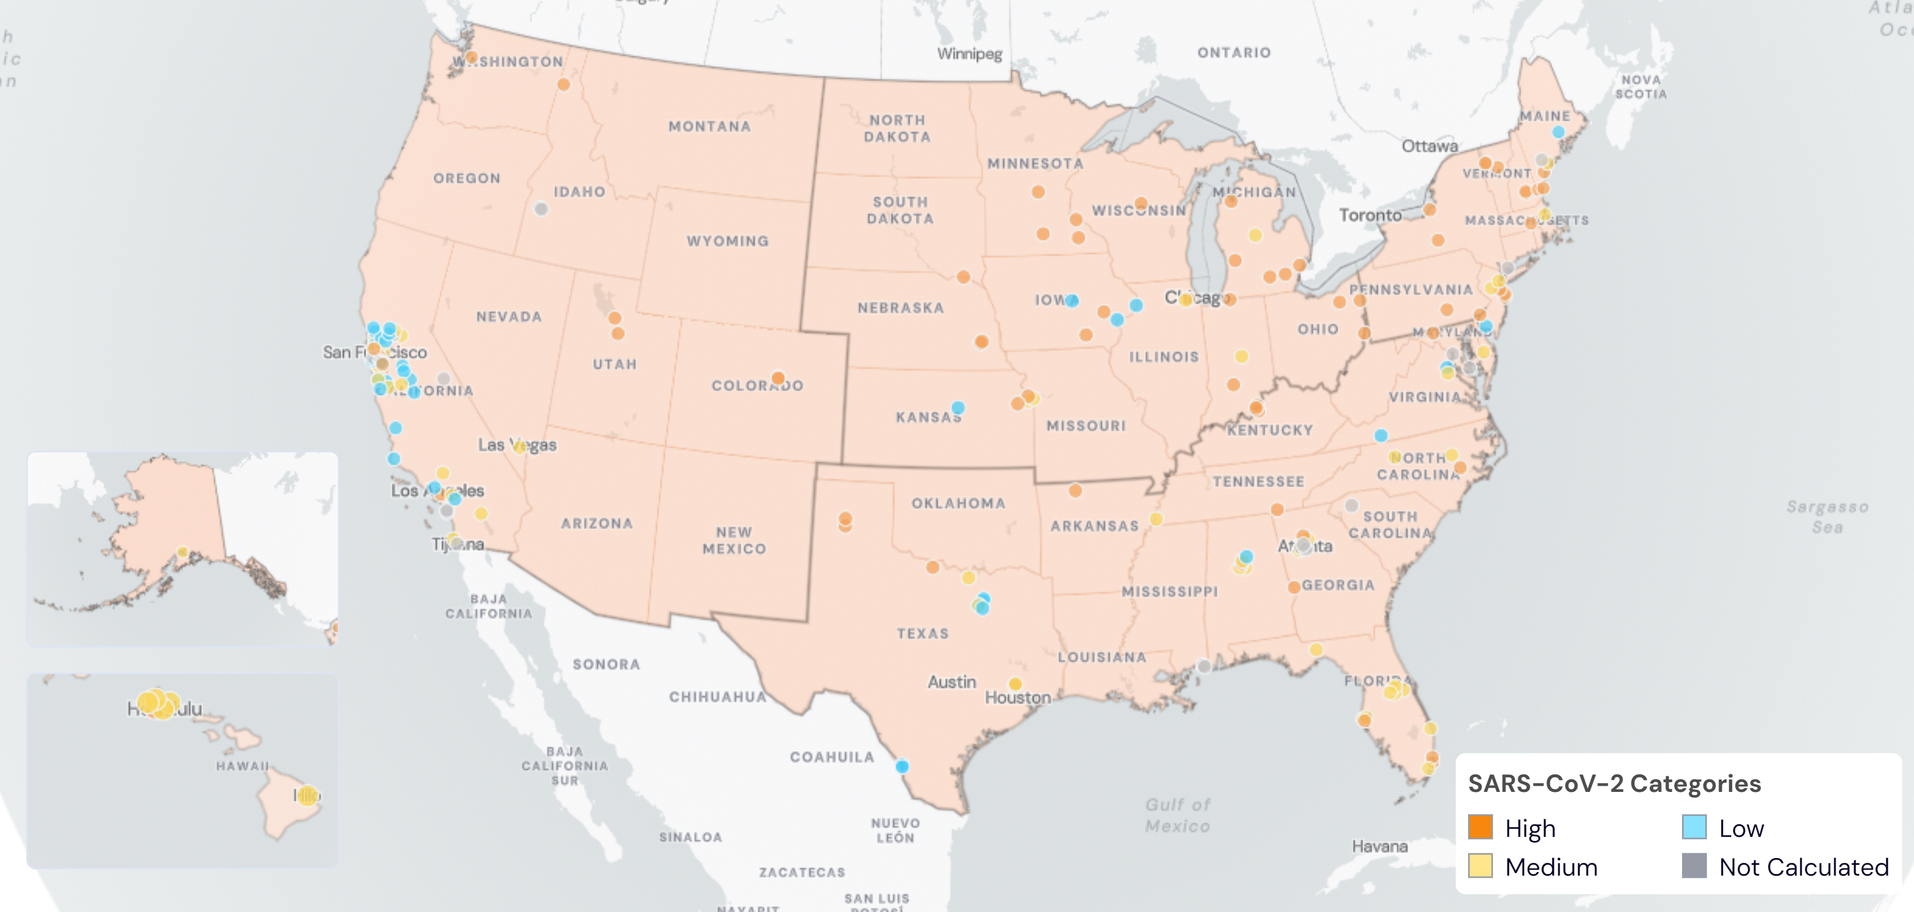
Below are the current SARS-CoV-2 wastewater categories for all WWSCAN sites:
- 37 are in the LOW Wastewater Category
- 56 are in the MEDIUM Wastewater Category
- 70 are in the HIGH Wastewater Category
- 27 do not have enough data to calculate (Coastal, Laguna; Niguel, CA; Fremont, CA; Half Moon Bay, CA; JB Latham, Laguna Niguel, CA; Mammoth, CA; Newark, CA; Pacifica, CA; Regional, Laguna Niguel, CA; South San Diego, CA; Union City, CA; University of California, Davis, CA; Windsor, CA; Winters, CA; Stamford, CT; Blue Plains, Washington, DC; RM Clayton, Atlanta, GA; South River, Atlanta, GA; Utoy Creek, Atlanta, GA; Lander Street, Boise, ID; West Boise, ID; Lewiston, ME; Hollywood, MD; Gautier, MS; Pascagoula Moss Point, MS; Greenville, SC; Memphis, TN; Gainesville, TX)
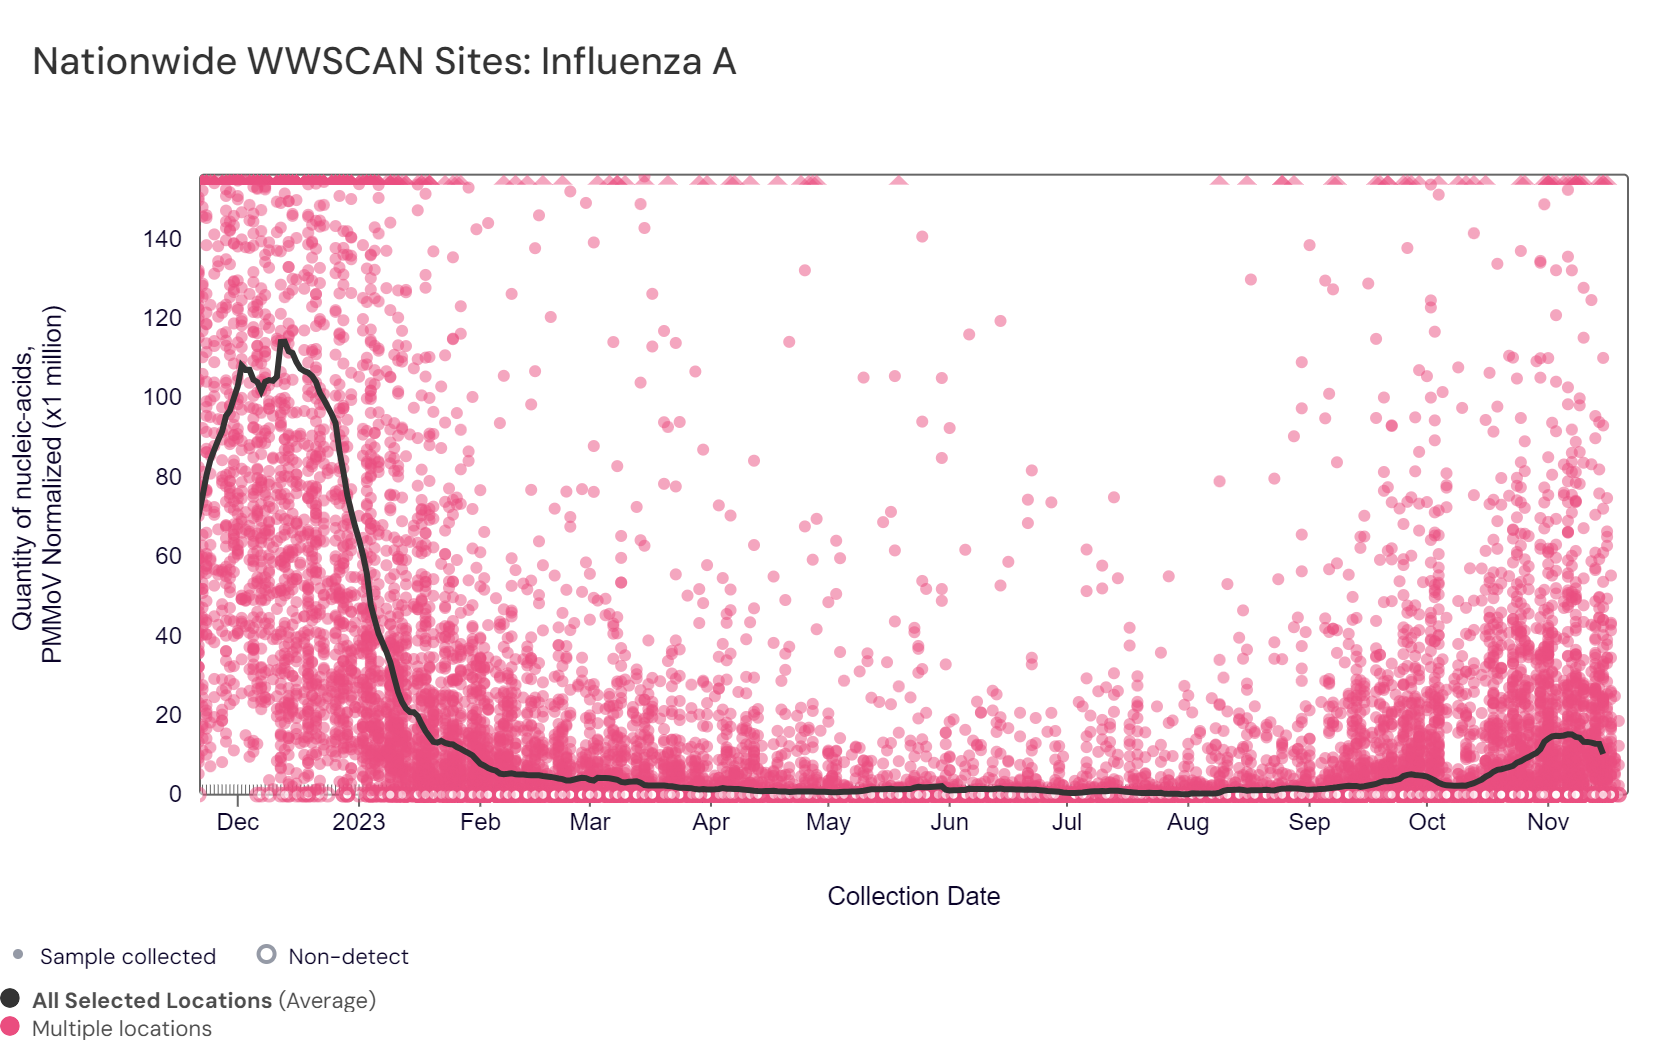
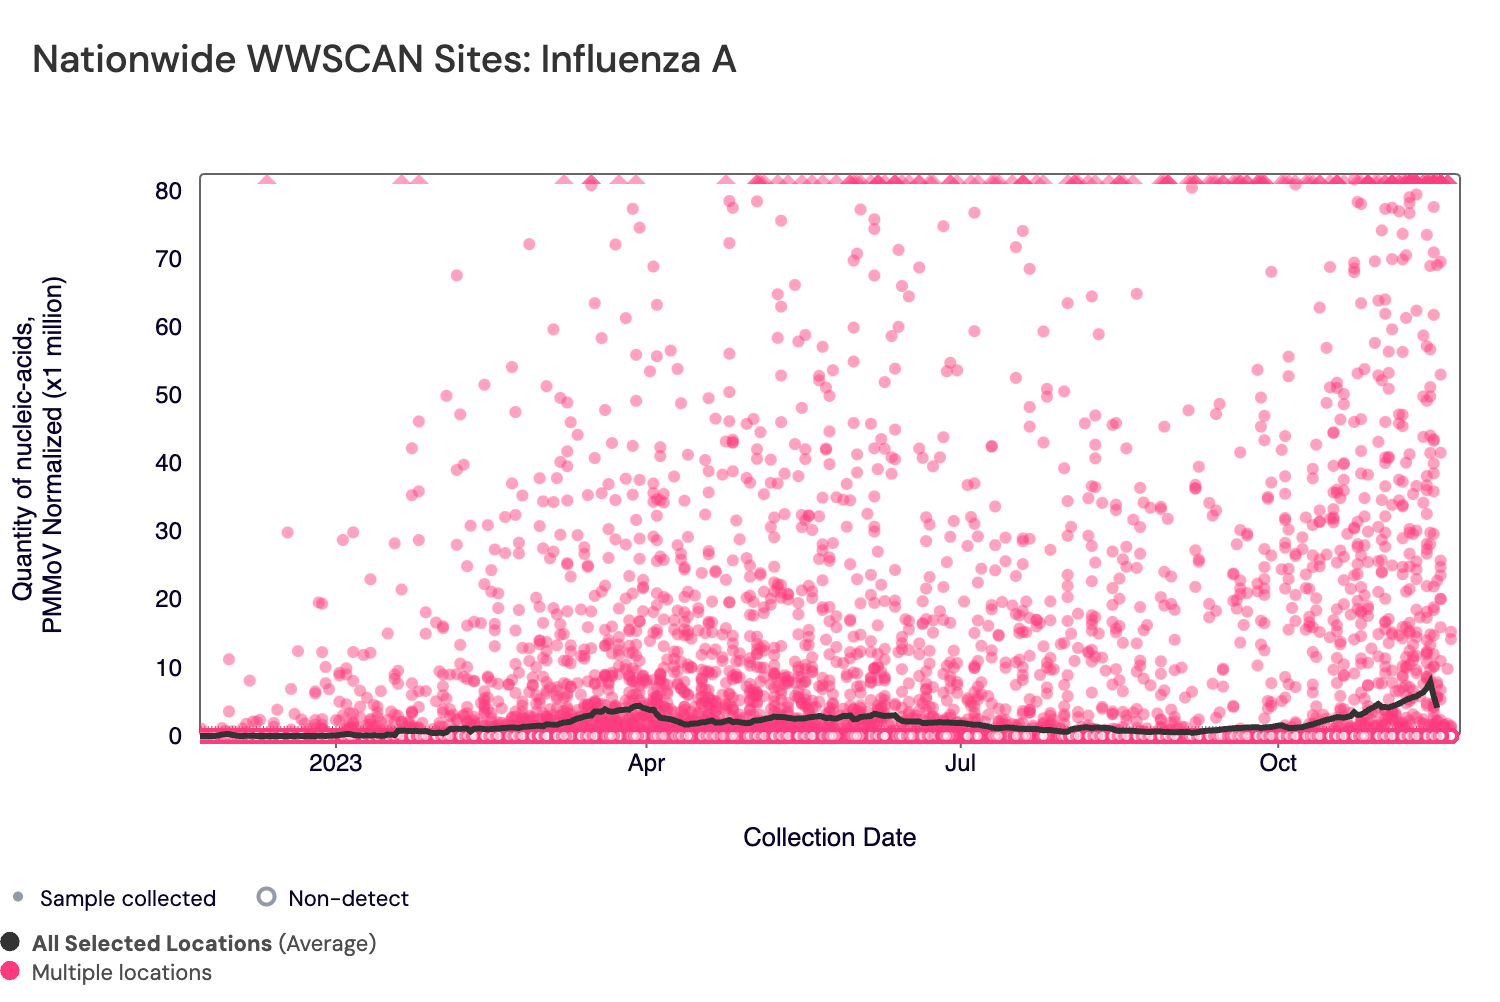
Influenza A (IAV) RNA median concentration across all sites over the last 21 days is 3,040 copies/gram. There have been 785 positive samples out of 1,334 samples during the past 21 days (~58.8% detection rate). Below are the IAV RNA concentrations (normalized by PMMoV) from all participating WWSCAN sites across the country over the last 365 days. The pink dots are the raw data and the black line is the population weighted average. Nationally, influenza A is in the "Low" category, with <50% of sites showing onset of influenza in wastewater.
Below are the IAV RNA concentrations (normalized by PMMoV) from sites in the Midwest US (top left panel), Northeast US (top right panel), Southern US (bottom left panel) and Western US (bottom right panel) over the last 365 days. The population weighted average across regional WWSCAN plants is shown in black, raw data are shown in pink.
These plots show relatively high concentrations across all US regions during the last influenza season with lower levels currently observed. All regions are in the "Low" category, but in recent weeks there has been an increasing rate of positive samples particularly in the South and West.
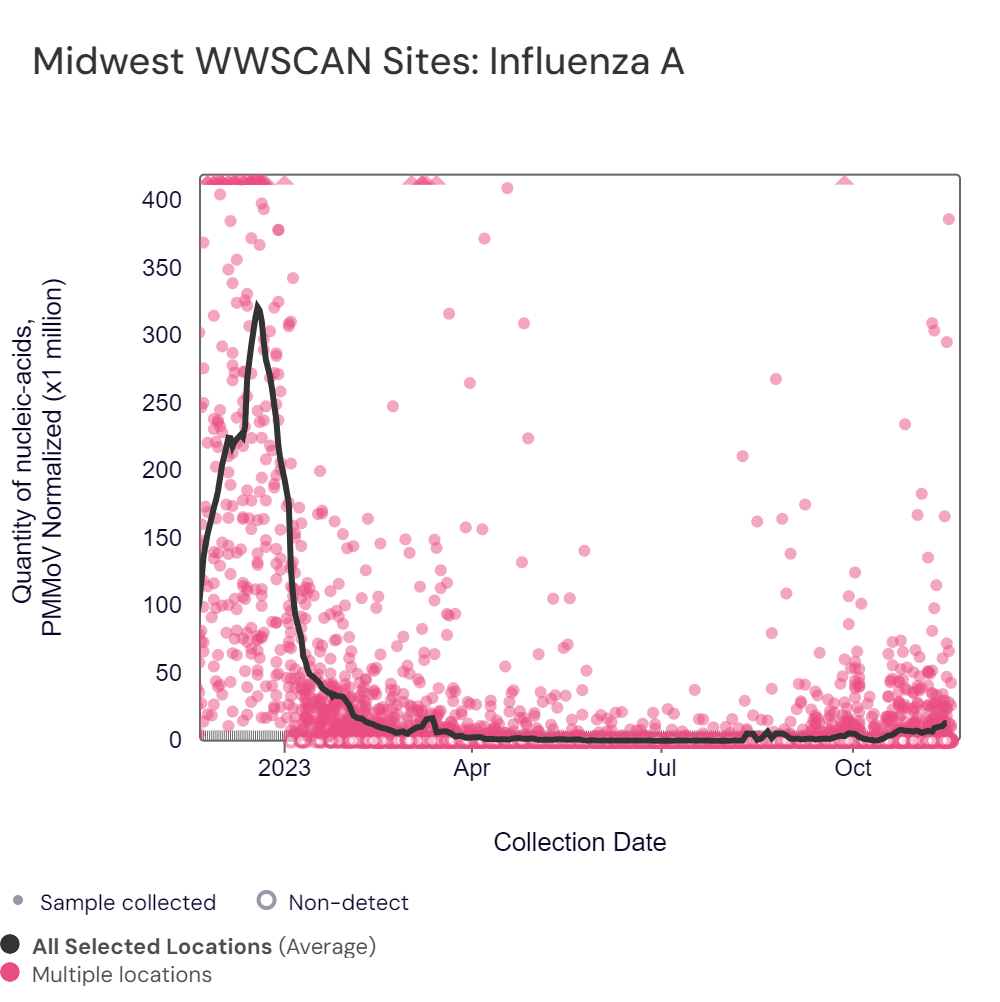

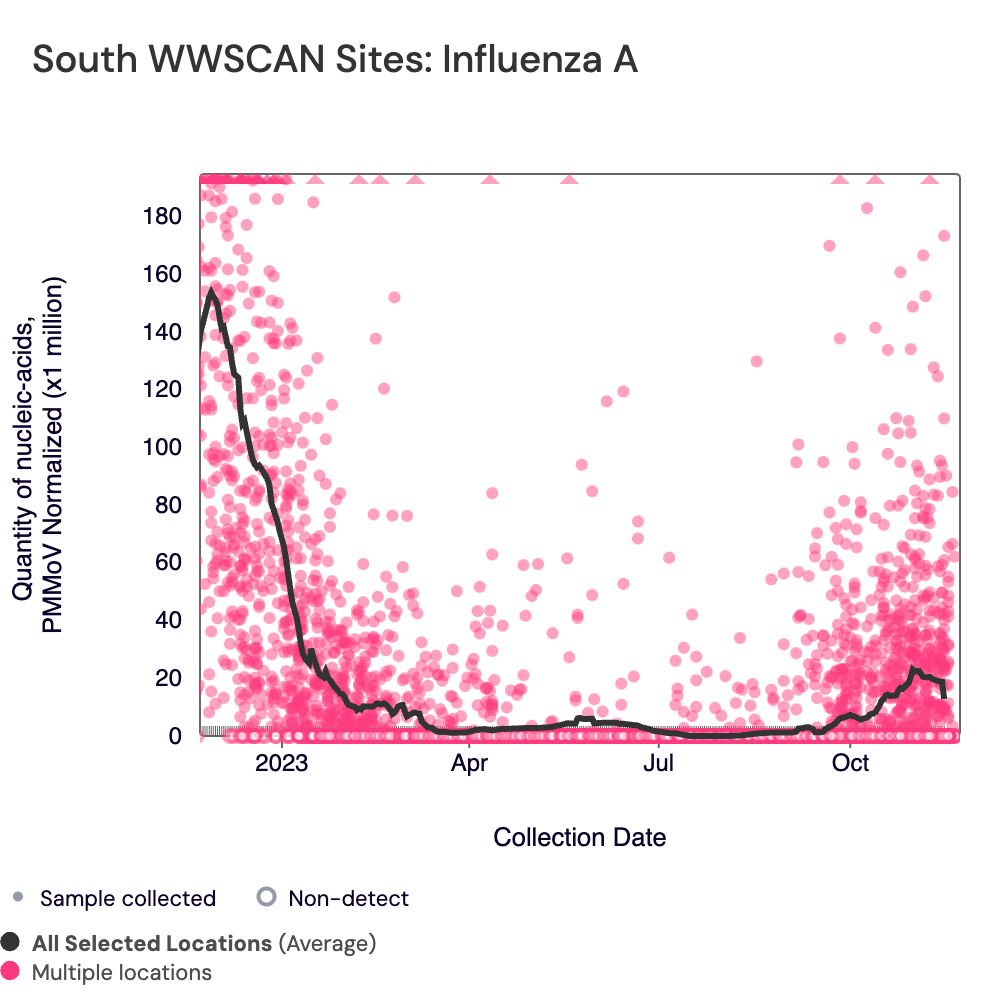

Midwest states: IA, IL, IN, KS, MI, MN, ND, OH, SD, WI. Northeast states: MA, ME, NH, NJ, NY, PA, VT. Southern states: AL, AR, DE, FL, GA, KY, MD, NC, TN, TX, VA, WV. Western States: AK, CA, CO, HI, ID, NV, UT.
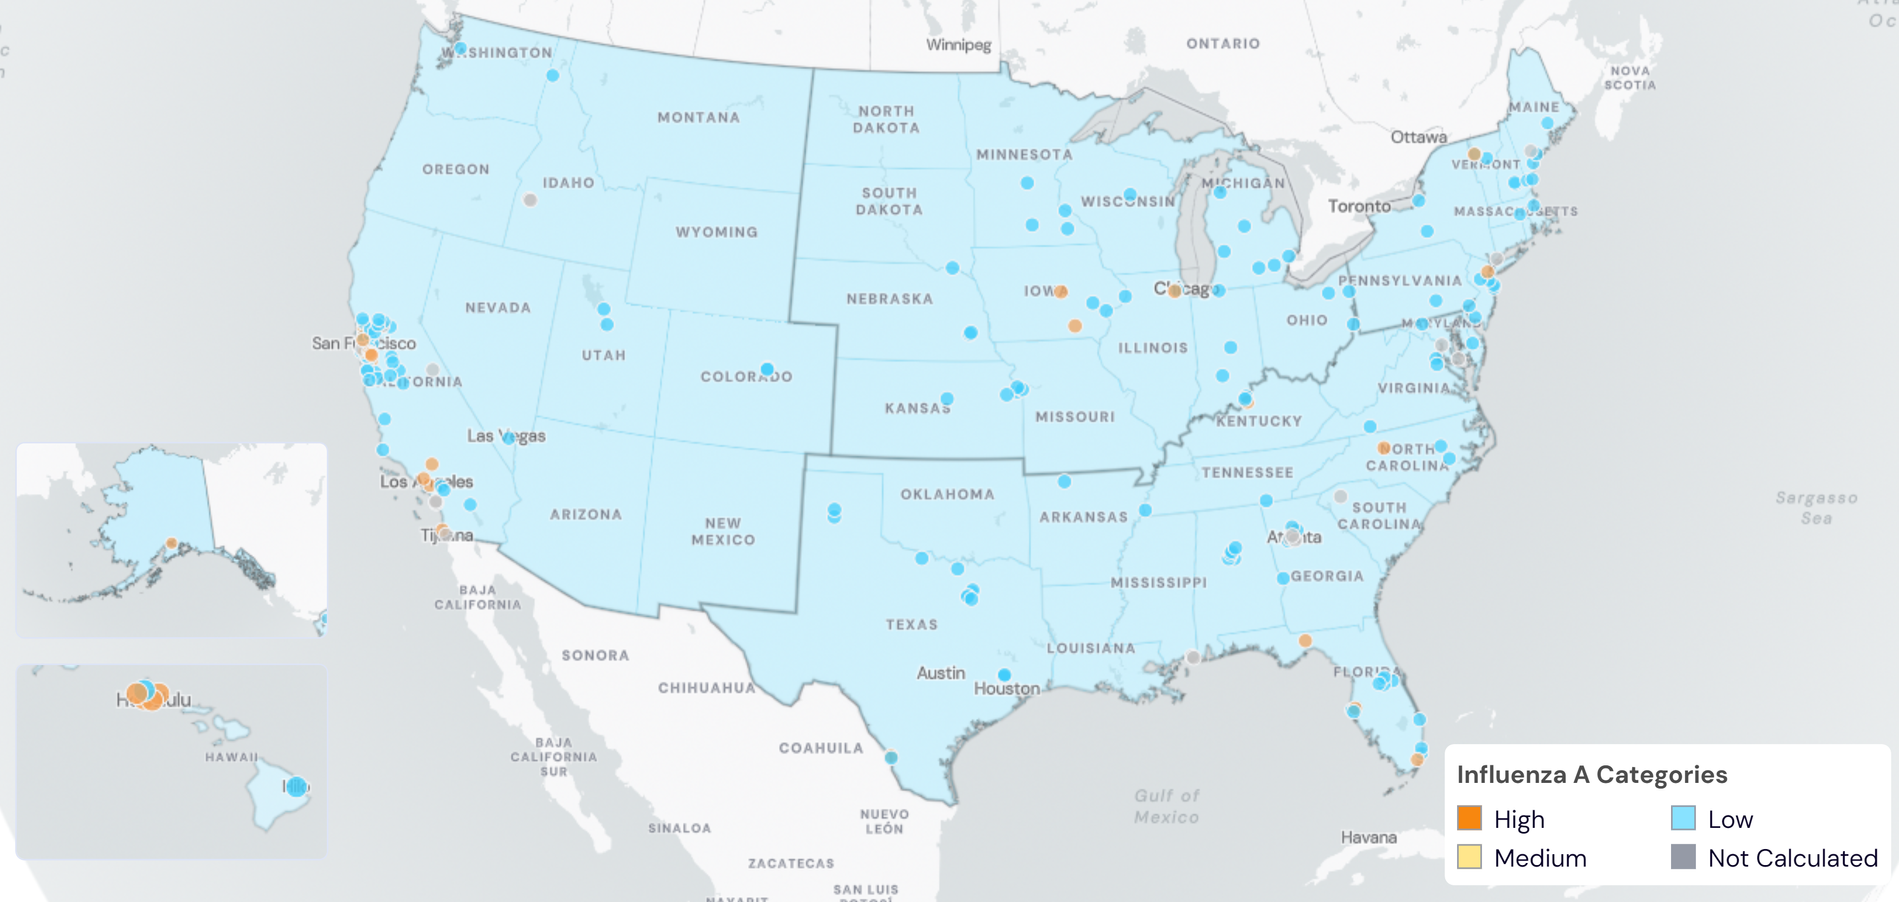
Below are the current Influenza A wastewater categories for all WWSCAN sites, with at least 26 sites are showing wastewater onset for IAV:
- 136 are in the LOW Wastewater Category
- 0 are in the MEDIUM Wastewater Category
- 27 are in the HIGH Wastewater Category
- 27 do not have enough data to calculate (Coastal, Laguna; Niguel, CA; Fremont, CA; Half Moon Bay, CA; JB Latham, Laguna Niguel, CA; Mammoth, CA; Newark, CA; Pacifica, CA; Regional, Laguna Niguel, CA; South San Diego, CA; Union City, CA; University of California, Davis, CA; Windsor, CA; Winters, CA; Stamford, CT; Blue Plains, Washington, DC; RM Clayton, Atlanta, GA; South River, Atlanta, GA; Utoy Creek, Atlanta, GA; Lander Street, Boise, ID; West Boise, ID; Lewiston, ME; Hollywood, MD; Gautier, MS; Pascagoula Moss Point, MS; Greenville, SC; Memphis, TN; Gainesville, TX)
Influenza B (IBV) RNA has been detected in 274 out of 1,334 samples during the past 21 days (~20.5% detection rate). Below are the IBV RNA concentrations (normalized by PMMoV) from all participating WWSCAN sites across the country over the last 365 days. Raw data are shown as pink dots, and the black line is the population weighted average.
Nationally, influenza B is in the "Low" category with onset in <50% of sites. Notably, the South has a number of individual sites in the high category, along with several sites in Northern California.
Below are the current Influenza B wastewater categories for all WWSCAN sites, with at least 5 sites are showing wastewater onset for IBV:
- 152 are in the LOW Wastewater Category
- 0 are in the MEDIUM Wastewater Category
- 11 are in the HIGH Wastewater Category
- 27 do not have enough data to calculate (Coastal, Laguna; Niguel, CA; Fremont, CA; Half Moon Bay, CA; JB Latham, Laguna Niguel, CA; Mammoth, CA; Newark, CA; Pacifica, CA; Regional, Laguna Niguel, CA; South San Diego, CA; Union City, CA; University of California, Davis, CA; Windsor, CA; Winters, CA; Stamford, CT; Blue Plains, Washington, DC; RM Clayton, Atlanta, GA; South River, Atlanta, GA; Utoy Creek, Atlanta, GA; Lander Street, Boise, ID; West Boise, ID; Lewiston, ME; Hollywood, MD; Gautier, MS; Pascagoula Moss Point, MS; Greenville, SC; Memphis, TN; Gainesville, TX)

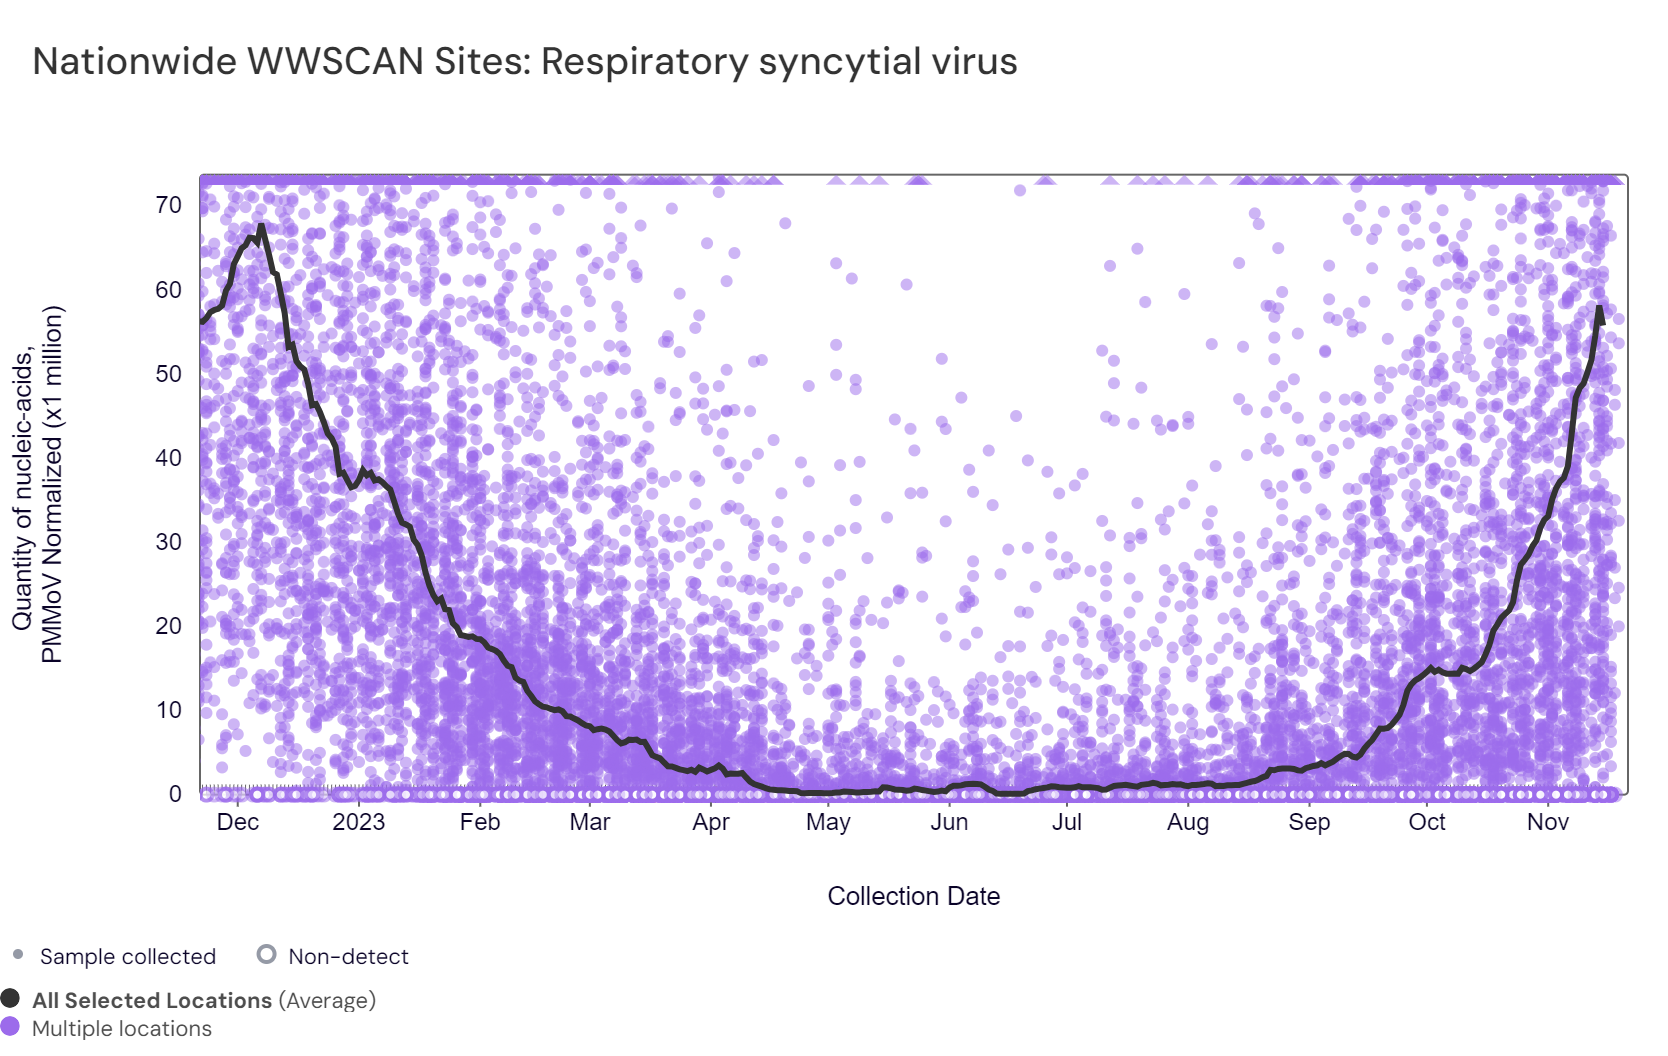
Respiratory syncytial virus (RSV) RSV RNA median concentration across all sites over the last 21 days is 11,367 copies/gram. For reference, median concentration in October 2023 was 2,160 copies/gram. There have been 1,073 positive samples out of 1,334 samples during the past 21 days (~80.4% detection rate). Below are the RSV RNA concentrations (normalized by PMMoV) from all participating WWSCAN sites across the country over the last 365 days. Raw data are shown as purple dots, and the black line is the population weighted average.
Below are the RSV RNA concentrations (normalized by PMMoV) from sites in the Midwest US (top left panel), Northeast US (top right panel), Southern US (bottom left panel) and Western US (bottom right panel) over the last 365 days. The population weighted average across regional WWSCAN plants is shown in black and raw data are shown as purple dots.
The plots below show relatively high concentrations across all US regions around the start of the year with recent levels approaching those concentrations in all regions except the Midwest. Nationally, RSV is in the "High" category, with >50% of sites showing onset of RSV in wastewater and aggregated measurements showing high concentrations and an upward trend over the past 21 days.
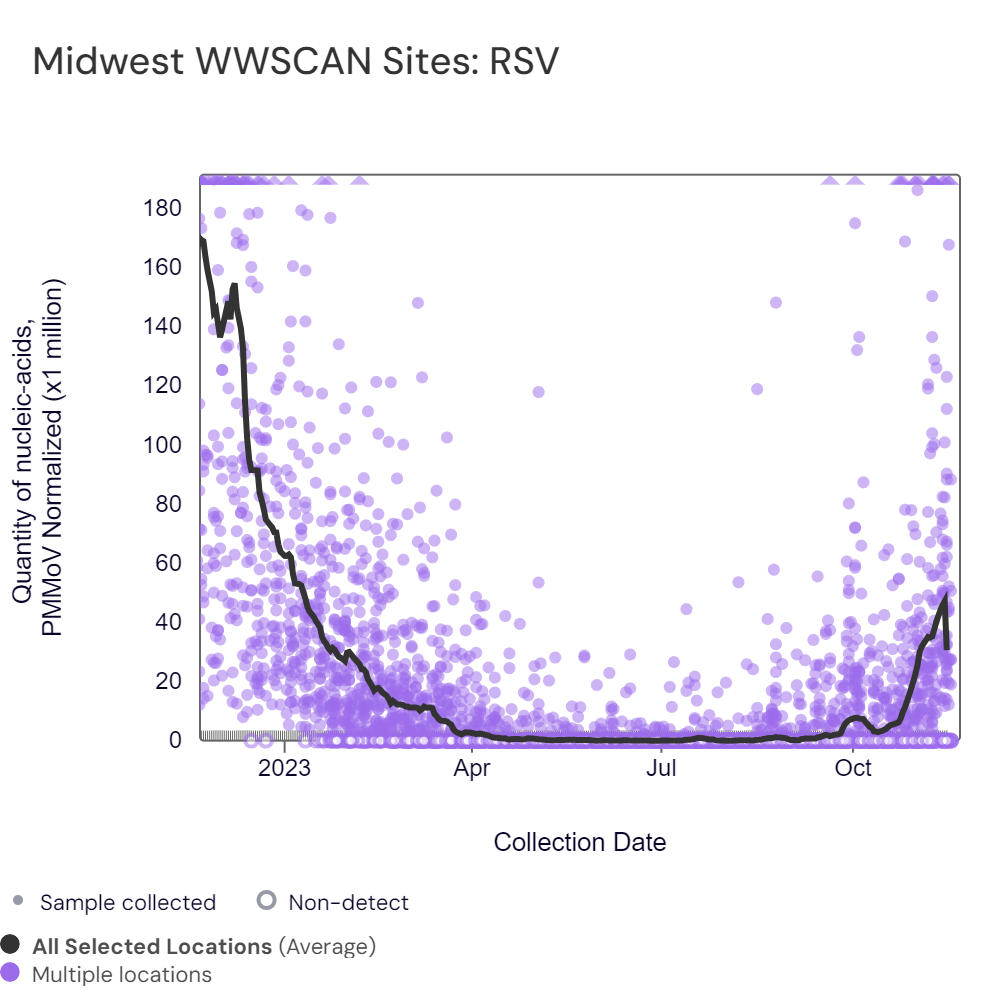

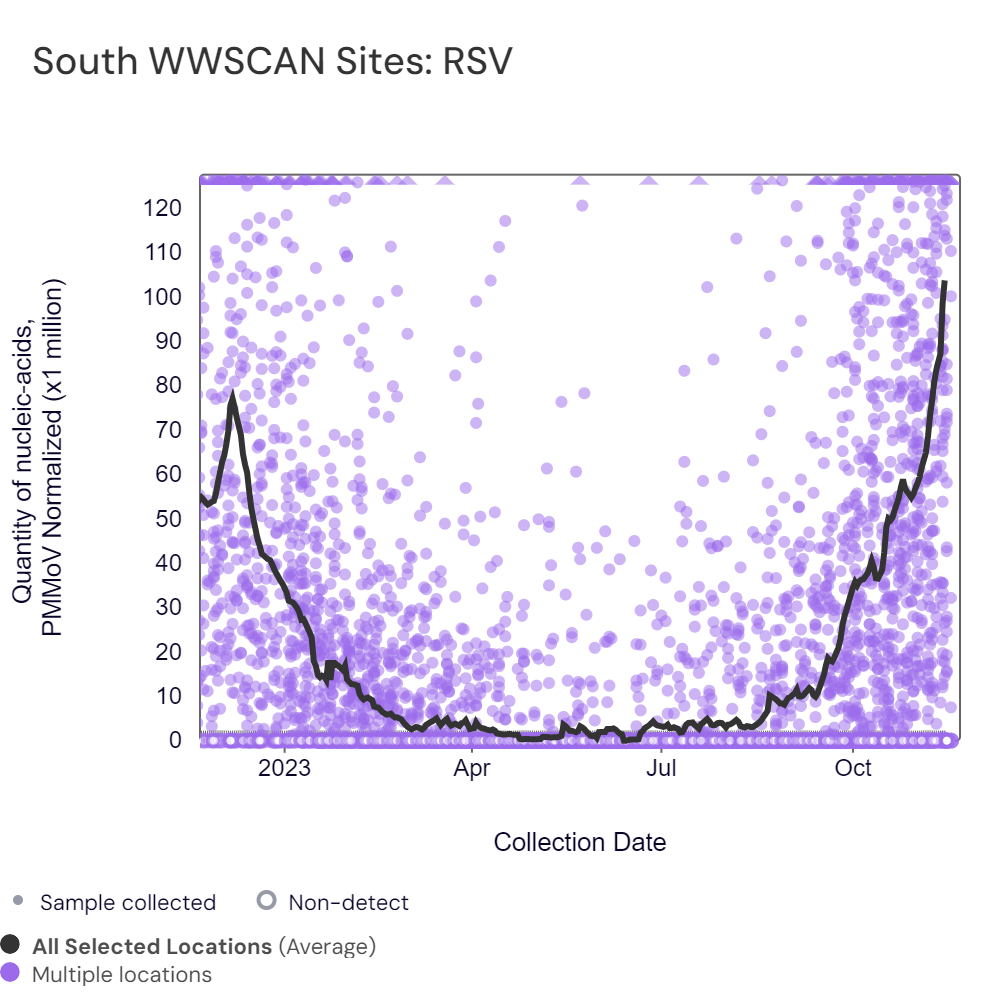
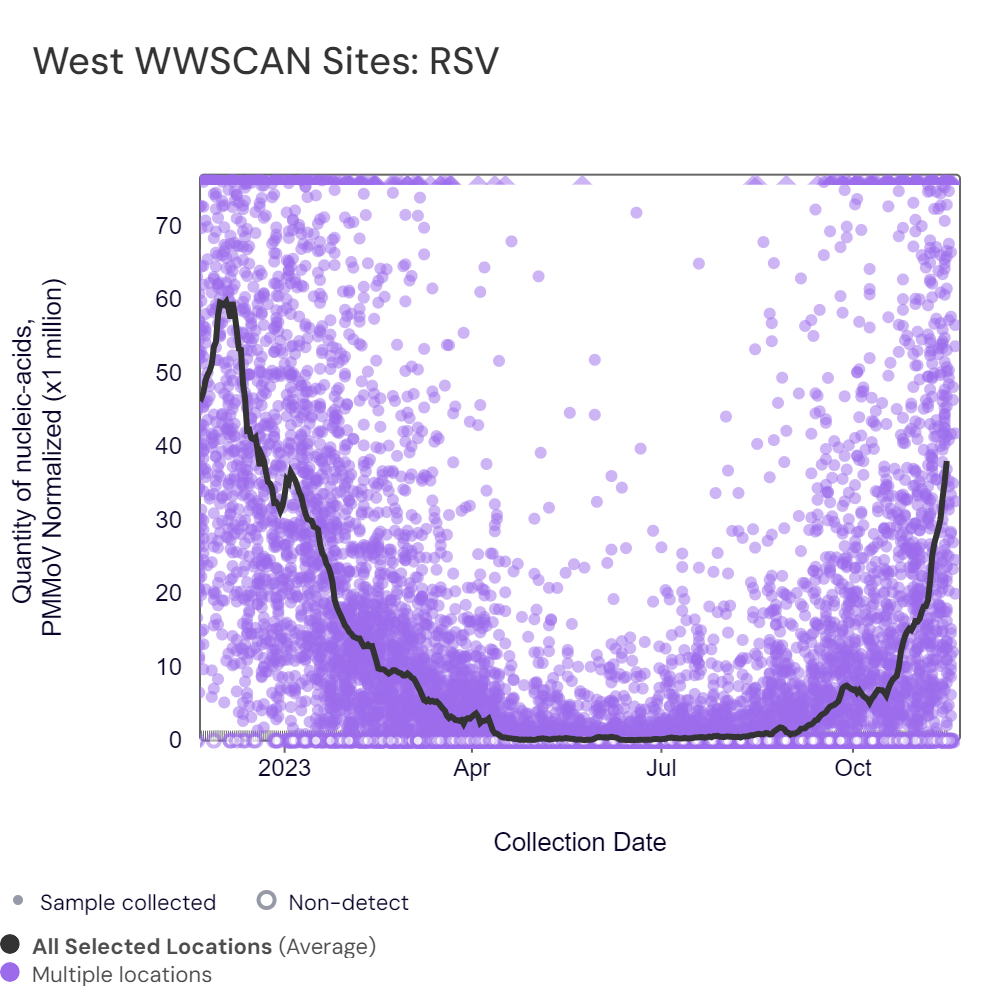
Midwest states: IA, IL, IN, KS, MI, MN, ND, OH, SD, WI. Northeast states: MA, ME, NH, NJ, NY, PA, VT. Southern states: AL, AR, DE, FL, GA, KY, MD, NC, TN, TX, VA, WV. Western States: AK, CA, CO, HI, ID, NV, UT.
Below are the current RSV wastewater categories for all WWSCAN sites, showing at least 96 sites are showing wastewater onset for RSV:
- 67 are in the LOW Wastewater Category
- 0 are in the MEDIUM Wastewater Category
- 96 are in the HIGH Wastewater Category
- 27 do not have enough data to calculate (Coastal, Laguna; Niguel, CA; Fremont, CA; Half Moon Bay, CA; JB Latham, Laguna Niguel, CA; Mammoth, CA; Newark, CA; Pacifica, CA; Regional, Laguna Niguel, CA; South San Diego, CA; Union City, CA; University of California, Davis, CA; Windsor, CA; Winters, CA; Stamford, CT; Blue Plains, Washington, DC; RM Clayton, Atlanta, GA; South River, Atlanta, GA; Utoy Creek, Atlanta, GA; Lander Street, Boise, ID; West Boise, ID; Lewiston, ME; Hollywood, MD; Gautier, MS; Pascagoula Moss Point, MS; Greenville, SC; Memphis, TN; Gainesville, TX)
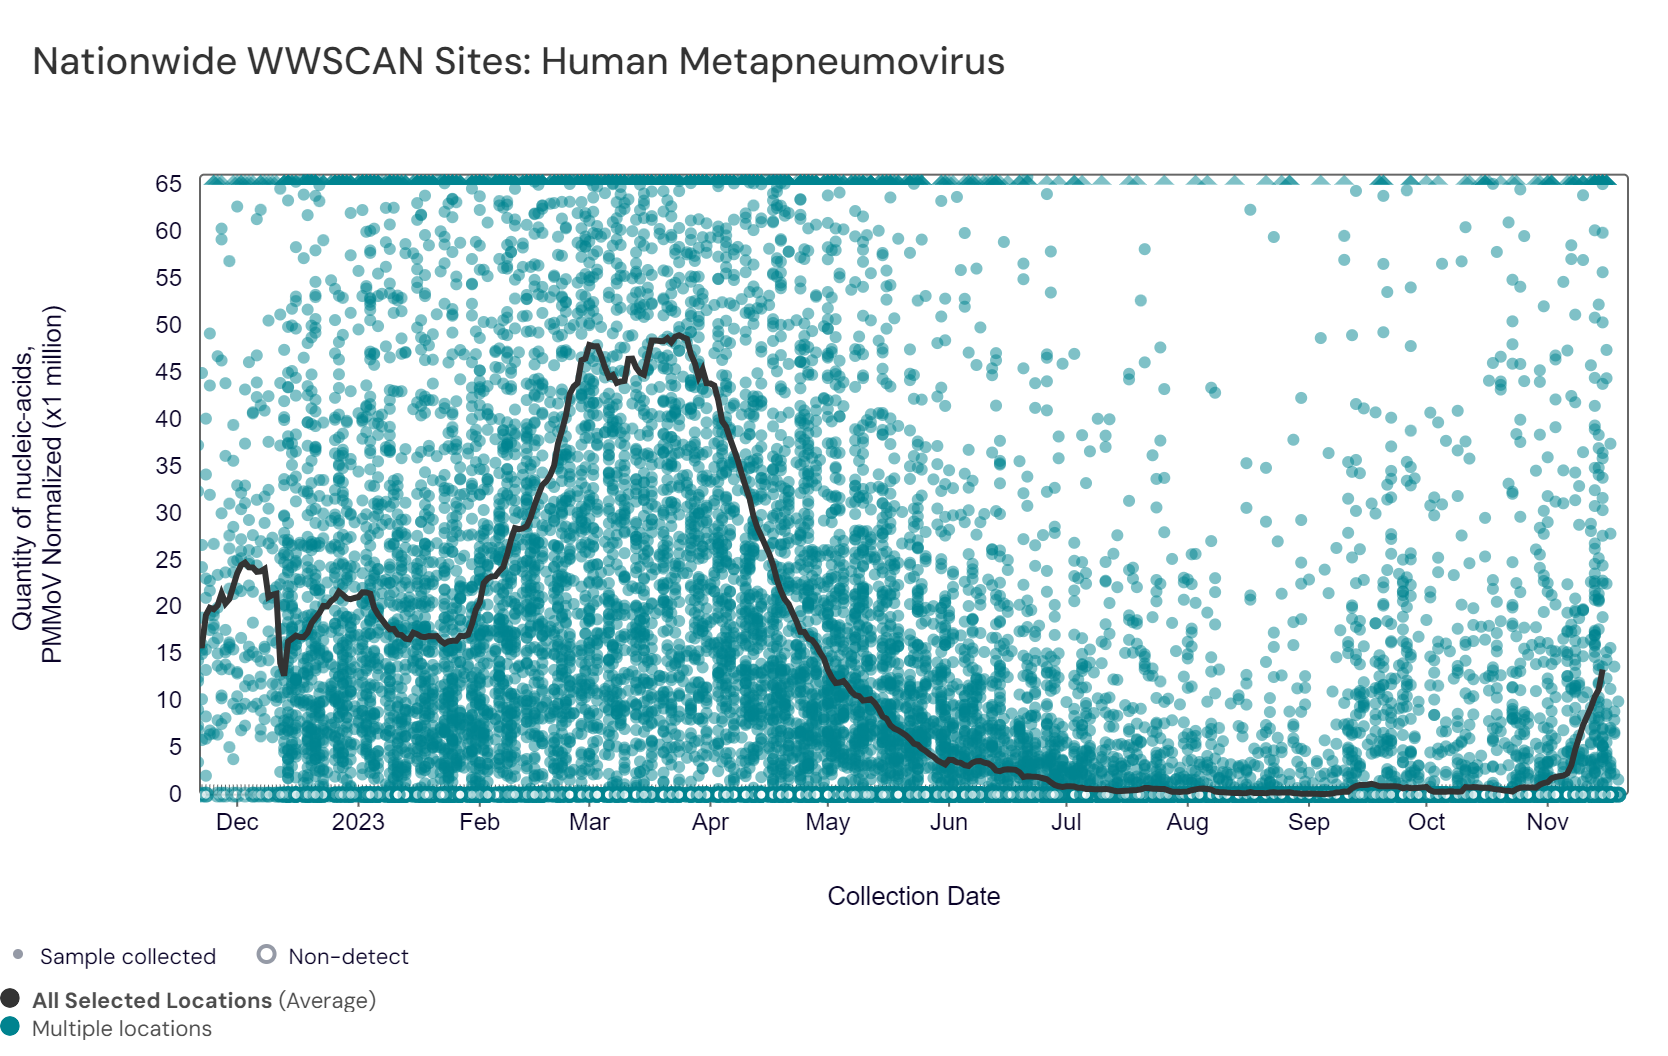
HMPV (human metapneumovirus) RNA median concentrations across all sites over the last 21 days are below the lower detection limit of the assay. There have been 355 positive samples out of 1,334 samples during the past 21 days (~26.6% detection rate). Below are the HMPV RNA concentrations (normalized by PMMoV) from all participating WWSCAN sites across the country over since we started monitoring in late December 2022. The turquoise dots are the raw data and the black line is the population weighted average.
Since the last peak in the spring, concentrations have been relatively low and mostly non-detects. Nationally, HMPV is in the "Low" category, with very few sites showing onset in wastewater. and aggregated measurements showing high concentrations and an upward trend over the past 21 days.
Below are the HMPV RNA concentrations (normalized by PMMoV) from sites in the Midwest US (top left panel), Northeast US (top right panel), Southern US (bottom left panel) and Western US (bottom right panel) since we started monitoring HMPV late December 2022. The population weighted average across regional WWSCAN plants is shown in black, and the raw data are shown as turquoise. Levels have increased particularly sharply in the South.
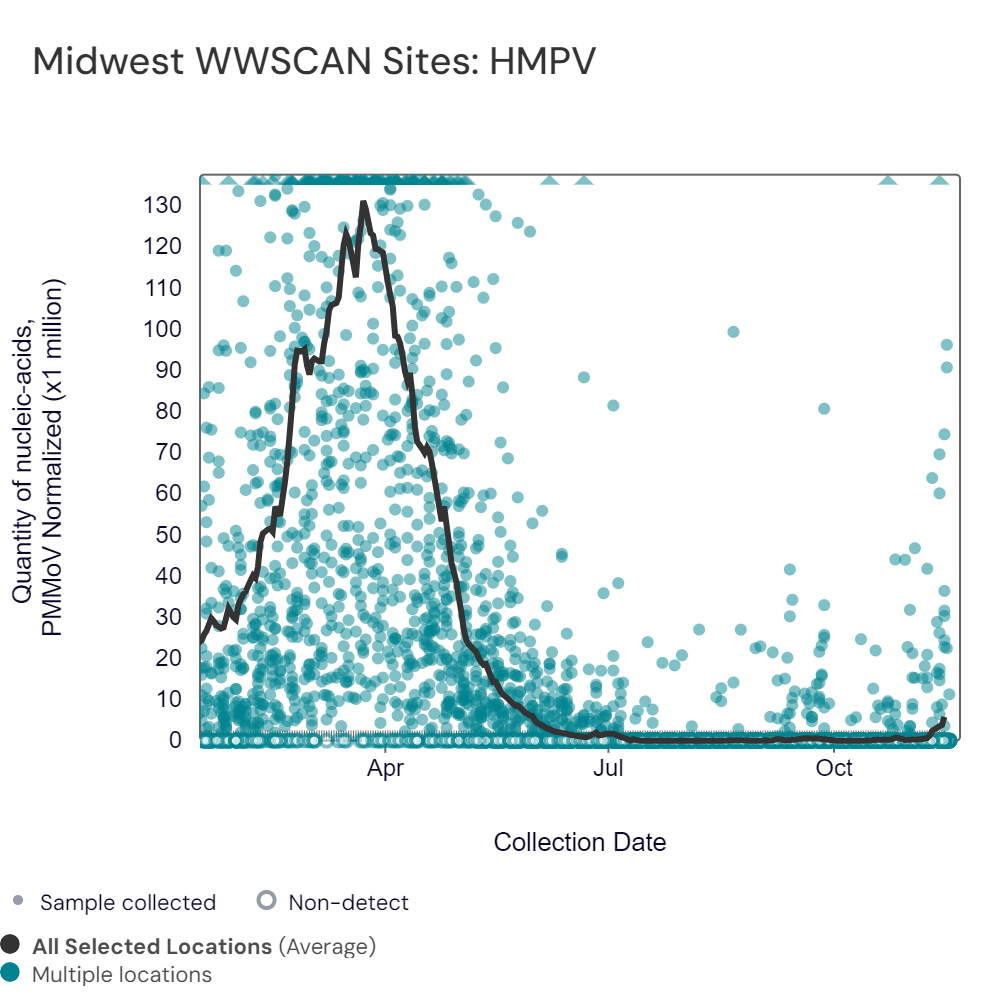
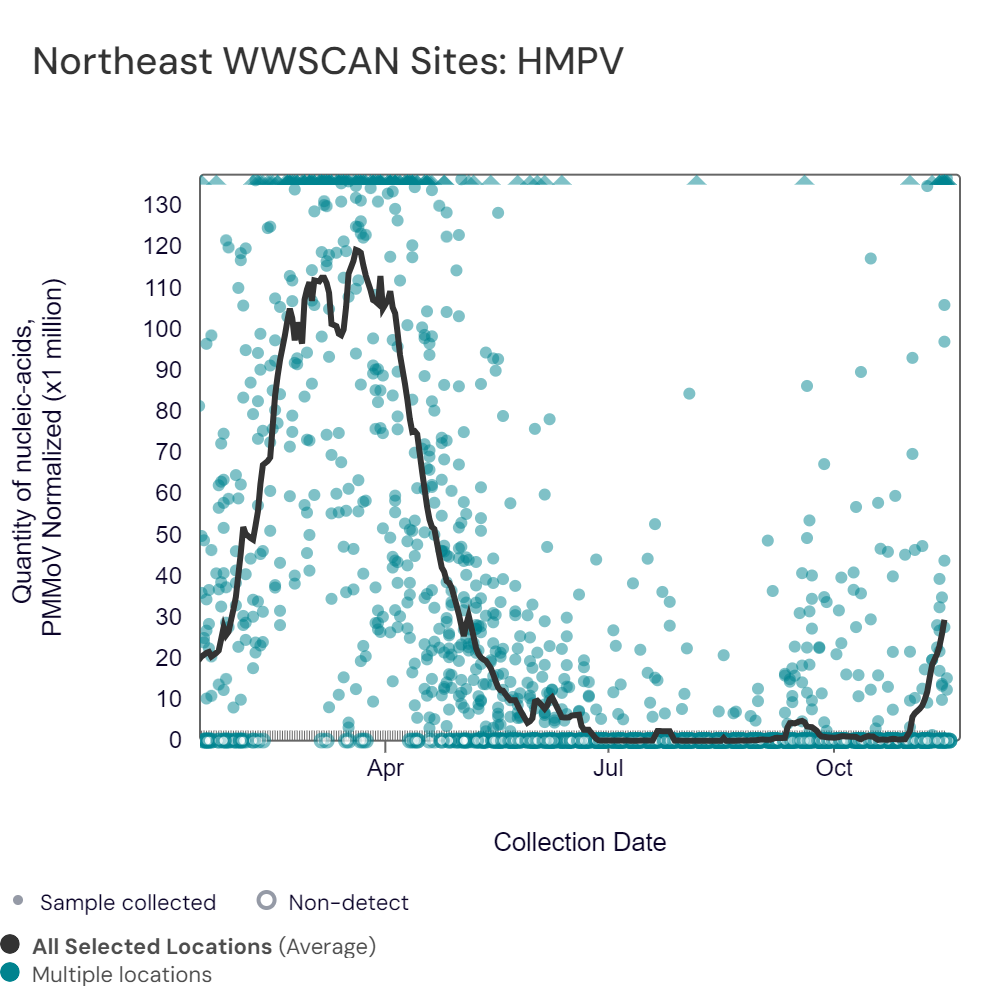
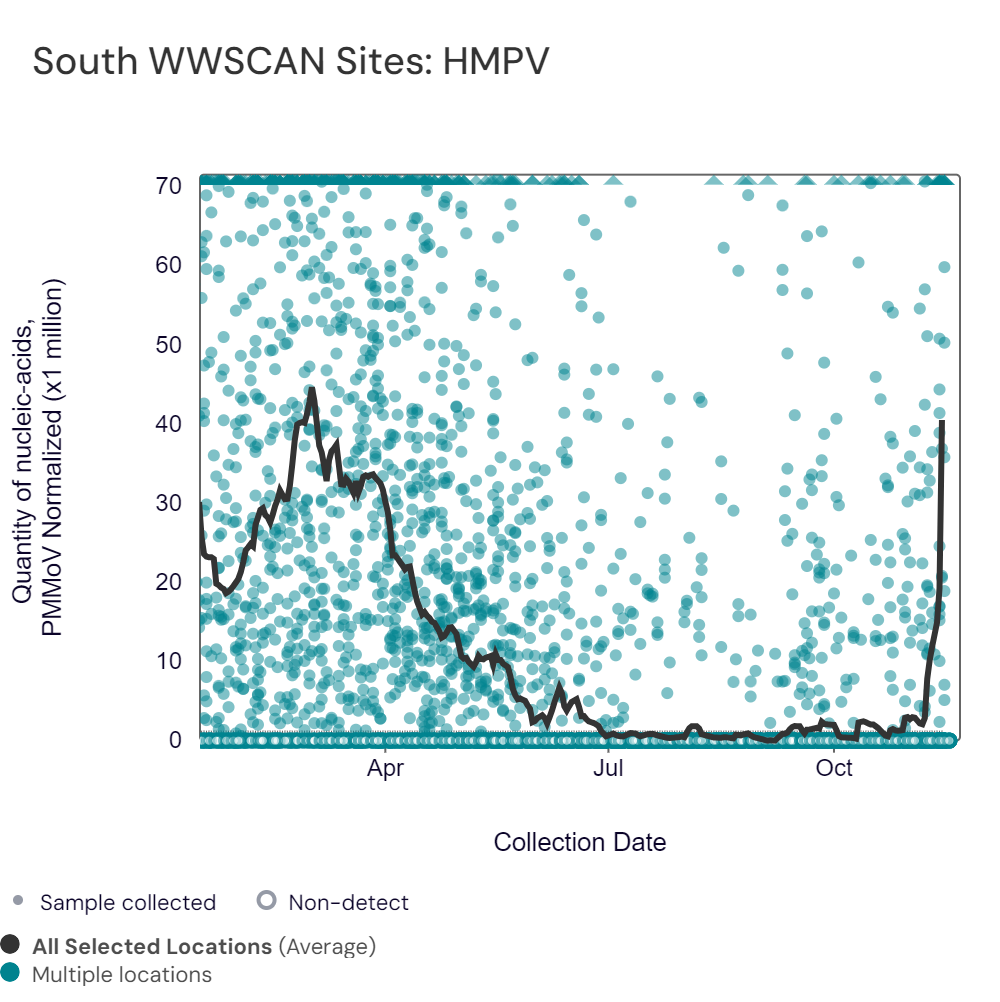
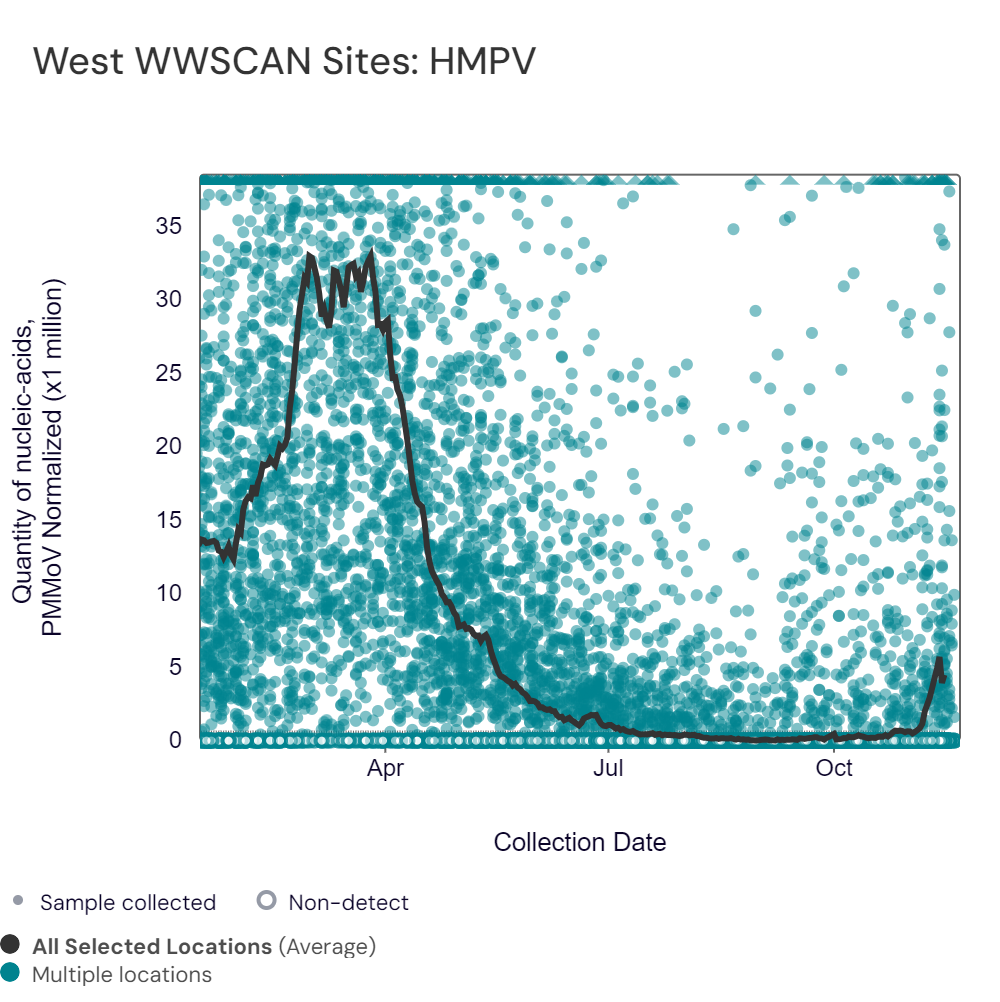
Midwest states: IA, IL, IN, KS, MI, MN, ND, OH, SD, WI. Northeast states: MA, ME, NH, NJ, NY, PA, VT. Southern states: AL, AR, DE, FL, GA, KY, MD, NC, TN, TX, VA, WV. Western States: AK, CA, CO, HI, ID, NV, UT.
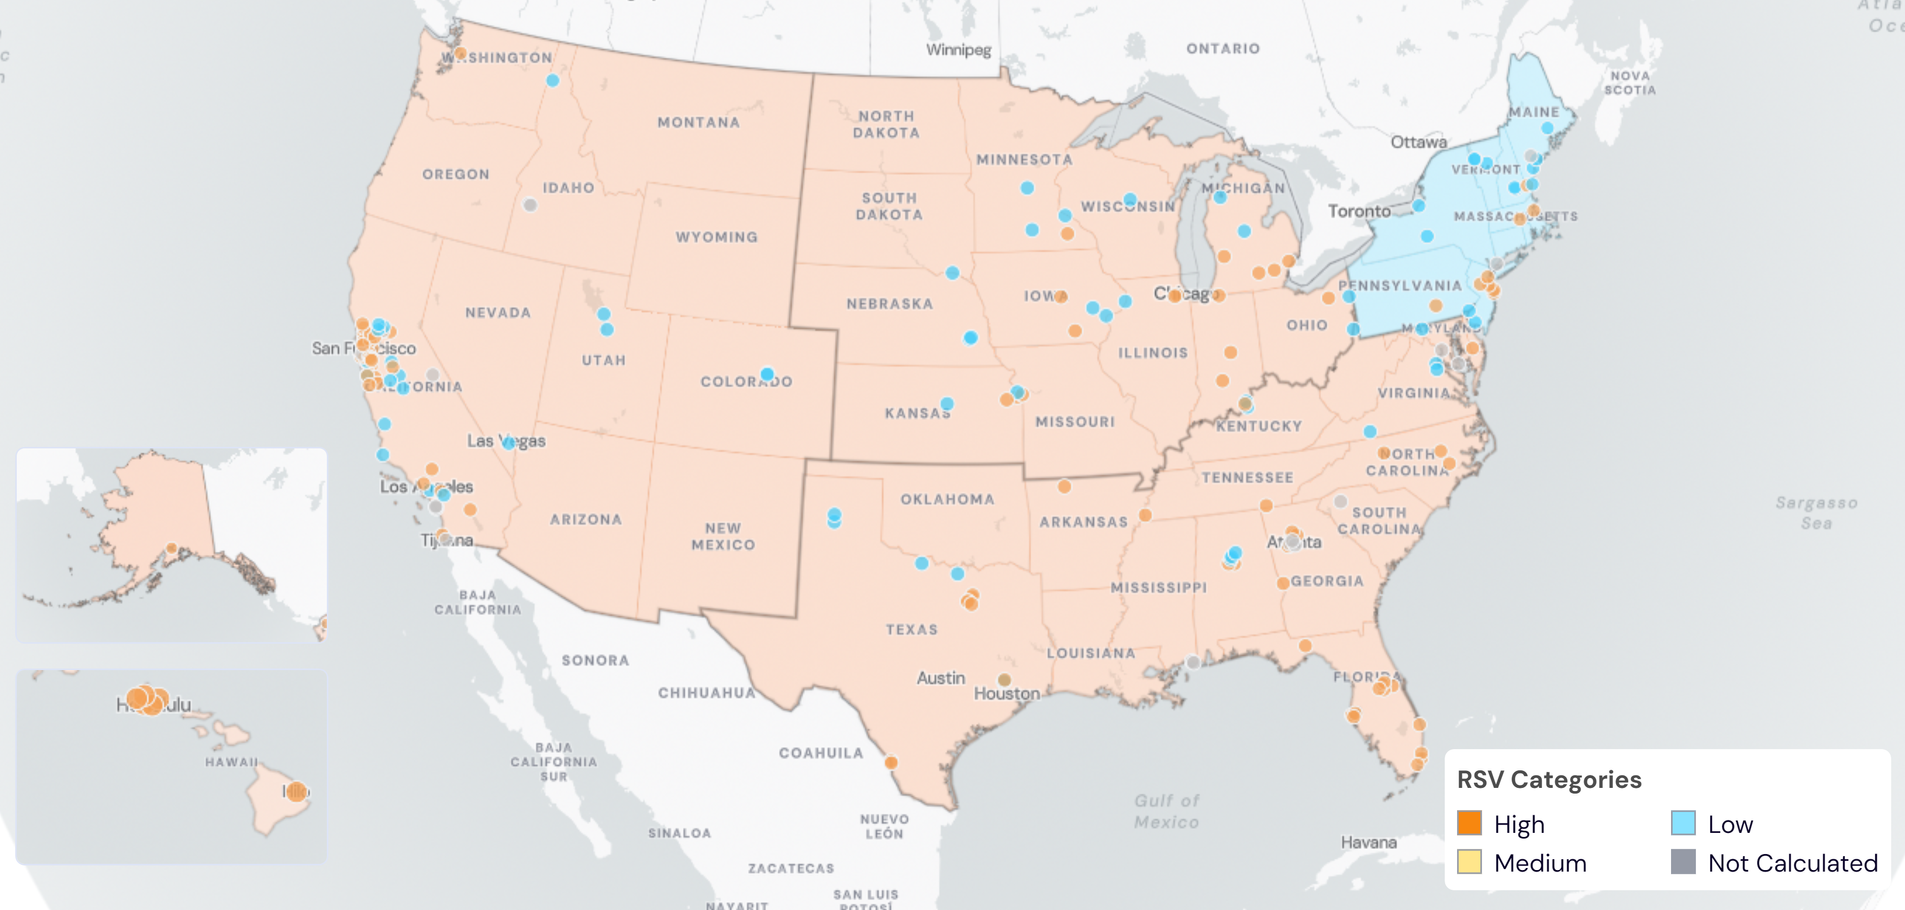
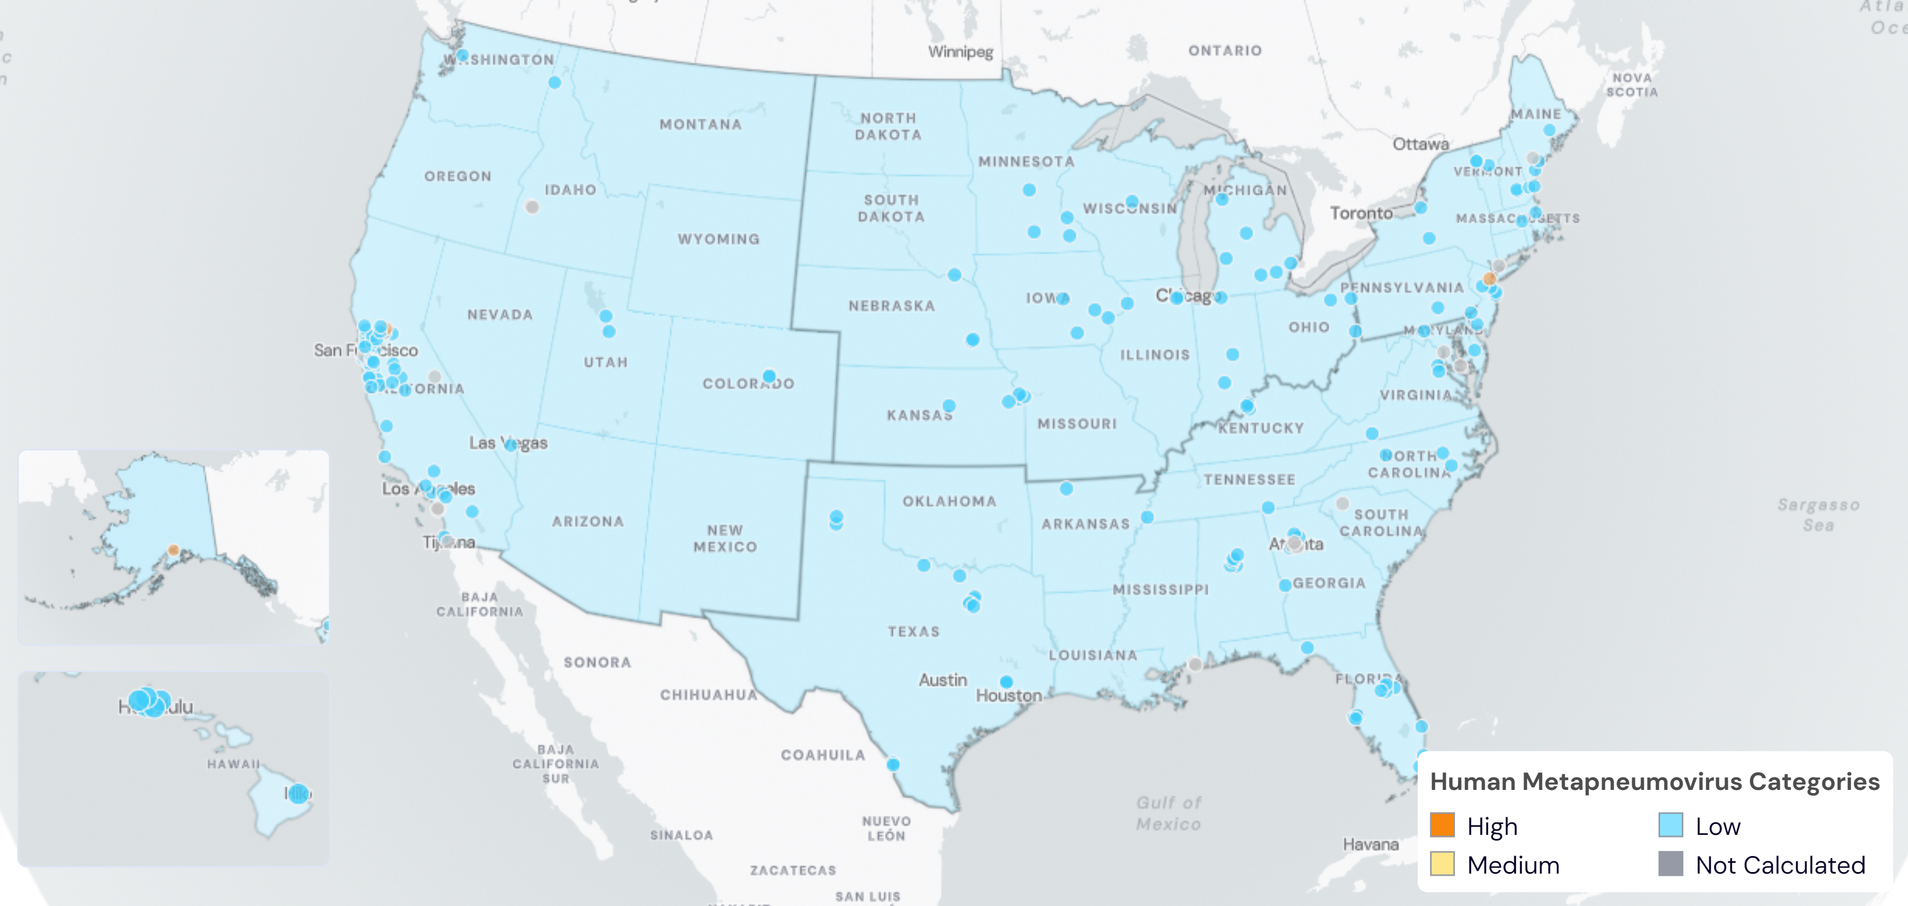
Below are the current HMPV wastewater categories for all WWSCAN sites, showing at least 2 sites are showing wastewater onset for RSV:
- 161 are in the LOW Wastewater Category
- 0 are in the MEDIUM Wastewater Category
- 2 are in the HIGH Wastewater Category
- 27 do not have enough data to calculate (Coastal, Laguna; Niguel, CA; Fremont, CA; Half Moon Bay, CA; JB Latham, Laguna Niguel, CA; Mammoth, CA; Newark, CA; Pacifica, CA; Regional, Laguna Niguel, CA; South San Diego, CA; Union City, CA; University of California, Davis, CA; Windsor, CA; Winters, CA; Stamford, CT; Blue Plains, Washington, DC; RM Clayton, Atlanta, GA; South River, Atlanta, GA; Utoy Creek, Atlanta, GA; Lander Street, Boise, ID; West Boise, ID; Lewiston, ME; Hollywood, MD; Gautier, MS; Pascagoula Moss Point, MS; Greenville, SC; Memphis, TN; Gainesville, TX)
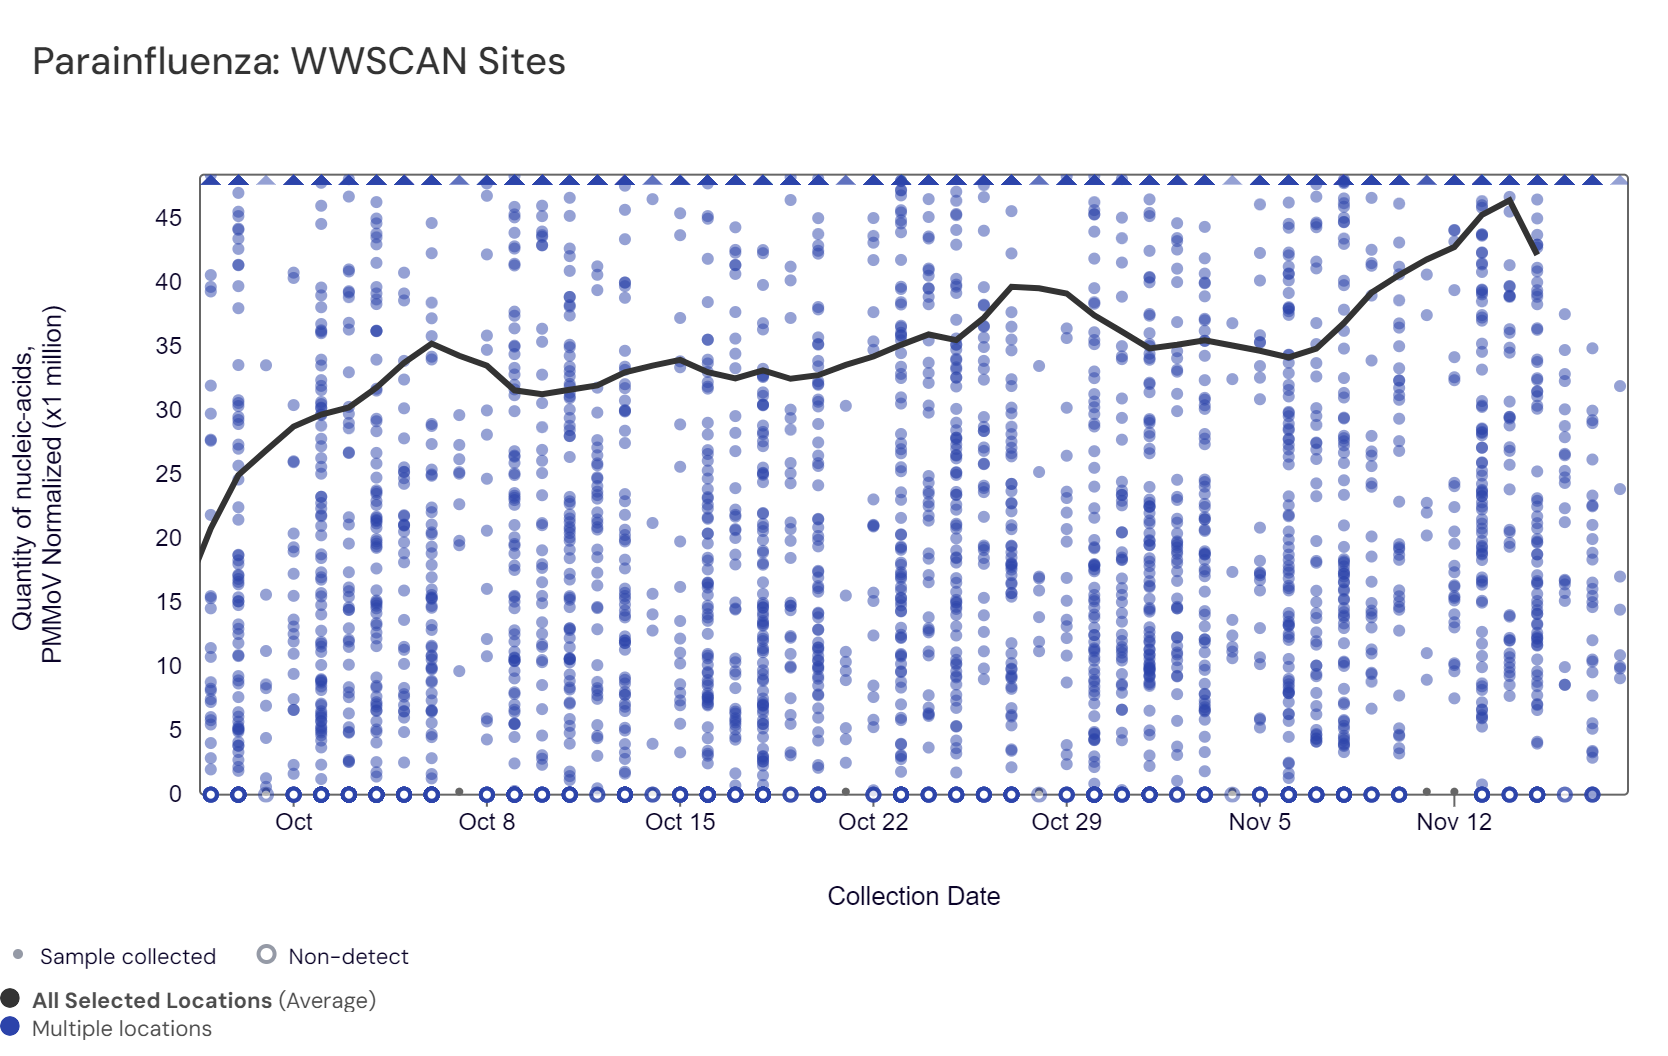
Human Parainfluenza (HPIV) RNA has been detected in ~89.0% of samples collected from WWSCAN sites since monitoring began in September 2023. HPIV median concentrations across all sites over the last 21 days is 11,073 copies/gram. The blue dots are the raw data and the population weighted average line is shown in black. You can interact with the chart of all the plants here. These data will become easier to interpret as we collect more data; we do not have enough data currently to start assessing trends or levels.
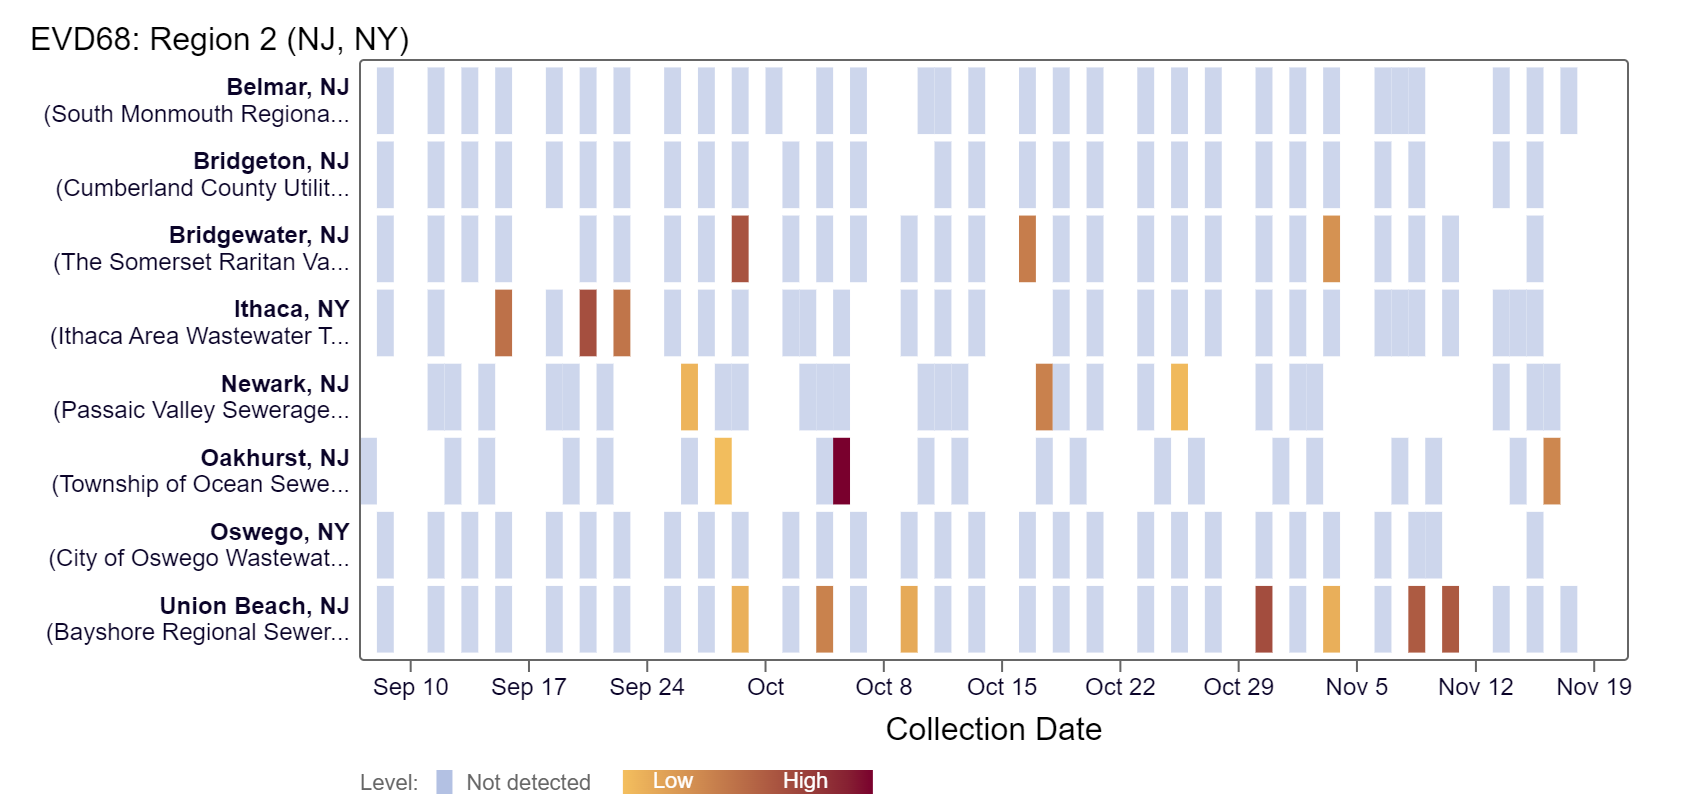
Enterovirus D68 (EV-D68) RNA was sporadically detected in samples collected in the last 21 days at most WWSCAN sites and the median concentration across all sites over the last 21 days is below the level of detection. The heat map below shows all WWSCAN sites in HHS Region 2 as a row, and each date as a column since monitoring began in September 2023. The color blue means the sample was non-detect for EV-D68 RNA and the colors get darker with higher concentrations. White indicates no sample was collected.
Gastrointestinal Pathogens
Norovirus GII, Rotavirus, and Human Adenovirus Group F
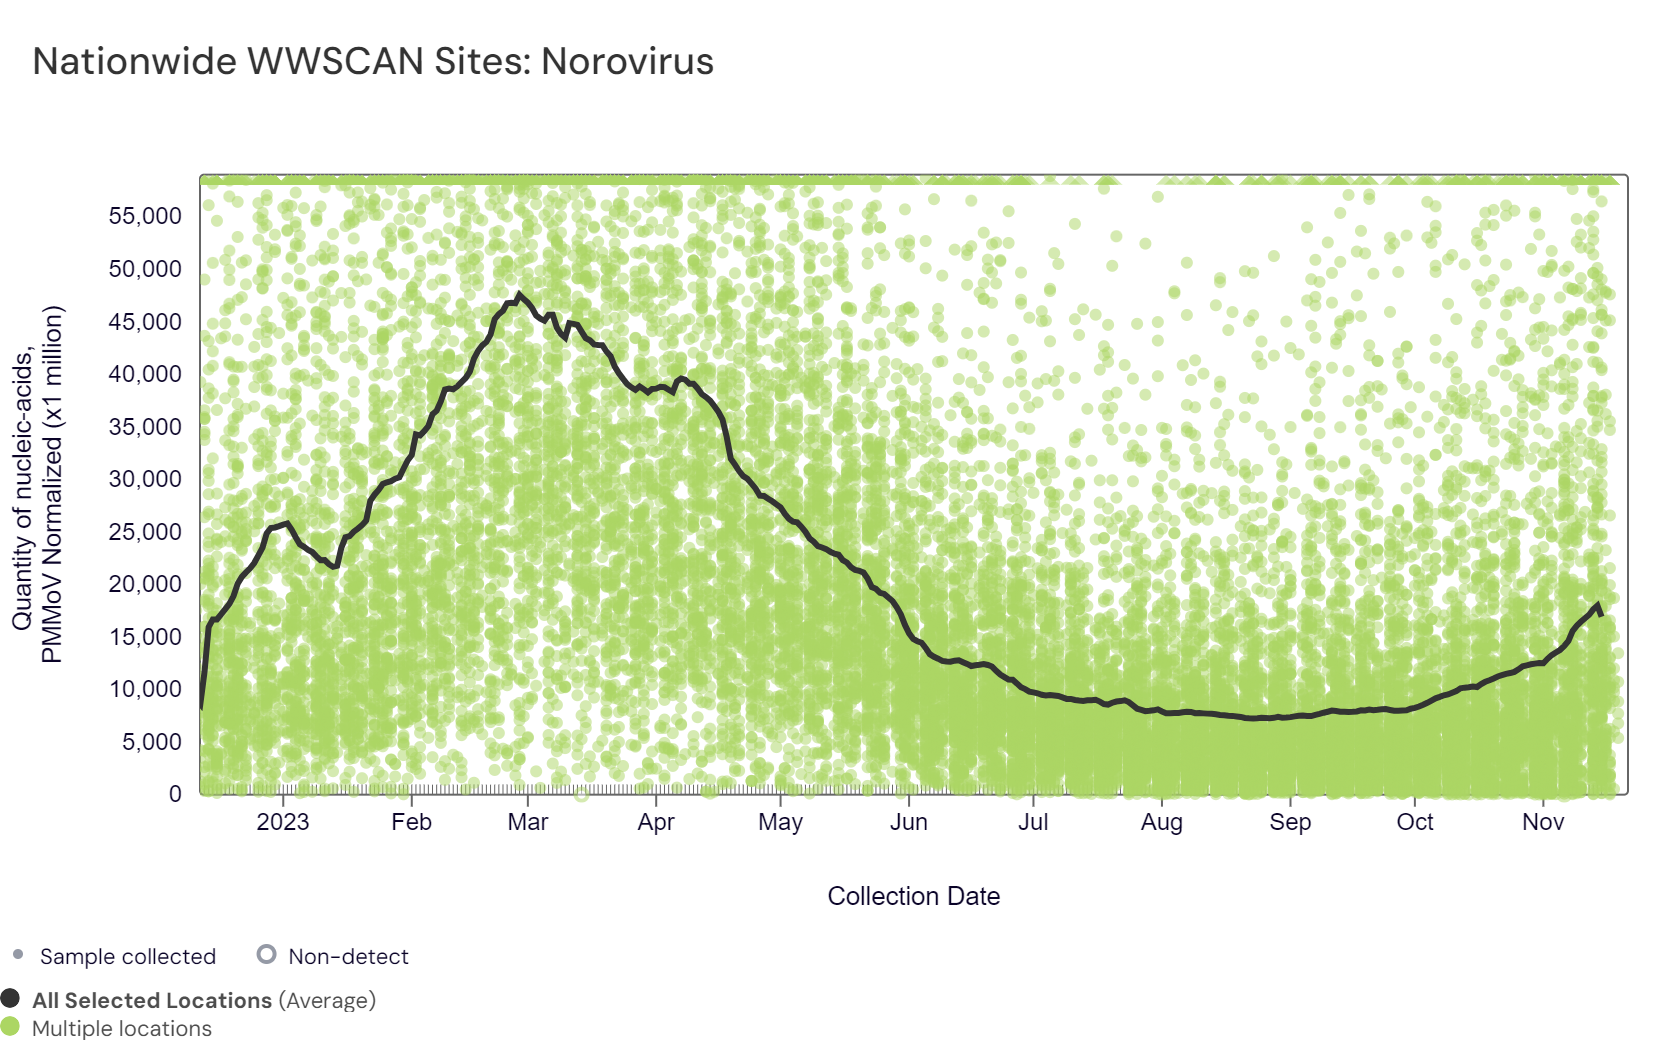
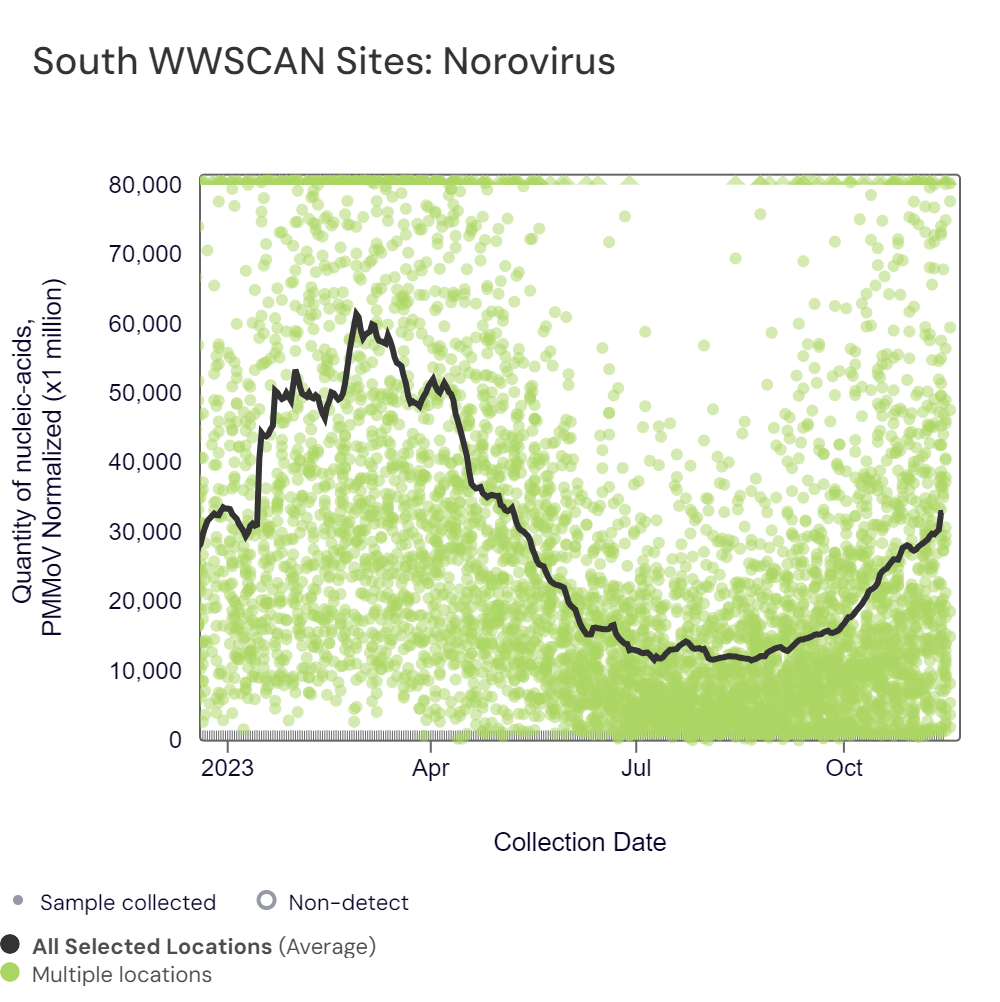
Norovirus GII (HuNoV GII) RNA has been consistently detected at the sites. The median concentration across all sites over the last 21 days is 3,940,719 copies/gram (for reference median concentration in October 2023 was 2,800,000 copies/gram). Below are the HuNoV GII RNA concentrations (normalized by PMMoV) from all participating WWSCAN sites across the country since we started monitoring in late December 2022. The raw data are shown as green dots, and the population weighted average is shown as a black line.
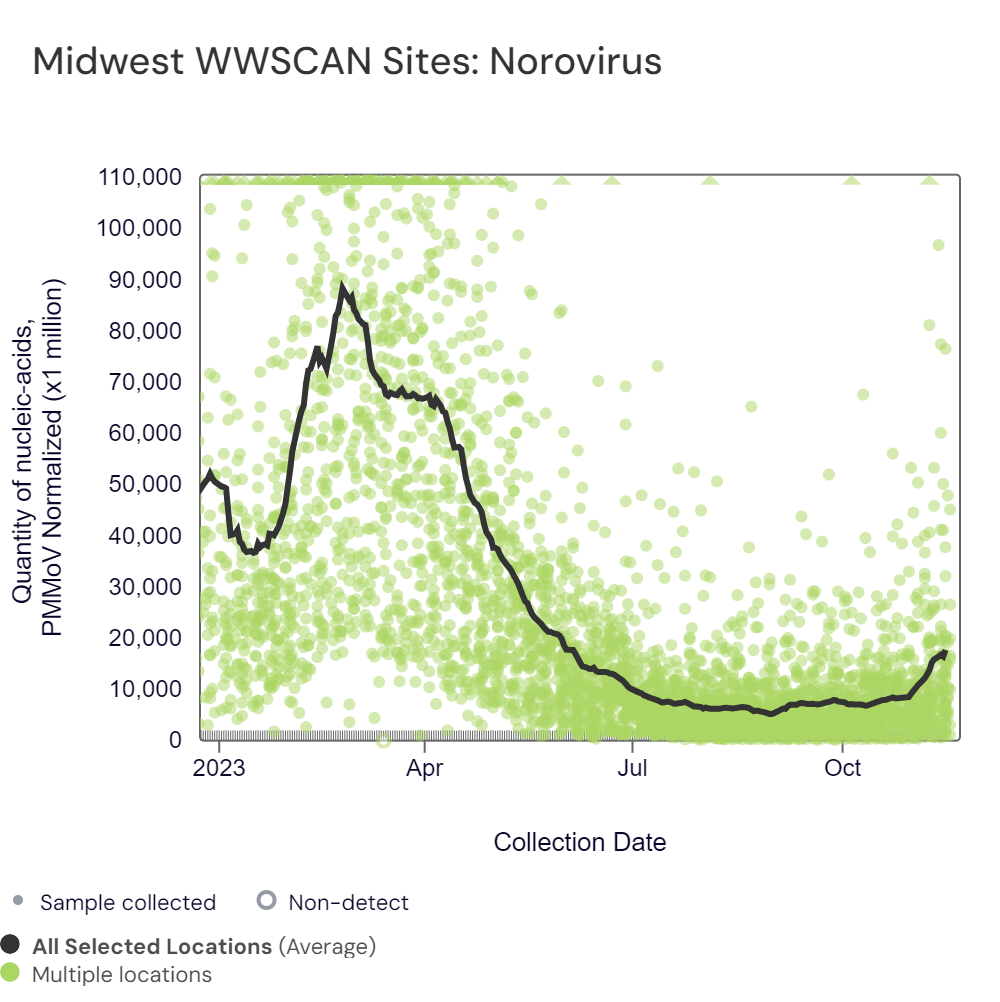
Below are the HuNoV GII RNA concentrations (normalized by PMMoV) from sites in the Midwest US (top left panel), Northeast US (top right panel), Southern US (bottom left panel) and Western US (bottom right panel) since we started monitoring Norovirus late December 2022. The population weighted average across regional WWSCAN plants is shown in black, and raw data are green. In the South, the population-weighted average line suggests that levels have gone up over the last month.


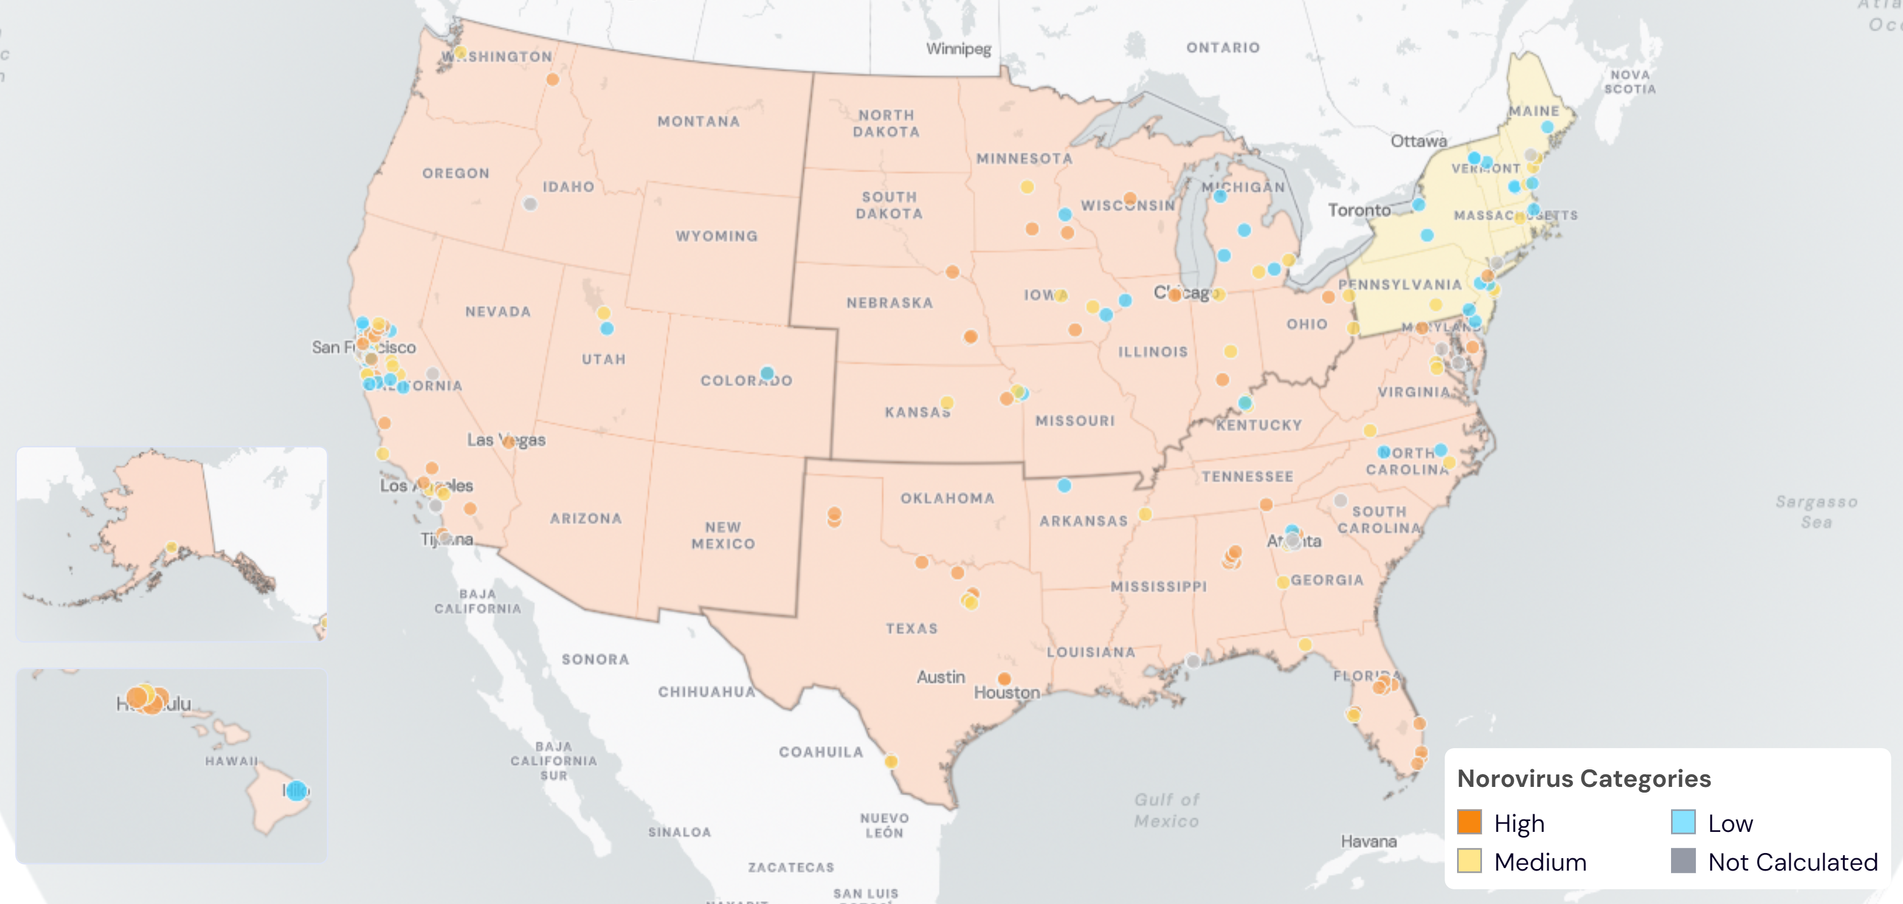
Below are the current Norovirus wastewater categories for ALL WWSCAN sites:
- 42 are in the LOW Wastewater Category
- 50 are in the MEDIUM Wastewater Category
- 71 are in the HIGH Wastewater Category
- 27 do not have enough data to calculate (Coastal, Laguna; Niguel, CA; Fremont, CA; Half Moon Bay, CA; JB Latham, Laguna Niguel, CA; Mammoth, CA; Newark, CA; Pacifica, CA; Regional, Laguna Niguel, CA; South San Diego, CA; Union City, CA; University of California, Davis, CA; Windsor, CA; Winters, CA; Stamford, CT; Blue Plains, Washington, DC; RM Clayton, Atlanta, GA; South River, Atlanta, GA; Utoy Creek, Atlanta, GA; Lander Street, Boise, ID; West Boise, ID; Lewiston, ME; Hollywood, MD; Gautier, MS; Pascagoula Moss Point, MS; Greenville, SC; Memphis, TN; Gainesville, TX)
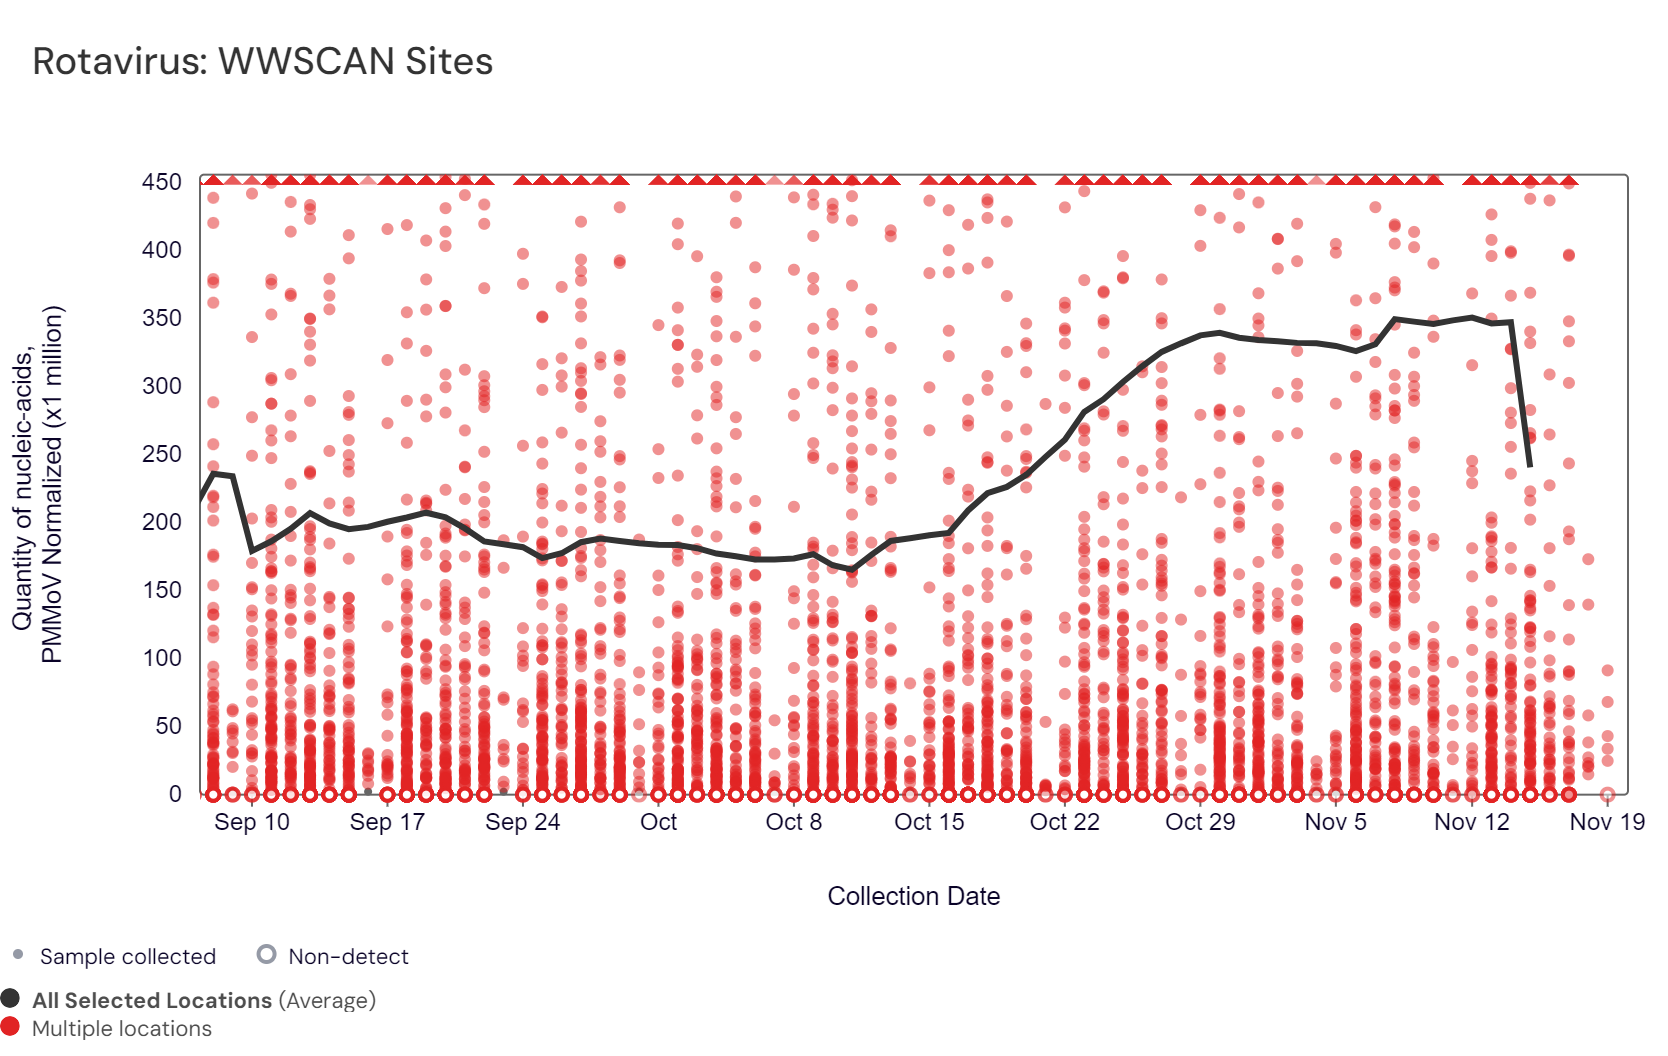
Rotavirus RNA concentrations are shown in the chart below; all the WWSCAN plants are shown together. Rotavirus median concentrations across all sites over the last 21 days is 25,679 copies/gram. For reference, median concentration in October 2023 was 11,900 copies/gram. The red dots are the raw data and the population weighted average line is shown in black. You can interact with the chart of all the plants here. As we collect more data, we will be better able to interpret trends and levels of this pathogen.
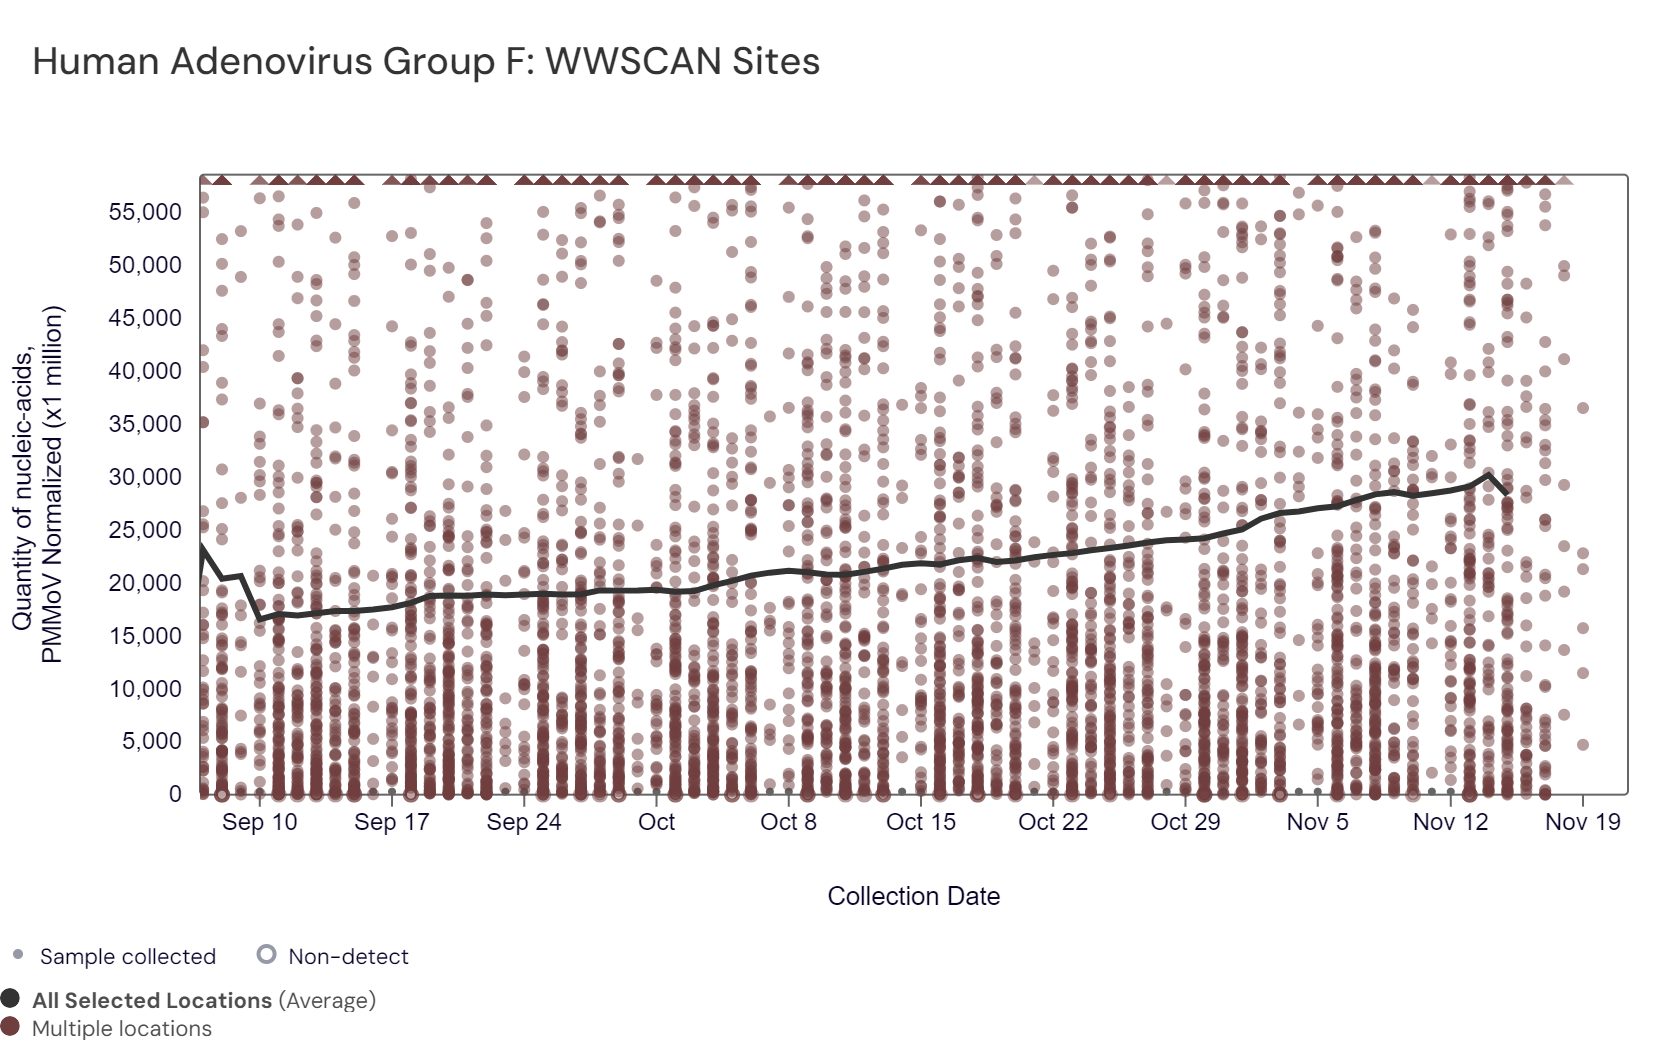
Human Adenovirus Group F DNA has been detected in ~99.6 % of samples collected from WWSCAN sites in the past 21 days. Human Adenovirus Group F median concentrations across all sites over the last 21 days is 6,191,236 copies/gram (for reference median concentration in October 2023 was 5,280,000 copies/gram). Concentrations are shown in the chart below; all the WWSCAN plants are shown together. The brown dots are the raw data and the population weighted average line is shown in black. You can interact with the chart of all the plants here. As we collect more data, we will be better able to interpret trends and levels of this pathogen.
Other Pathogens of Concern
Mpox, Candida auris, and Hepatitis A
Mpox DNA We have only detected mpox DNA in 4 samples from sites in the past month. The chart below plants in HHS region 7 as rows, and the last 21 days as columns (labeled at the bottom axis). White indicates no samples, blue is non-detect for mpox DNA and red is detect for mpox DNA.
The wastewater categorization for Mpox at 163 sites is LOW. Twenty-seven sites did not have enough data to calculate a category.

Candida auris (C.auris) DNA - We have detected C. auris DNA in 1.4% of samples from all WWSCAN sites over the past three-weeks. The chart below shows every WWSCAN plant in HHS Region 4 as rows, and the last 21 days as columns (labeled at the bottom axis). White indicates no samples, blue is non-detect for C. auris DNA and red is detect for C. auris DNA.

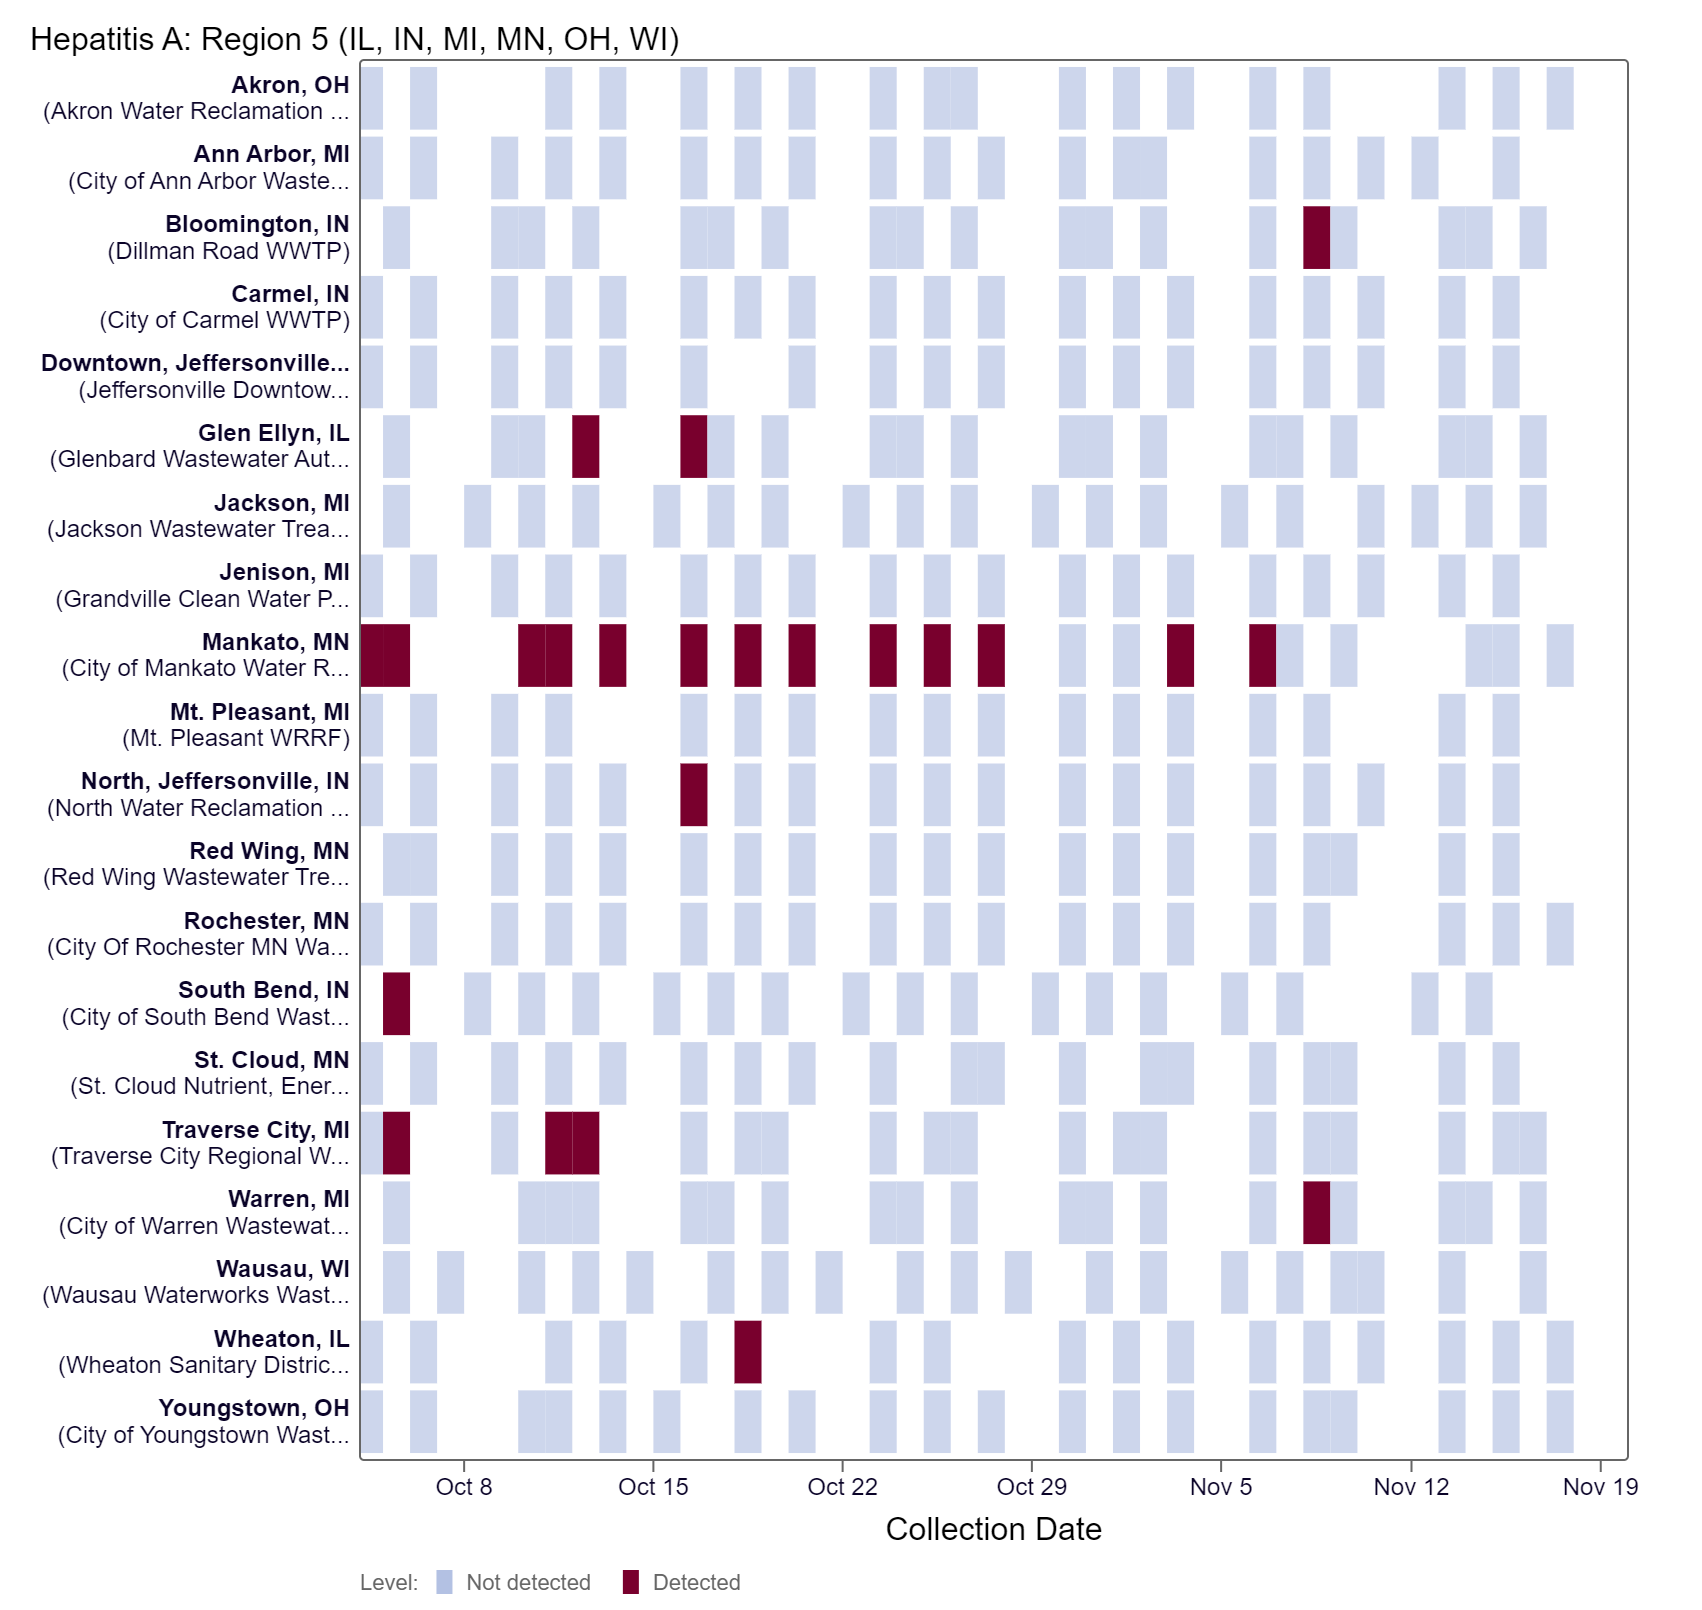
Hepatitis A (Hep A) RNA - We have detected Hep A DNA in 13.9% of samples from all WWSCAN sites over the past three-weeks. The chart below shows every WWSCAN plant in HHS Region 5 as rows, and the last 21 days as columns (labeled at the bottom axis). White indicates no samples, blue is non-detect for Hep A RNA and red is detect for Hep A RNA.
WWSCAN protocols and methods in peer reviewed publications
Protocols (Pre-analytical methods and SARS-CoV-2 analytical methods including controls):
- High Throughput RNA Extraction and PCR Inhibitor Removal of Settled Solids for Wastewater Surveillance of SARS-CoV-2 RNA
- High Throughput pre-analytical processing of wastewater settled solids for SARS-CoV-2 RNA analyses
- Quantification of SARS-CoV-2 variant mutations (HV69-70, E484K/N501Y, del156-157/R158G, del143-145, LPPA24S, S:477-505, and ORF1a Del 141-143) in settled solids using digital RT-PCR
- High Throughput SARS-COV-2, PMMoV, and BCoV quantification in settled solids using digital RT-PCR
Pre-prints and peer-reviewed publications provided WWSCAN methods:
- SARS-CoV-2
- Influenza, Human metapneumovirus, Respiratory syncytial virus, Human parainfluenza
- Mpox
- Norovirus GII
- Adenovirus group F, Rotavirus, Candida auris, Hepatitis A
- Enterovirus D68
Join us at the next WWSCAN Stakeholder call on December 8th, 2023
You can use this zoom link to join. We hope to see you there!
If you have questions about the website or anything else, please email: wwscan_stanford_emory@lists.stanford.edu.