
Nationwide WWSCAN Update 7/28/23
Hi everyone,
This newsletter contains updates on the WastewaterSCAN program with wastewater samples collected through July 25, 2023. Below you will find information on the program in terms of participating partners, review of targets being measured, as well as trends in concentrations of infectious disease targets.
We have a new peer reviewed publication using WWSCAN data from 8 Bay Area sites: More than a Tripledemic: Influenza A Virus, Respiratory Syncytial Virus, SARS-CoV-2, and Human Metapneumovirus in Wastewater during Winter 2022 - 2023. Here is a link to the paper which is open access: link.
Enjoy your weekend,
Ali & Marlene
Participating Plants
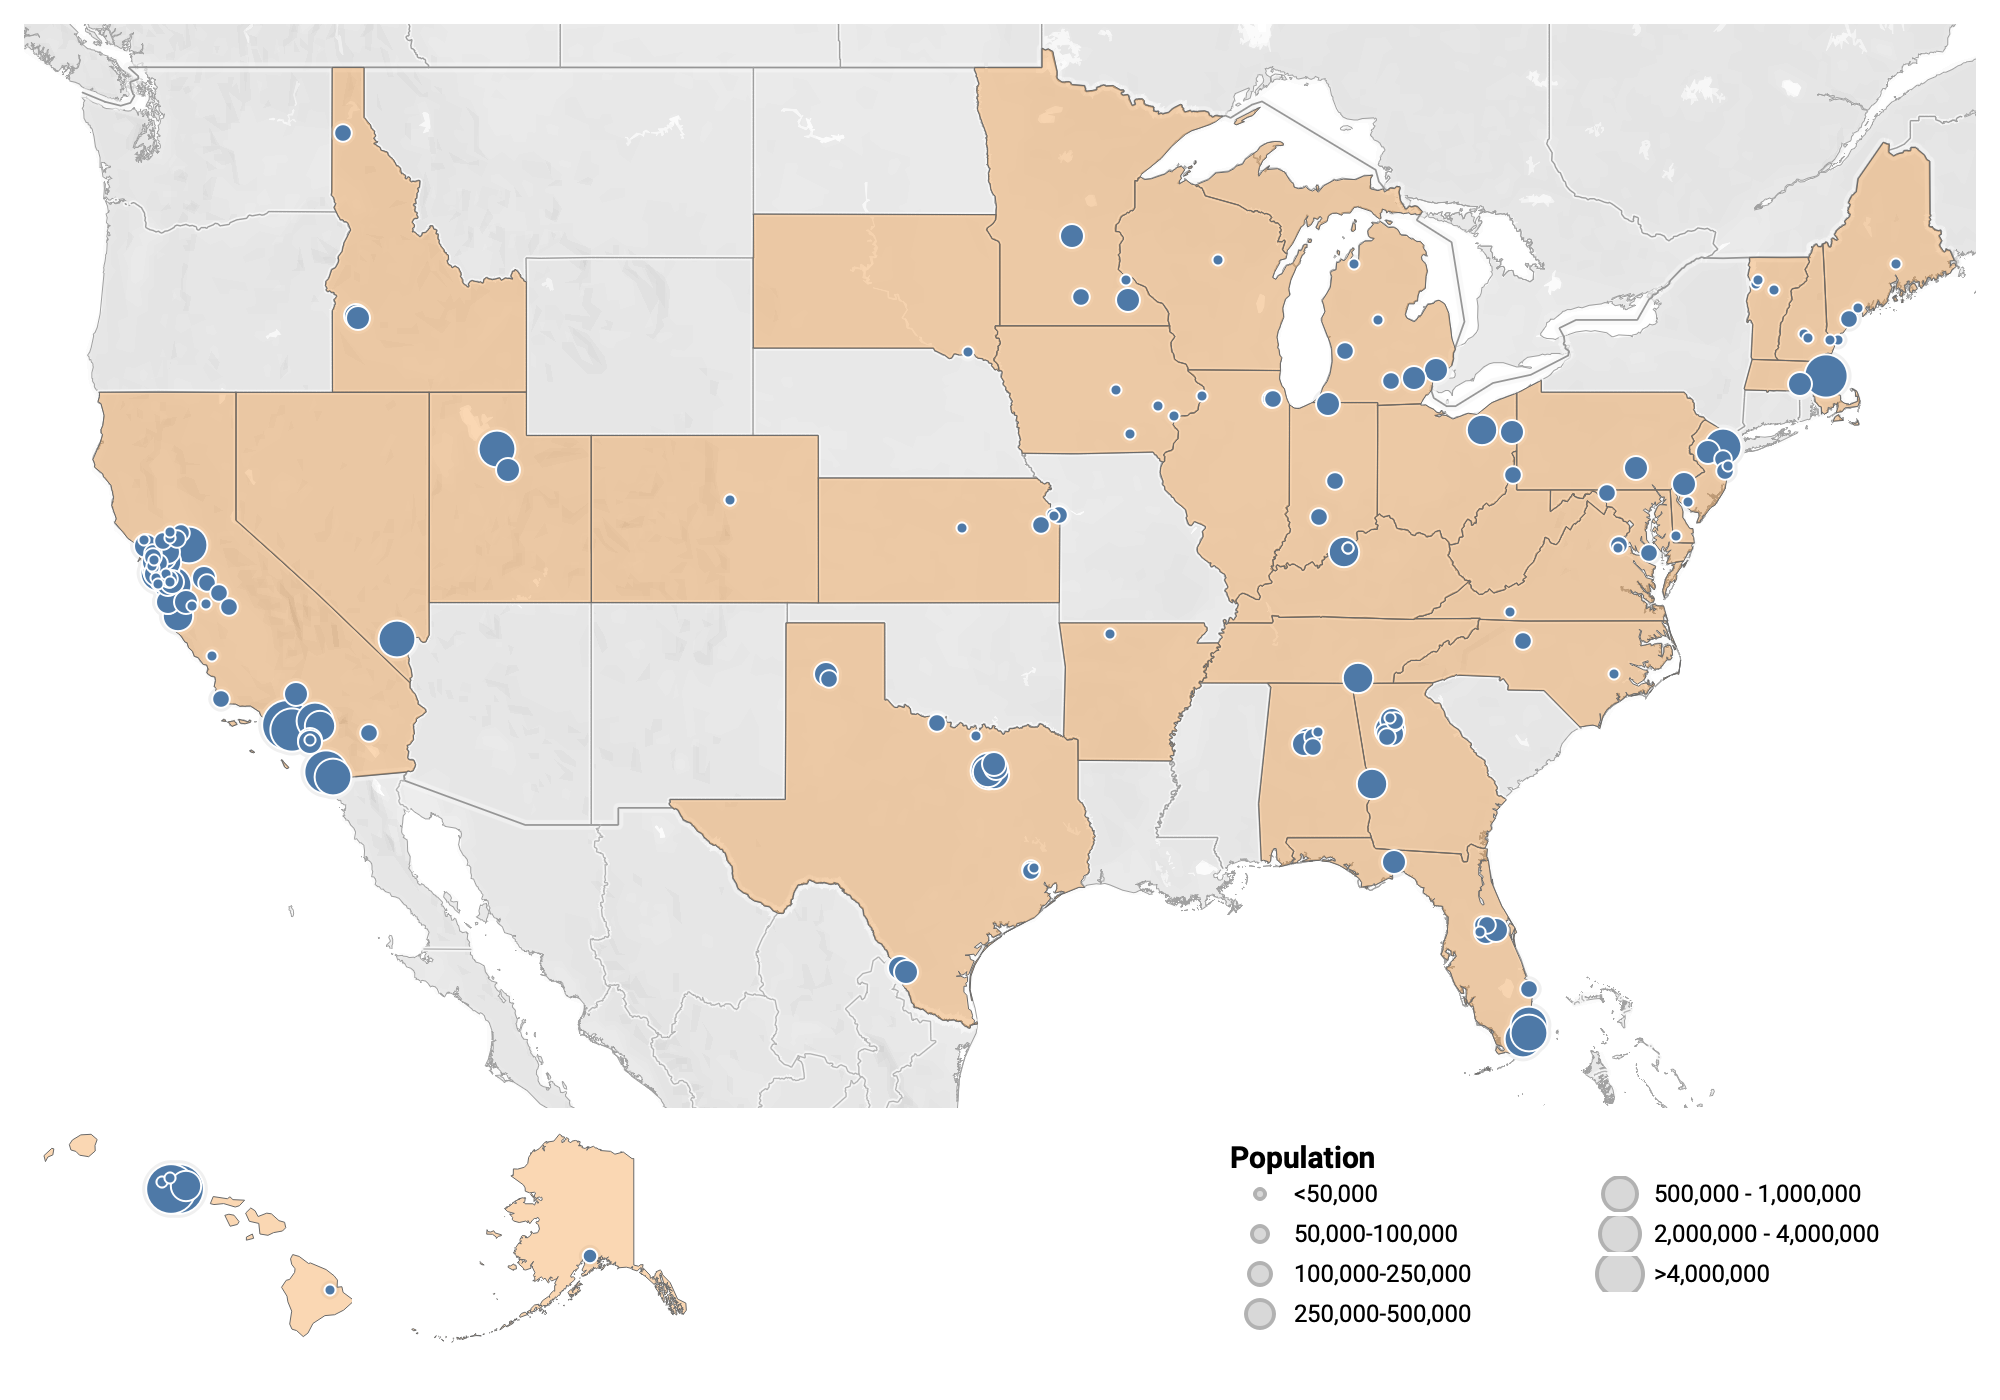
171 plants from 34 states are sampling, which represents ~12% of the US population
WWSCAN Participant Stats:
- 171 plants sampling
- 41,619,905 people covered through sampling efforts
- 34 states represented
- 102 counties represented
- 5 new onboarded sites - St. Petersburg, FL, Memphis, TN, Oswego, NY*, Ithaca, NY*, Lincoln, NE* (*= new state)
Recently Added Site Features
We've added Site grid PDF downloads, National levels & Historic site levels to help better provide context for where current wastewater levels are compared to the past
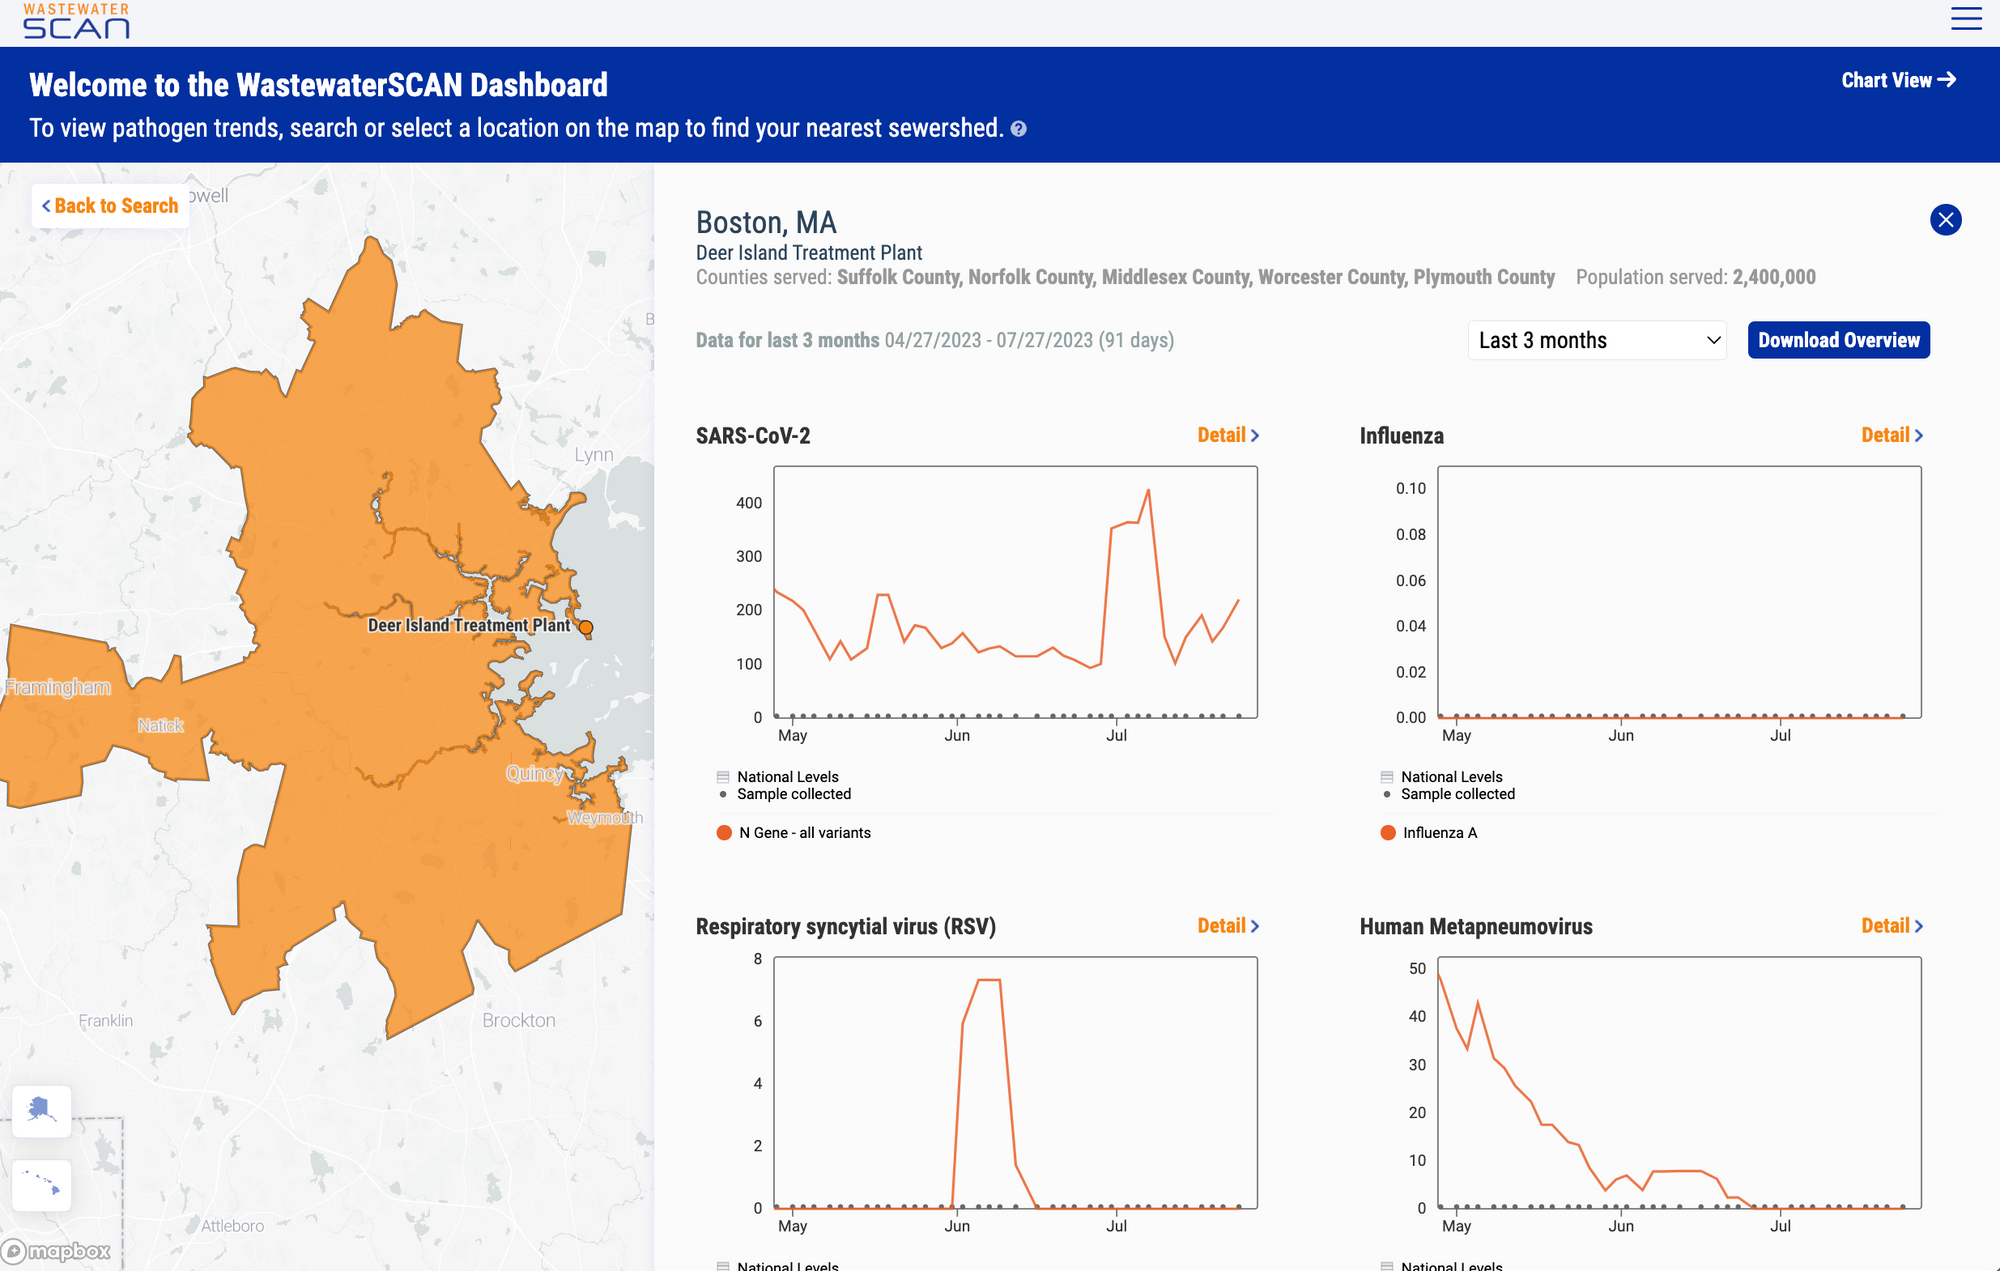
Site grid view PDF Download
This new feature provides a high level overview of current WW levels for all pathogens measured at a particular location. In the downloadable PDF, you will find hyperlinked plots embedded in the PDF that will take user directly to charts in their web browser. These PDFs are useful for sharing both short and long term data with colleagues, public health officials, family and friends.
In future updates to the Site grid view, we will be adding information on trends and WW levels for each pathogen. Stay tuned!
National Levels
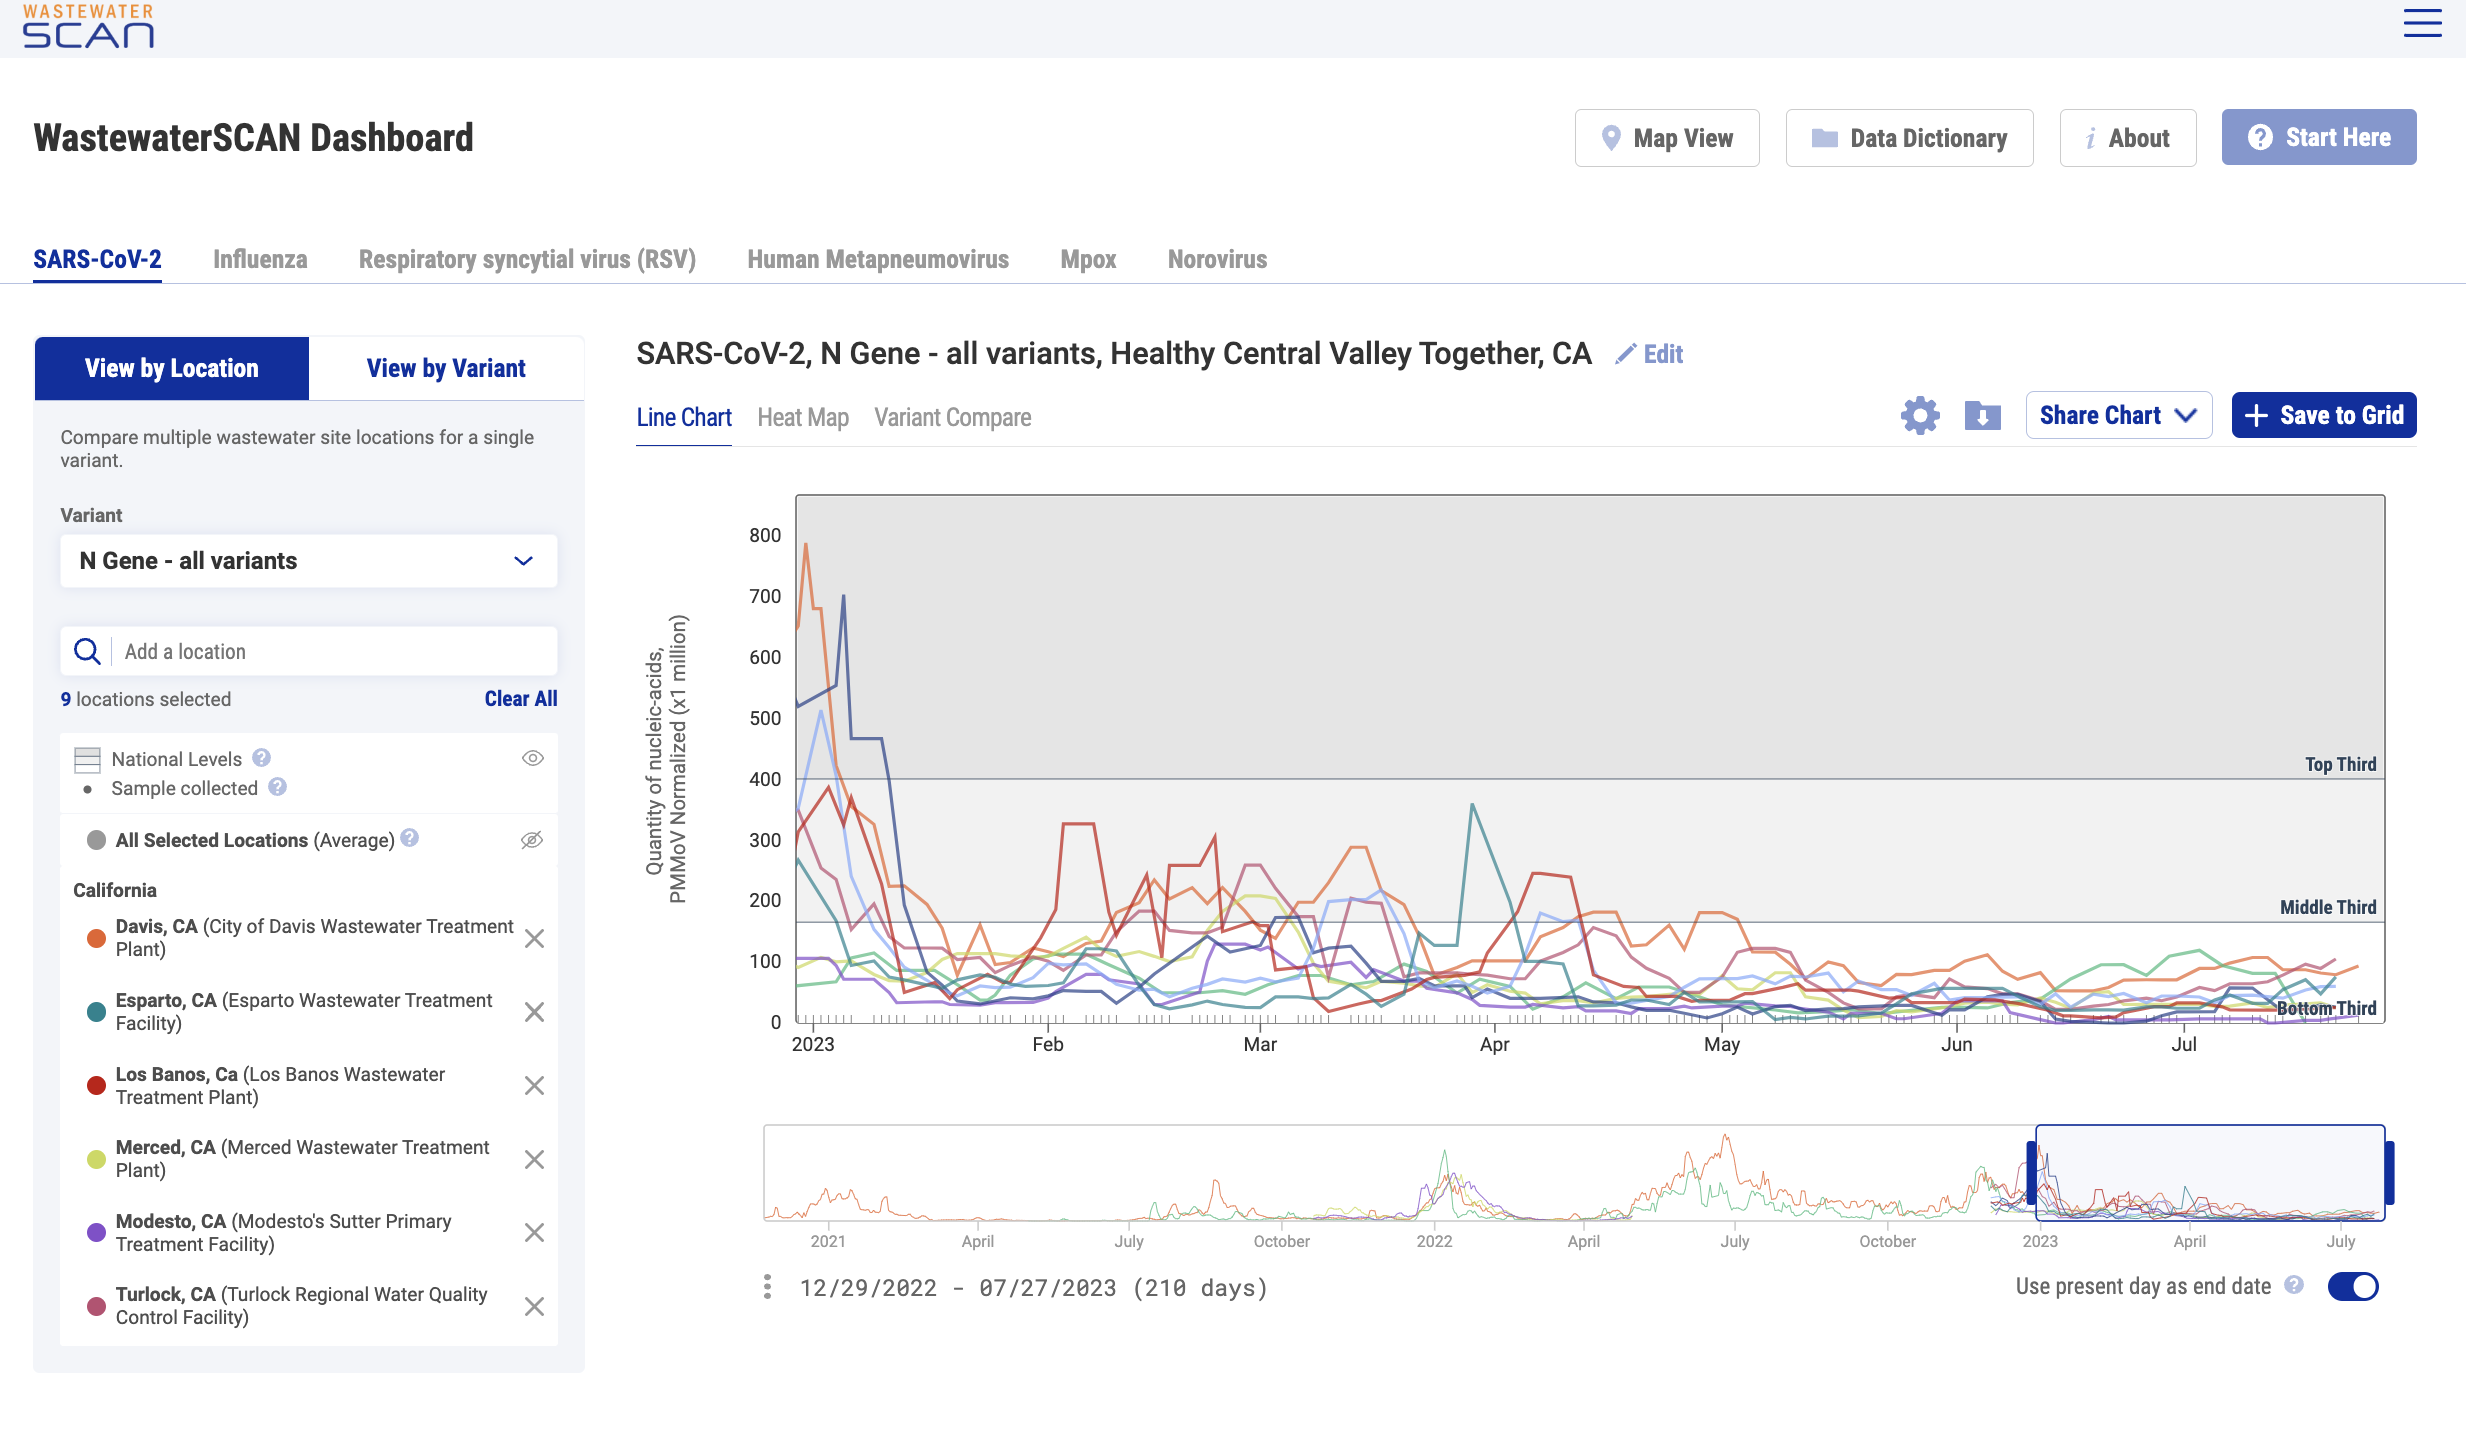
"National levels" can be added to charts to visually benchmark where measurements fall compared to previously recorded measurements for each pathogen. The national levels are shown as groups (bottom, middle and upper) that are based on looking back at all data collected during the last 365 days across all WWSCAN sites. This feature can be applied across the different infectious disease targets in 'Chart View'. Click the small grey eye icon next to "National Levels" to show this feature.
- Bottom third area: represents the lower third (<33rd percentile) of measurements across all WWSCAN sites.
- Middle third area: represents the middle third (33rd - 66th percentile) of measurements across all WWSCAN sites.
- Top third area: represents the upper third (>66th percentile) of measurements for all WWSCAN sites.
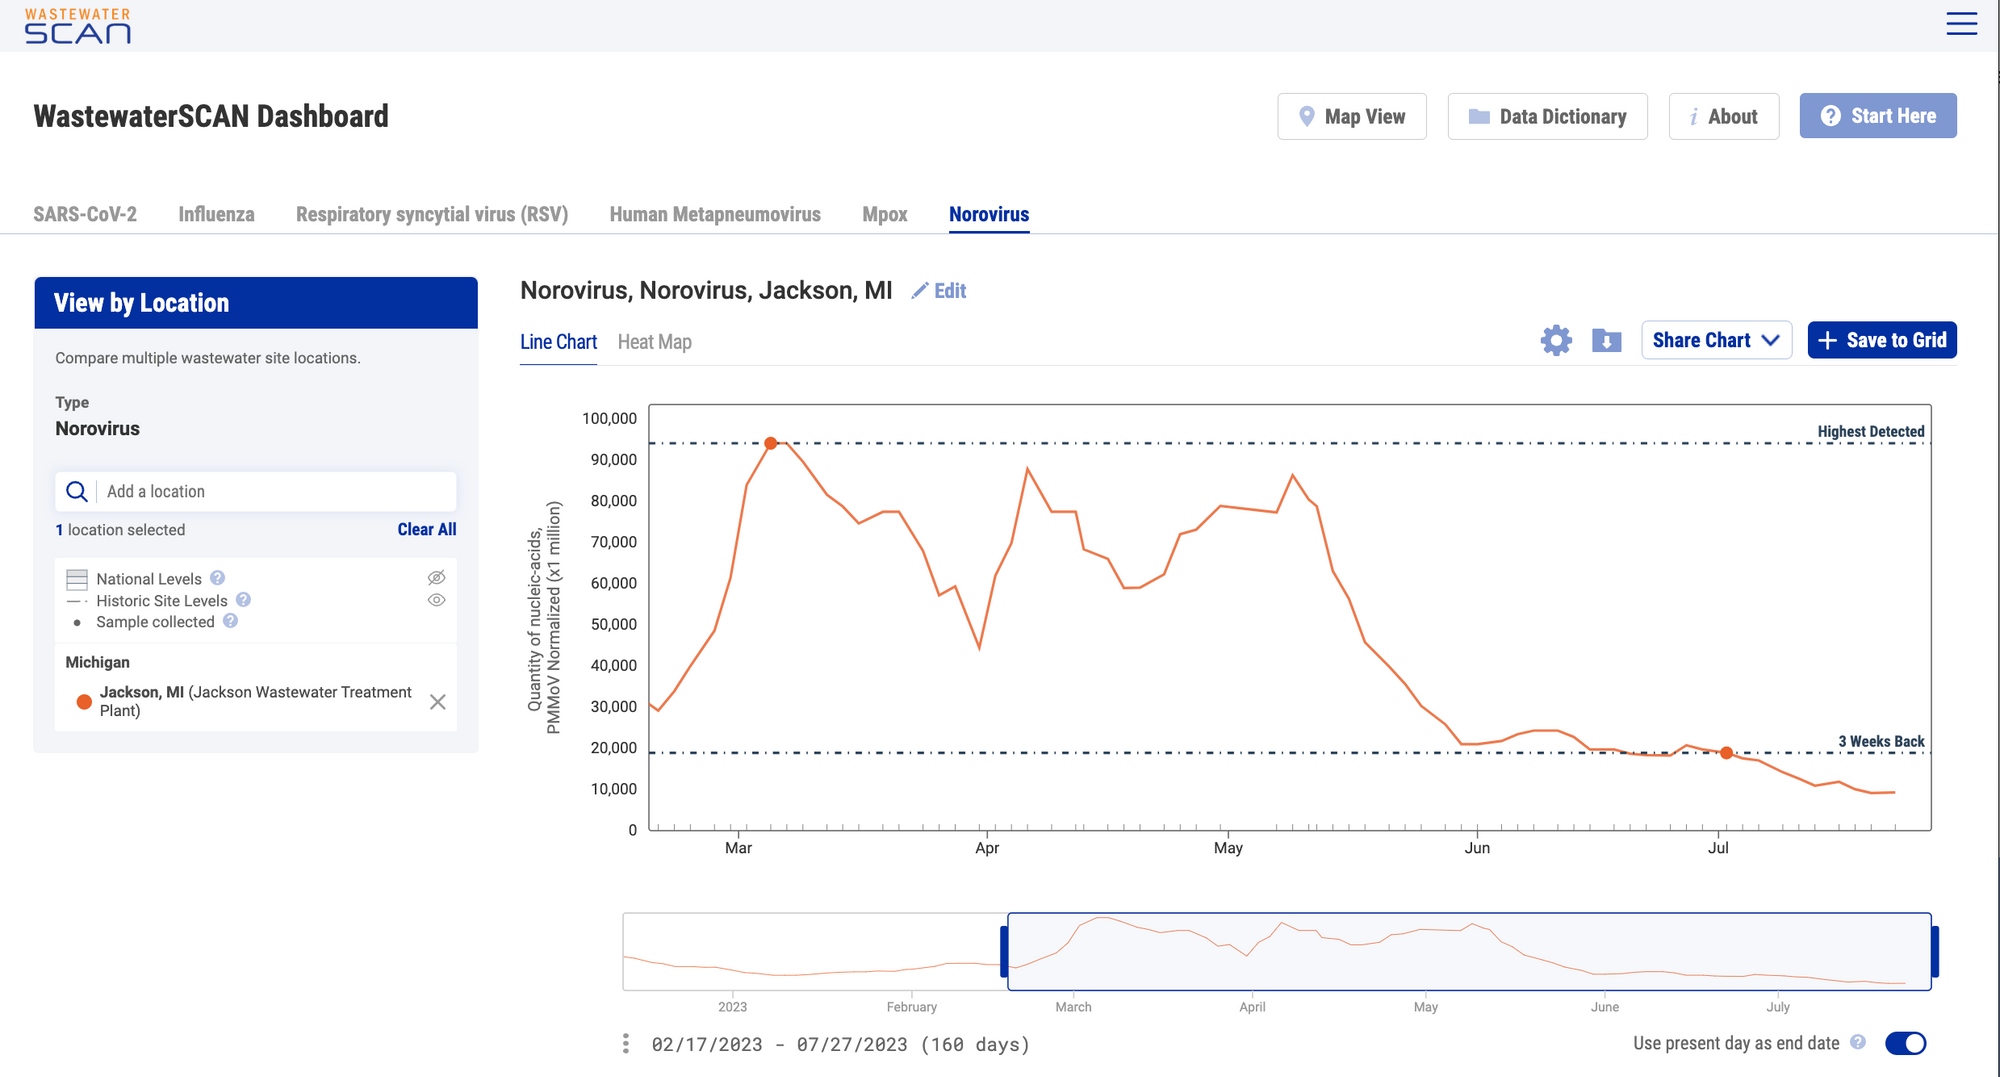
Historic Site Levels
Historic reference levels can be turned on for an individual site. The two reference lines that appear for an individual site plot when the feature is turned on are '3 Weeks Back' and 'Highest Detected'. These values represent the 5-d trimmed average values 3 weeks ago from today, and the highest detected over the entire duration of the plants participation in WWSCAN. Click the eye icon next to "Historic Site Levels" to show this feature.
This feature can be applied for all infectious disease targets in 'Chart View'.
Infectious Disease Target Review
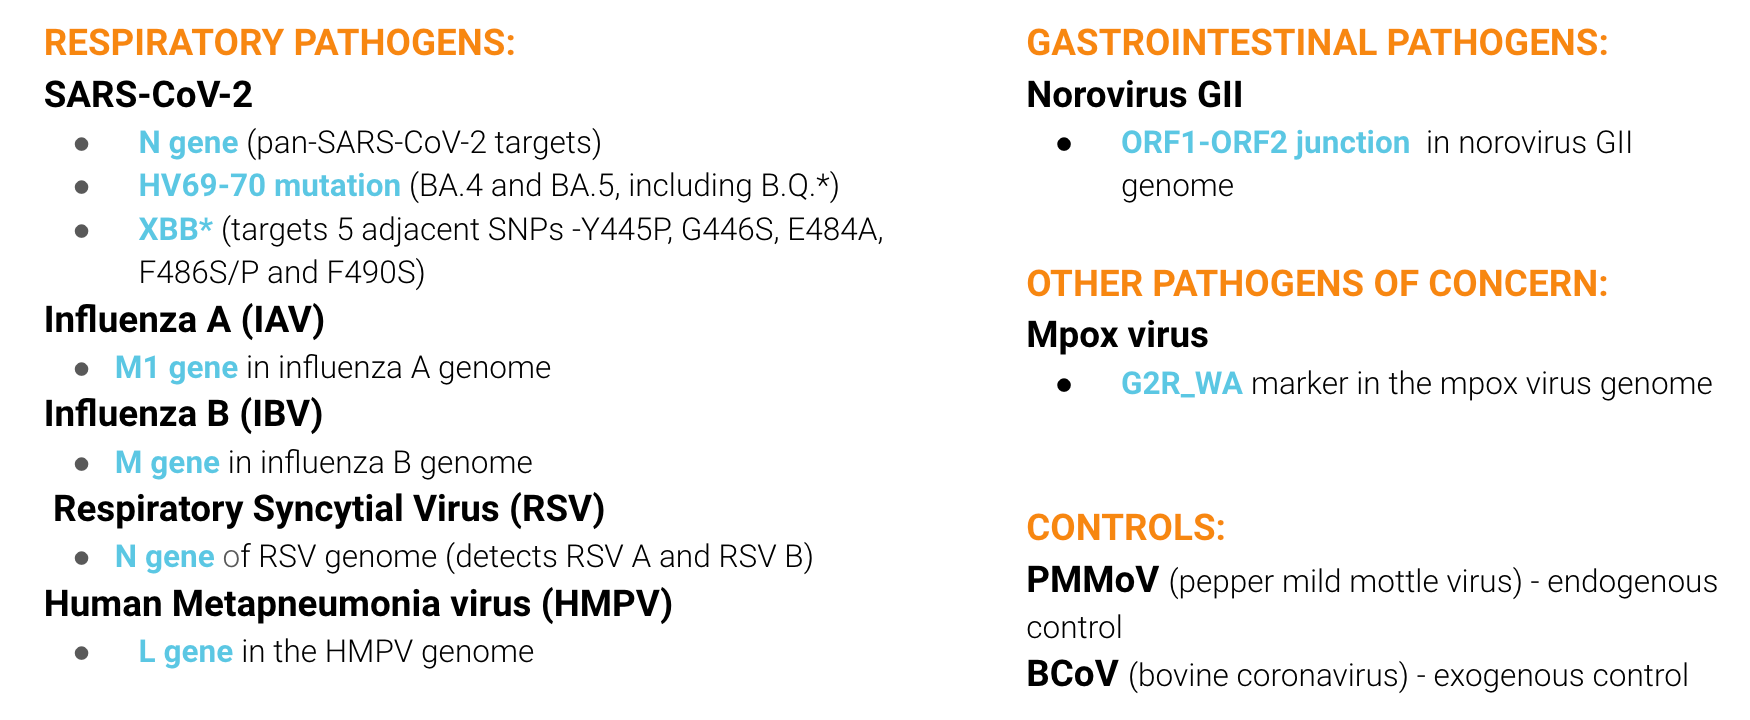
Currently monitoring SARS-CoV-2, IAV, IBV, RSV, HMPV, Norovirus GII, & Mpox
The methods for our assays are in the public domain. You can access them using these QR codes:
Respiratory Pathogens
SARS-CoV-2, Influenza A & B, Respiratory Syncytial Virus, & Human metapneumovirus
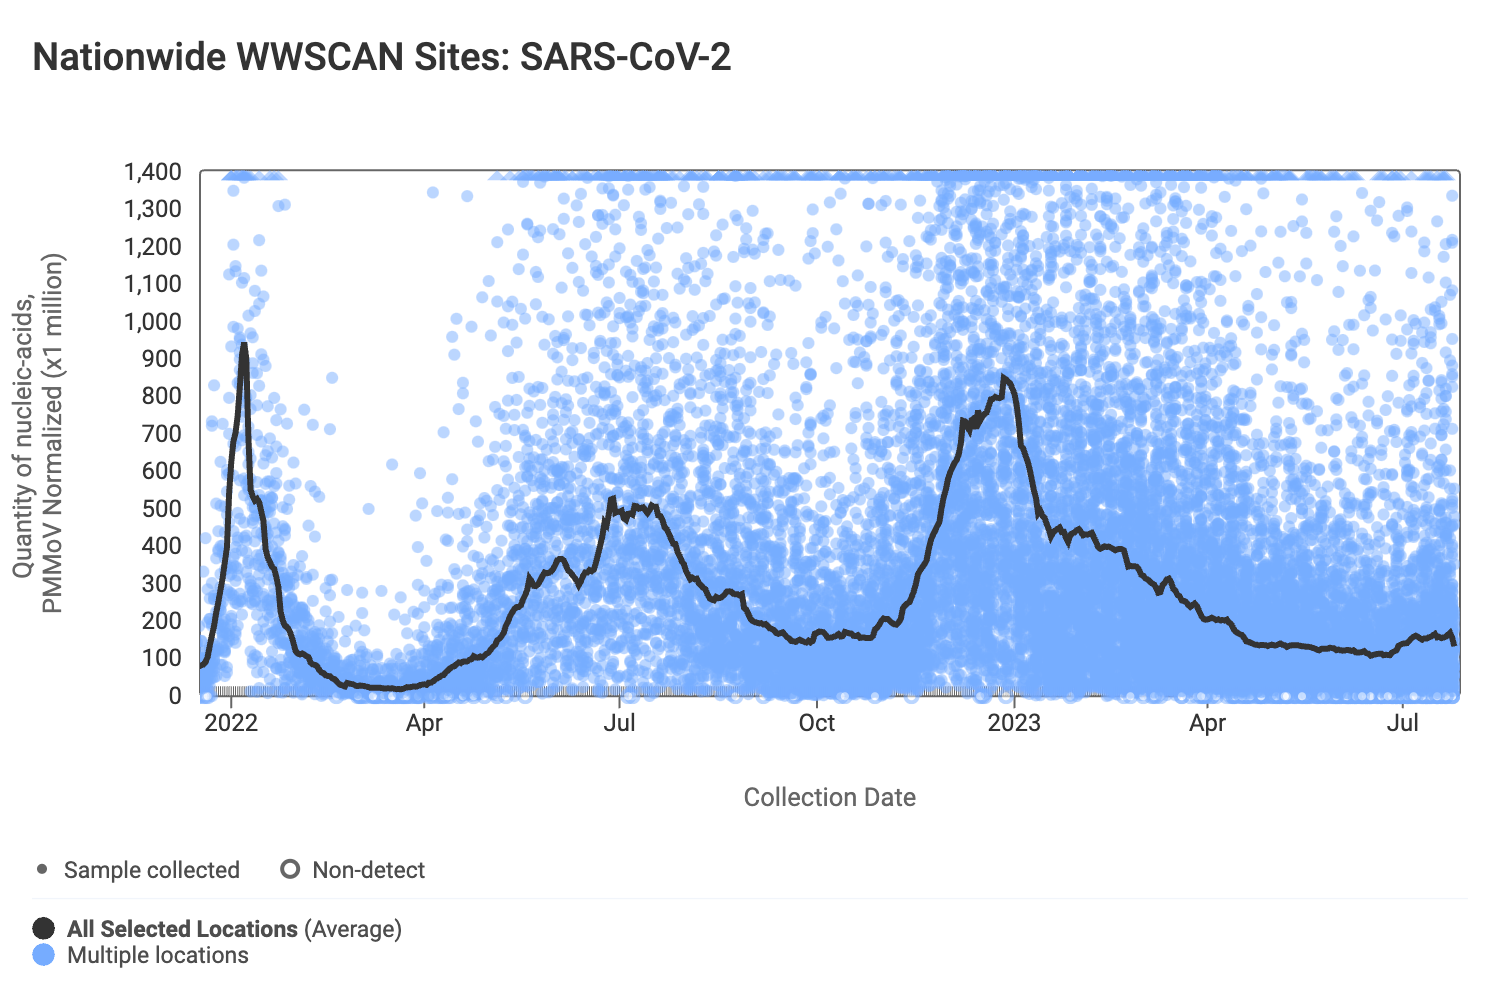
SARS-CoV-2 N gene RNA concentrations (normalized by PMMoV) at most plants remain similar to what they have been over the last month. The median concentration across all sites over the last 21 days is 44,036 copies/gram. Below are the SARS-CoV-2 N gene concentrations (normalized by PMMoV) from all participating WWSCAN sites across the country. Evident in the data are relatively high concentrations around the start of the year with lower levels presently observed.
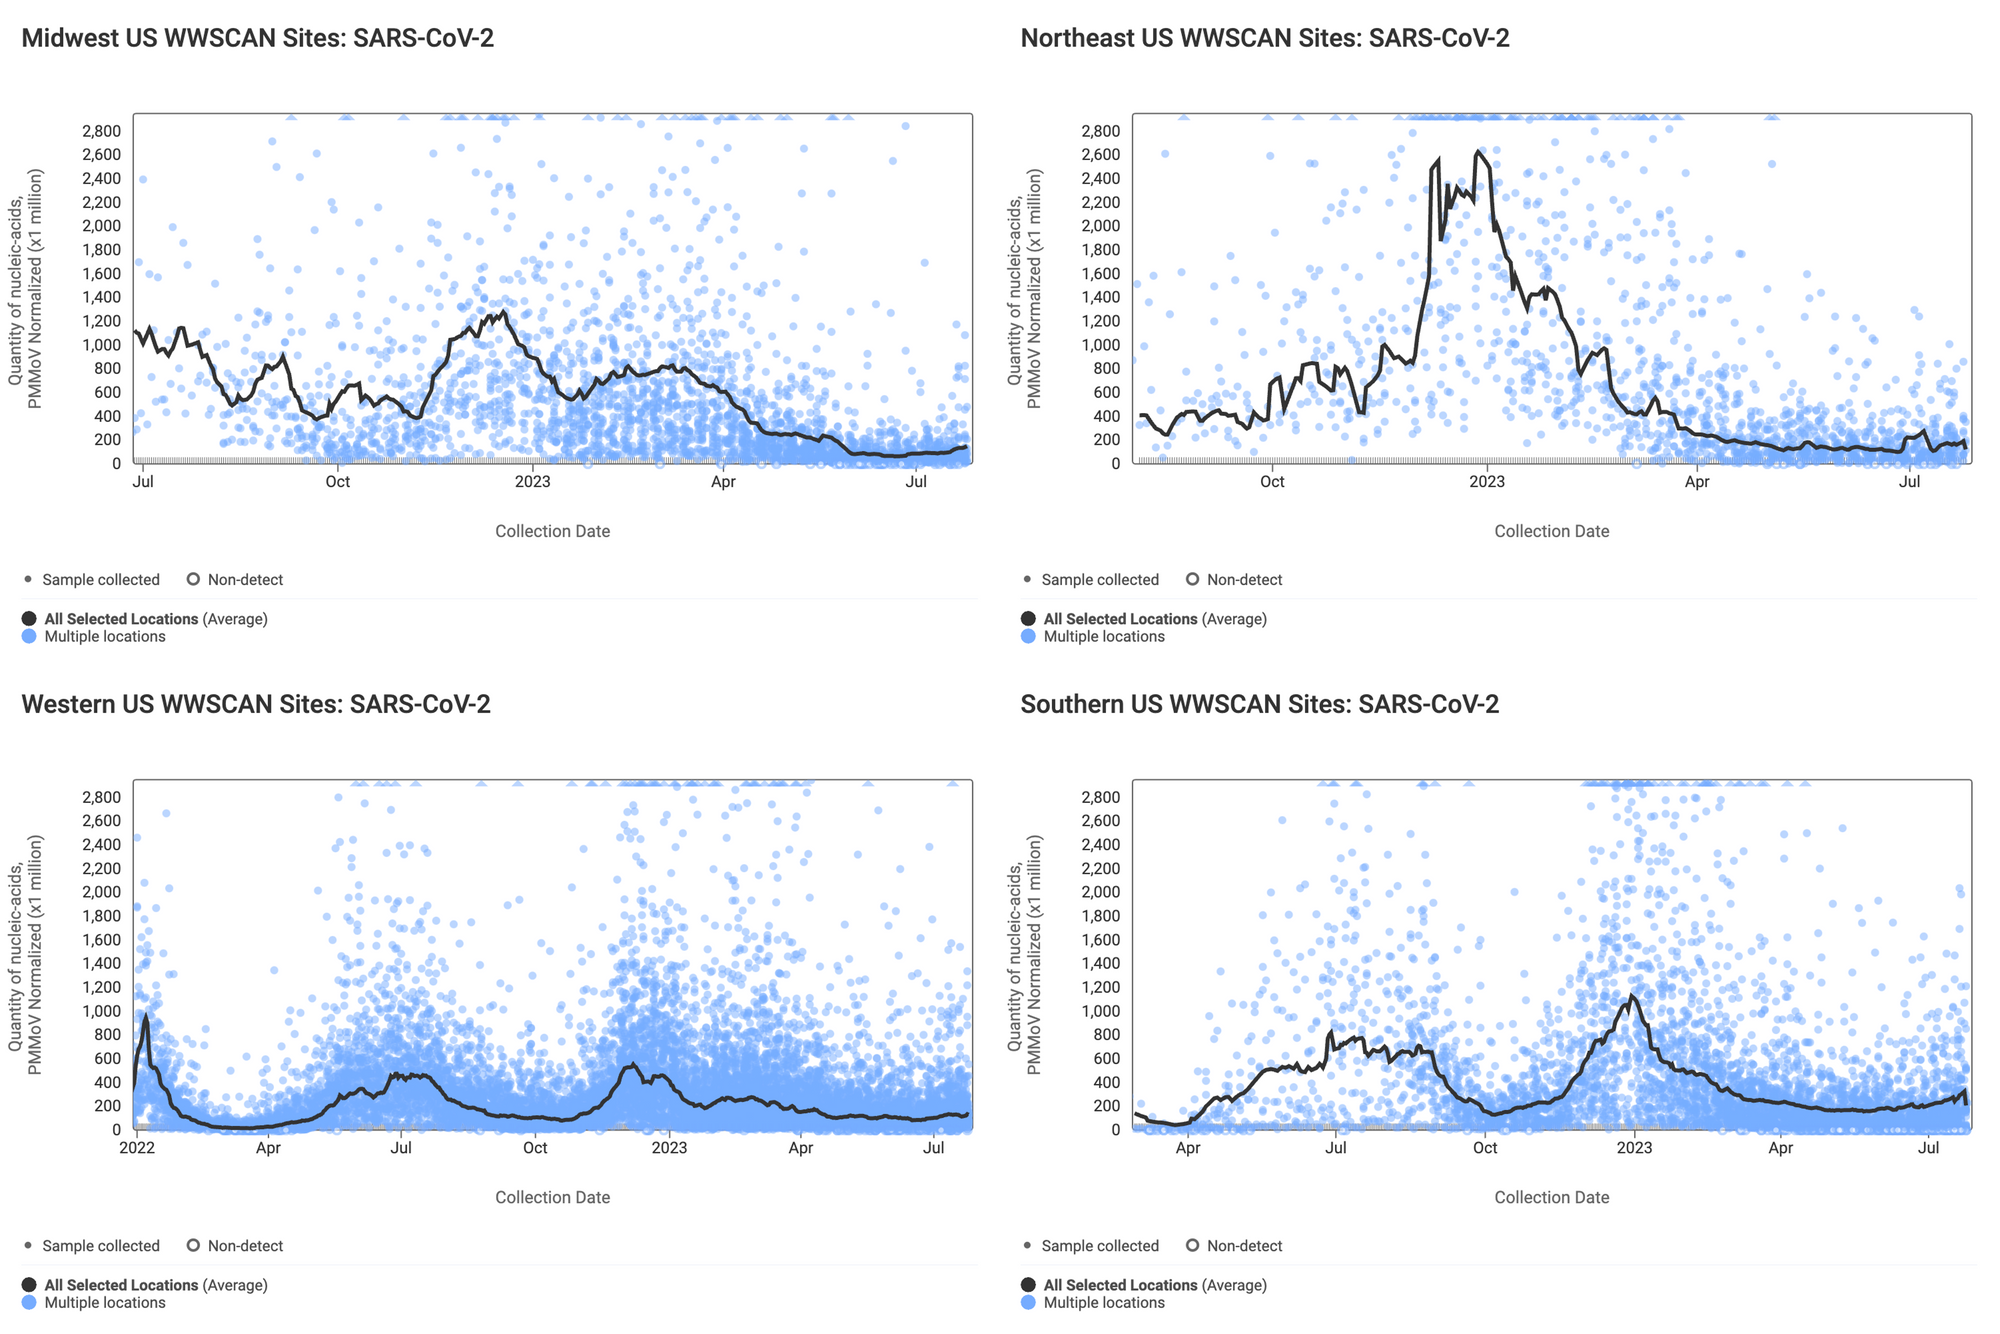
Below are the SARS-CoV-2 N gene concentrations (normalized by PMMoV) from sites in the Midwest US (top left panel), Northeast US (top right panel), Southern US (bottom right panel) and Western US (bottom left panel). The population weighted average across the regional WWSCAN plants is shown in black. Evident in the data are relatively high concentrations across all US regions around the start of the year with lower levels presently observed. It is important to note that concentrations across all 4 regionals levels are still well above the detection limit of the N gene.
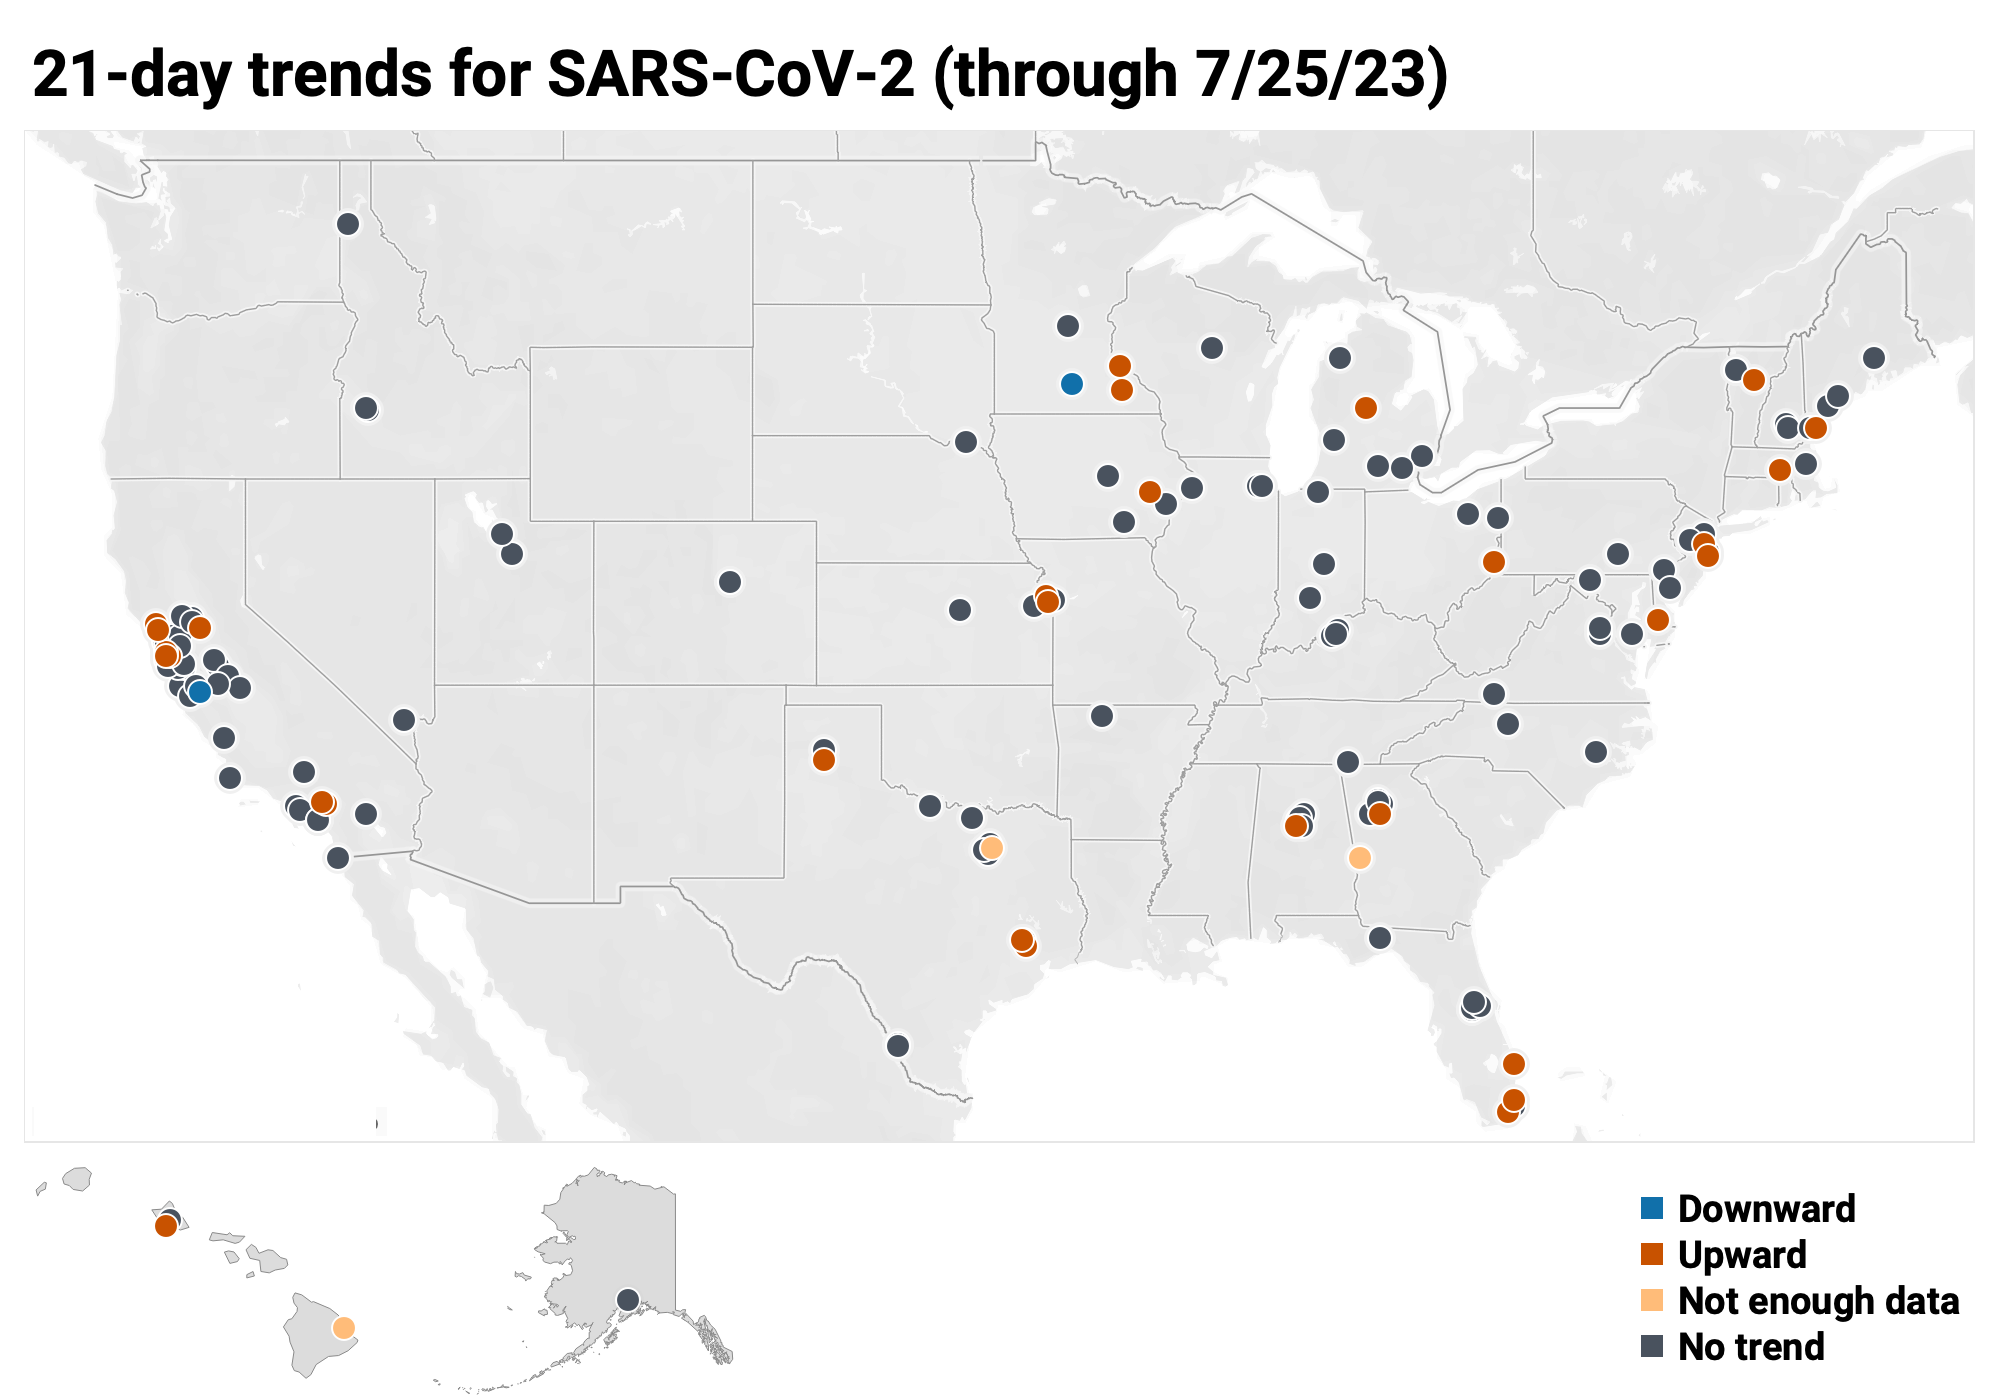
Below is the trend analysis for the SARS-CoV-2 RNA concentrations (N gene concentrations normalized by PMMoV) in wastewater solids at all participating plants. Red indicates a significant upward trend, blue is a significant downward trend, and dark grey is no trend. Yellow indicates that there were not enough data points to calculate a trend (we required 3 points over the last 21 days). You can read about our methods for trend analysis here. In short, we test for linear trends between log10-transformed concentration (target/PMMoV) and time; the trend must be classified as statistically significant (p<0.1).
Of the 171 sites: 30 show an upward trend, 136 show no trend, and 2 show a decreasing trend. The remaining 3 site (Columbus, GA, Hilo, HI and Sunnyvale, TX) do not have enough data to calculate a trend.
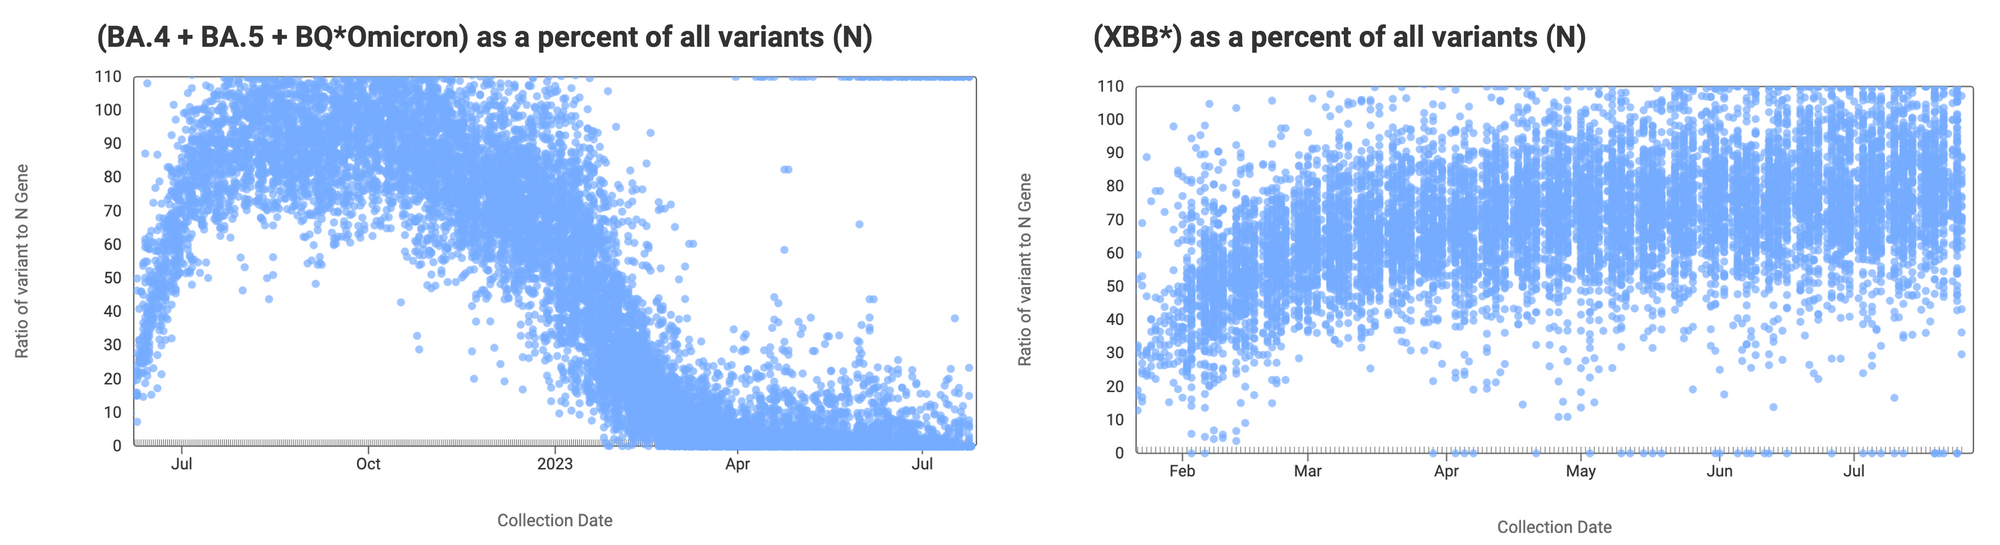
The ratio of the XBB* mutations/N across all WWSCAN plants is shown in the chart below on the right. As the ratio reaches 100%, it suggests that all the SARS-CoV-2 genomes in wastewater have the XBB* mutations. These data indicate that the average ratio XBB* mutations/N is ~75% but some places show levels as high as 80-100%. This suggests the majority of infections across the communities are caused by XBB*. The chart on the left shows the ratio of the BA.5, BA.4, and BQ* mutation/N across all WWSCAN plants. It can be read the same way as the XBB* chart. The average ratio is about <10%. Note that our XBB* assay will also detect XBB.1.16, XBB.1.9, and FD.2 (XBB.1.5.15.2*).
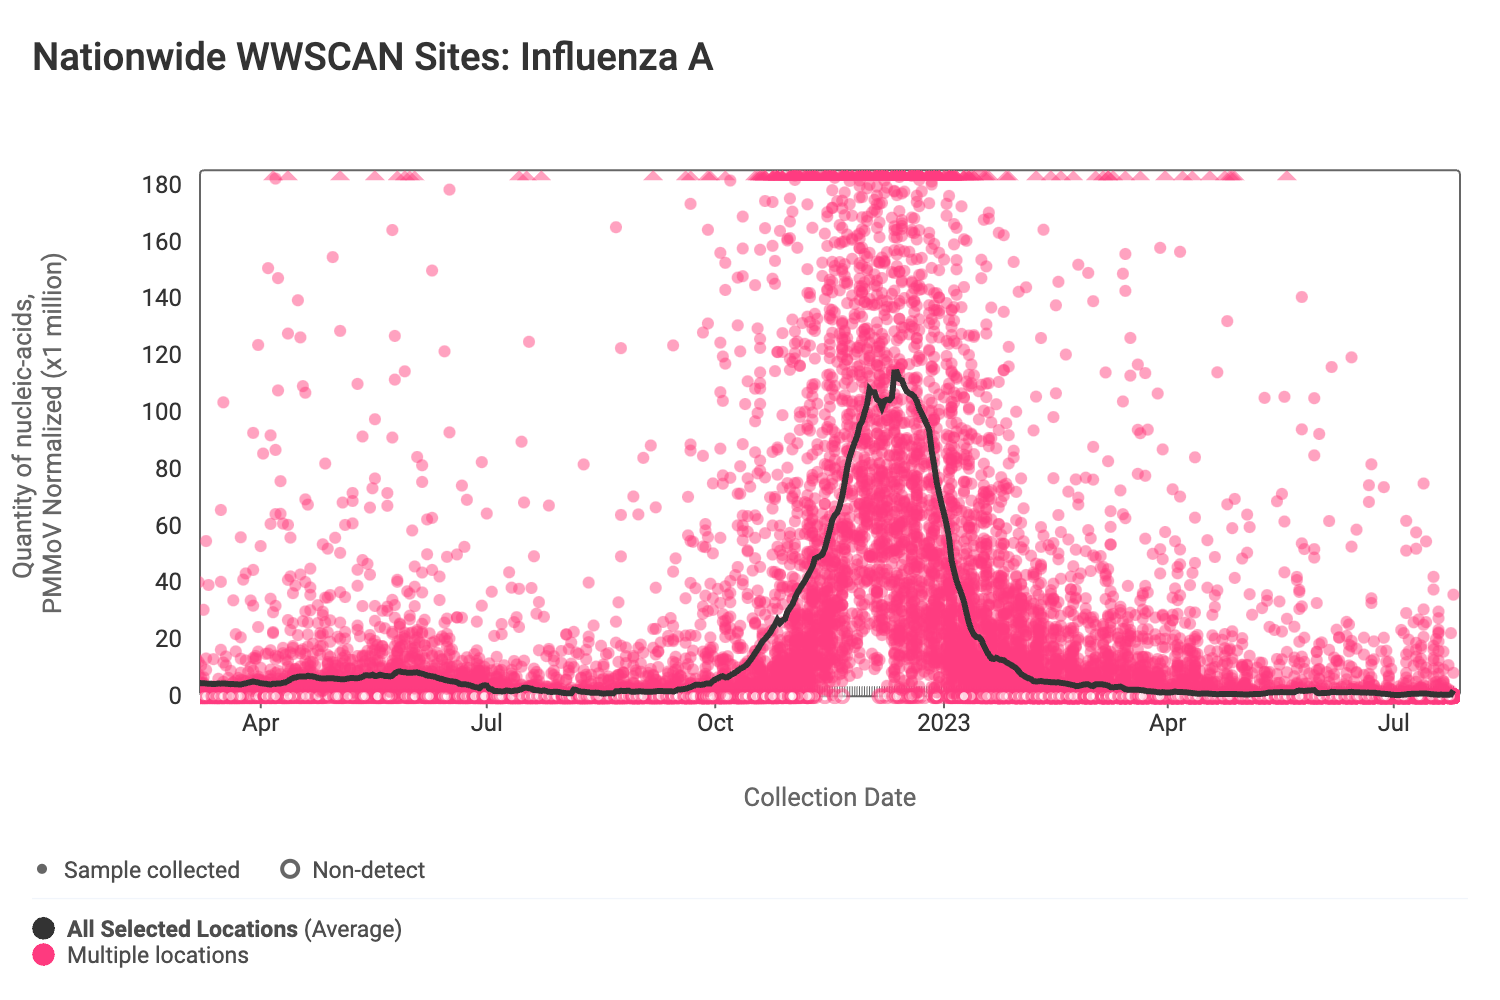
Influenza A (IAV) RNA concentrations (normalized by PMMoV) are very low signaling the end of influenza season. The median concentration across all sites over the last 21 days is below the lower detection limit of the assay. There have only been 125 positive samples out of 1,465 samples during the past 21 days (~8% detection rate). Below are the IAV RNA concentrations (normalized by PMMoV) from all participating WWSCAN sites across the country.
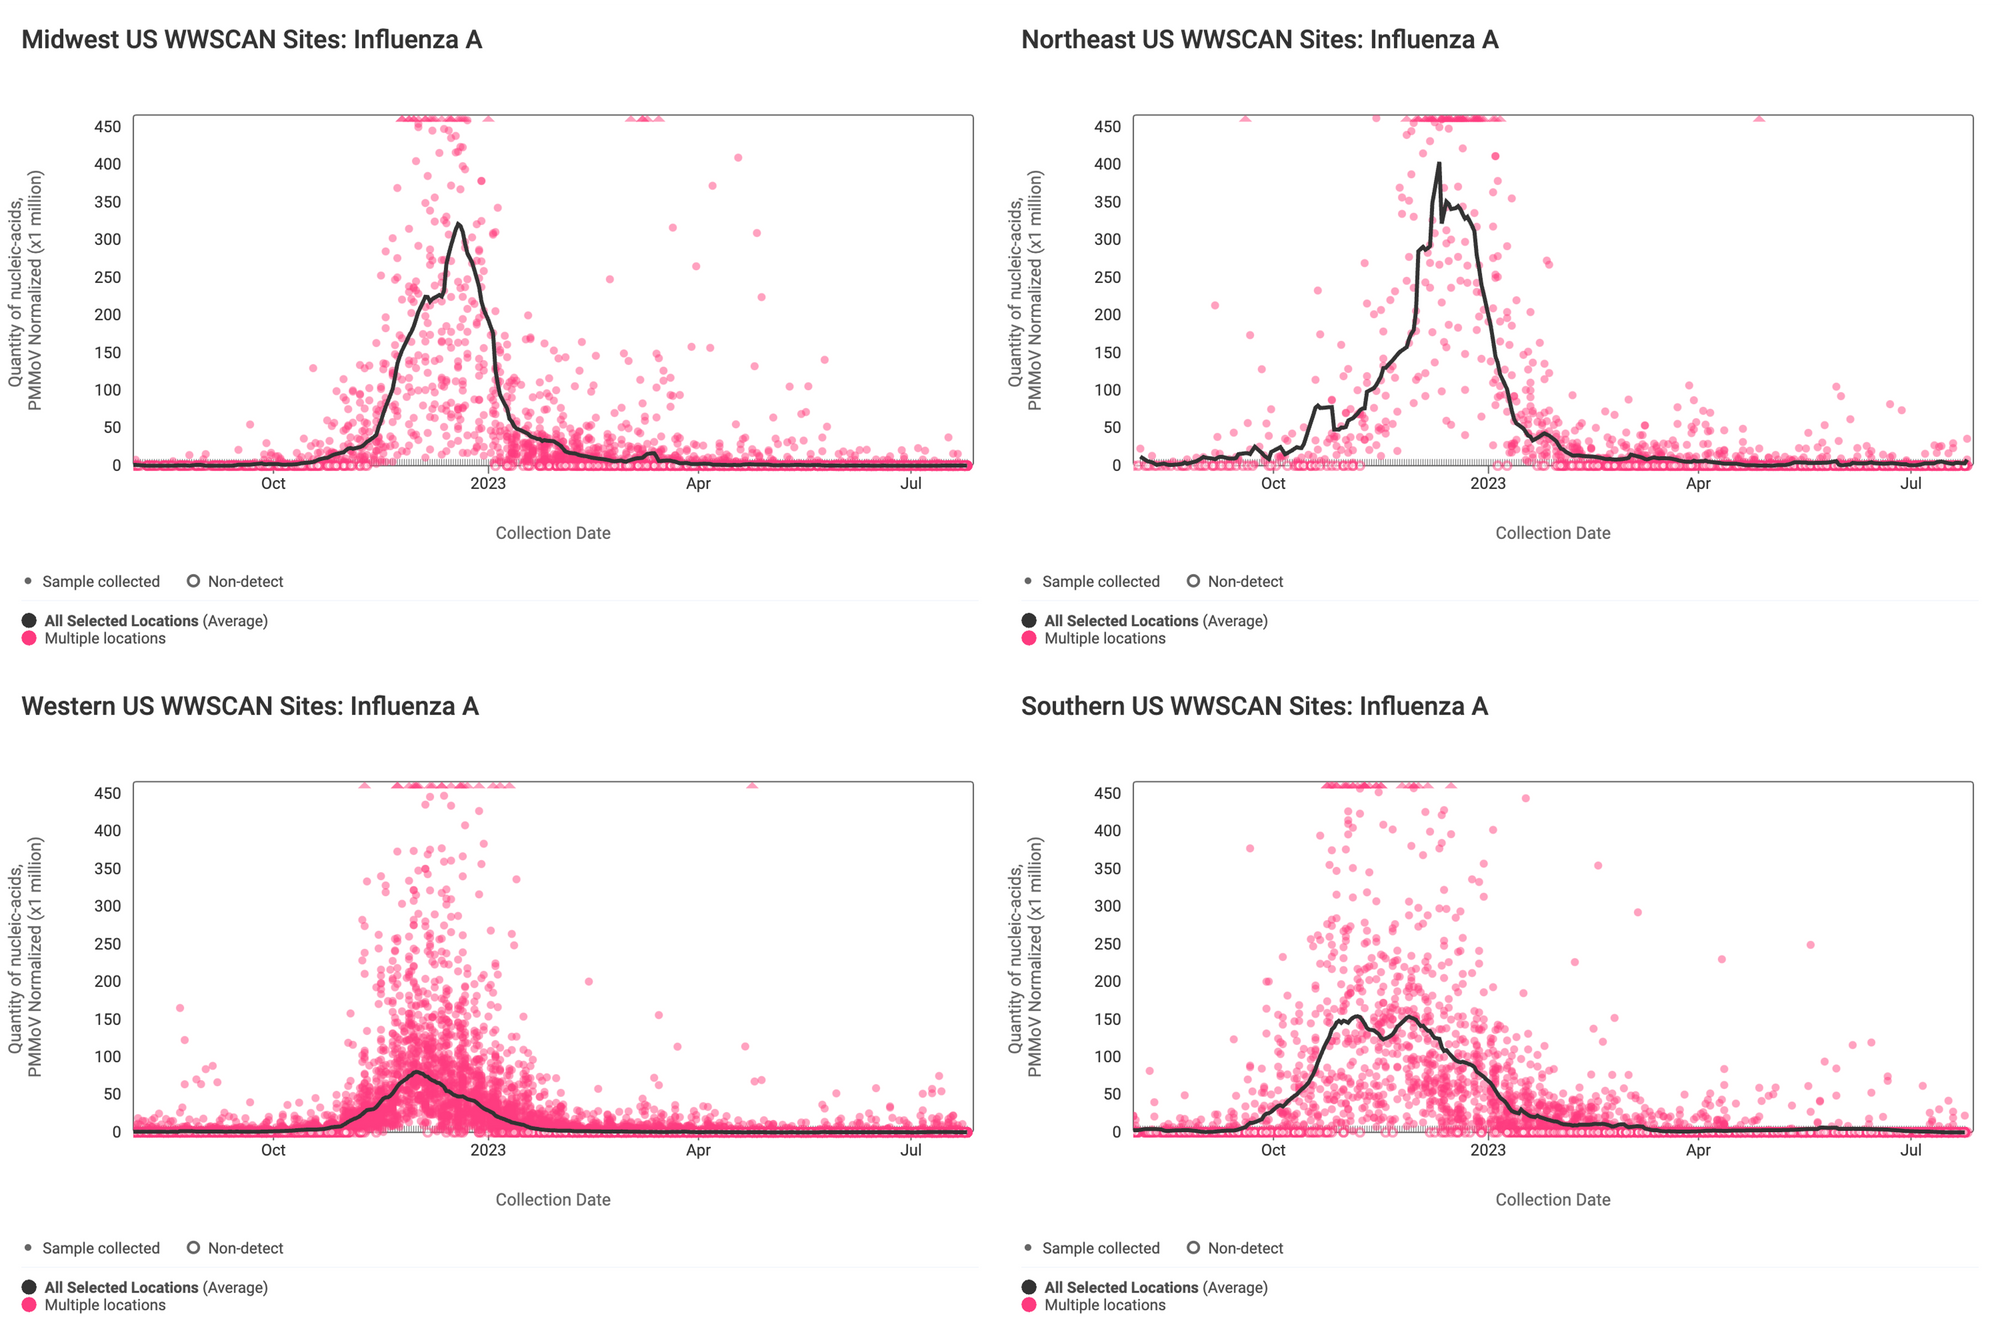
Below are the IAV RNA concentrations (normalized by PMMoV) from sites in the Midwest US (top left panel), Northeast US (top right panel), Southern US (bottom right panel) and Western US (bottom left panel). The population weighted average across regional WWSCAN plants is shown in black. Evident in the data are relatively high concentrations across all US regions around the start of the year with very low levels and mostly non-detects presently observed.
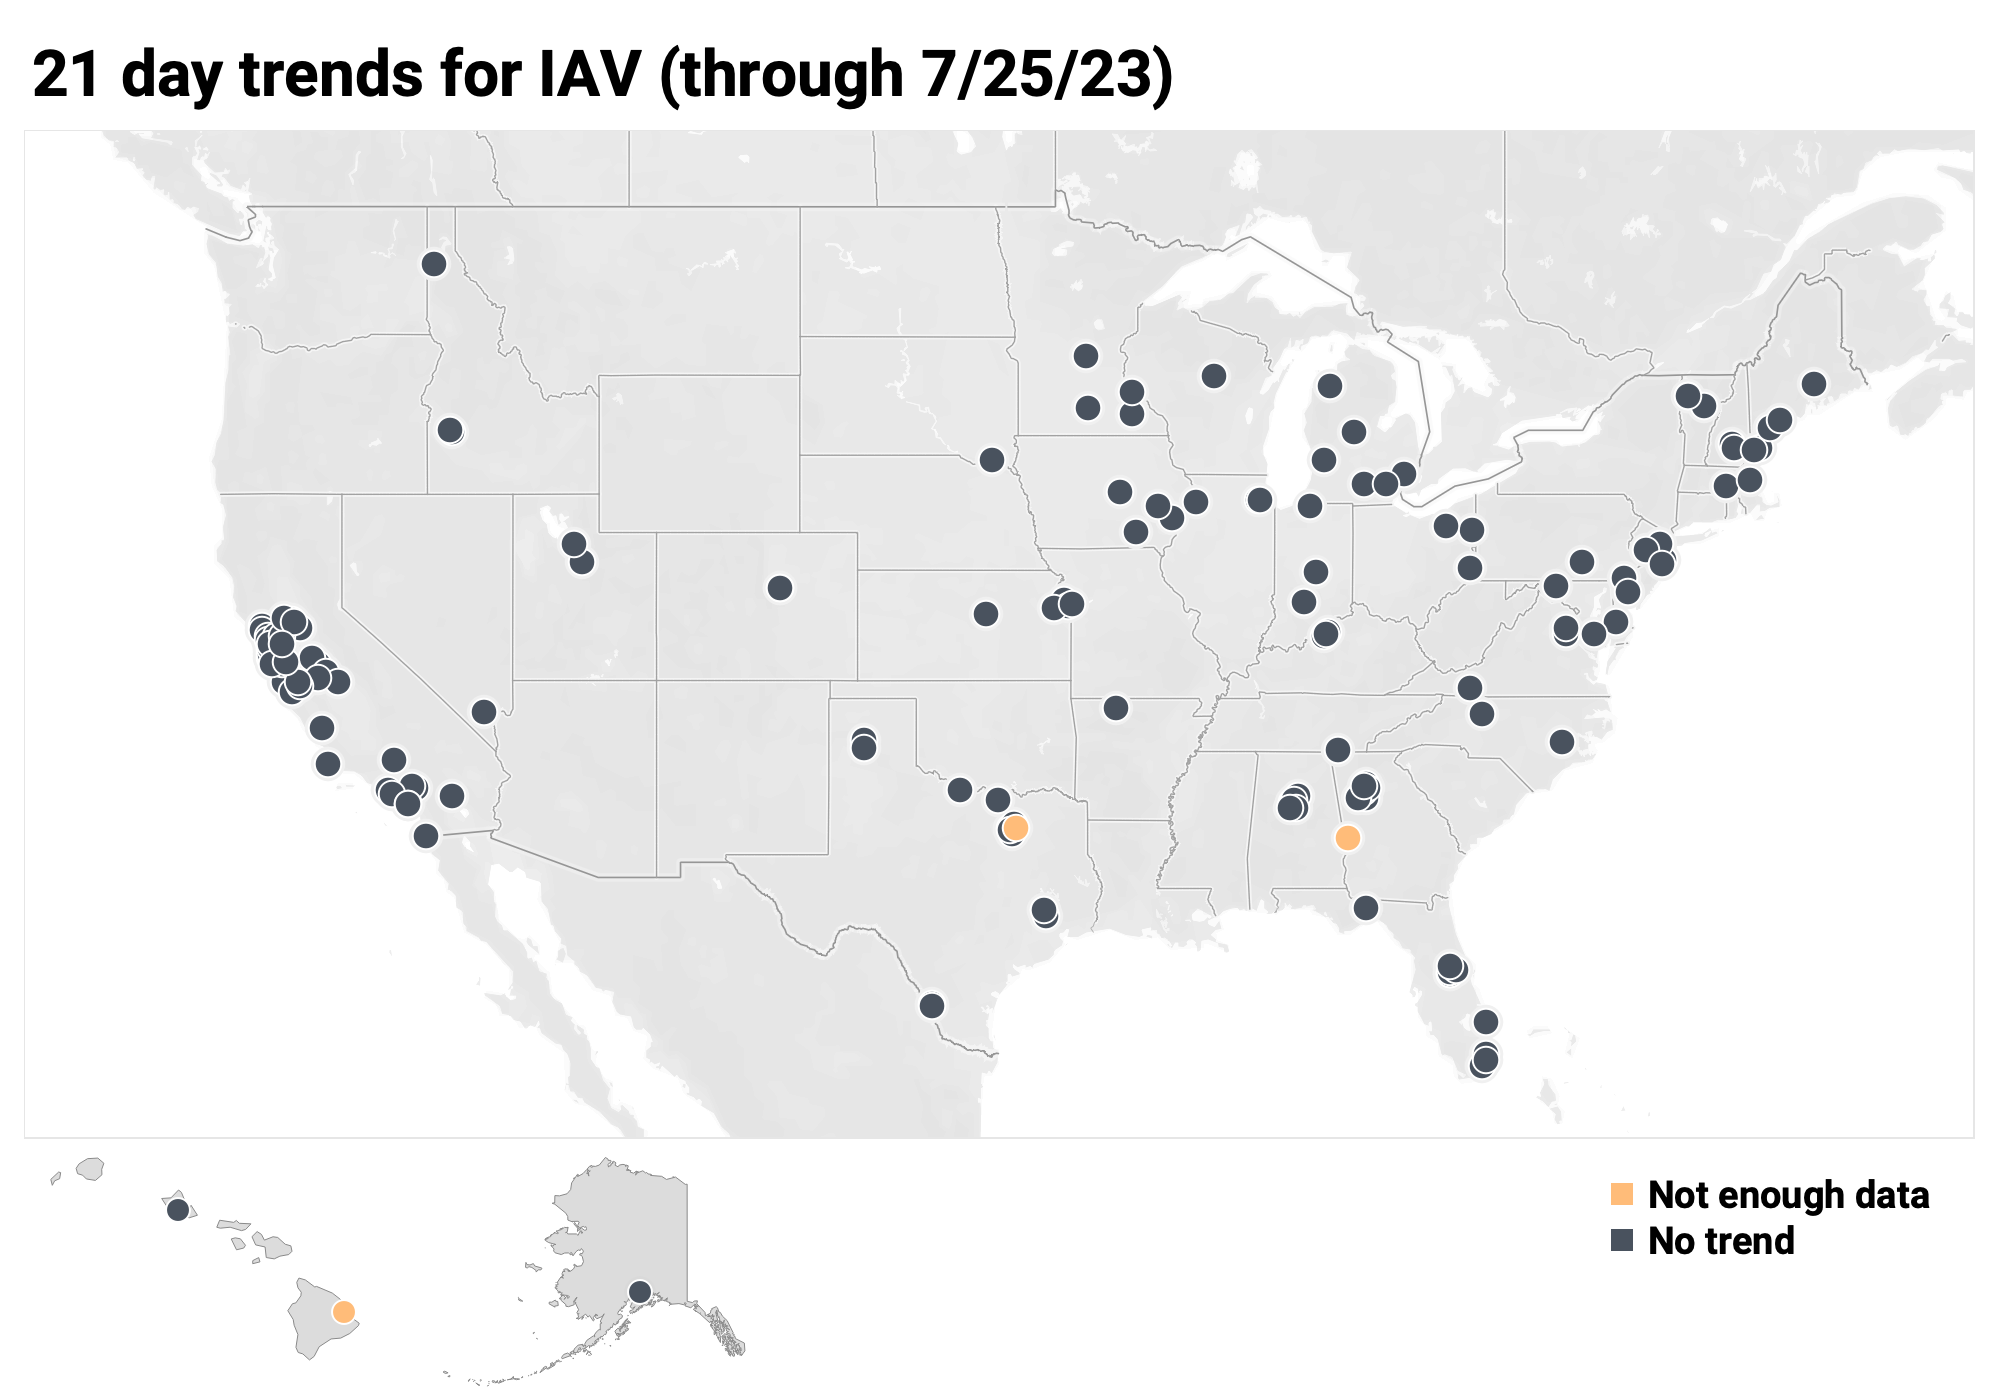
Below is the trend analysis for the IAV RNA concentrations (normalized by PMMoV) in wastewater solids at all participating plants. Red indicates a significant upward trend, blue is a significant downward trend, and dark grey is no trend. Yellow indicates that there were not enough data points to calculate a trend.
Of the 171 sites: 0 show an upward trend, 168 show no trend, and 0 show a decreasing trend. The remaining 3 site (Columbus, GA, Hilo, HI and Sunnyvale, TX) do not have enough data to calculate a trend.
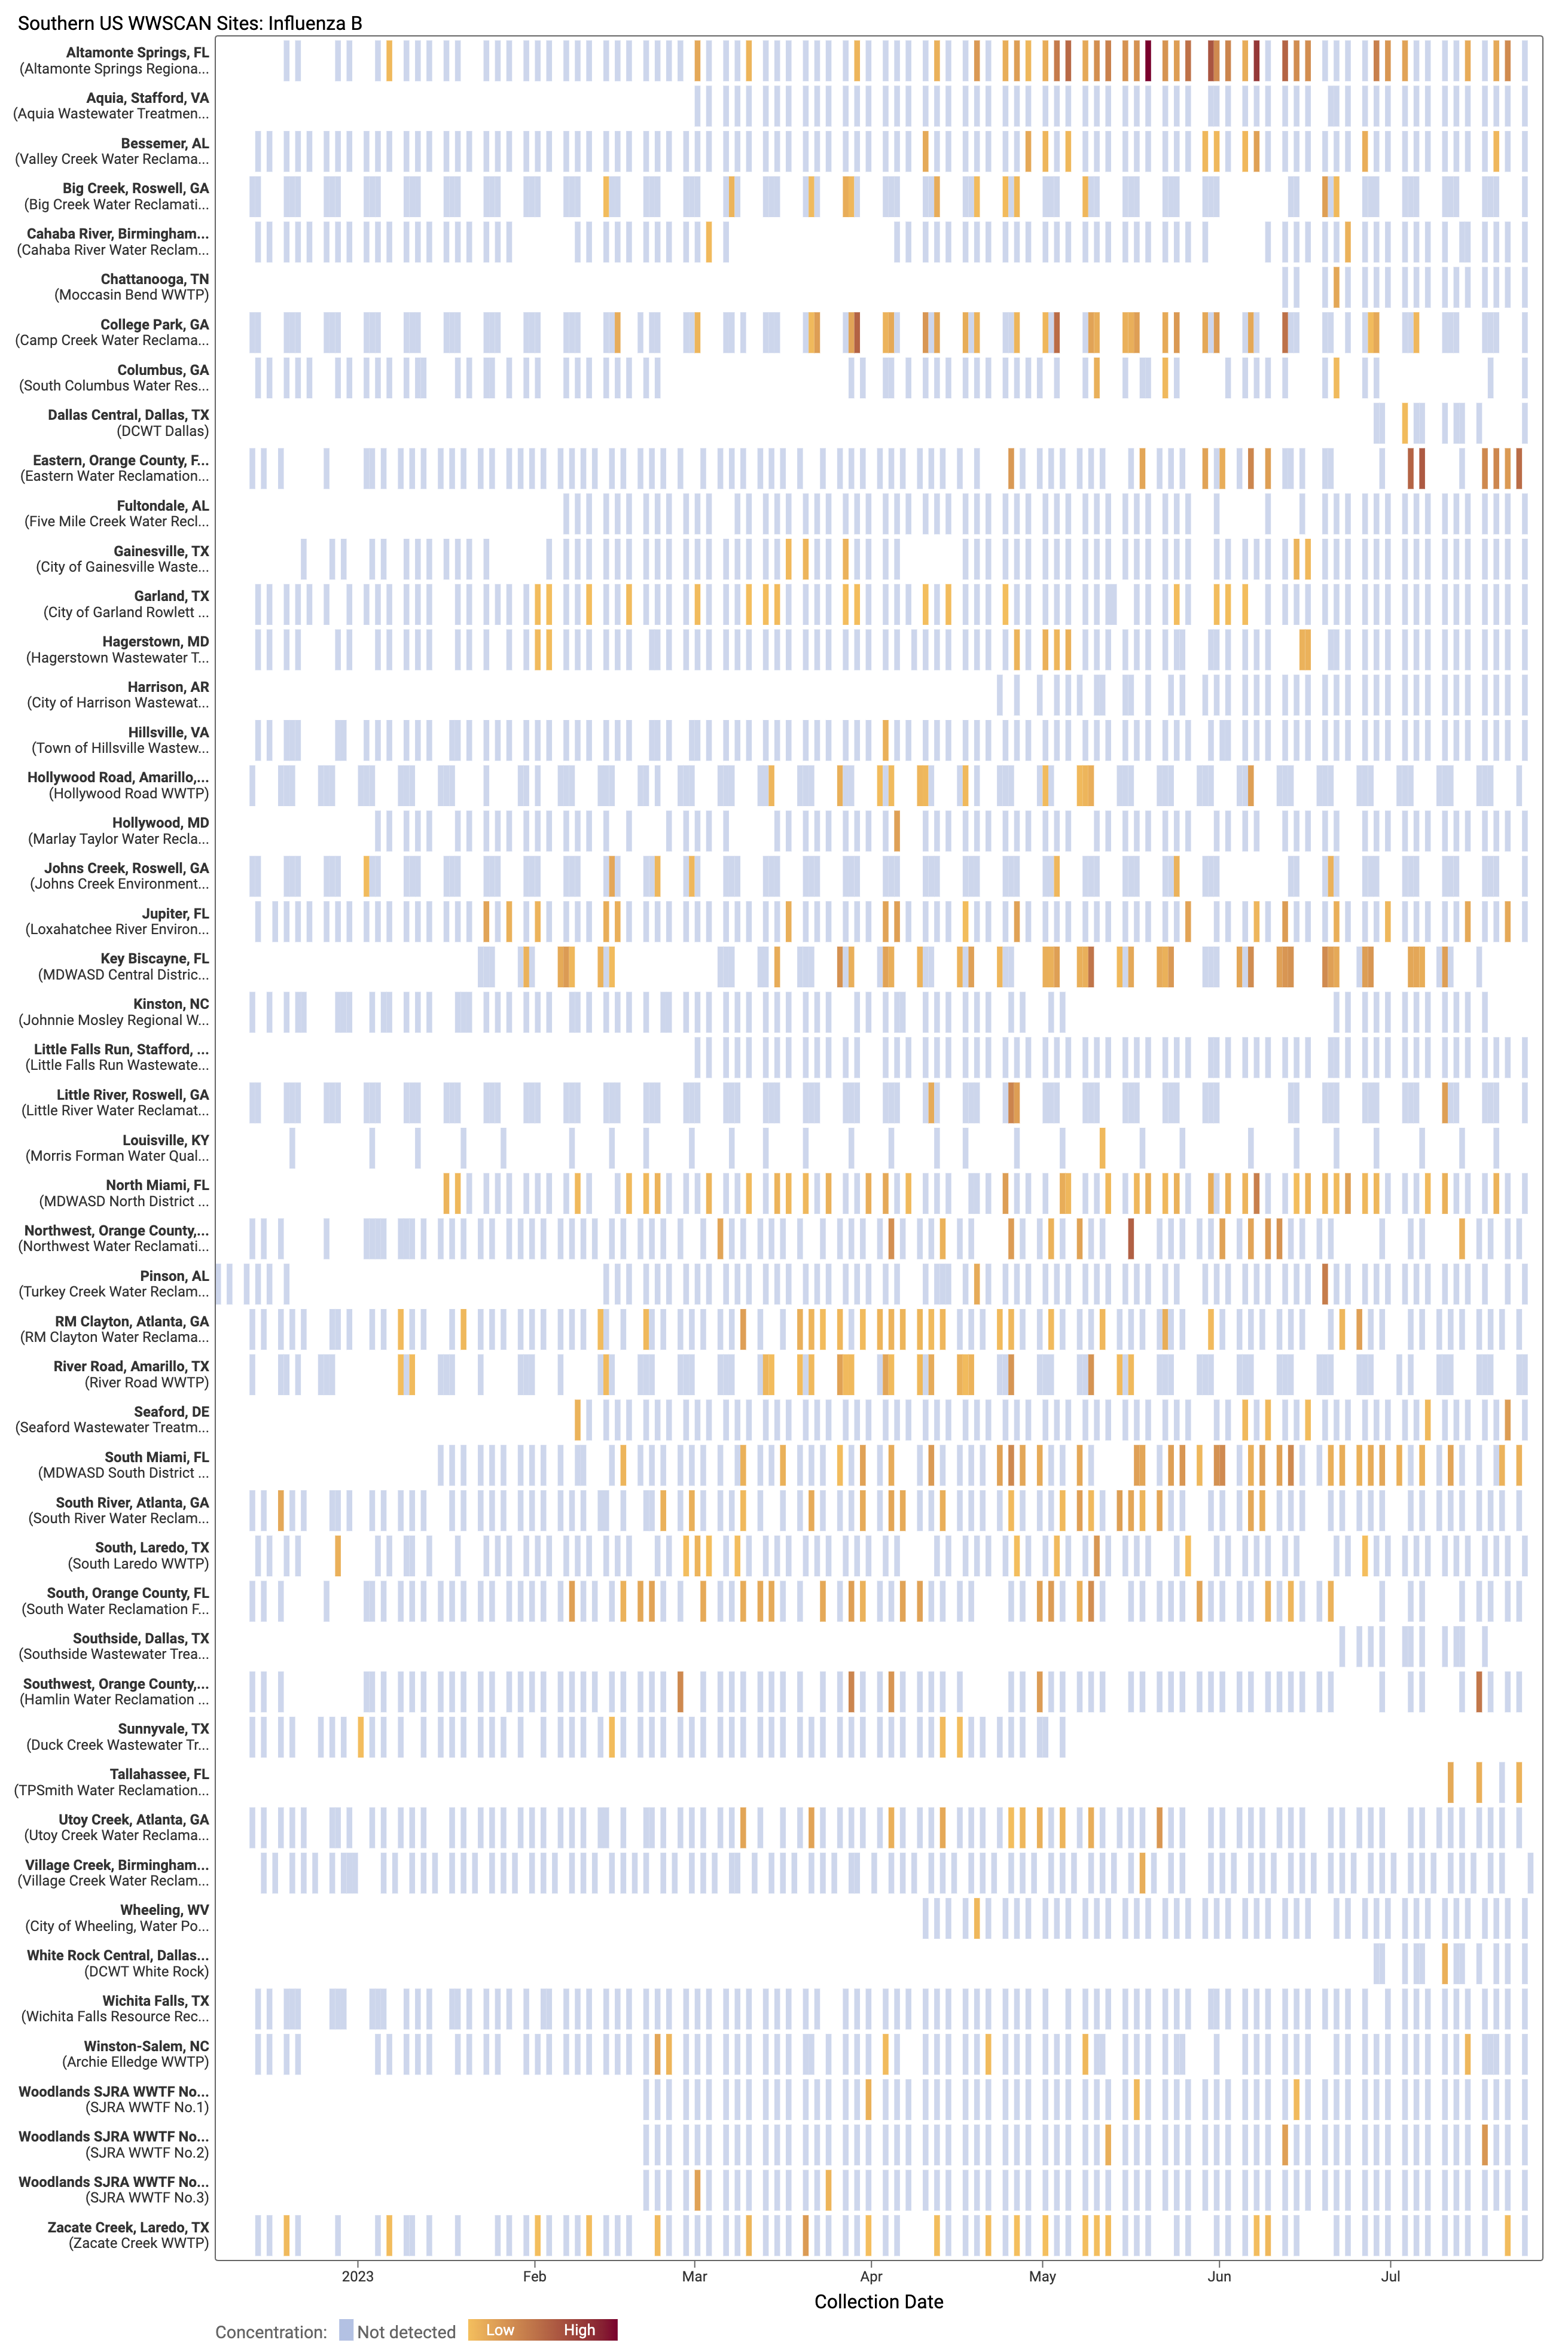
Influenza B (IBV) RNA concentrations are mostly non-detect at WWSCAN sites. There have only been 130 positive samples out of 1,465 samples during the past 21 days (~8% detection rate), all at low concentrations. Below is a heat map showing IBV detections at all the plants in WWSCAN in the Southern USA. Each location is a row, and the date is a column. White indicates no sample, blue indicates non-detect, and the orange to red show variable concentrations if IBV. You can see how IBV RNA is occasionally detected since we began measuring it in mid December 2022 at these sites.
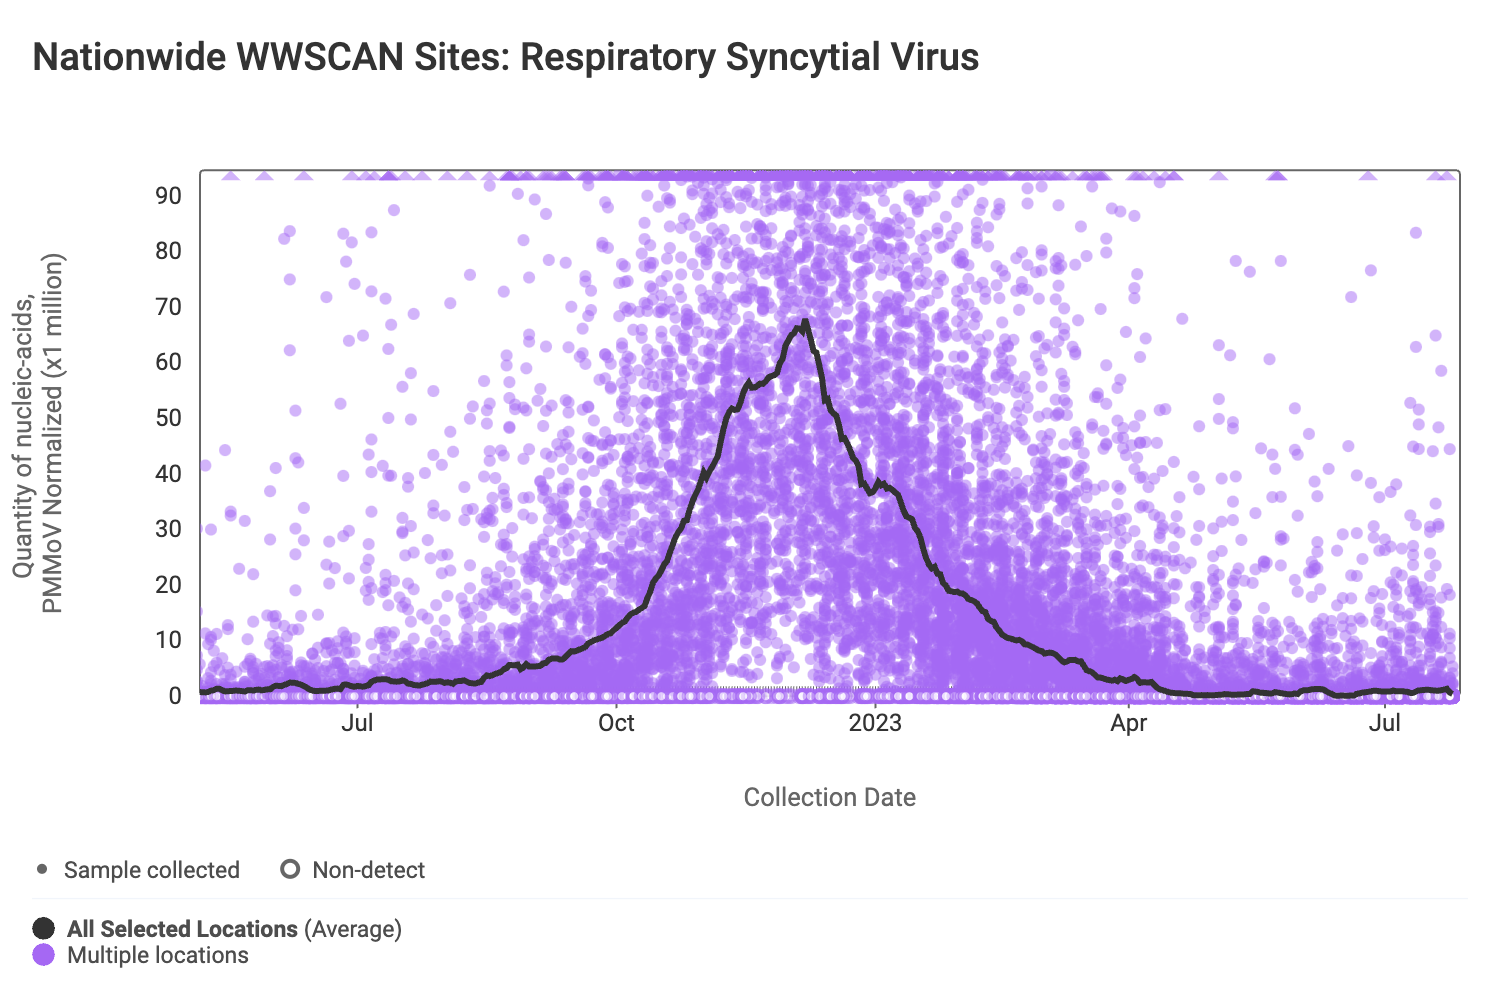
RSV RNA concentrations are low signaling the end of RSV season. The median concentration across all sites over the last 21 days is below the lower detection limit of the assay. There have only been 238 positive samples out of 1,456 samples during the past 21 days (~16% detection rate). Below are the RSV RNA concentrations (normalized by PMMoV) from all participating WWSCAN sites across the country.
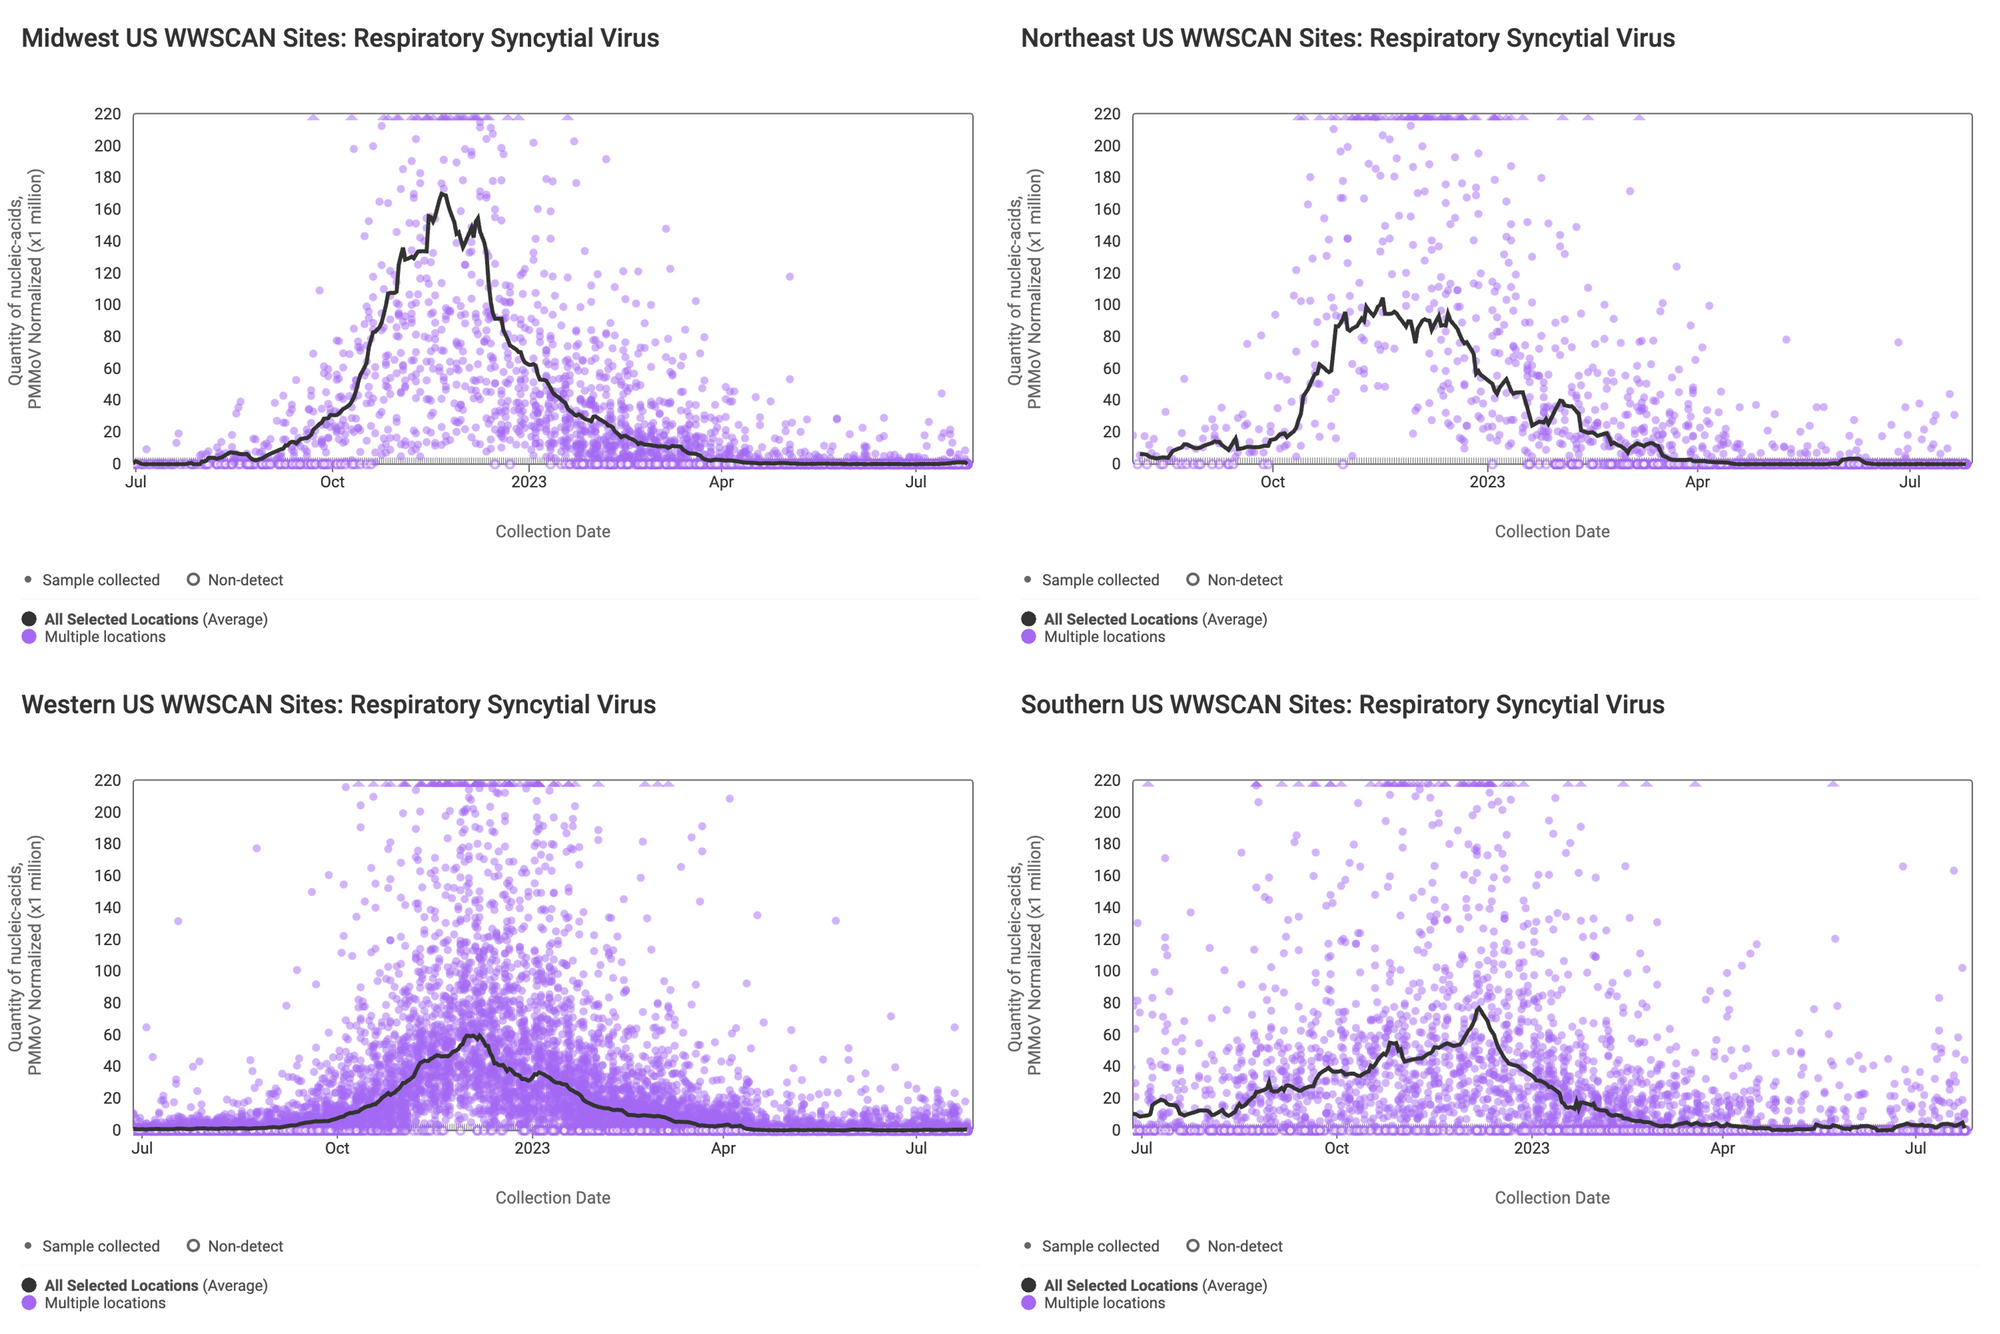
Below are the RSV RNA concentrations (normalized by PMMoV) from sites in the Midwest US (top left panel), Northeast US (top right panel), Southern US (bottom right panel) and Western US (bottom left panel). The population weighted average across regional WWSCAN plants is shown in black. Evident in the data are relatively high concentrations across all US regions around the start of the year with very low levels and mostly non-detects presently observed.
Below is the trend analysis for the RSV RNA concentrations (normalized by PMMoV) in wastewater solids at all participating plants. Red indicates a significant upward trend, blue is a significant downward trend, and dark grey is no trend. Yellow indicates that there were not enough data points to calculate a trend.
Of the 171 sites: 0 show an upward trend, 168 show no trend, and 0 show a decreasing trend. The remaining 3 site (Columbus, GA, Hilo, HI and Sunnyvale, TX) do not have enough data to calculate a trend.

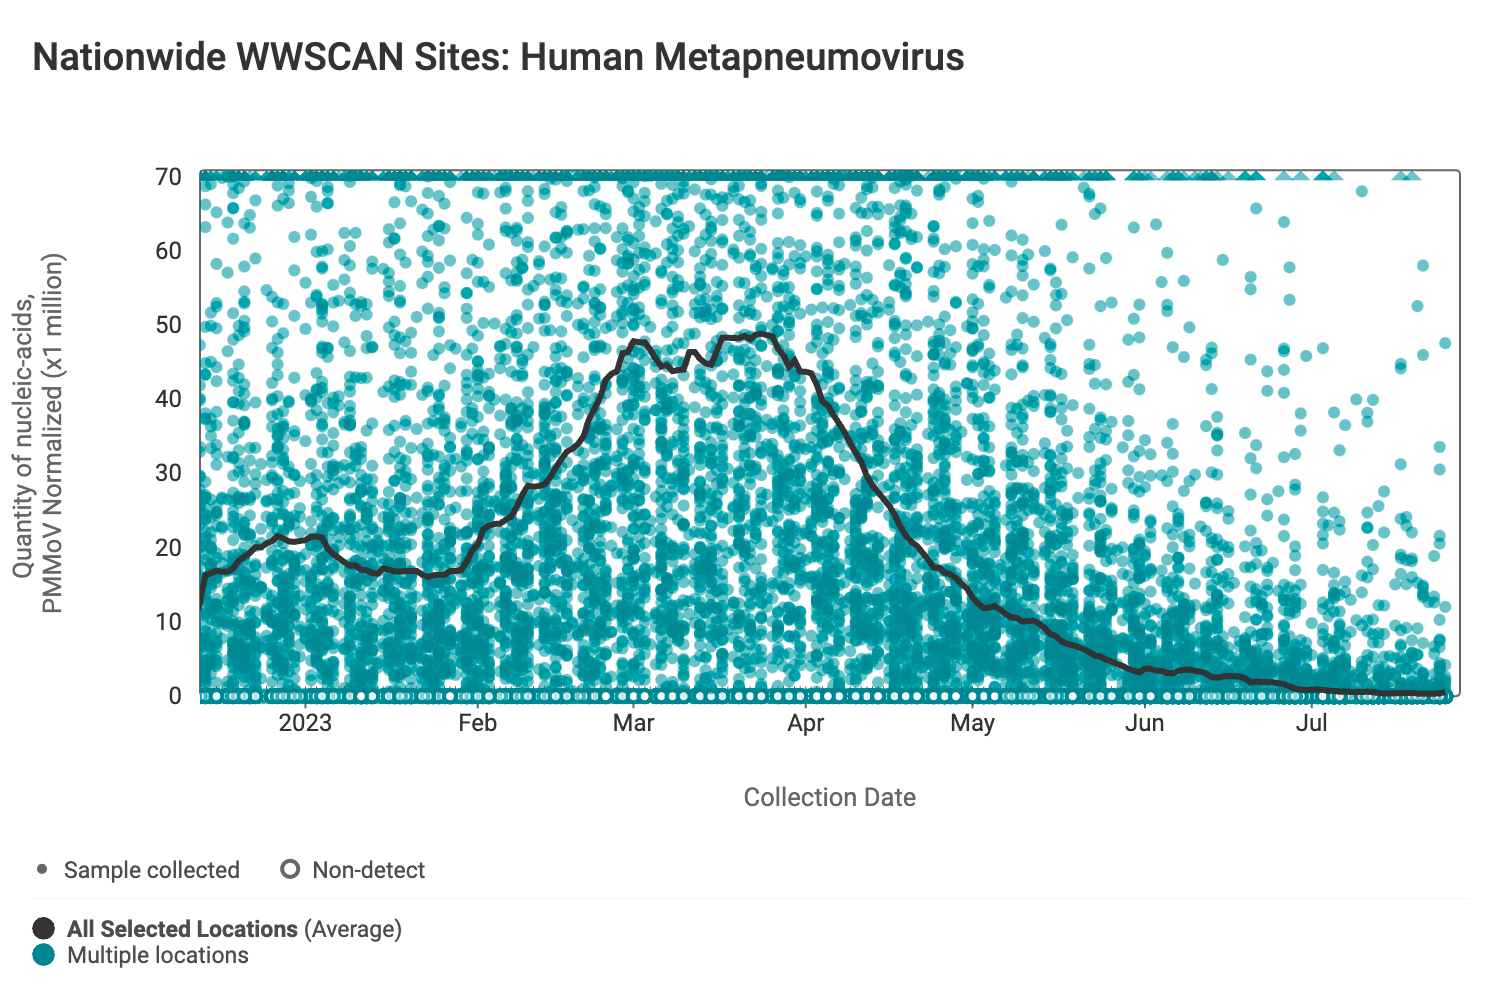
HMPV (human metapneumovirus) RNA concentrations are low signaling the end of HMPV season. The median concentration across all sites over the last 21 days is below the lower detection limit of the assay. Below are the HMPV RNA concentrations (normalized by PMMoV) from all participating WWSCAN sites across the country.
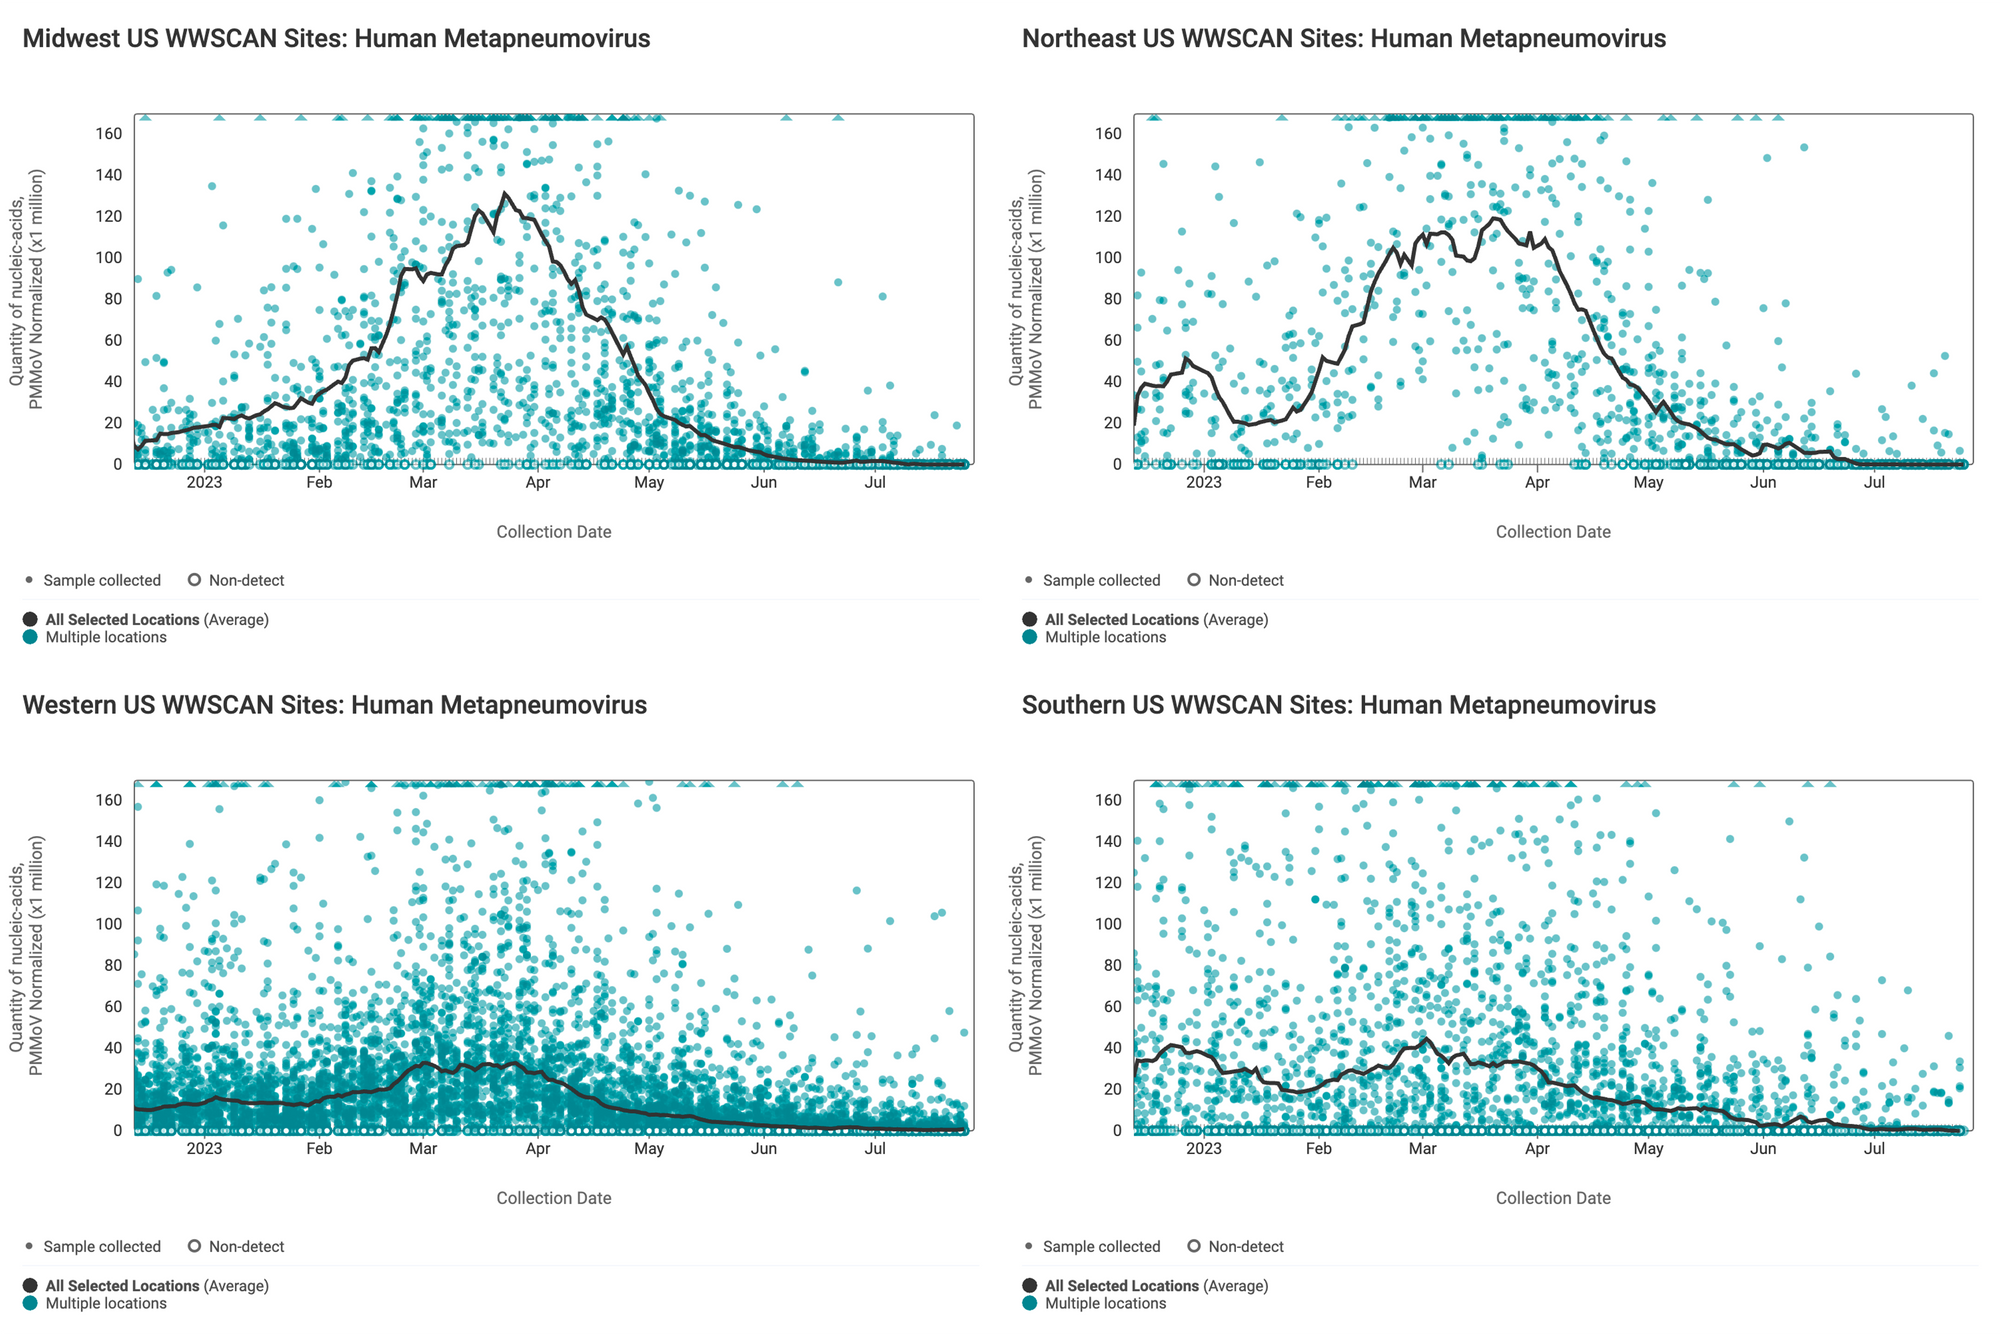
Below are the HMPV RNA concentrations (normalized by PMMoV) from sites in the Midwest US (top left panel), Northeast US (top right panel), Southern US (bottom right panel) and Western US (bottom left panel). The population weighted average across regional WWSCAN plants is shown in black. Evident in the data are relatively high concentrations across all US regions around the start of the year with very low levels and mostly non-detects presently observed.
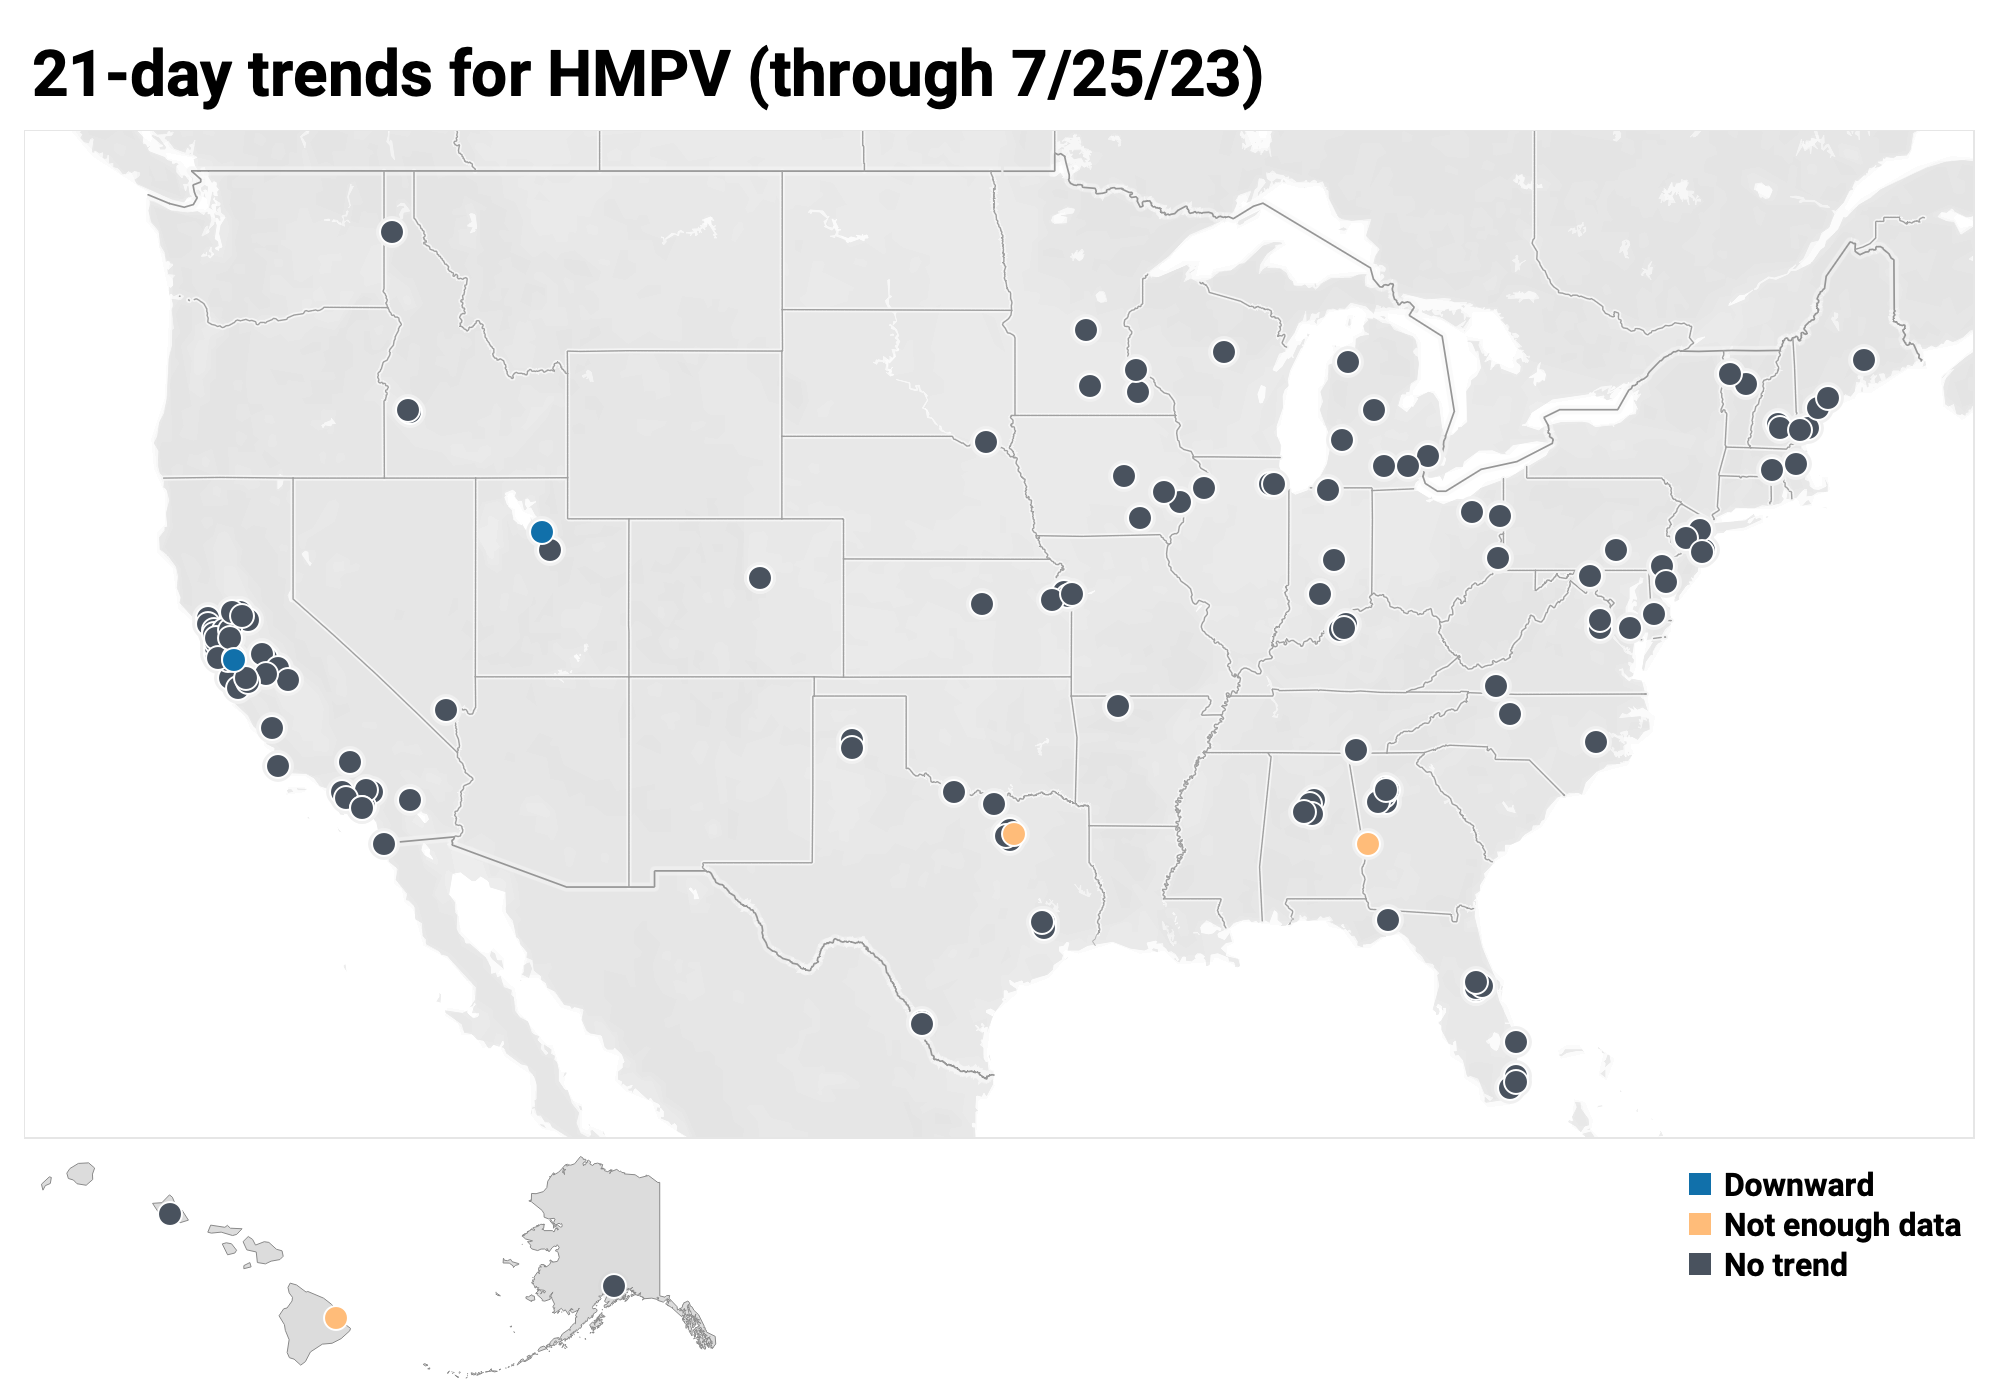
Below is the trend analysis for the HMPV RNA concentrations (normalized by PMMoV) in wastewater solids at all participating plants. Red indicates a significant upward trend, blue is a significant downward trend, and dark grey is no trend. Yellow indicates that there were not enough data points to calculate a trend.
Of the 171 sites: 0 show an upward trend, 166 show no trend, and 2 show a decreasing trend. The remaining 3 site (Columbus, GA, Hilo, HI and Sunnyvale, TX) do not have enough data to calculate a trend.
Gastrointestinal Pathogens
Enteric diseases are caused by micro-organisms that can cause intestinal illness
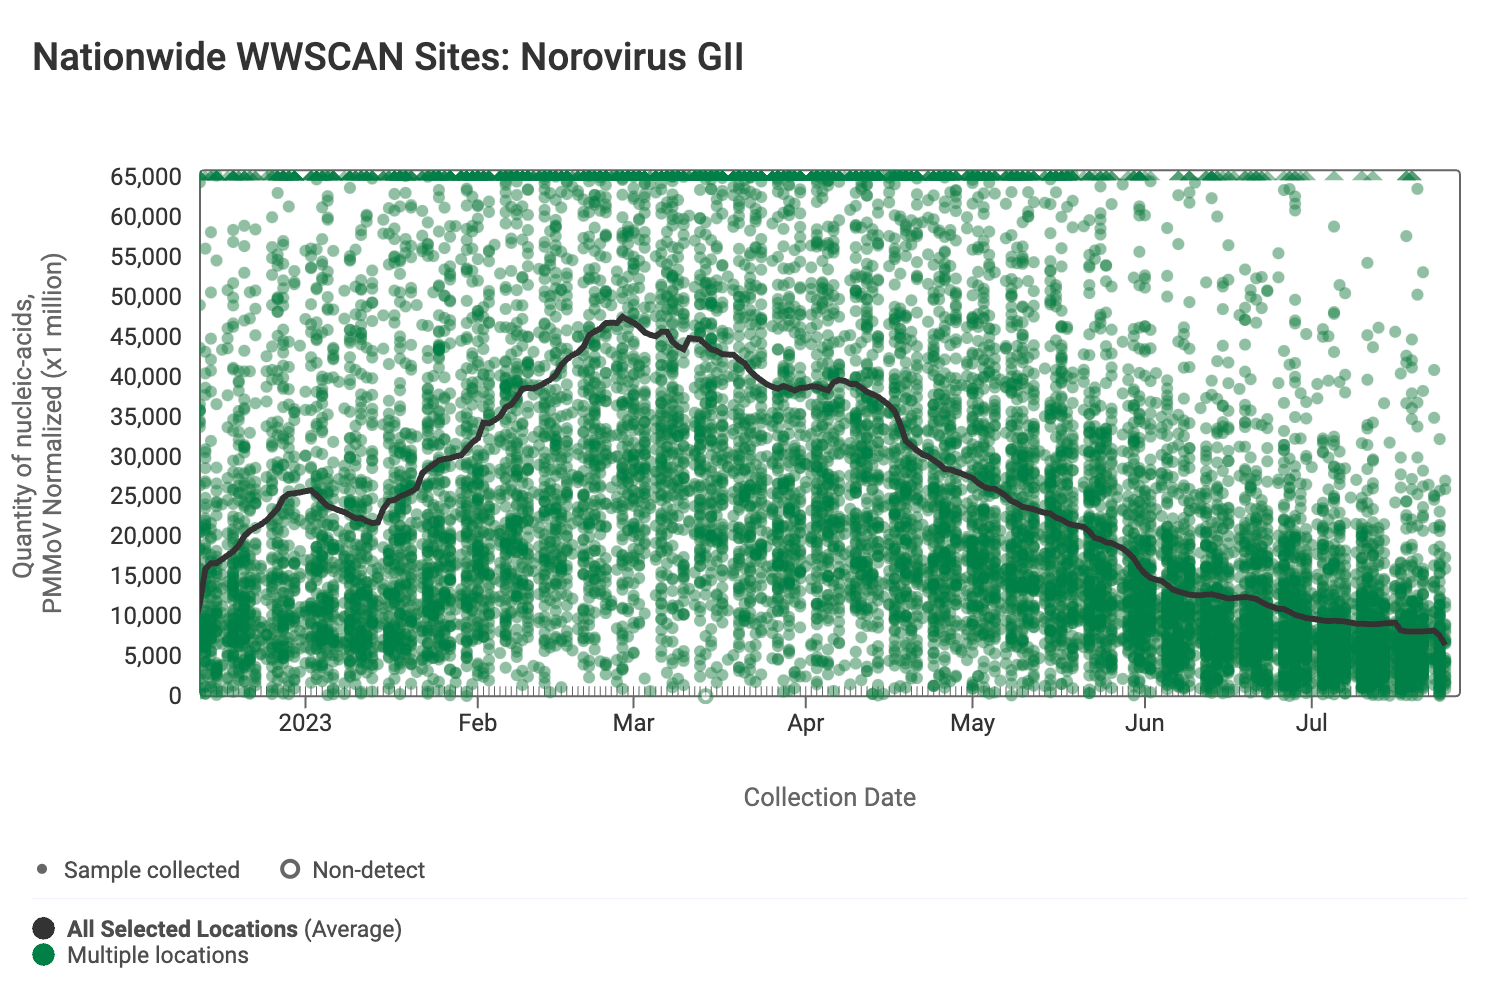
Norovirus GII (HuNoV GII) RNA has been consistently detected at the sites. The median concentration across all sites over the last 21 days is 2,807,893 copies/gram. Below are the HuNoV GII RNA concentrations (normalized by PMMoV) from all participating WWSCAN sites across the country.
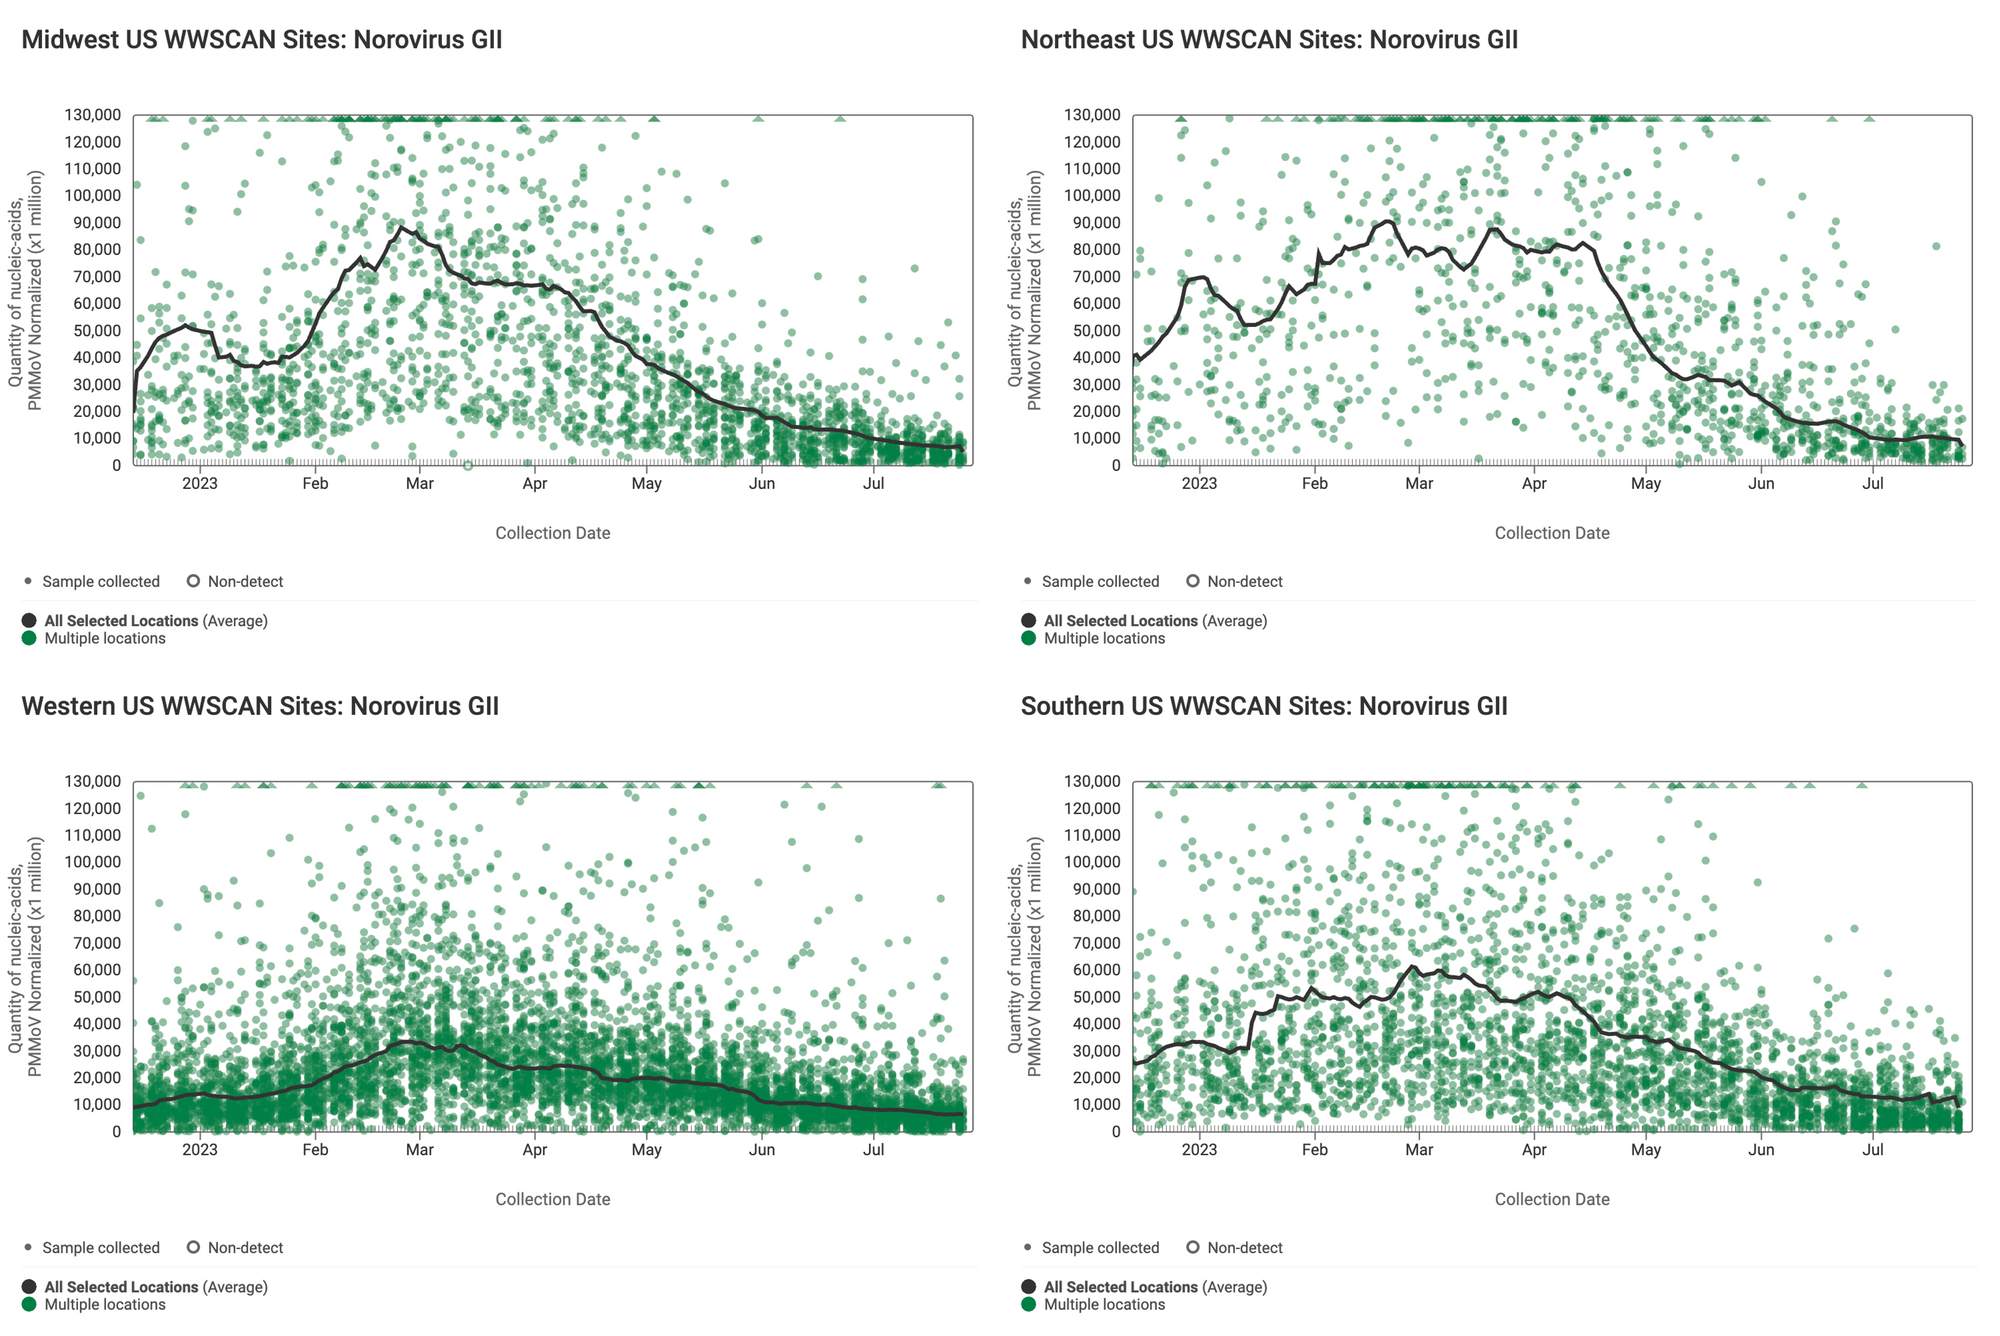
Below are the HuNoV GII RNA concentrations (normalized by PMMoV) from sites in the Midwest US (top left panel), Northeast US (top right panel), Southern US (bottom right panel) and Western US (bottom left panel). The population weighted average across regional WWSCAN plants is shown in black.
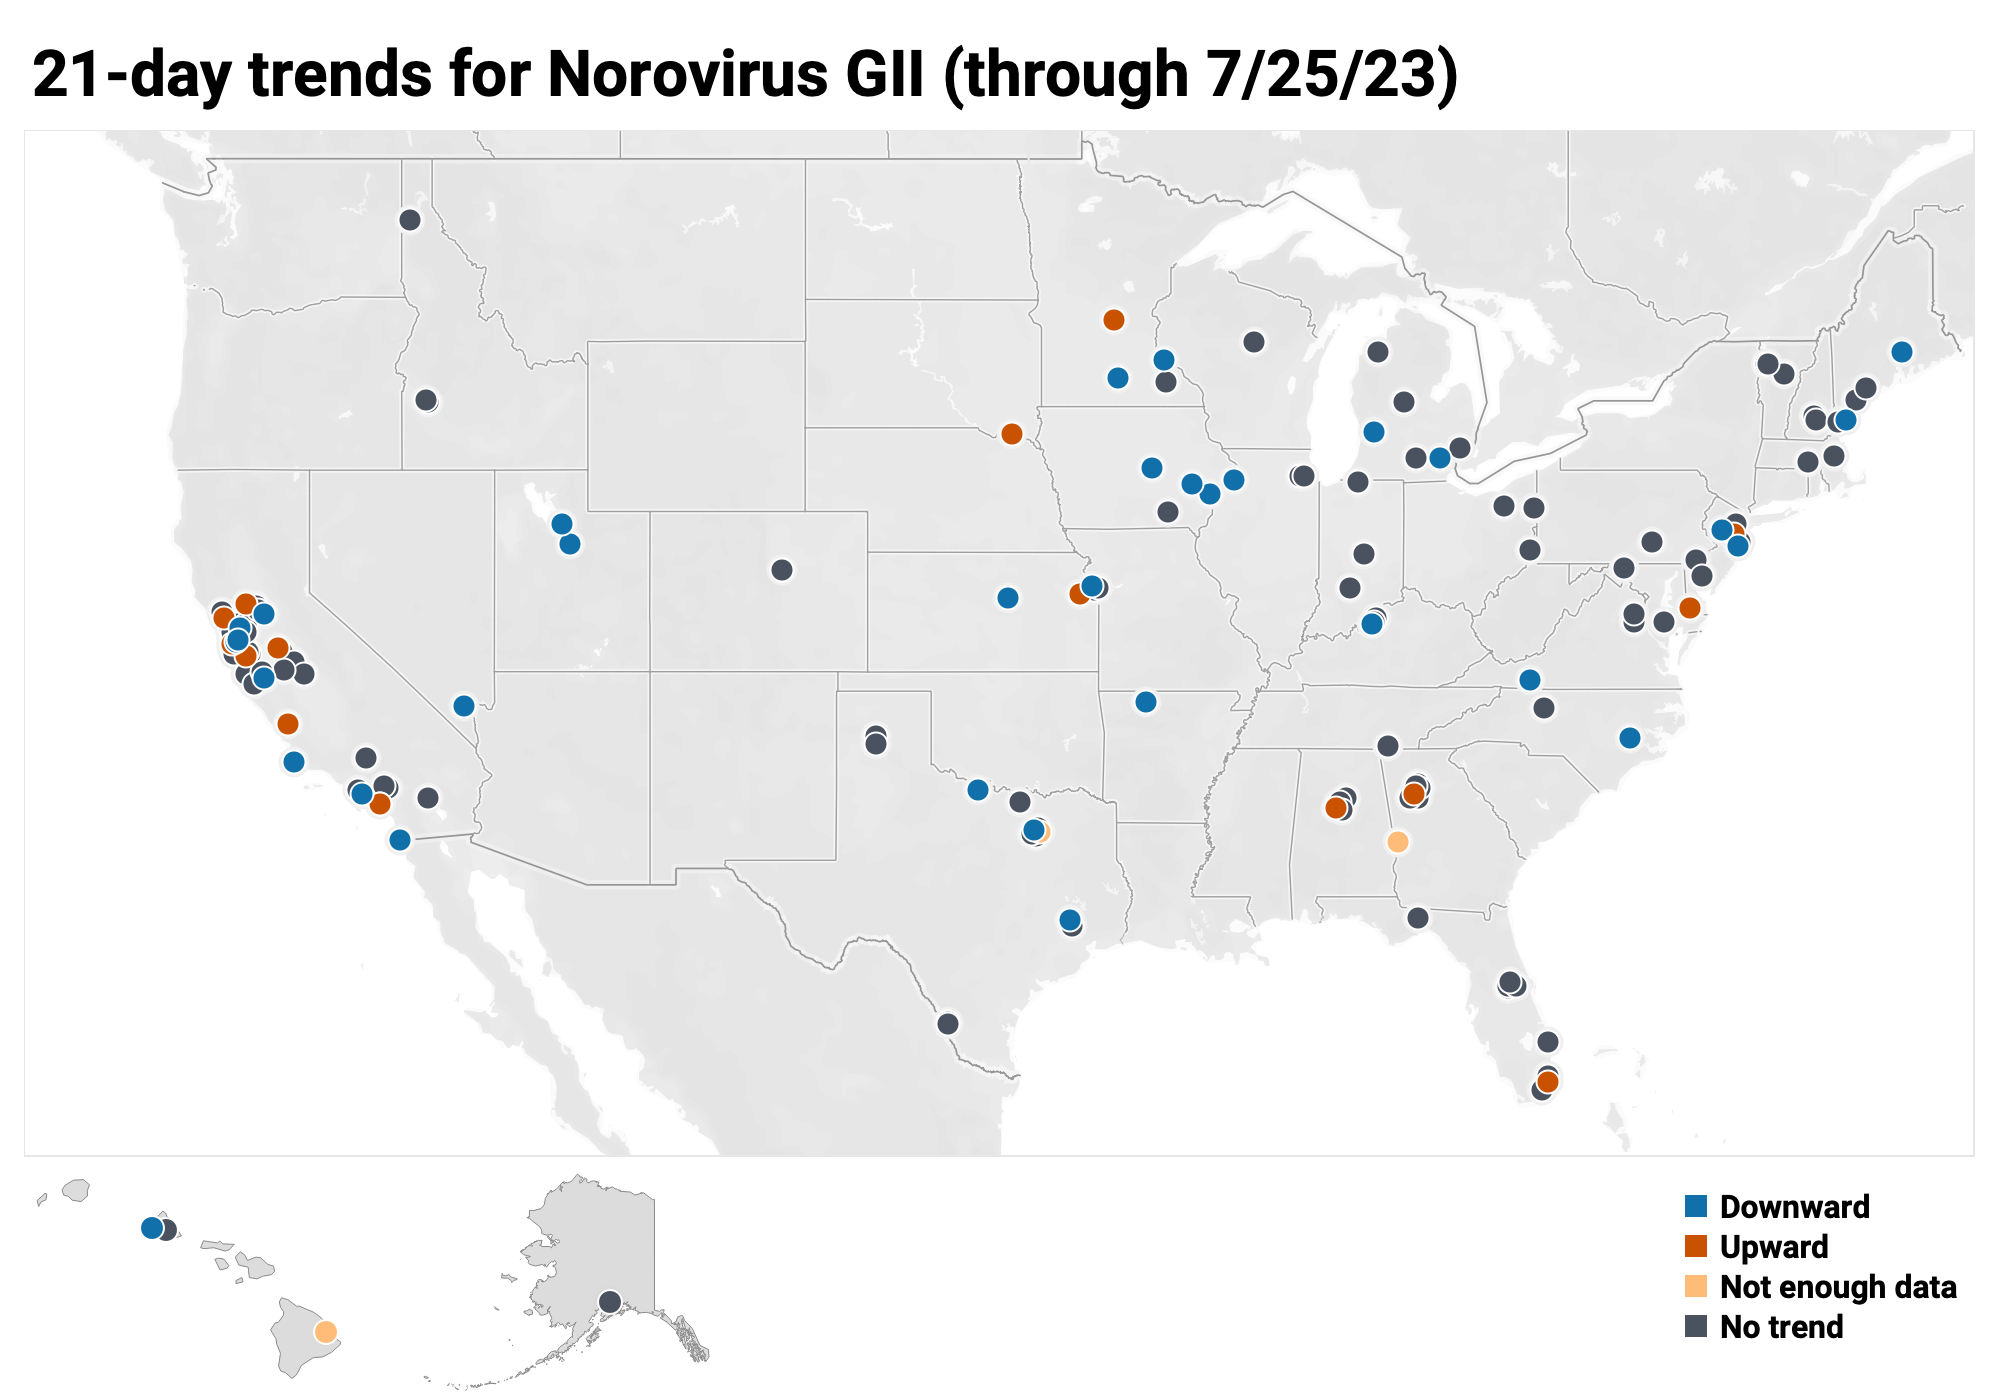
Below is the trend analysis for the Norovirus GII RNA concentrations (normalized by PMMoV) in wastewater solids at the plants. Red indicates a significant upward trend, blue is a significant downward trend, and dark grey is no trend. Yellow indicates that there were not enough data points to calculate a trend.
Of the 171 sites: 15 show an upward trend, 120 show no trend, and 33 show a decreasing trend. The remaining 3 site (Columbus, GA, Hilo, HI and Sunnyvale, TX) do not have enough data to calculate a trend.
Other Pathogens of Concern
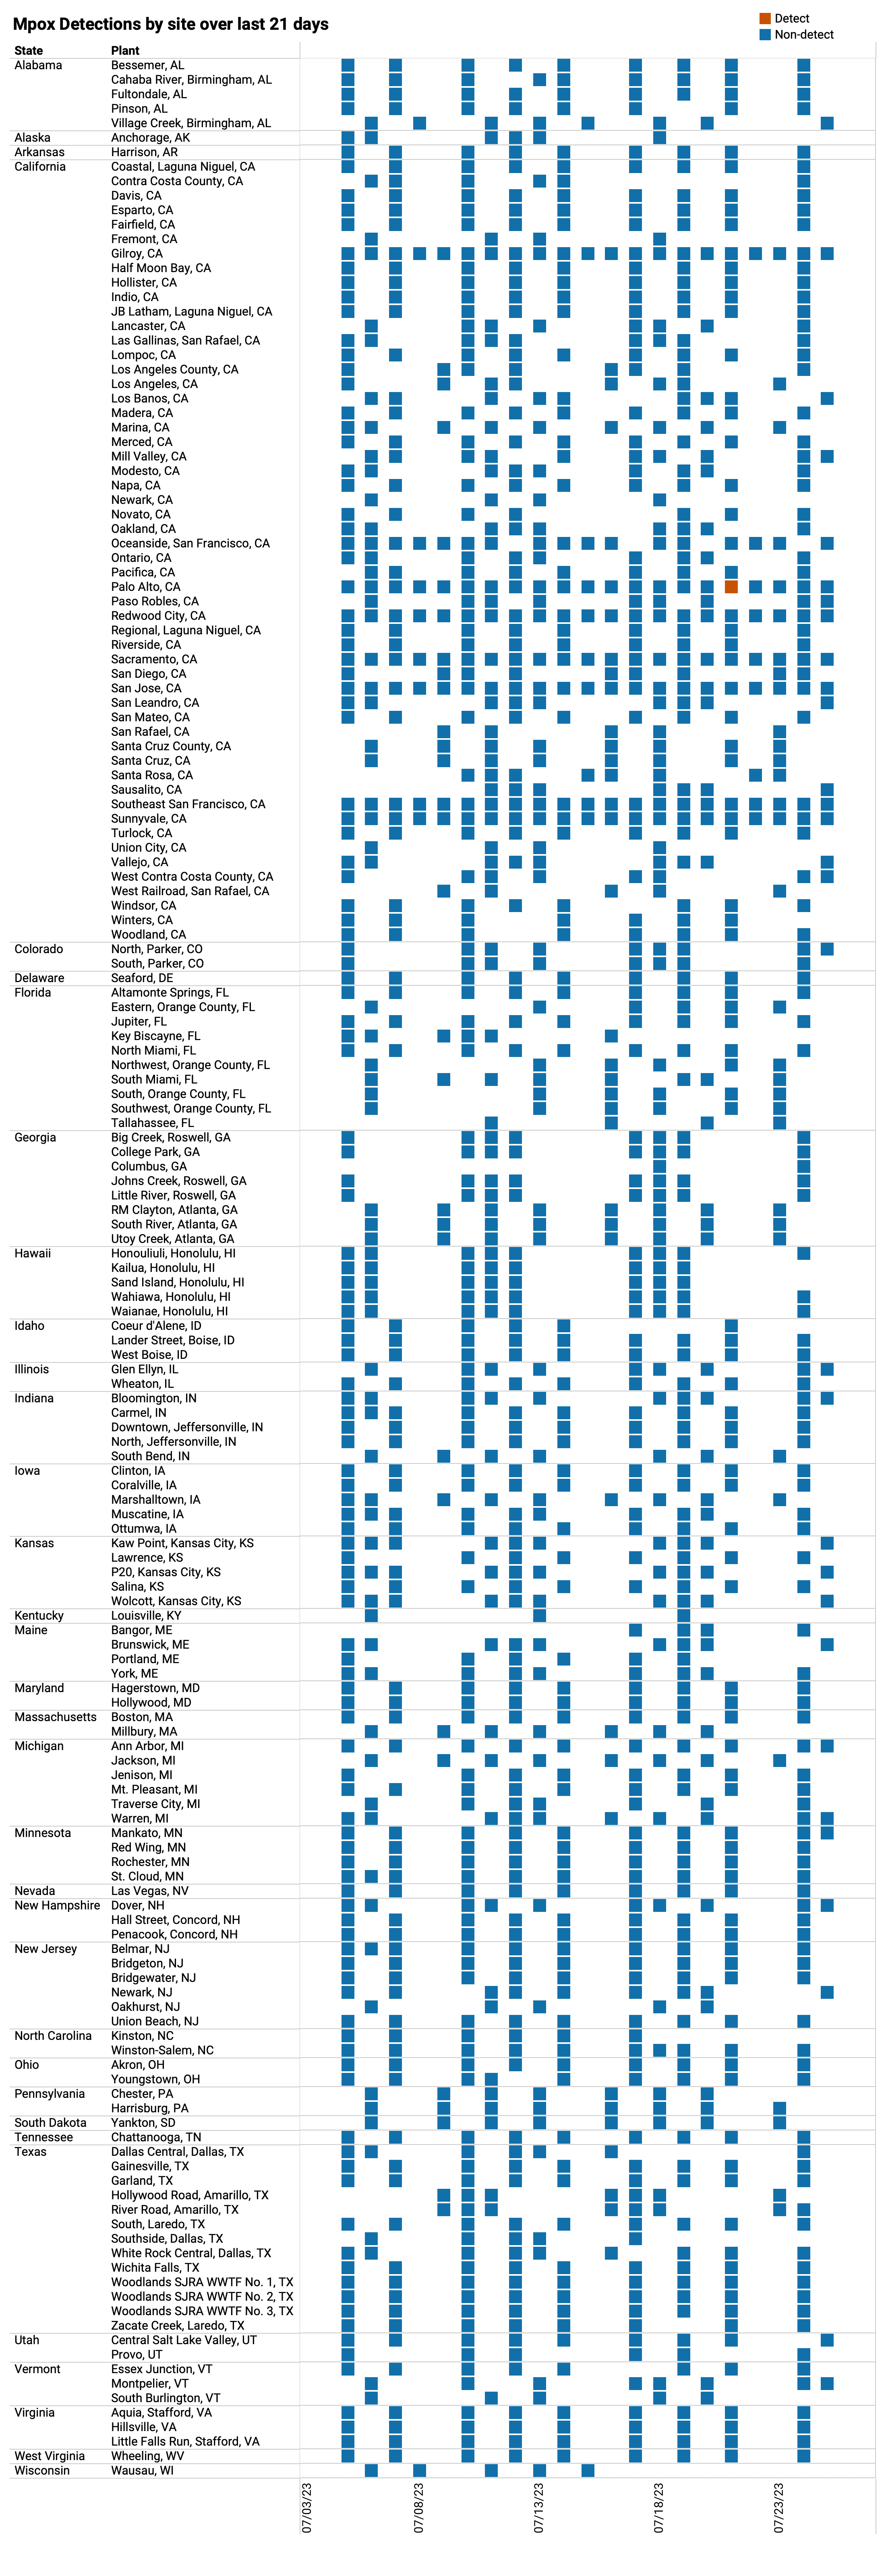
Detection of Mpox DNA in wastewater solids over past 21-days is rare
Mpox DNA We rarely detected mpox DNA in samples from any site over the past three-weeks. Below you can see, in red, there have only been 1 positive samples out of 1,465 samples during the past 21 days. Outbreaks seem to be under control, but we will continue to monitor so that public health departments can respond if we see consistent detections and increases in concentrations in any sites. The chart below shows every plant in WWSCAN (171) as rows, and the last 21 days as columns (labeled at the bottom axis). White indicates no samples, blue is non-detect for mpox DNA and red is detect for mpox DNA. As a reminder, you can access our paper in New England Journal of Medicine about how our mpox wastewater monitoring compares to clinical reports of infectious here.
Join us at the next WWSCAN Stakeholder call on Aug 11th, 2023
At the August WWSCAN Stakeholder meeting we will discuss new targets being onboarded as well as new website features to help with interpreting wastewater trends and levels.
If you have questions about the website or anything else, submitting them in advance here will help us plan to address everything. We hope to see you there!