
Nationwide WWSCAN Update 9/22/23
Hi everyone,
This newsletter contains updates on the WastewaterSCAN program with wastewater samples collected through September 20, 2023. Below you will find information on the program in terms of participating partners, review of targets being measured, as well as trends in concentrations of infectious disease targets.
Enjoy your weekend,
Ali & Marlene
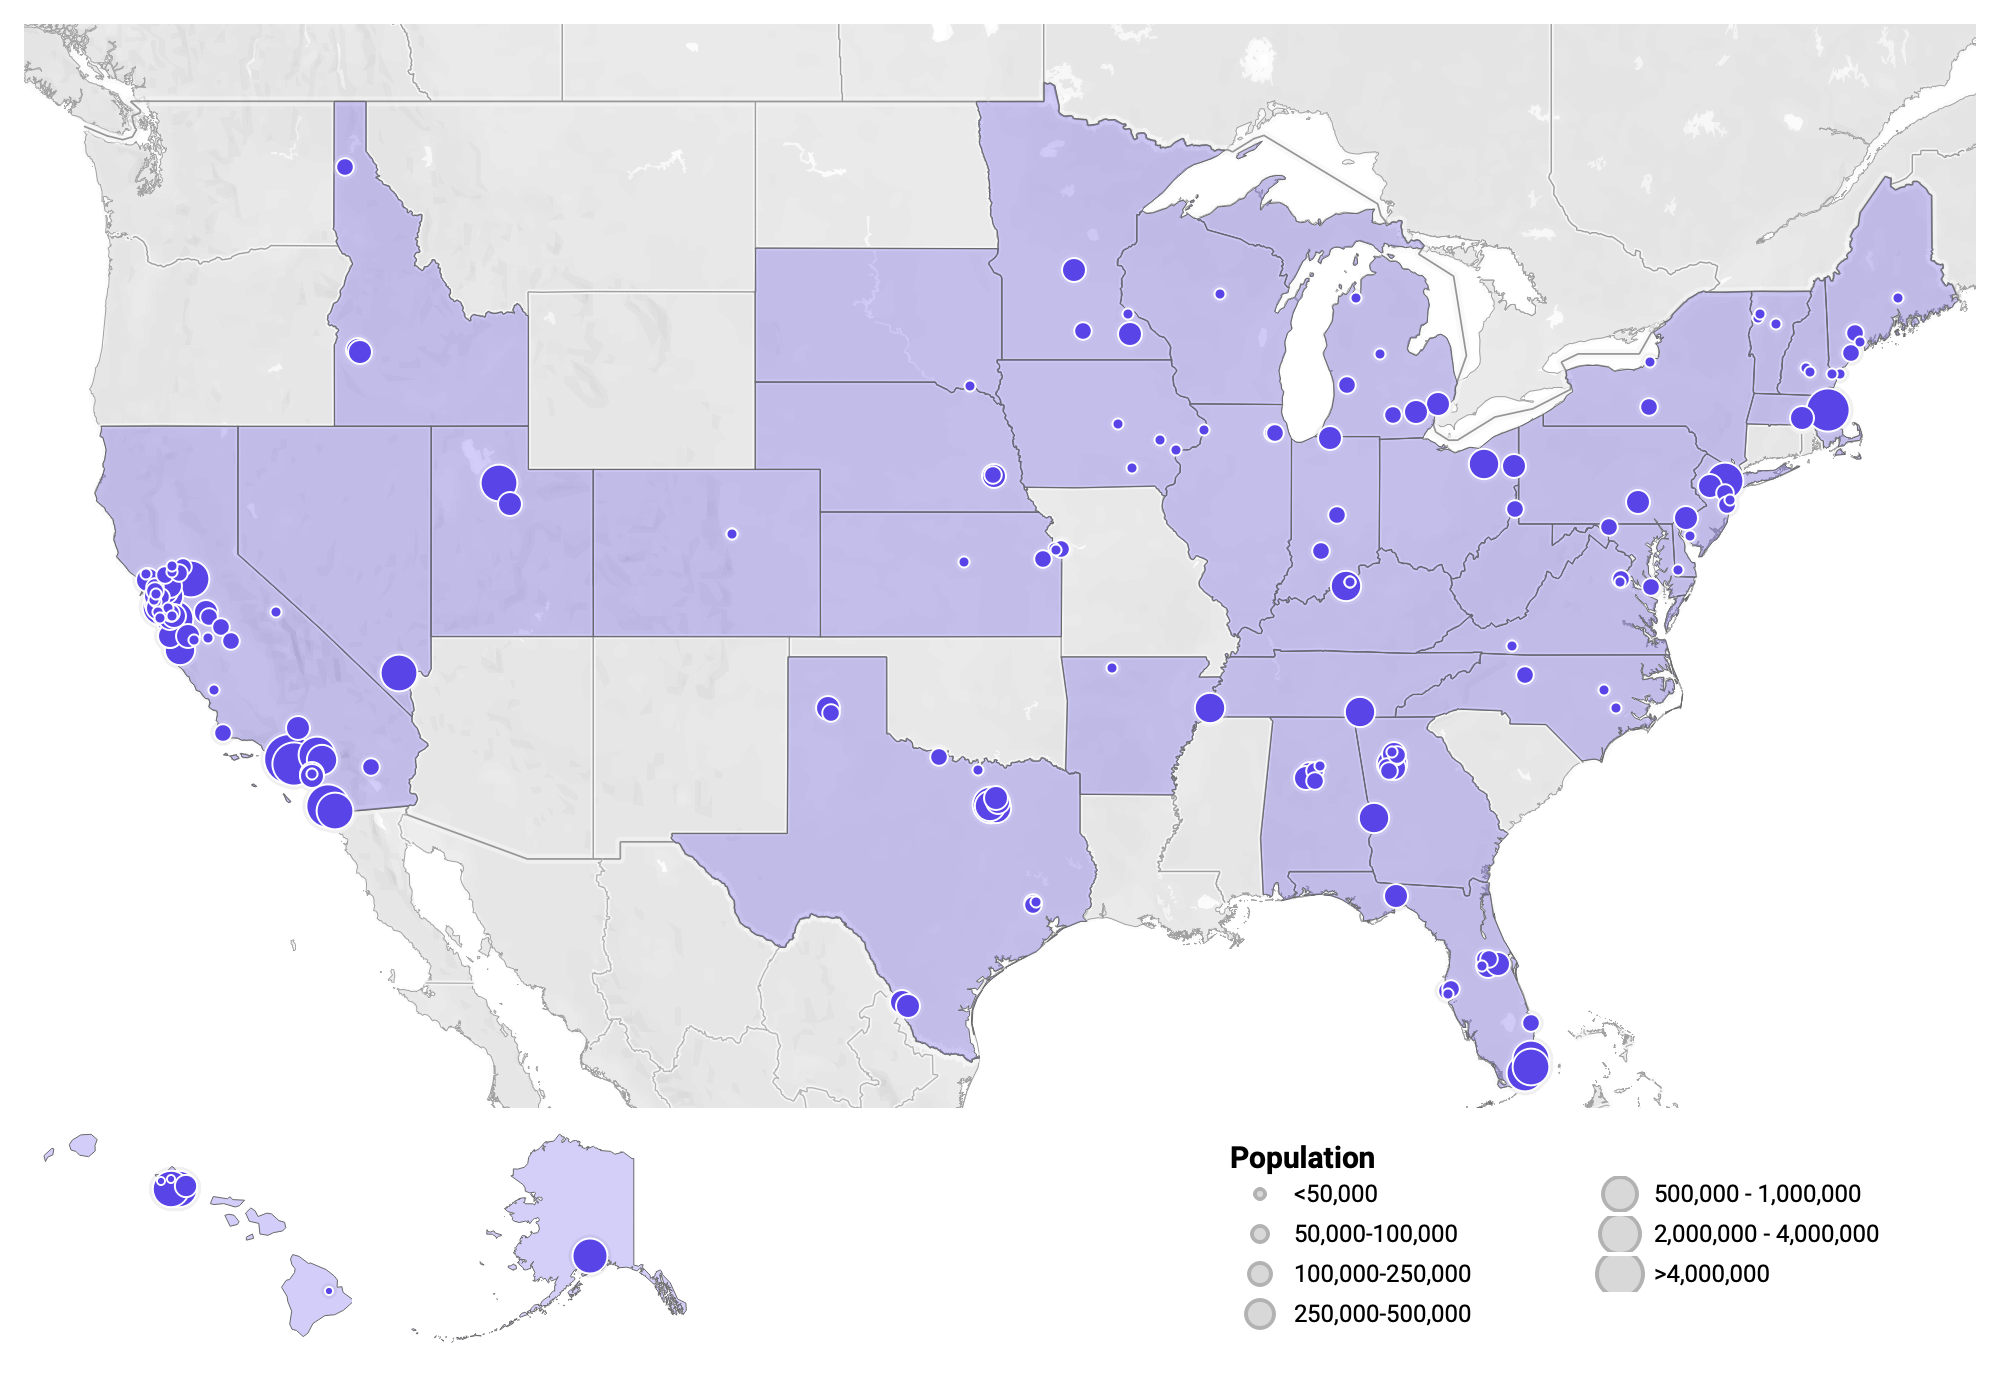
Participating Plants
181 plants from 36 states are sampling, which represents ~12.7% of the US population
WWSCAN Participant Stats:
- 181 plants sampling
- 42,716,760 people covered through sampling efforts
- 36 states represented
- 2 new onboarded sites - Grants Pass OR* and Snohomish, WA* (*= new state)
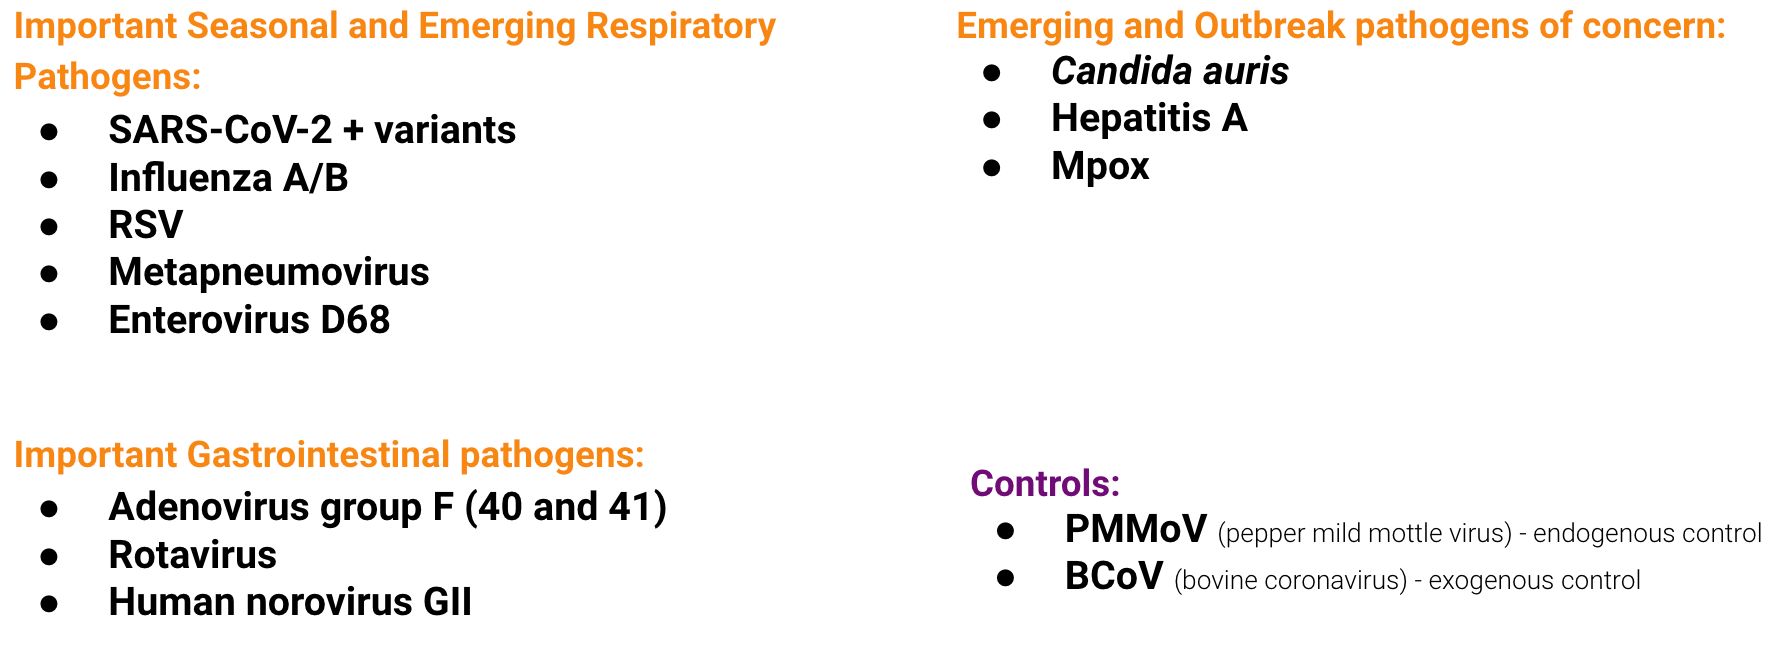
Infectious Disease Target Review
Currently monitoring a suite of Respiratory, Gastrointestinal and Outbreak Pathogens of Concern
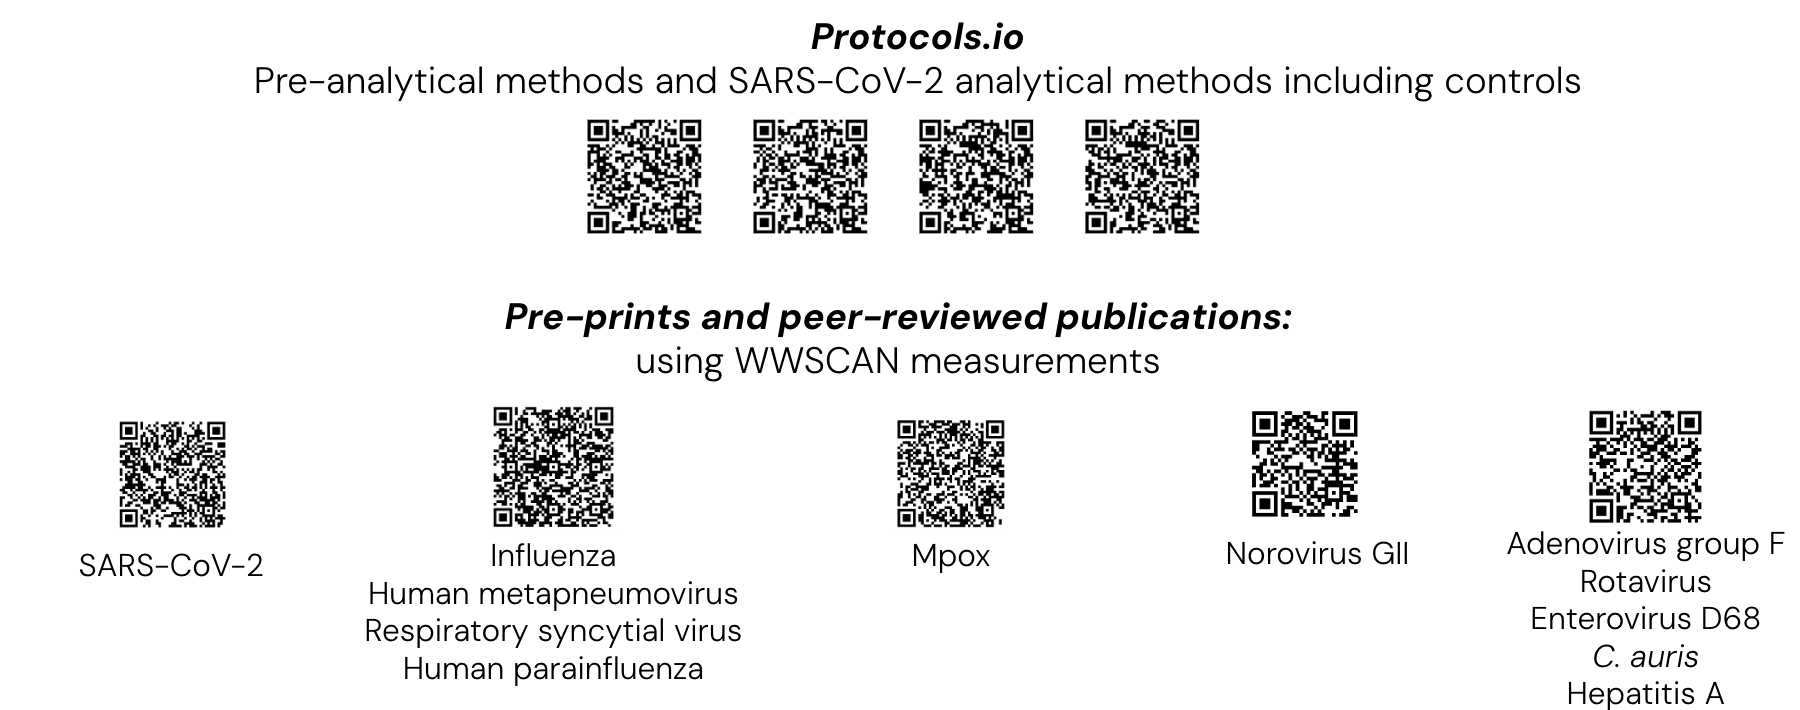
The methods for our assays are in the public domain. You can access them using these QR codes:
We will be migrating new pathogen results (for EVD68, Adenovirus group F, Rotavirus, Candida auris, and Hepatitis A) from the staging site to the main data.wastewastescan.org site starting on Monday Sept 25, 2023.
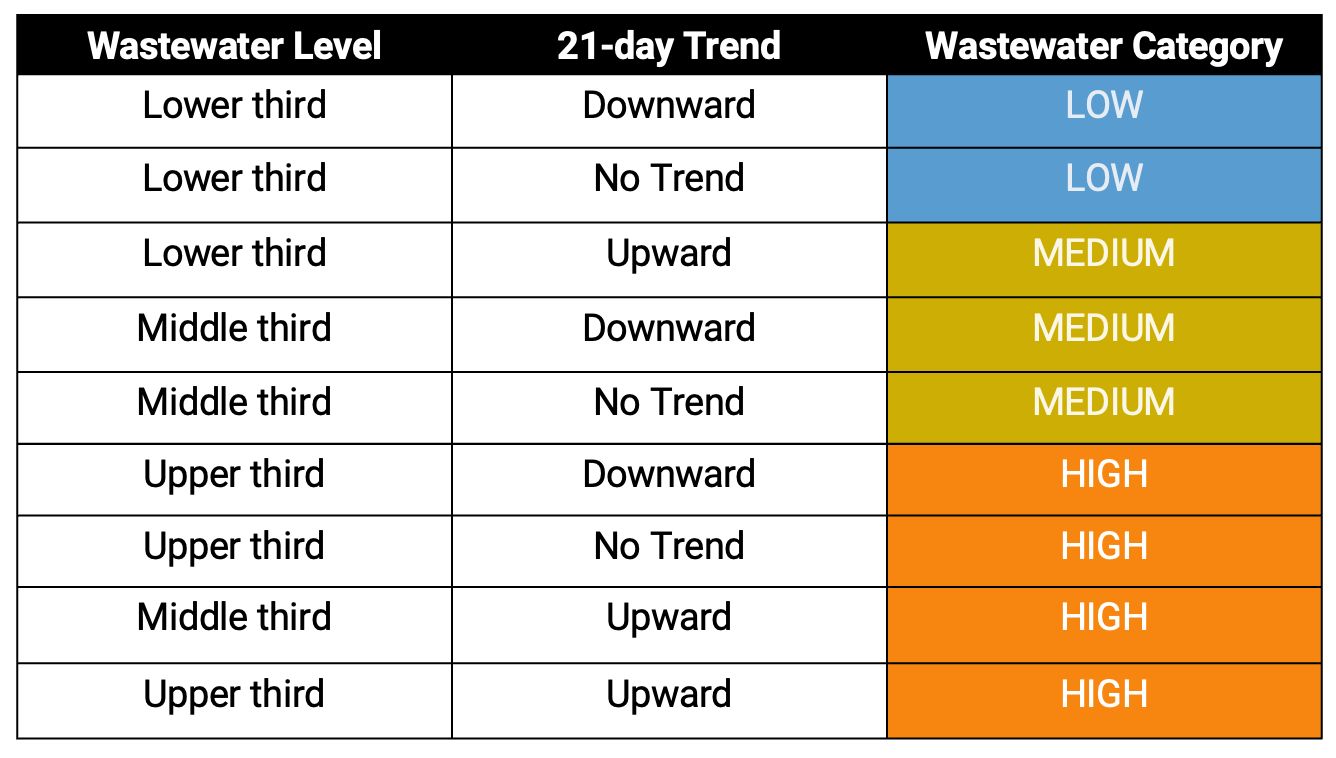
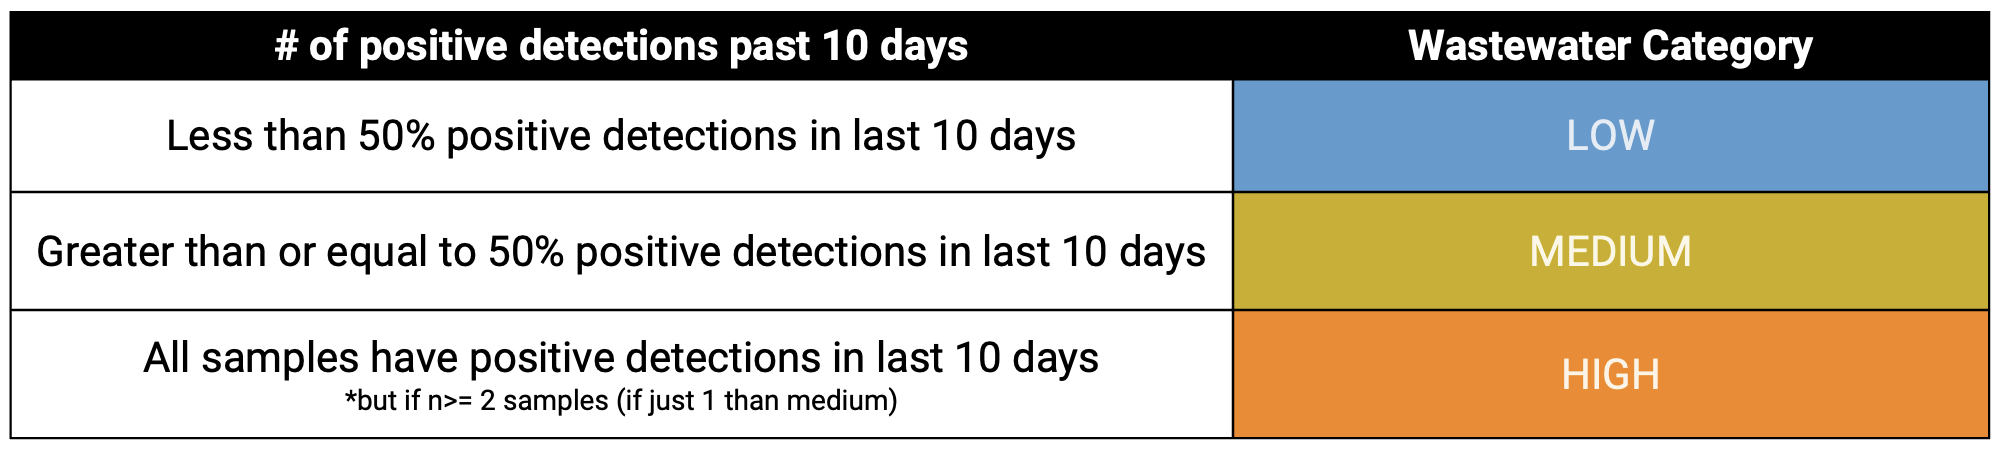
Wastewater Categories
Looking at trends, levels, and frequency of detection to categorize what we are seeing in wastewater
We recently implemented a new Wastewater Categorization system to better help communicate what wastewater is telling us about community disease occurrence. The wastewater categorization looks at trends (to tell us how things have changed in last 21 days), levels (to tell us whether wastewater concentrations are relatively lower or higher than what they have been in the past), and frequency of detection (for rarer pathogens). The new Wastewater Categorization system is explained in more detail in this video.
We plan for the Wastewater Categories to go live on the website next week.
The Wastewater Categories are broken up into 3 archetypes for WWSCAN Pathogens:
- Pathogens that are commonly detected (regardless of season) - SARS-CoV-2, Norovirus, and ‘peak season’ Respiratory pathogens (IAV, RSV, HMPV)
- Seasonal pathogens (rarely detected outside of season/outbreaks) - IAV, RSV, HMPV
- The onset dates of IAV, RSV, and HMPV wastewater events are identified as the first day for which all samples in a 14 day look back period had concentrations higher than or equal to 2,000 copies/g, which is approximately twice the lowest detectable concentration. Once IAV, RSV, or HMPV are onset, the method for 'commonly detected pathogens' (see above) is used to determine the wastewater categorization.
-The offset dates of IAV, RSV, and HMPV wastewater events were identified as the first day after an onset event for which only 50% of samples during a 14-d look back period have concentrations higher than or equal to 2,000 copies/g. When one of these signals is in offset, it is assign a ‘LOW’ categorization
- Pathogens that are not commonly detected (regardless of season) - Mpox
Respiratory Pathogens
SARS-CoV-2, Influenza A & B, Respiratory Syncytial Virus, & Human metapneumovirus
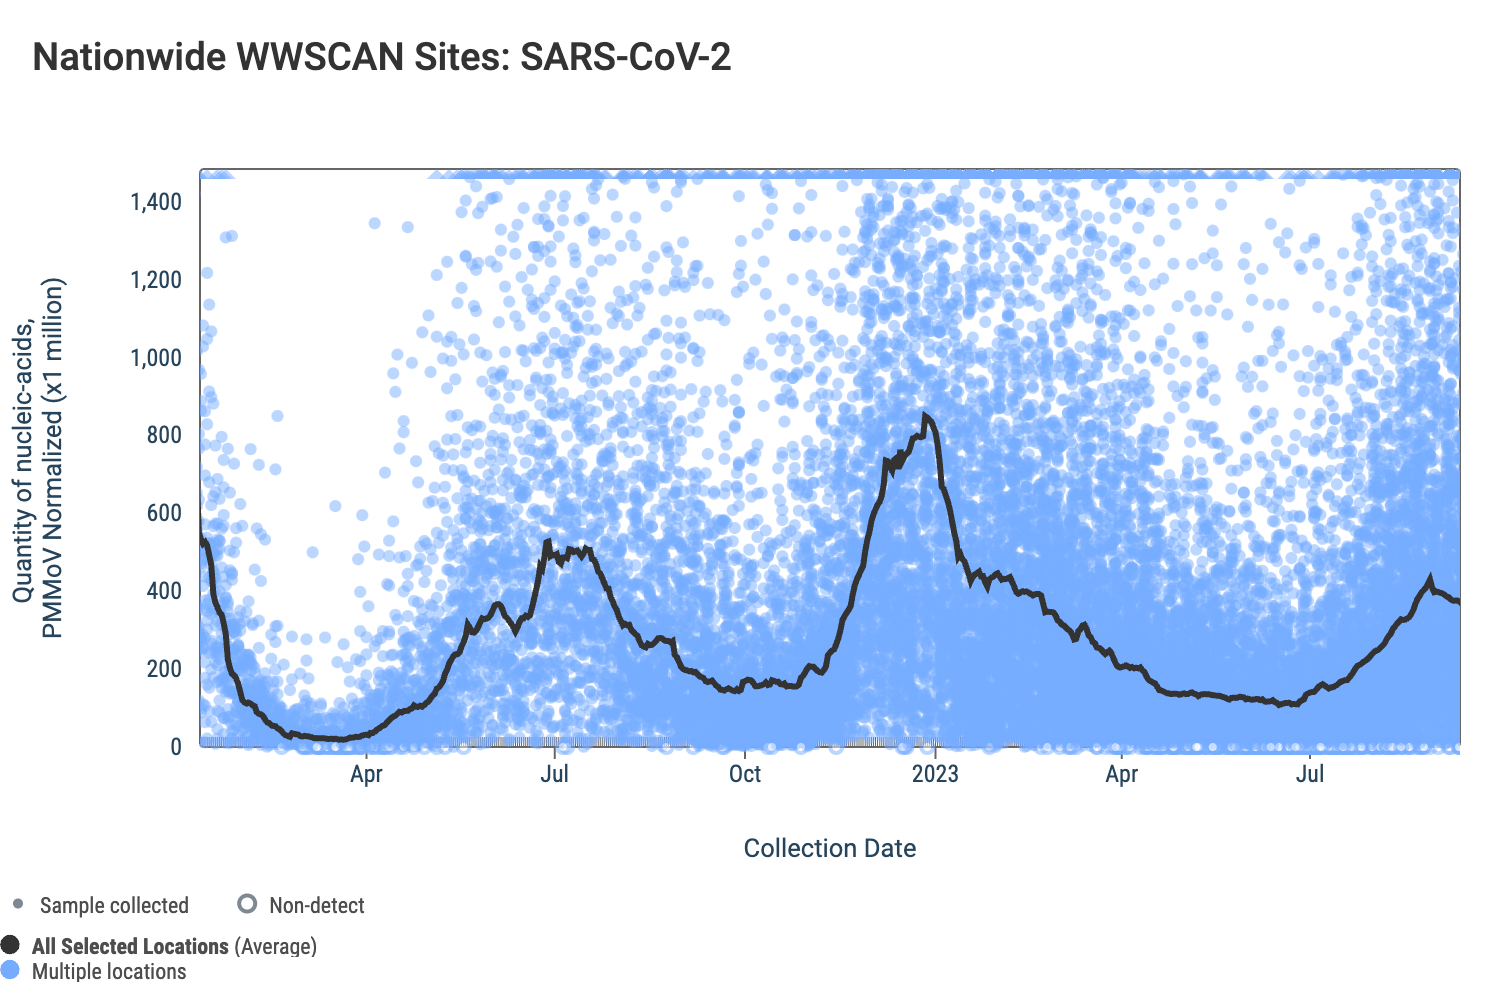
SARS-CoV-2 The median concentration of the N gene across all sites over the last 21 days is 108,678 copies/gram. Below are the SARS-CoV-2 N gene concentrations (normalized by PMMoV) from all participating WWSCAN sites across the country; raw data are shown as blue dots, the population weighted average is shown as a bold black line.
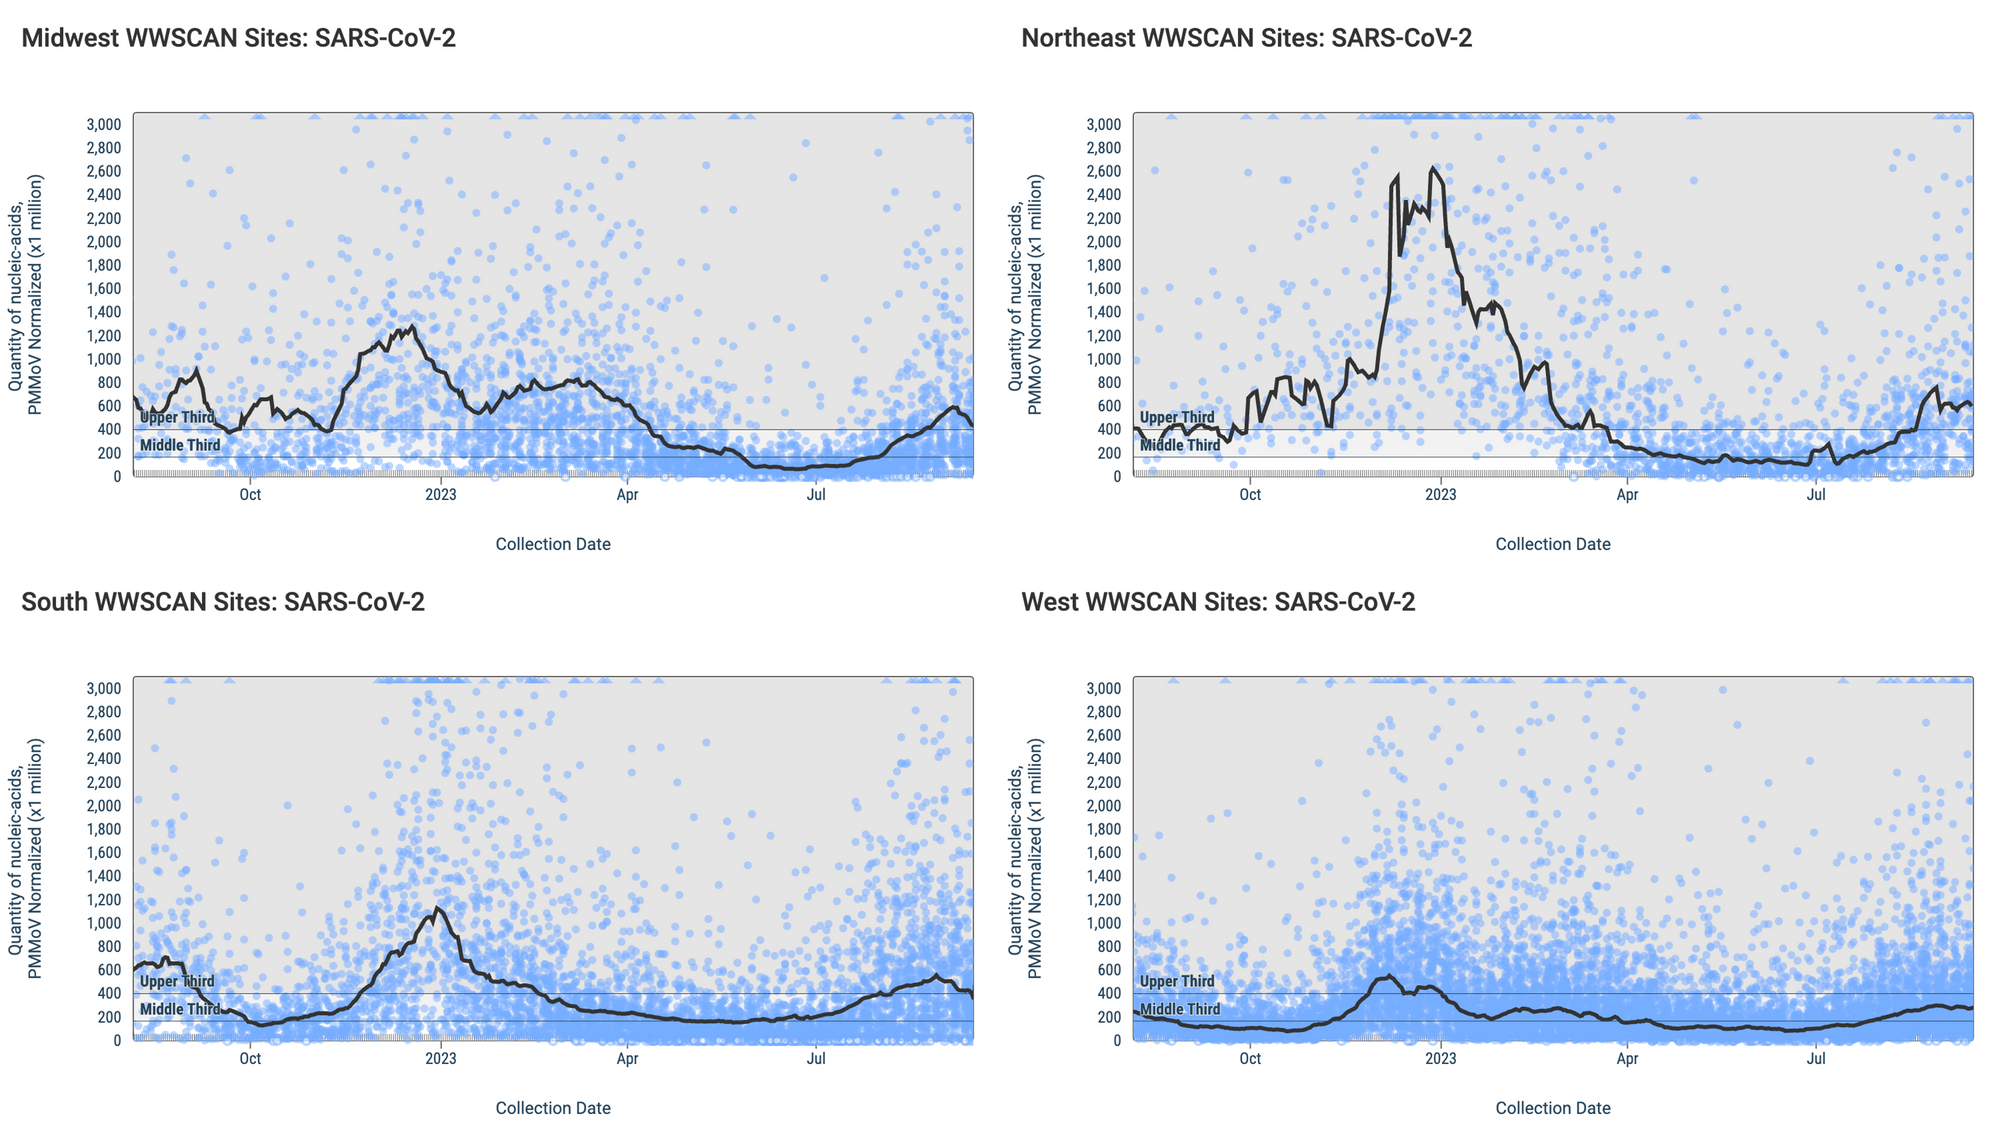
Below are the SARS-CoV-2 N gene concentrations (normalized by PMMoV) from sites in the Midwest US (top left panel), Northeast US (top right panel), Southern US (bottom right panel) and Western US (bottom left panel). The population weighted average across the regional WWSCAN plants is shown in black, and the raw data are shown in blue.
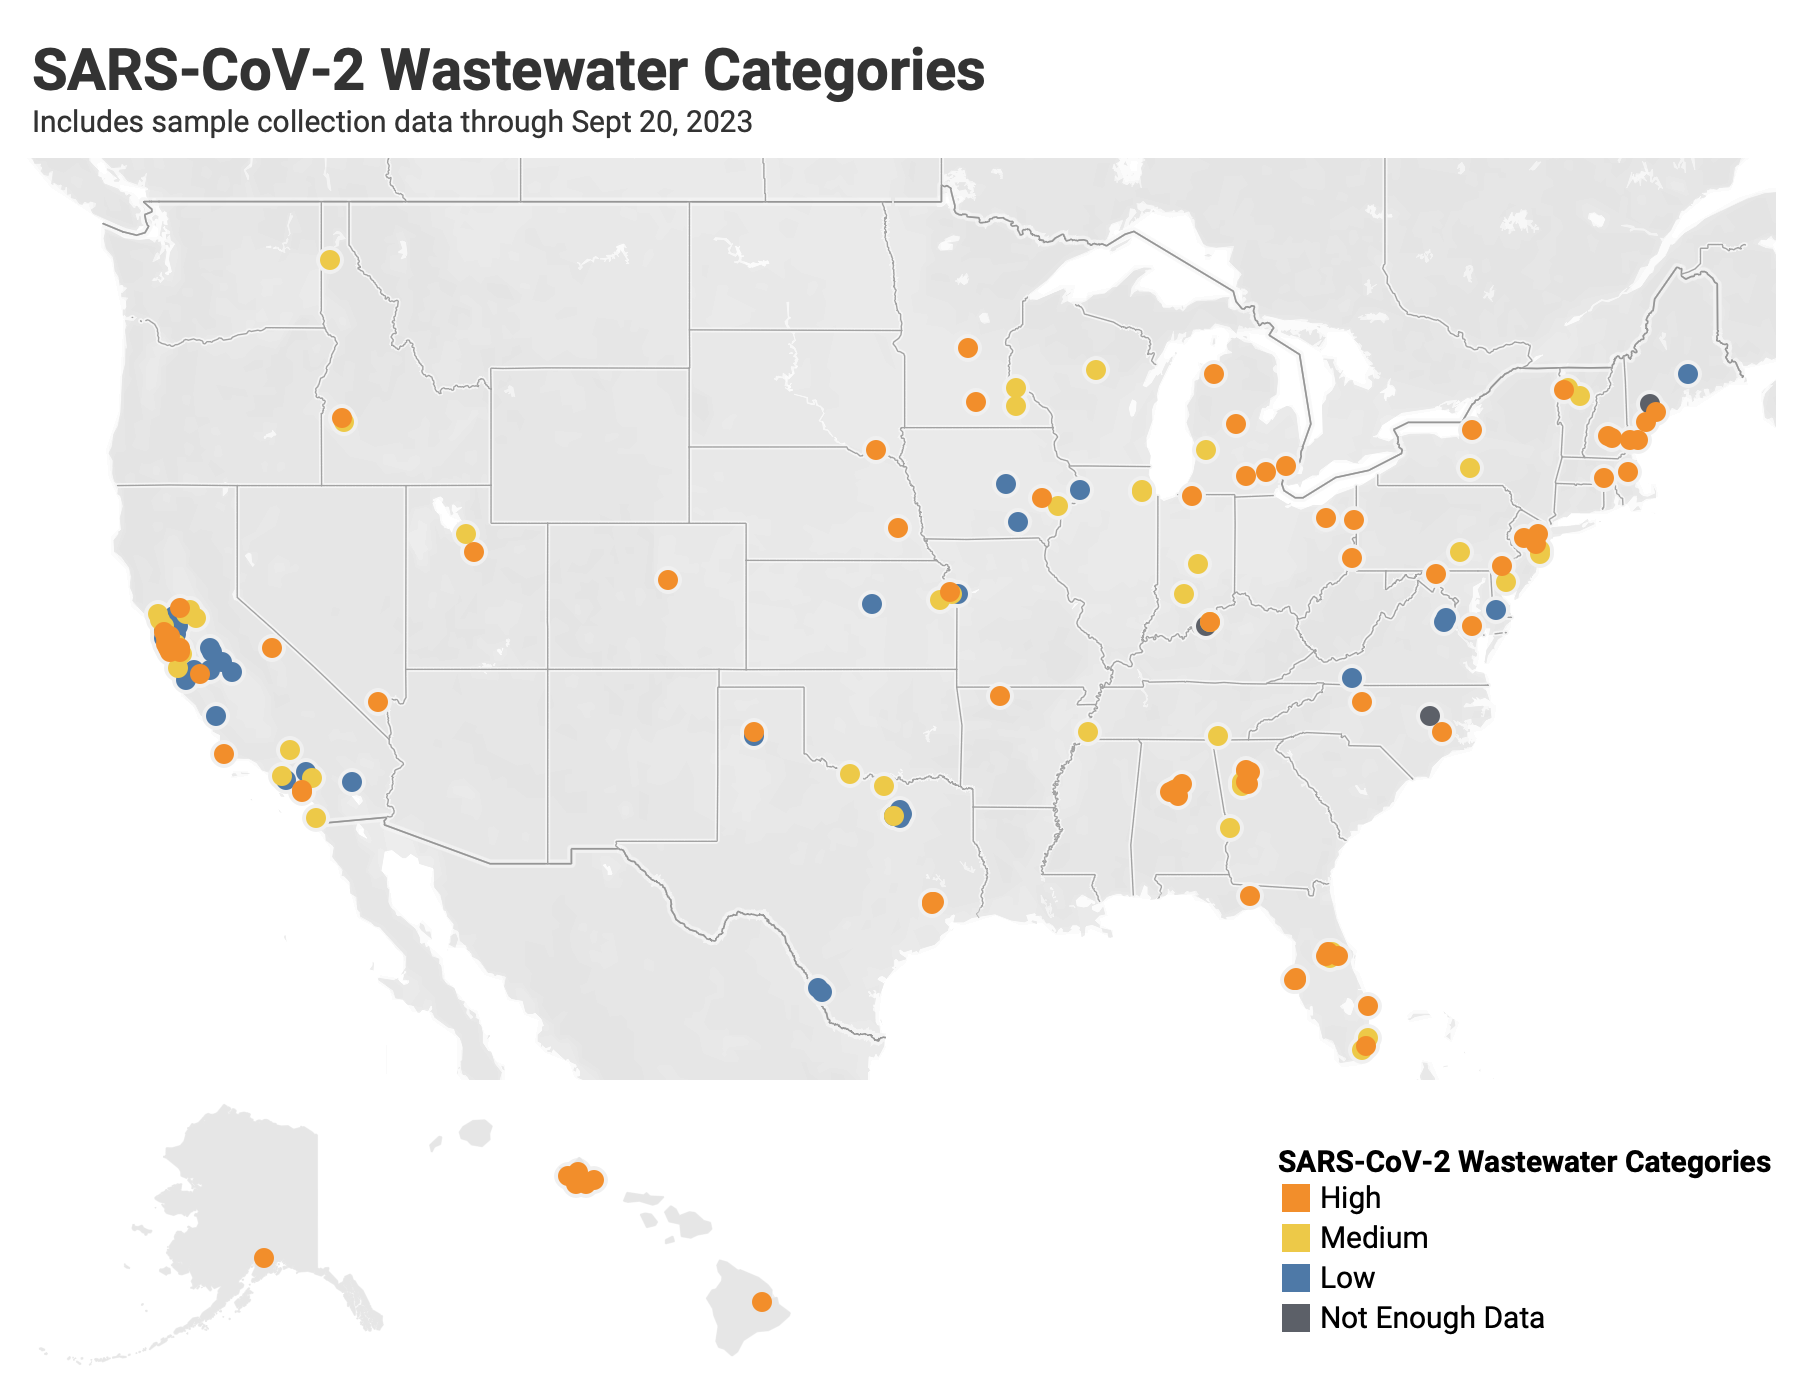
Below are the current SARS-CoV-2 wastewater categories for all WWSCAN sites:
- 38 are in the LOW Wastewater Category (Aquia-Stafford, VA; Bangor, ME; Clinton, IA; Contra Costa County, CA; Fairfield, CA; Garland, TX' Gilroy, CA; Hillsville, VA; Hollywood Road-Amarillo, TX; Indio, CA; Kaw Point-Kansas City, KS; Little Falls Run-Stafford, VA; Los Angeles County, CA; Los Banos, CA; Madera, CA; Marina,CA; Marshalltown, IA; Merced, CA; Mill Valley, CA; Modesto, CA; Napa,CA; Novato, CA; Oakland,CA; Ontario, CA; Ottumwa, IA; Paso Robles, CA; Redwood City, CA; Salina, KS; Seaford, DE; South Laredo, TX; Southside Dallas, TX; Sunnyvale,CA; Sunnyvale,TX; Turlock, CA; Vallejo,CA; White Rock Central Dallas, TX; Winters,CA; Zacate Creek-Laredo,TX)
- 55 are in the MEDIUM Wastewater Category (Altamonte Springs,FL; Belmar,NJ; Big Creek-Roswell,GA; Bloomington,IN; Bridgeton,NJ; Carmel,IN; Central Salt Lake Valley,UT; Chattanooga,TN; Coeur d'Alene,ID; College Park,GA; Dallas Central,TX; Davis,CA; Downtown Jeffersonville,IN; Essex Junction,VT; Fultondale, AL, Gainesville,TX; Glen Ellyn,IL; Harrisburg,PA; Ithaca, NY; Jenison, MI; Lancaster,CA; Lander Street-Boise,ID; Lawrence,KS; Los Angeles,CA; Memphis,TN; Montpelier,VT; Muscatine,IA; North Miami,FL; Oakhurst,NJ; P20-Kansas City,KS; Palo Alto,CA; Petaluma,CA; Red Wing,MN; Riverside,CA; Rochester,MN; Sacramento,CA; San Diego,CA; San Leandro,CA; San Mateo,CA; San Rafael,CA; Santa Cruz County,CA; Santa Cruz,CA; South Miami,FL; South Orange County, FL; Southeast San Francisco,CA; Utoy Creek-Atlanta,GA; Wausau, WI; West Railroad-San Rafael,CA; Wheaton,IL; Wichita Falls,TX; Windsor,CA; Woodland,CA)
- 85 are in the HIGH Wastewater Category
- 3 do not have enough data to calculate (Louisville KY, Lewiston ME, and Wilson NC)
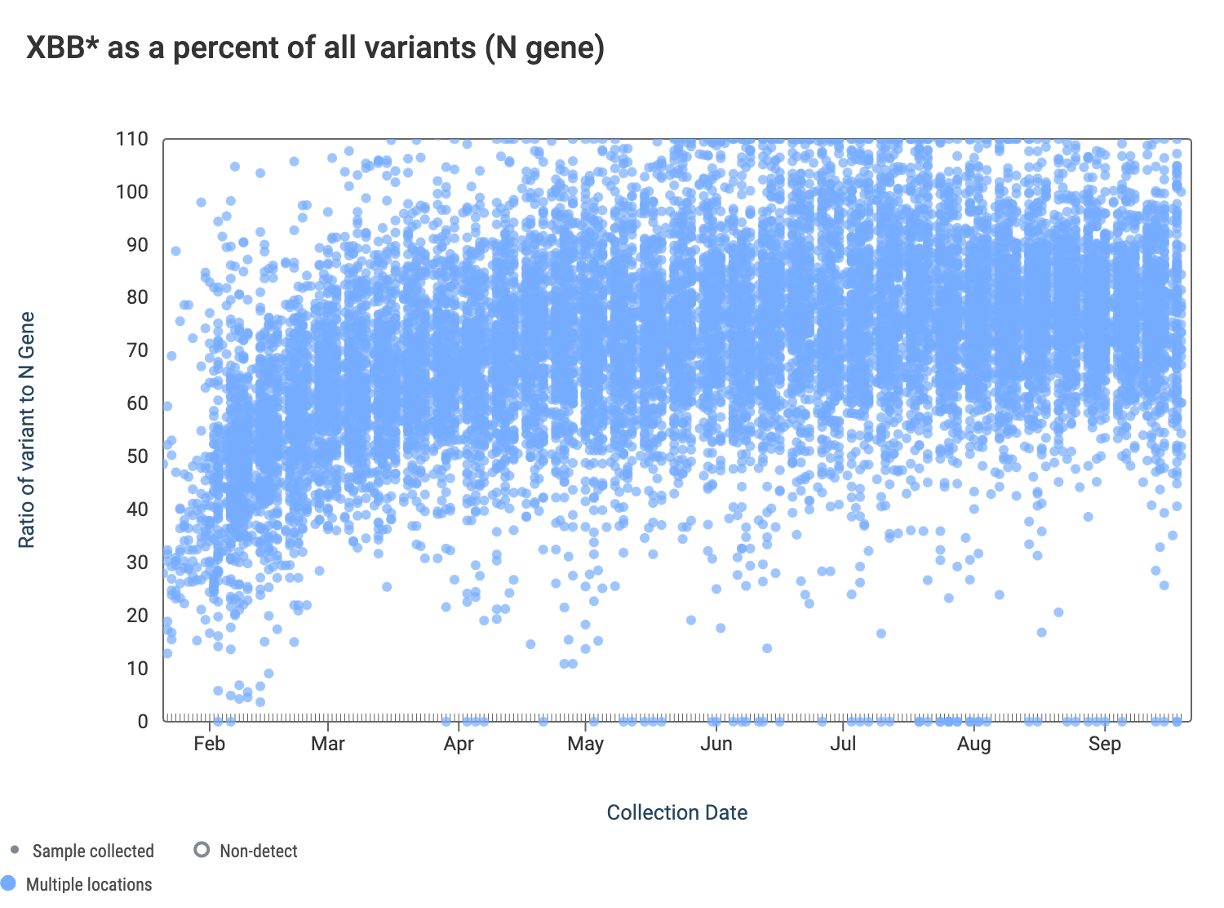
The ratio of the XBB* mutations/N across all WWSCAN plants is shown in the chart below. As the ratio reaches 100%, it suggests that all the SARS-CoV-2 genomes in wastewater have the XBB* mutations. These data indicate that the average ratio XBB* mutations/N is ~75% but some places show levels as high as 80-100%. This suggests the majority of infections across the communities are caused by XBB*. Note that our XBB* assay will also detect XBB.1.16, XBB.1.9, FD.2 (XBB.1.5.15.2*), and EG.5. However the XBB* targets are NOT present in BA.2.86.
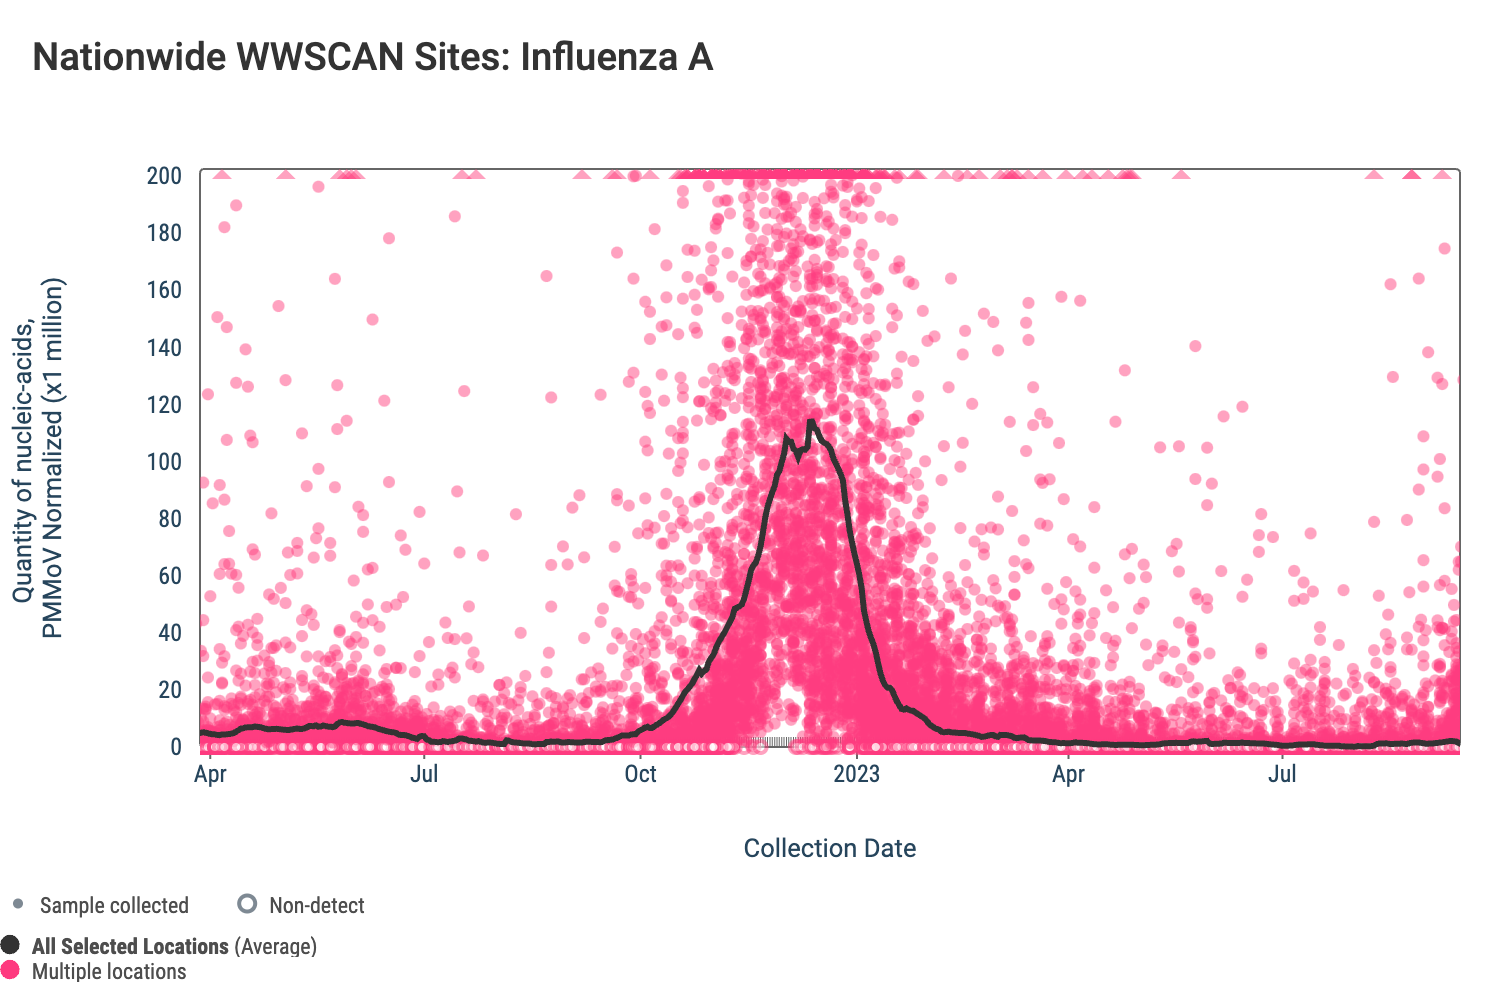
Influenza A (IAV). The median concentration of IAV RNA across all sites over the last 21 days is below the lower detection limit of the assay. There have been 276 positive samples out of 1,304 samples during the past 21 days (~21% detection rate). Below are the IAV RNA concentrations (normalized by PMMoV) from all participating WWSCAN sites across the country. The pink dots are the raw data and the black line is the population weighted average.
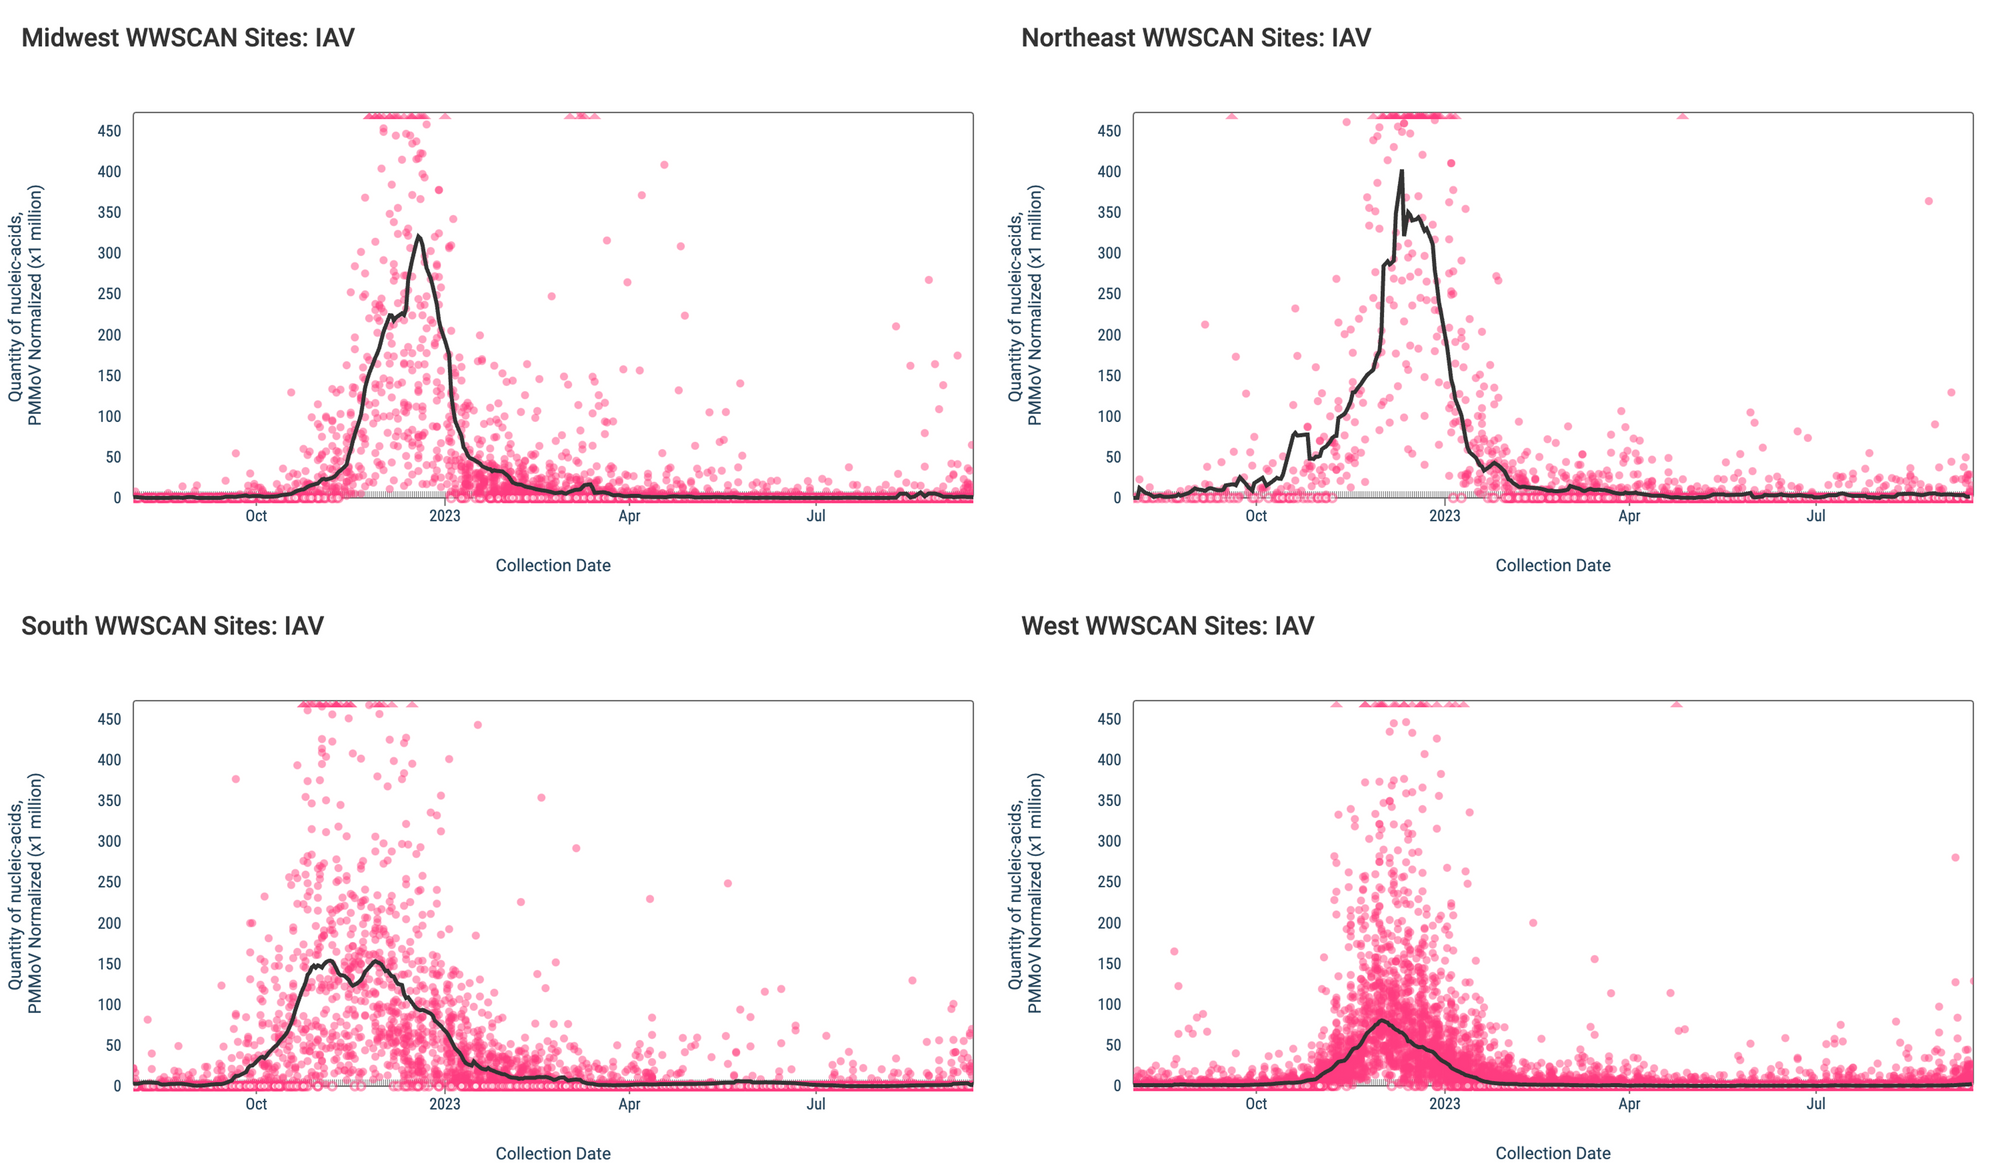
Below are the IAV RNA concentrations (normalized by PMMoV) from sites in the Midwest US (top left panel), Northeast US (top right panel), Southern US (bottom right panel) and Western US (bottom left panel). The population weighted average across regional WWSCAN plants is shown in black, raw data are shown in pink.
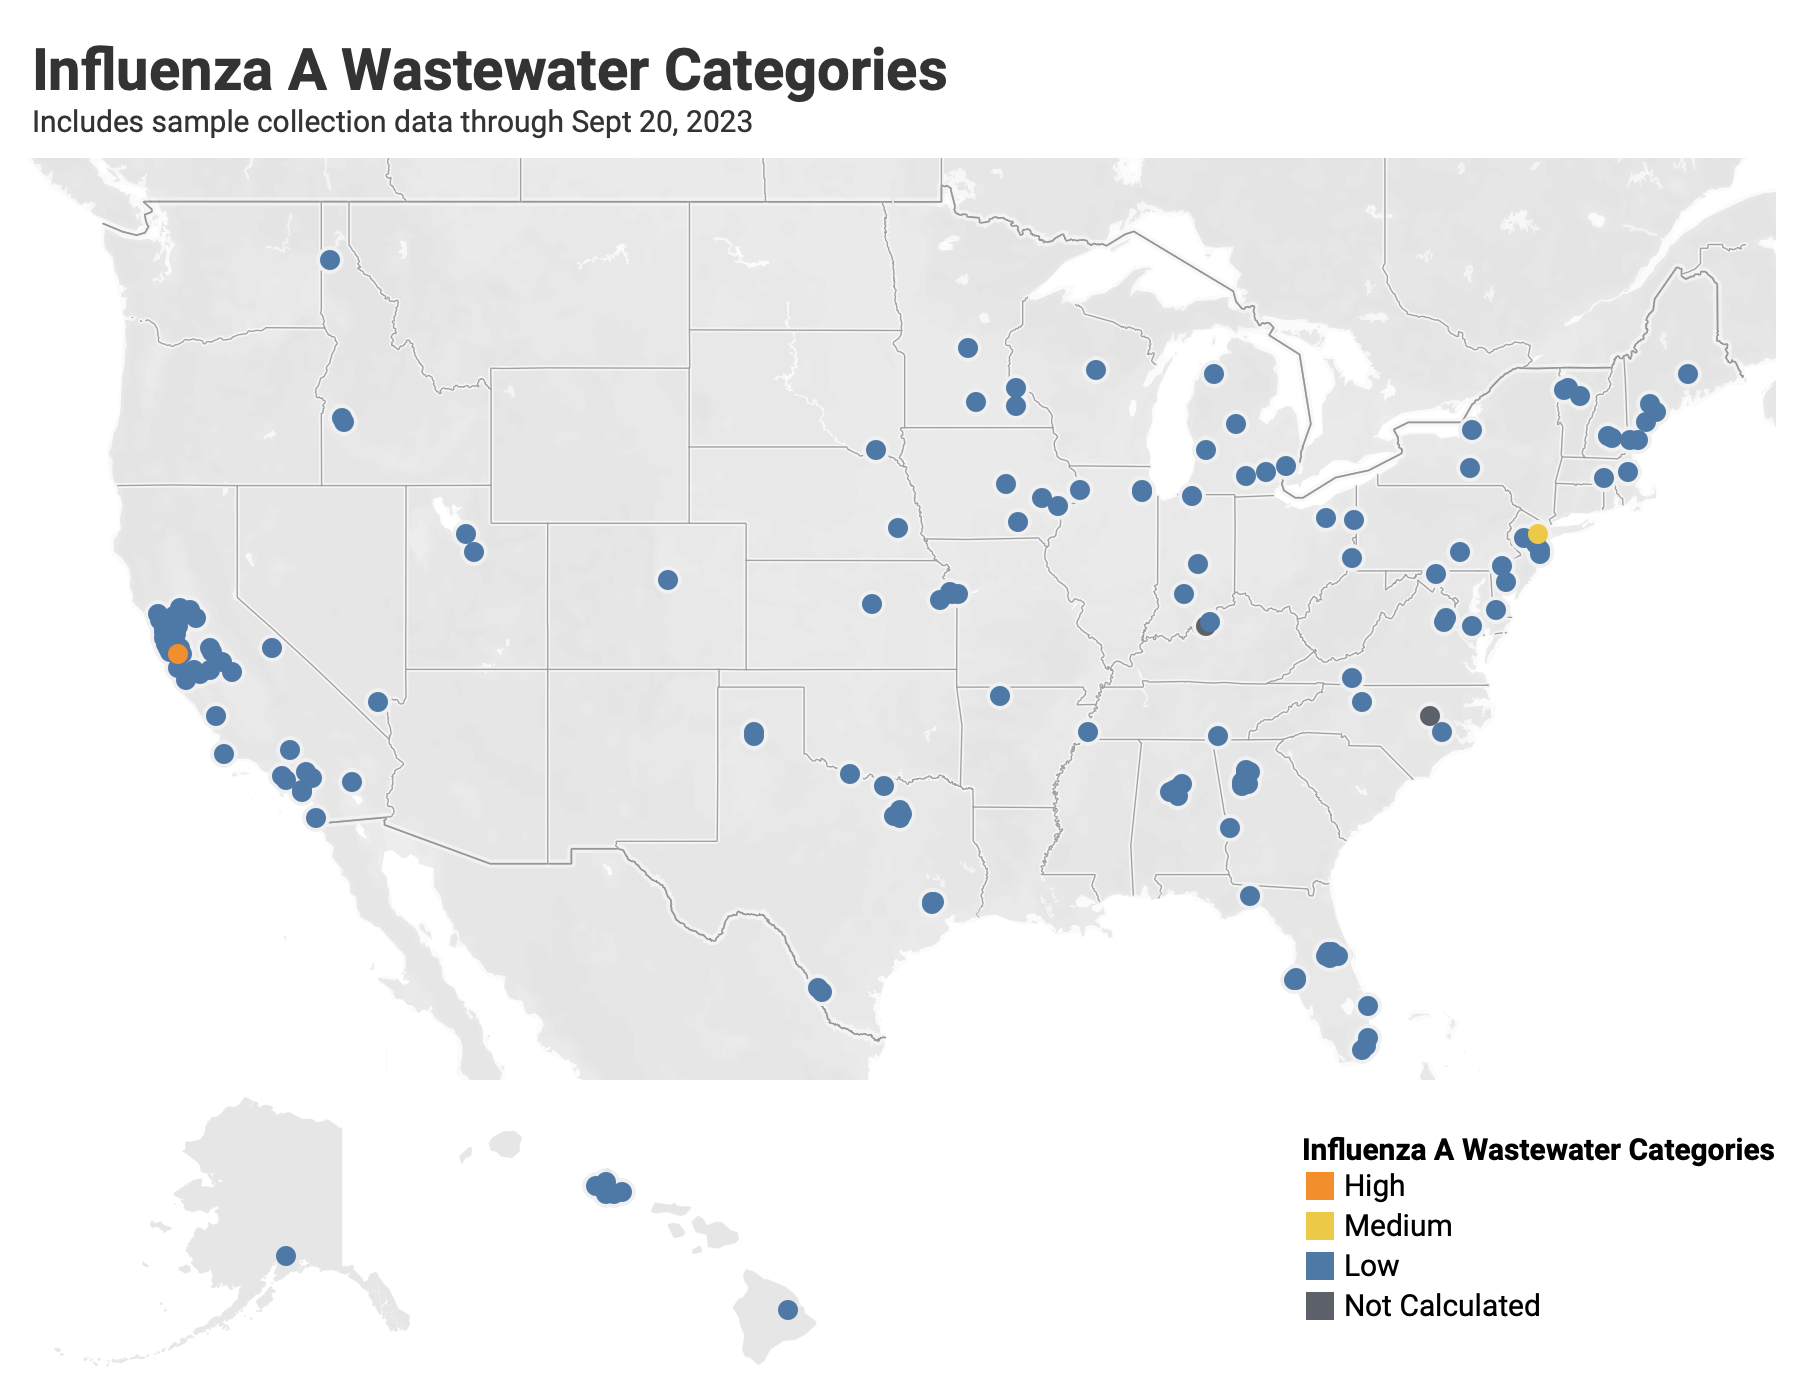
Below are the current Influenza A wastewater categories for all WWSCAN sites. Only 2 locations are in onset mode for Influenza A - Palo Alto, CA and Newark, NJ.
- 176 are in the LOW Wastewater Category
- 1 are in the MEDIUM Wastewater Category (Newark, NJ)
- 1 are in the HIGH Wastewater Category (Palo Alto, CA)
- 3 do not have enough data to calculate (Louisville KY, Lewiston ME, and Wilson NC)
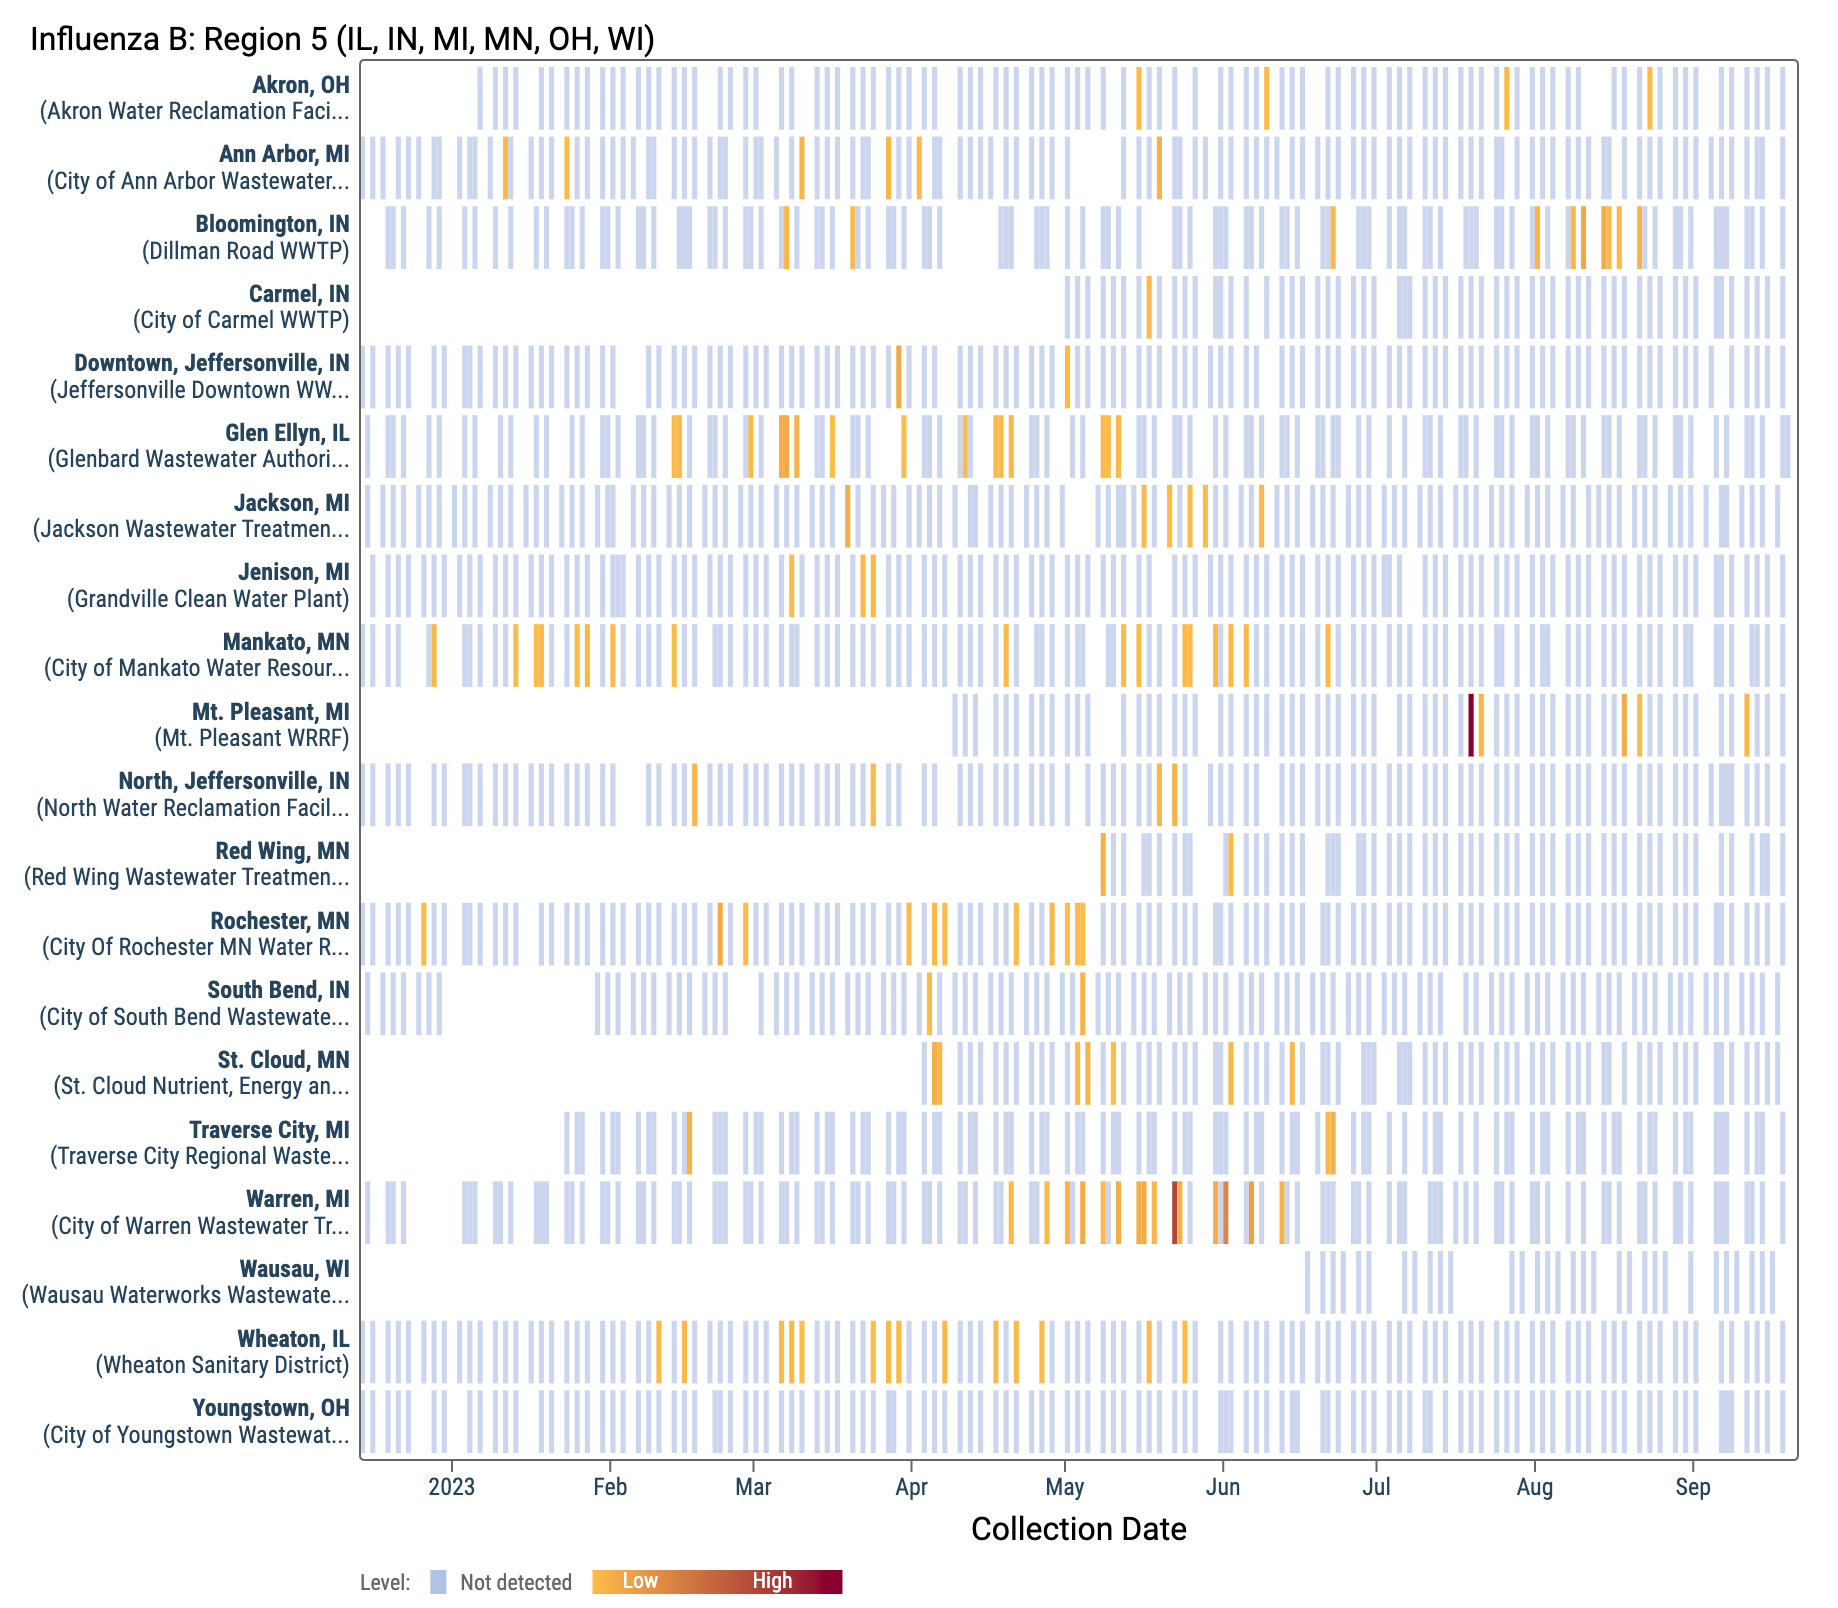
Influenza B (IBV) RNA concentrations are mostly non-detect at WWSCAN sites. There have been 173 positive samples out of 1,304 samples during the past 21 days (~13% detection rate), all at low concentrations. Below is a heat map showing IBV detections at all the plants in WWSCAN in HHS Region 5. Each location is a row, and the date is a column. White indicates no sample, blue indicates non-detect, and the orange to red show variable concentrations if IBV.
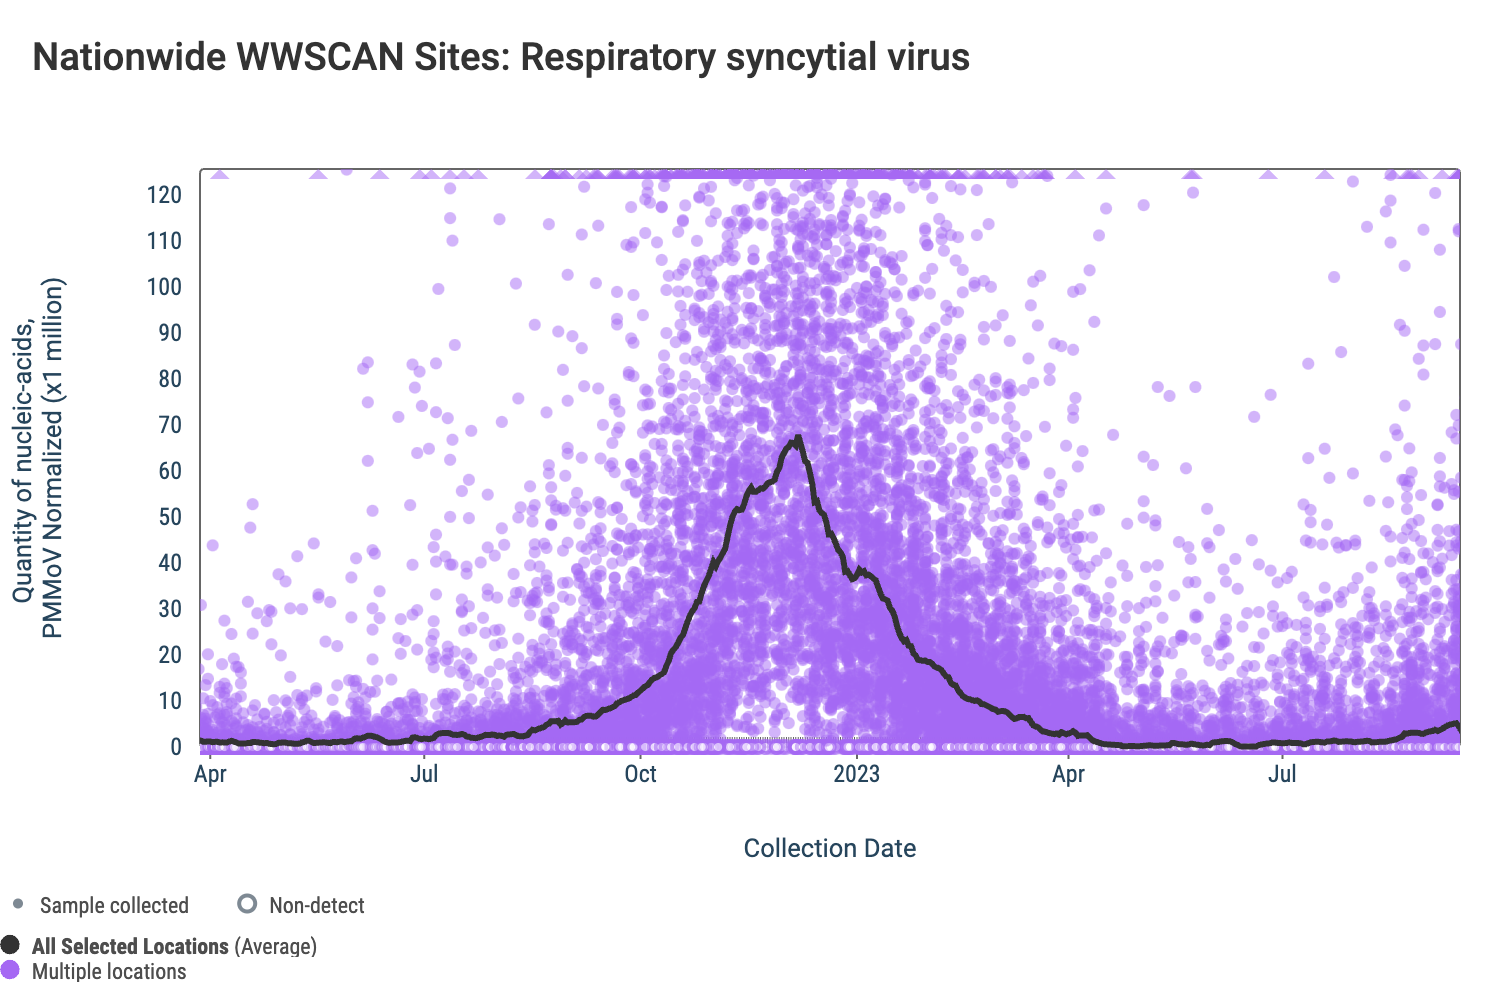
Respiratory syncytial virus (RSV) RSV RNA concentrations are generally low across the sites. The median concentration across all sites over the last 21 days is below the lower detection limit of the assay. There have been 381 positive samples out of 1,304 samples during the past 21 days (~29% detection rate). Below are the RSV RNA concentrations (normalized by PMMoV) from all participating WWSCAN sites across the country. Raw data are shown as purple dots, and the black line is the population weighted average.
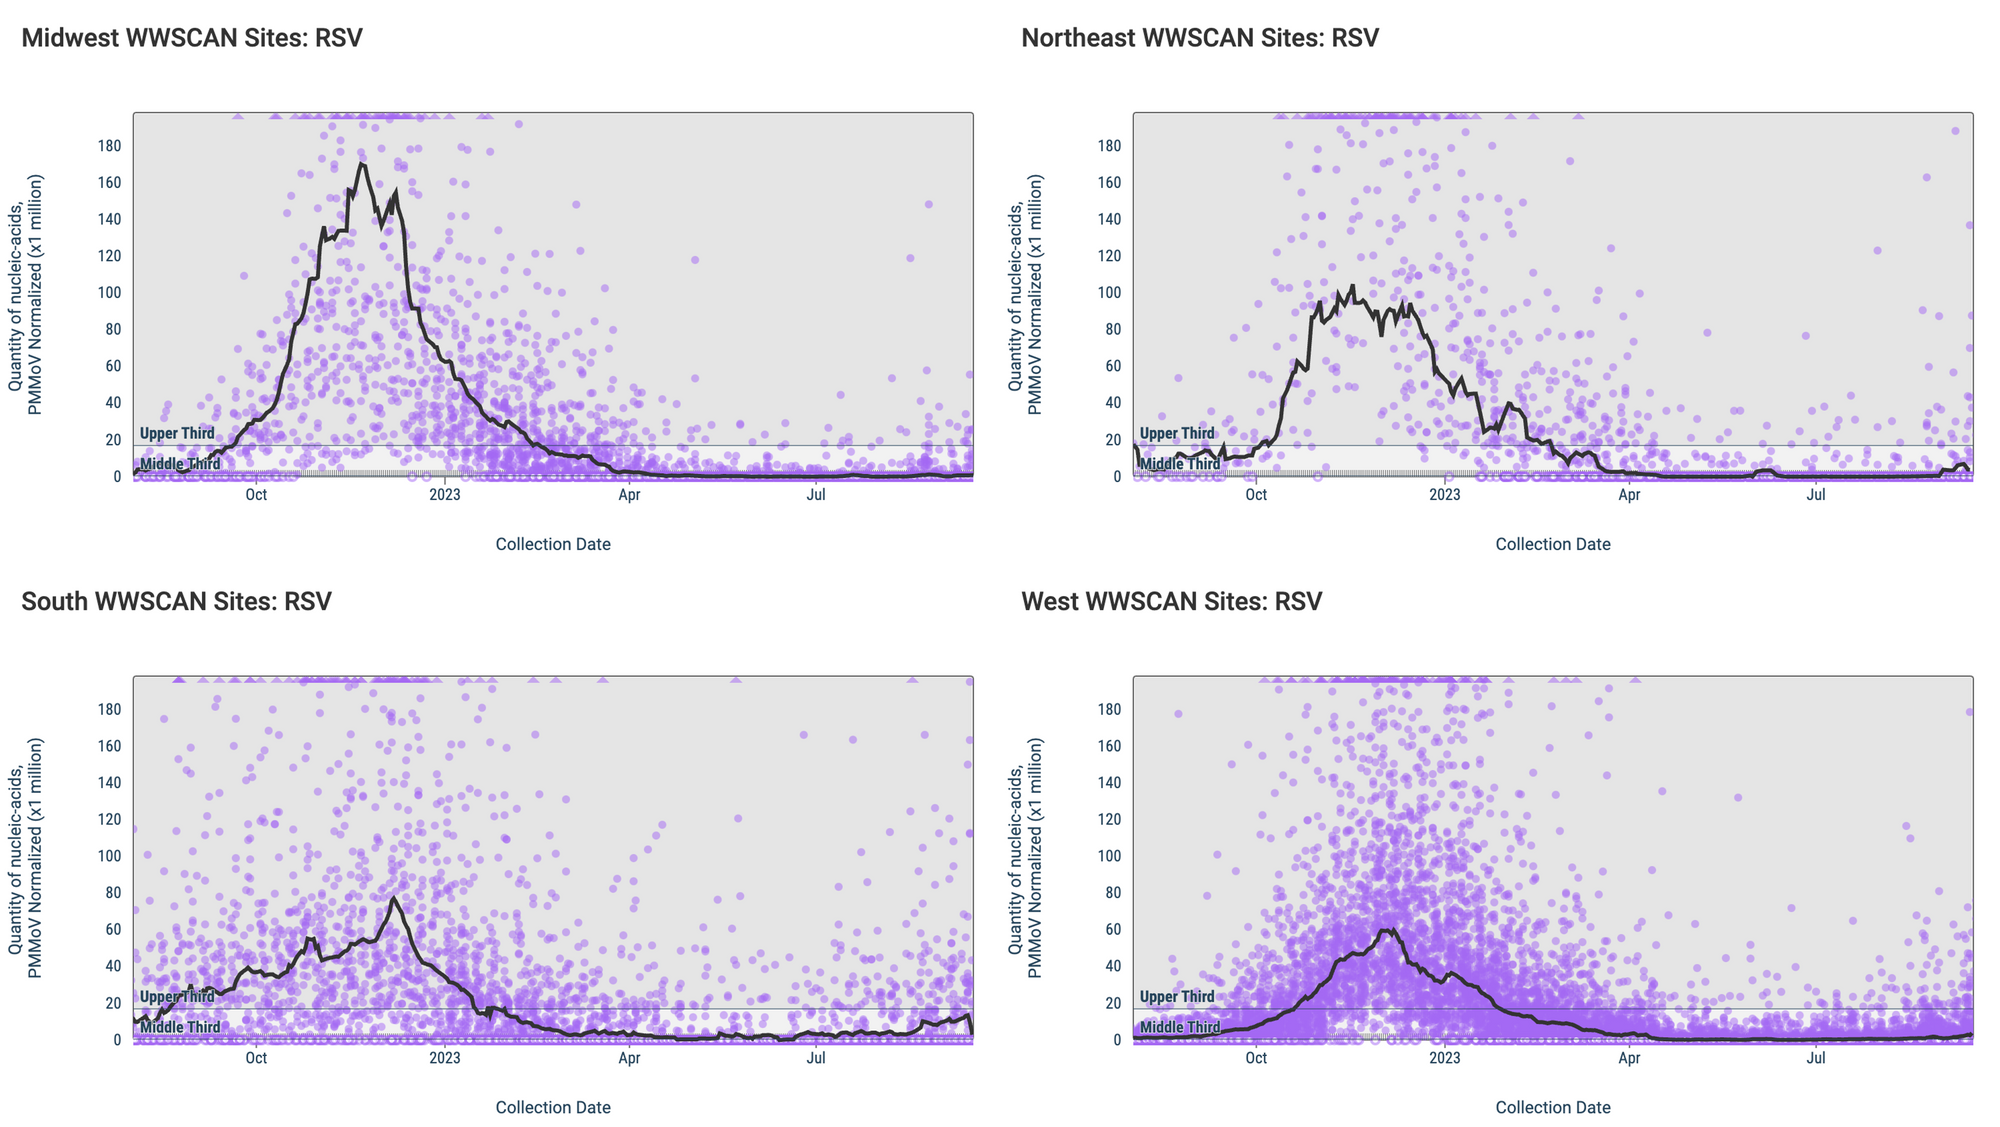
Below are the RSV RNA concentrations (normalized by PMMoV) from sites in the Midwest US (top left panel), Northeast US (top right panel), Southern US (bottom right panel) and Western US (bottom left panel). The population weighted average across regional WWSCAN plants is shown in black and raw data are shown as purple dots.
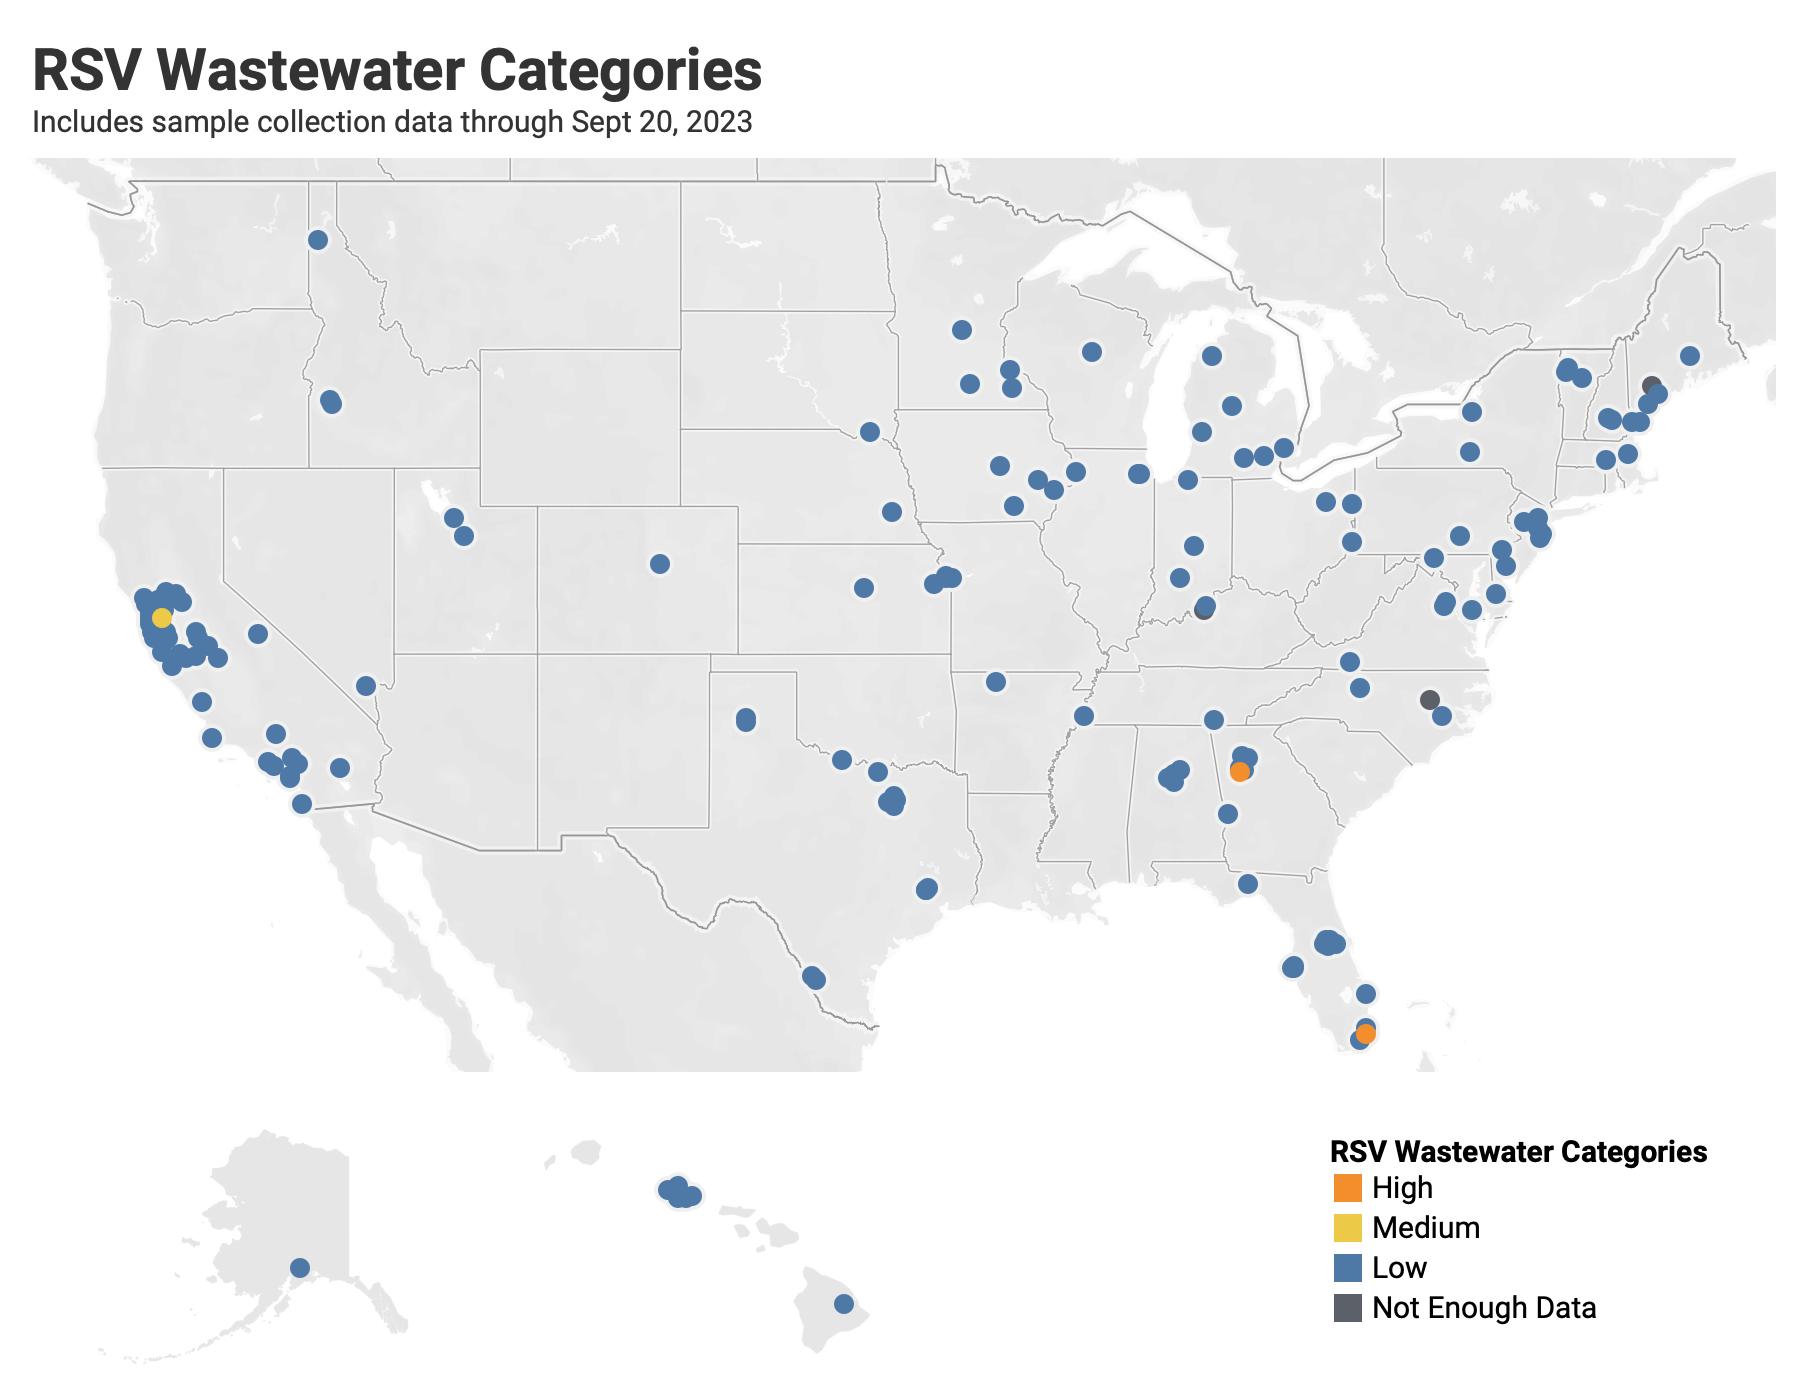
Below are the current RSV wastewater categories for all WWSCAN sites. Only 3 locations are in onset mode for RSV - College Park GA, Key Biscayne FL, and Contra Costa County CA.
- 175 are in the LOW Wastewater Category
- 1 are in the MEDIUM Wastewater Category (Contra Costa County CA)
- 2 are in the HIGH Wastewater Category (College Park GA, and Key Biscayne FL)
- 3 do not have enough data to calculate (Louisville KY, Lewiston ME, and Wilson NC)
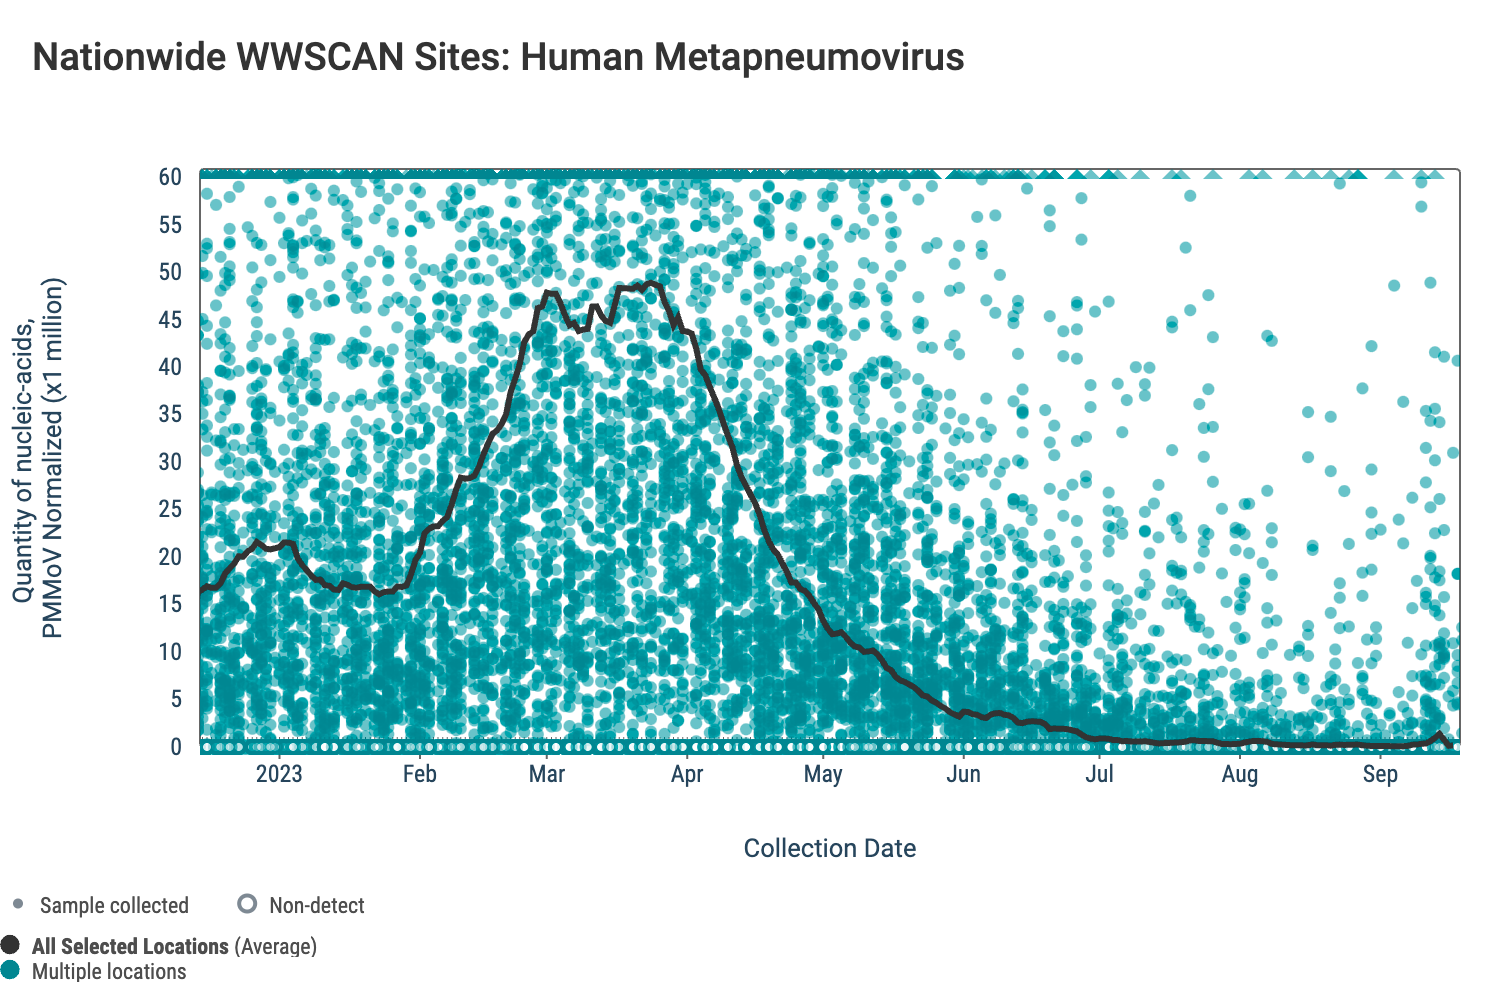
HMPV (human metapneumovirus) RNA concentrations are low. The median concentration across all sites over the last 21 days is below the lower detection limit of the assay. There have been 133 positive samples out of 1,304 samples during the past 21 days (~10% detection rate). Below are the HMPV RNA concentrations (normalized by PMMoV) from all participating WWSCAN sites across the country. The turquoise dots are the raw data and the black line is the population weighted average.
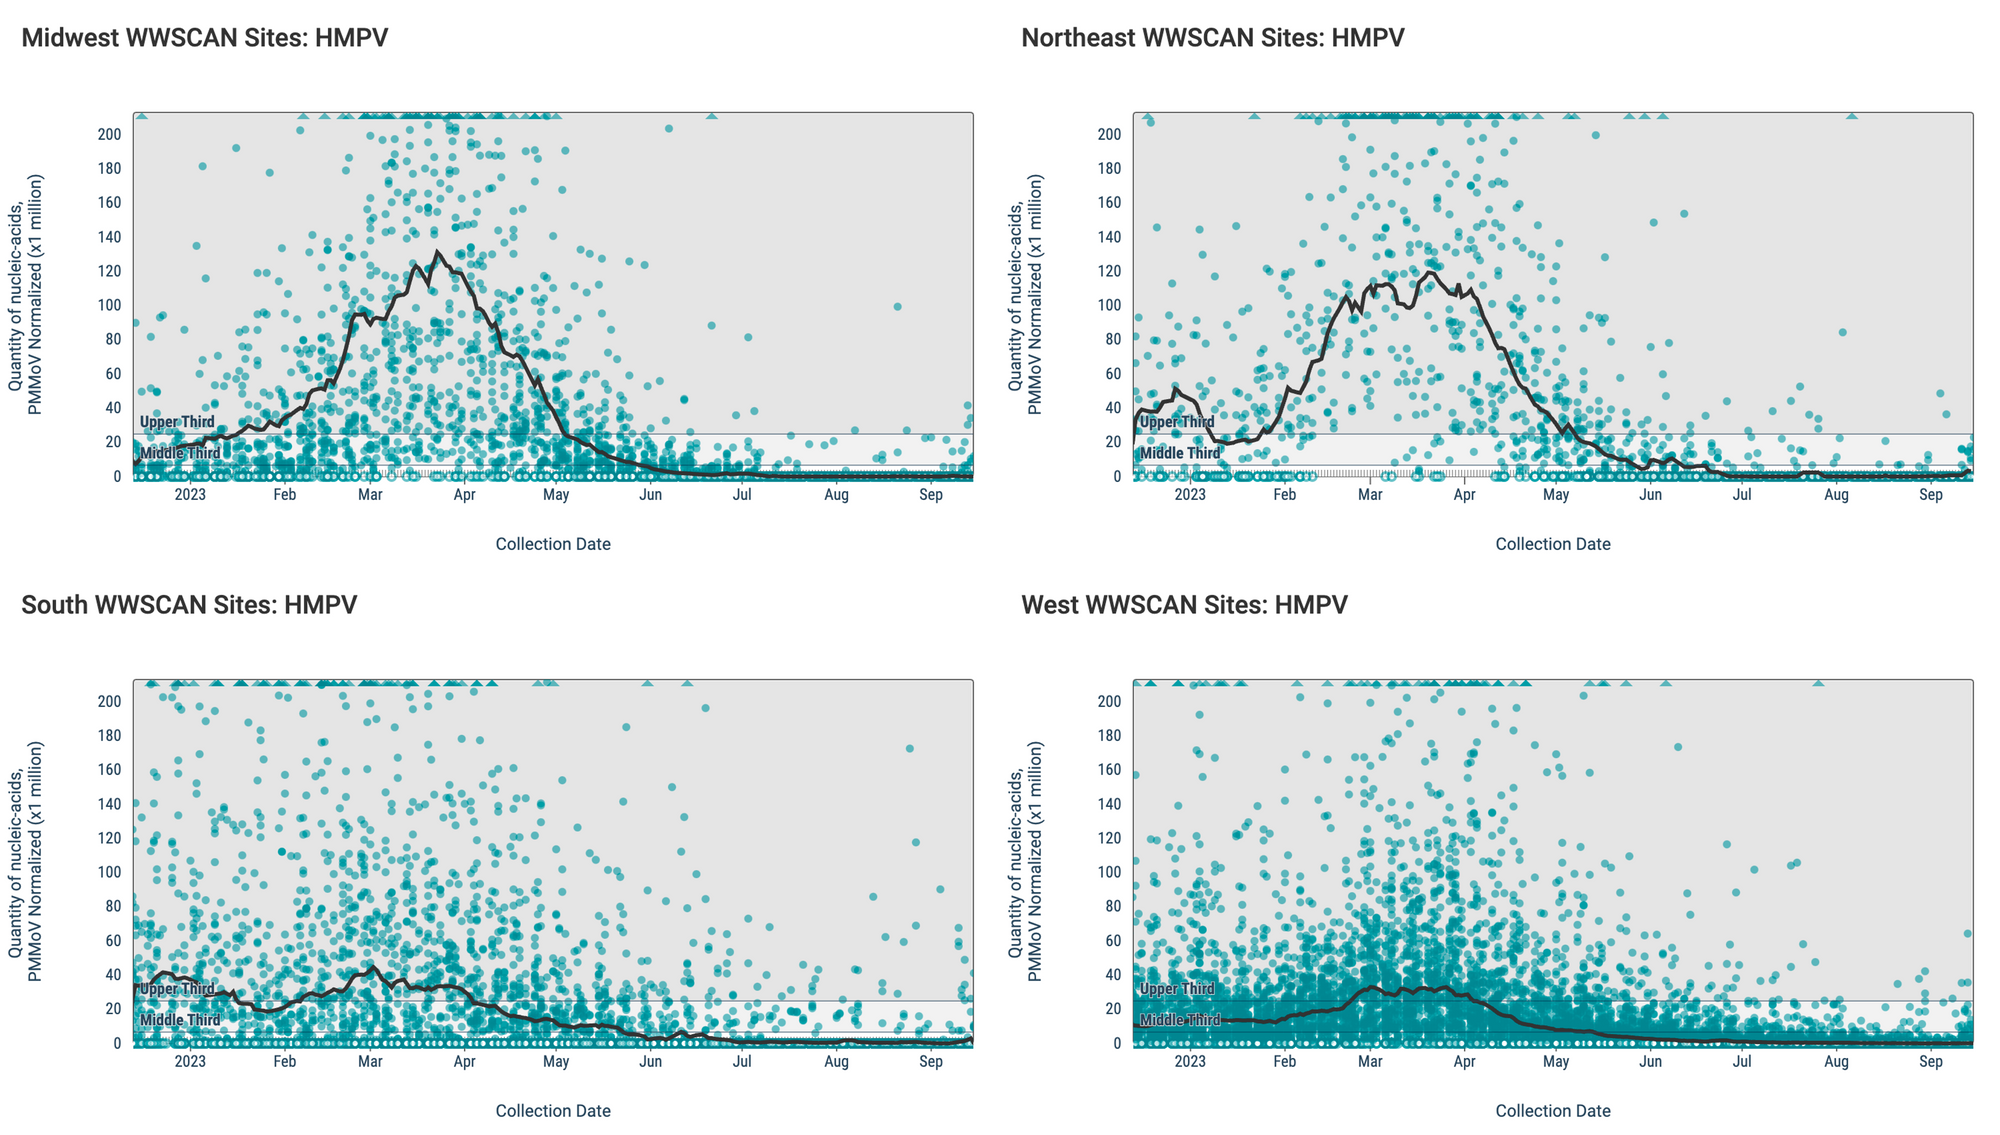
Below are the HMPV RNA concentrations (normalized by PMMoV) from sites in the Midwest US (top left panel), Northeast US (top right panel), Southern US (bottom right panel) and Western US (bottom left panel). The population weighted average across regional WWSCAN plants is shown in black, and the raw data are shown as turquoise.
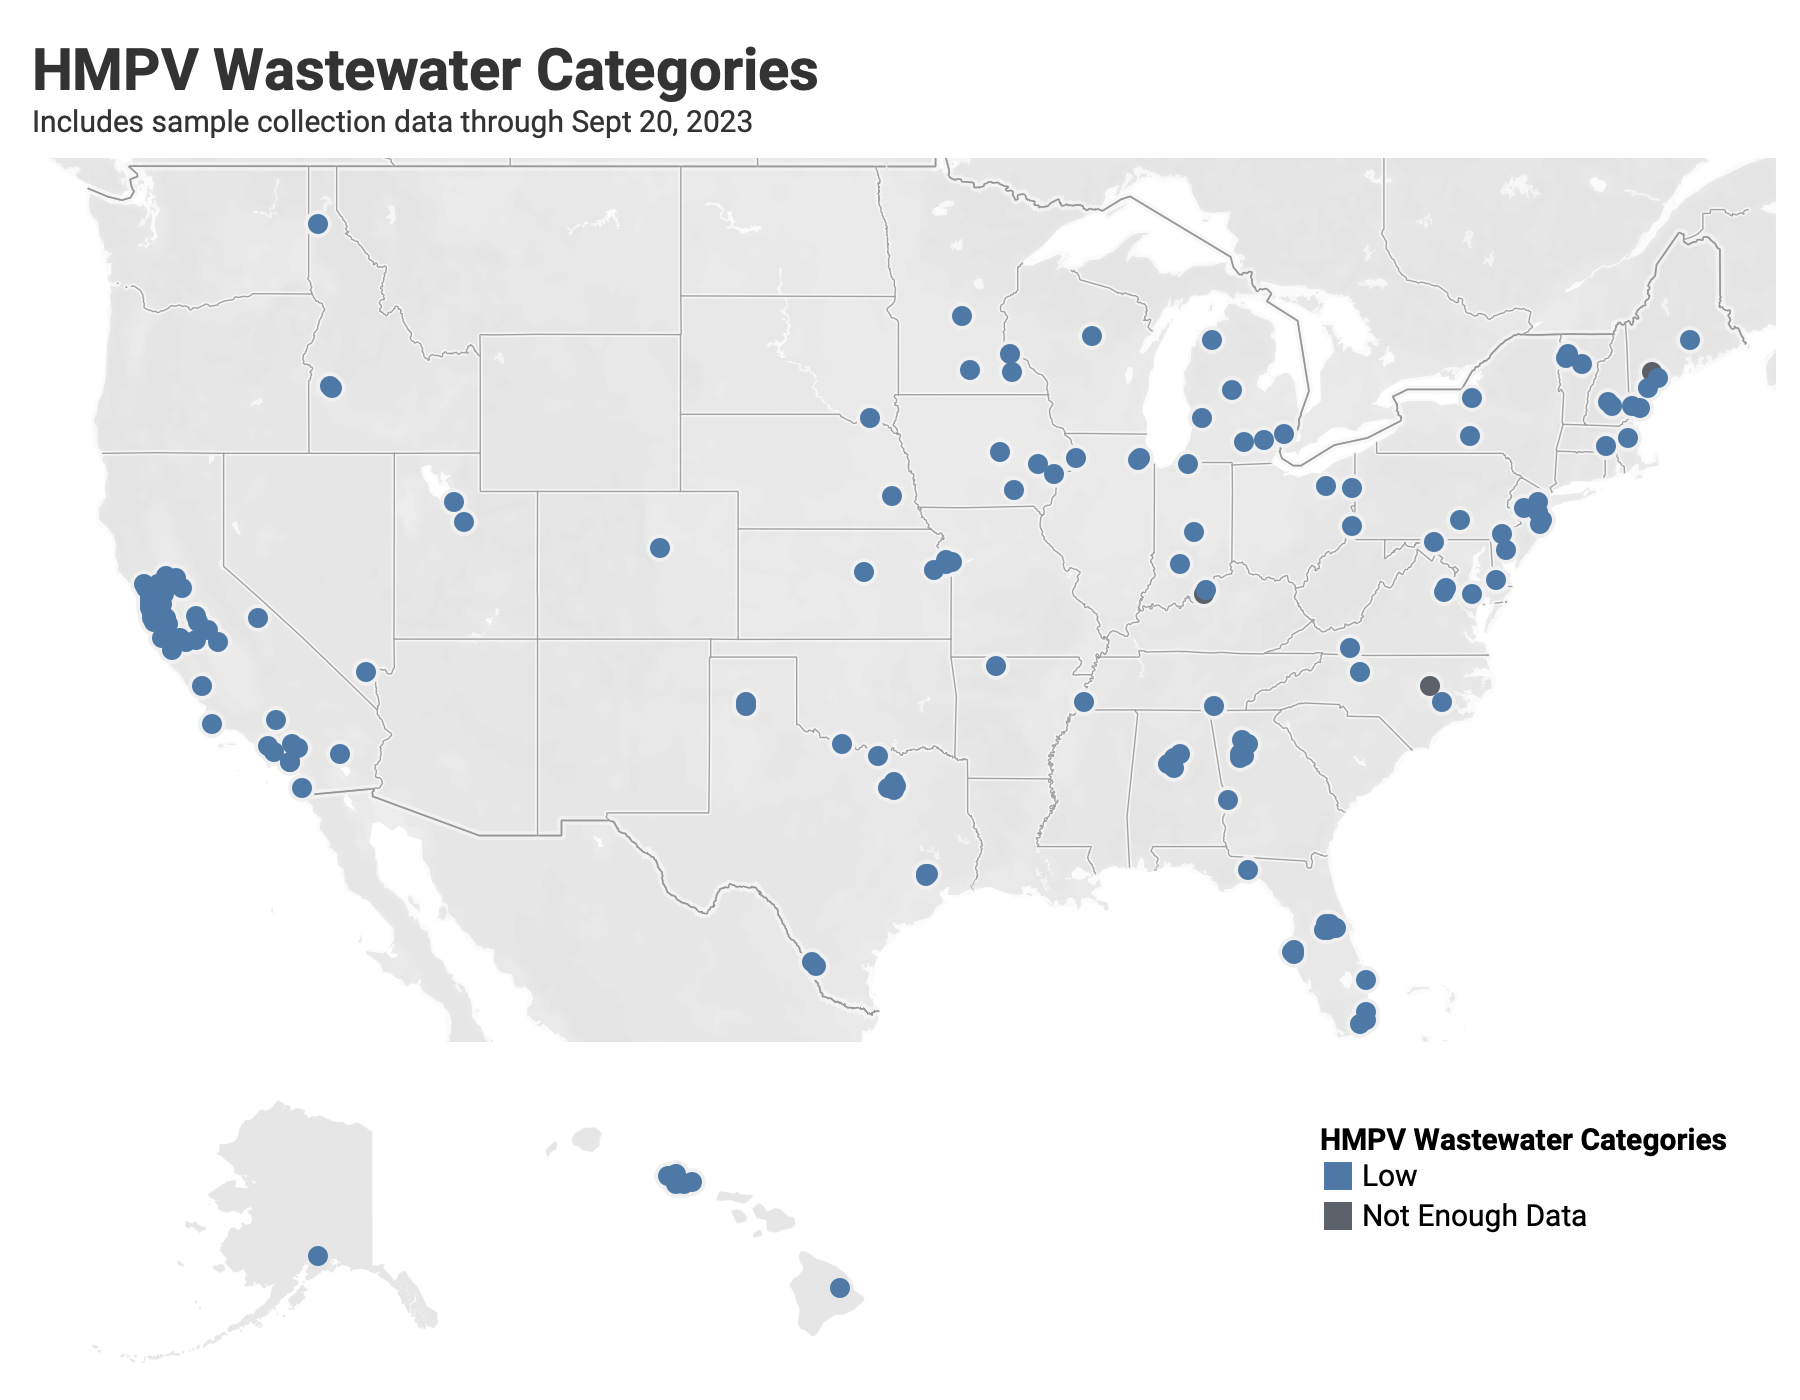
Below are the current HMPV wastewater categories for all WWSCAN sites. Since we have not hit seasonal onset for HMPV all sites (minus those that do not have enough data are in the LOW category):
- 178 are in the LOW Wastewater Category
- 0 are in the MEDIUM Wastewater Category
- 0 are in the HIGH Wastewater Category
- 3 do not have enough data to calculate (Louisville KY, Lewiston ME, and Wilson NC)
Gastrointestinal Pathogens
Gastrointestinal pathogens cause diseases with symptoms including but not limited to vomiting and diarrhea
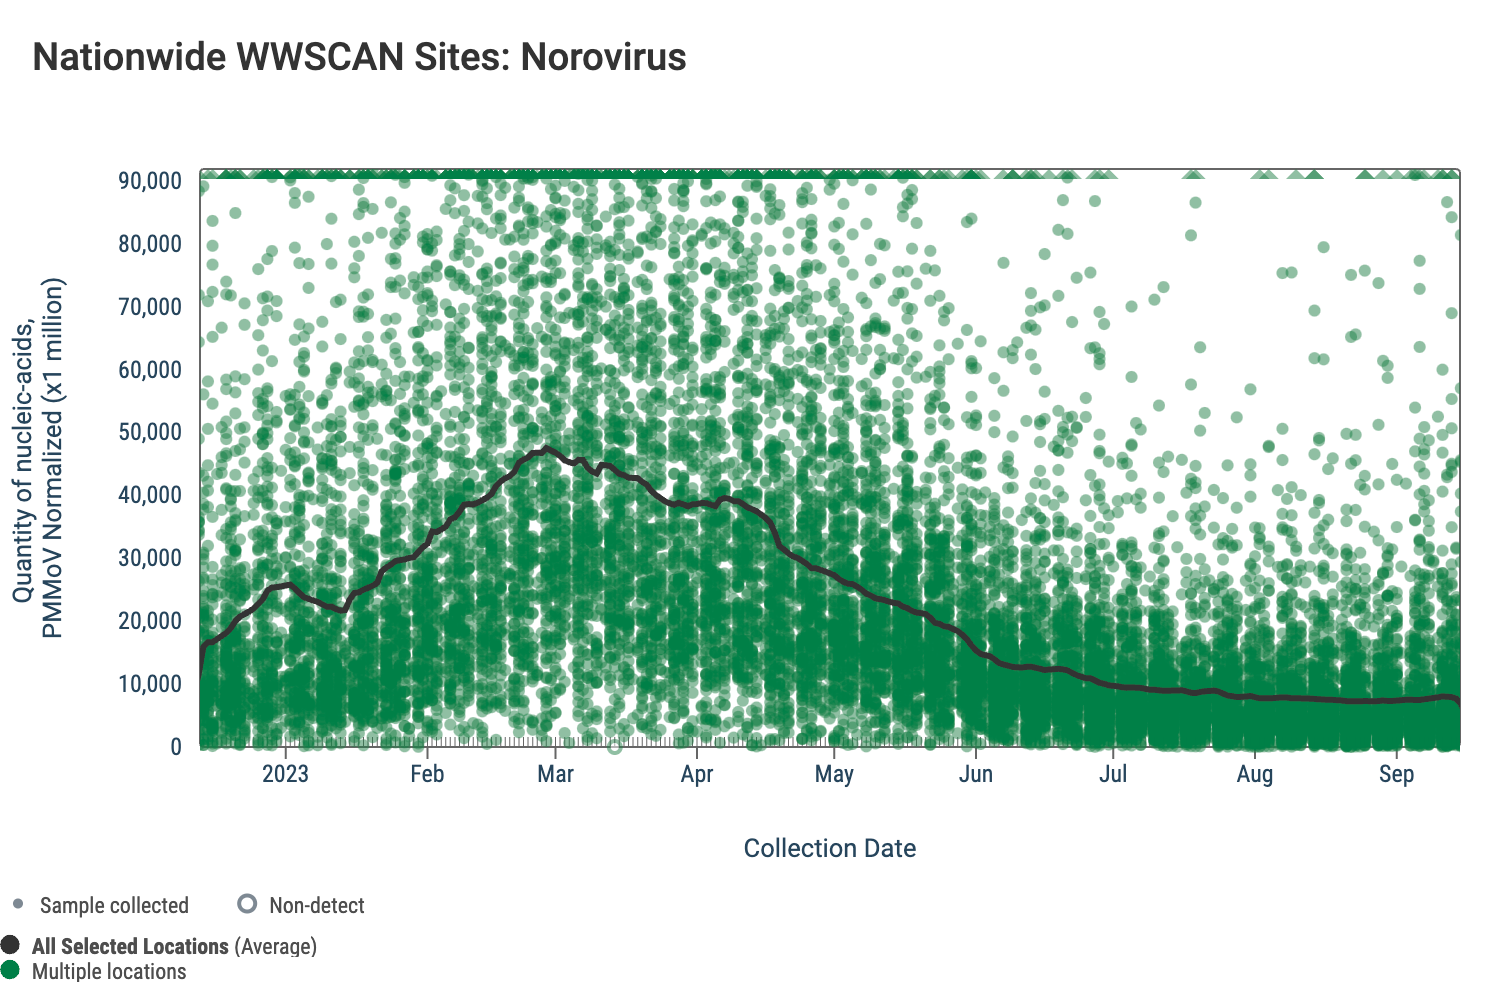
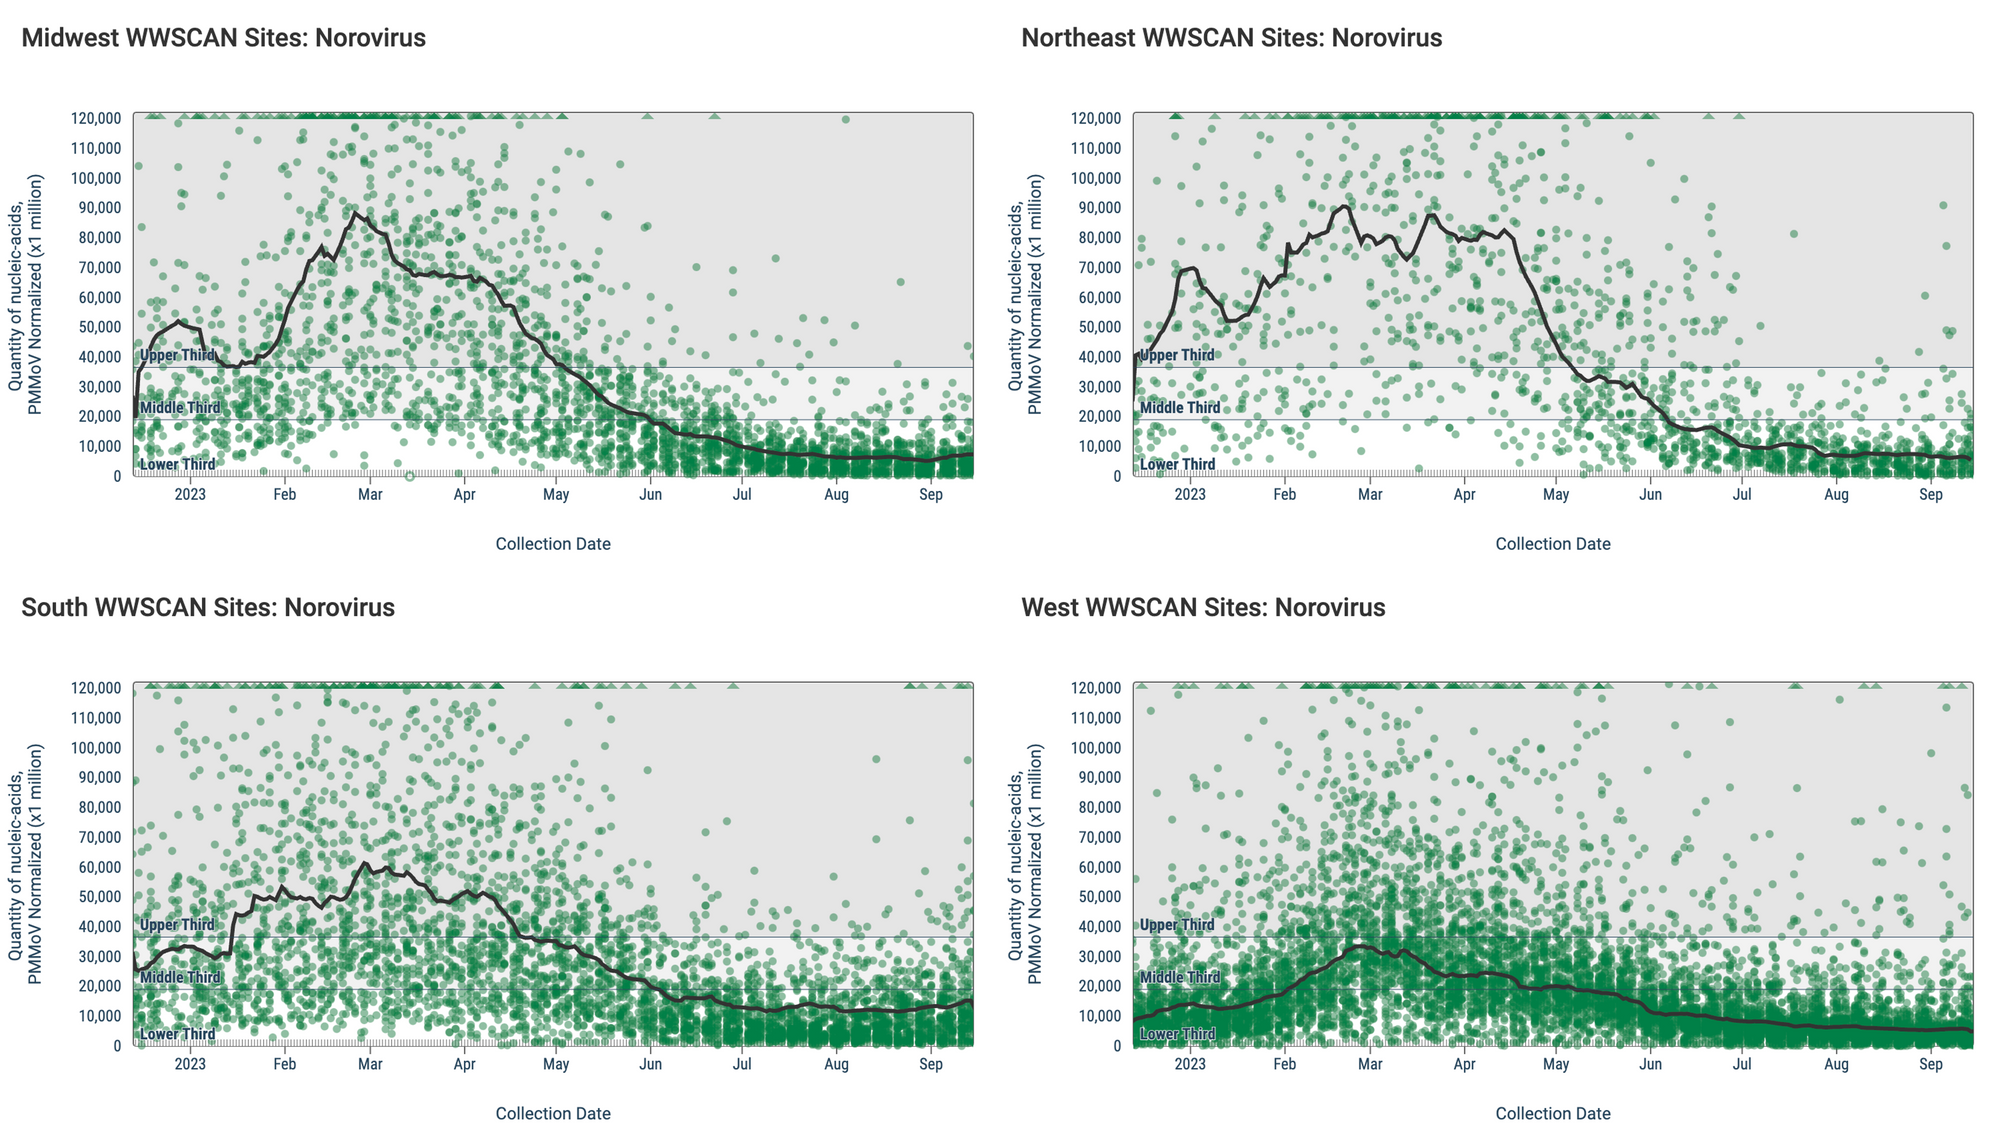
Norovirus GII (HuNoV GII) RNA has been consistently detected at the sites. The median concentration across all sites over the last 21 days is 2,180,793 copies/gram. Below are the HuNoV GII RNA concentrations (normalized by PMMoV) from all participating WWSCAN sites across the country. The raw data are shown as green dots, and the population weighted average is shown as a black line.
Below are the HuNoV GII RNA concentrations (normalized by PMMoV) from sites in the Midwest US (top left panel), Northeast US (top right panel), Southern US (bottom right panel) and Western US (bottom left panel). The population weighted average across regional WWSCAN plants is shown in black, and raw data are green. Evident in the data is relatively high concentrations across all US regions around the start of the year with low levels presently observed.
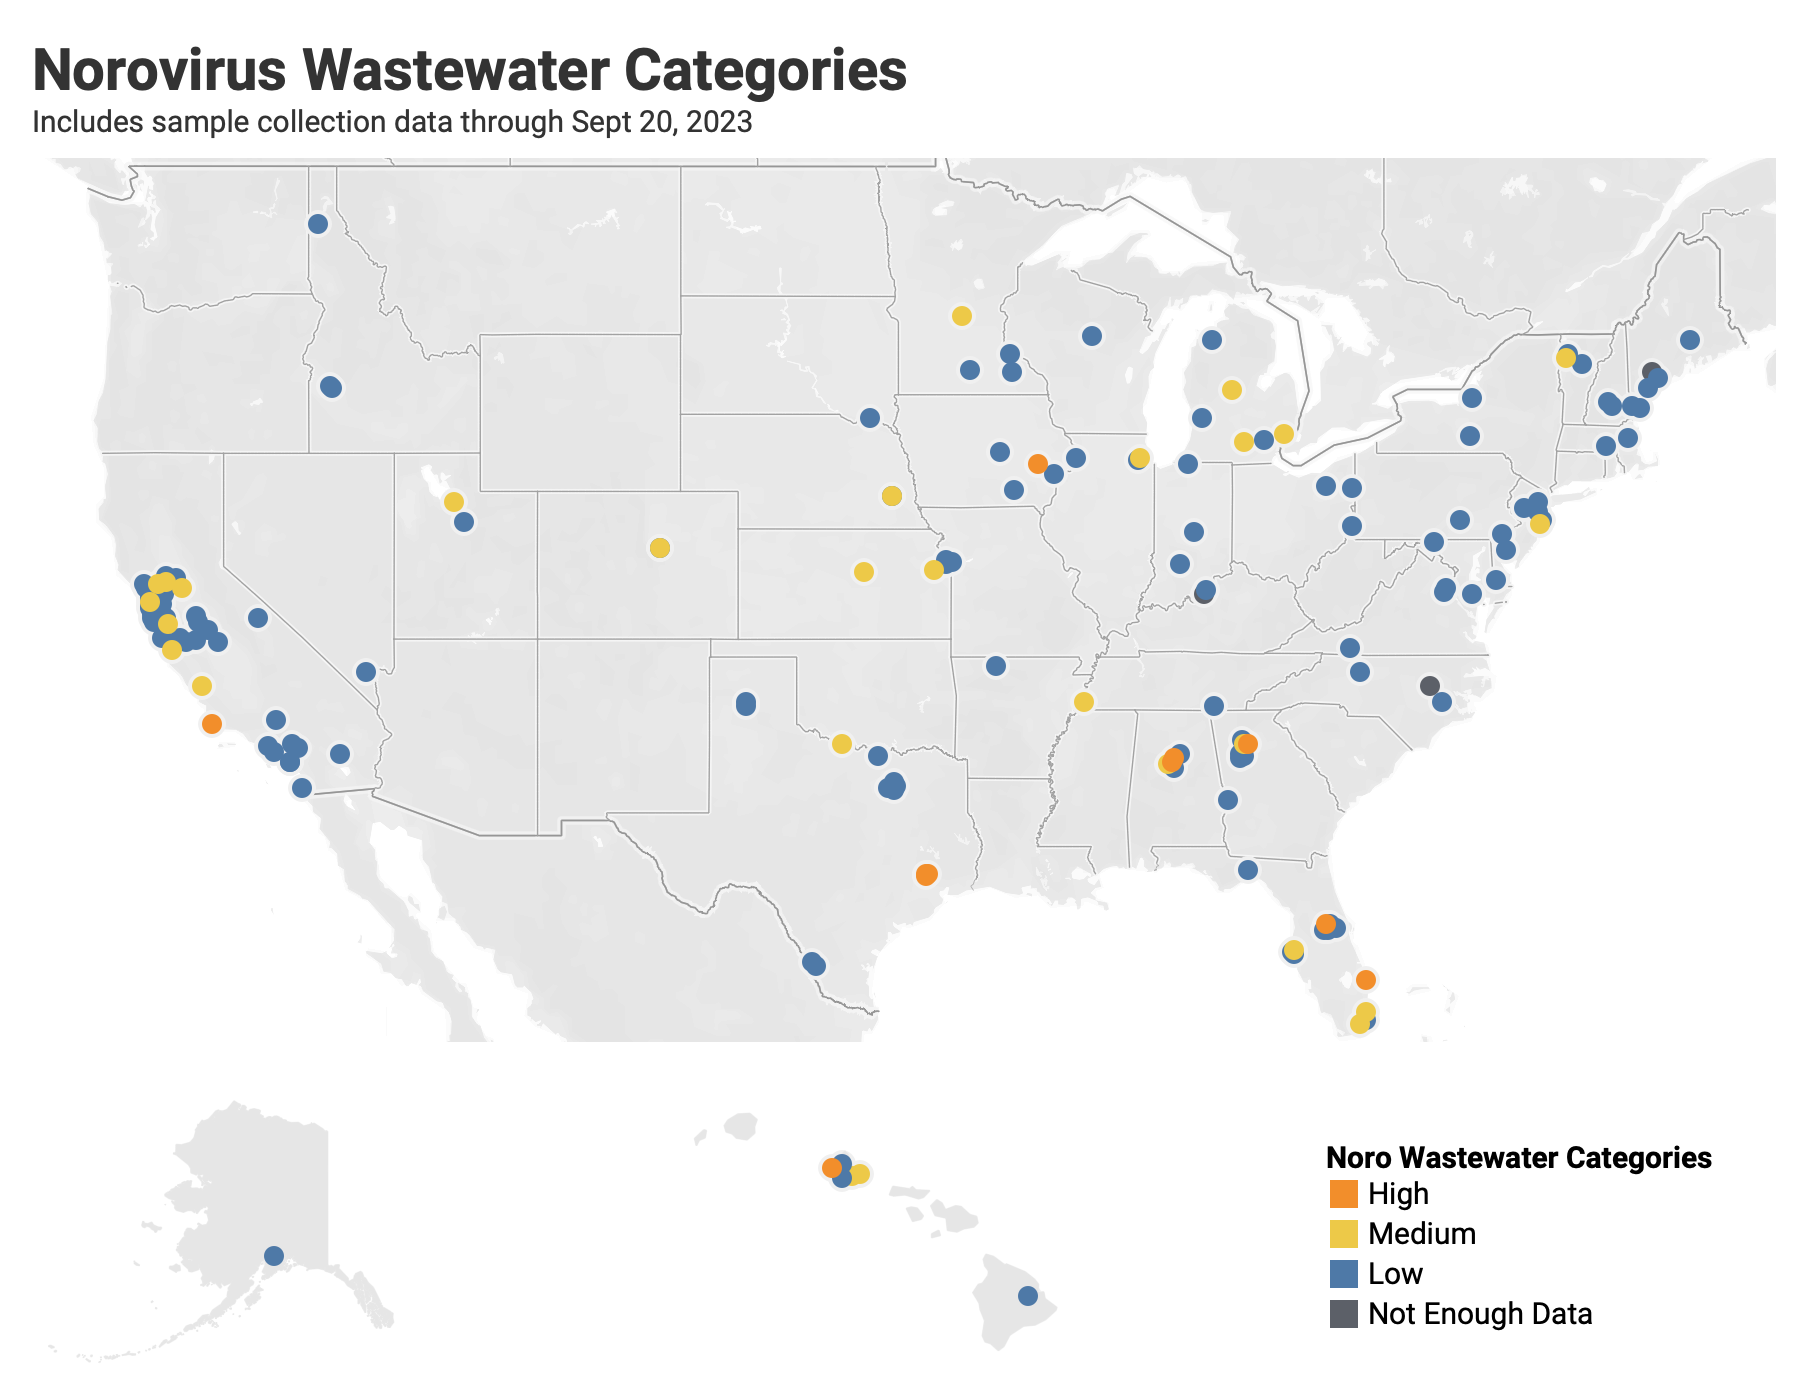
Below are the current Norovirus wastewater categories for all WWSCAN sites:
- 139 are in the LOW Wastewater Category
- 28 are in the MEDIUM Wastewater Category (Belmar,NJ; Bessemer,AL; Big Creek-Roswell,GA; Central Salt Lake Valley,UT; Glen Ellyn, IL; Jackson,MI; Kailua,HI, Las Gallinas-San Rafael,CA; Lawrence,KS; Marina,CA; Memphis,TN; Mt. Pleasant,MI; Napa,CA; North Miami,FL; Northeast Lincoln,NE; Northeast Saint Petersburg,FL; Paso Robles, CA; Sacramento,CA; Salina,KS; San Jose, CA; Sand Island, HI; South Burlington,VT; South Miami,FL; South Parker,CO; St. Cloud, MN; Warren,MI, Wichita Falls,TX; Winters,CA)
- 11 are in the HIGH Wastewater Category (Coralville, IA; Fultondale, AL; Johns Creek-Roswell, GA; Jupiter,FL; Lompoc,CA; Northwest Orange County, FL; Village Creek-Birmingham,AL; Waianae, HI; Woodlands SJRA WWTF No. 1-3, TX)
- 3 do not have enough data to calculate (Louisville KY, Lewiston ME, and Wilson NC)
Other Pathogens of Concern
Detection of Mpox DNA in wastewater solids over past 21-days is rare
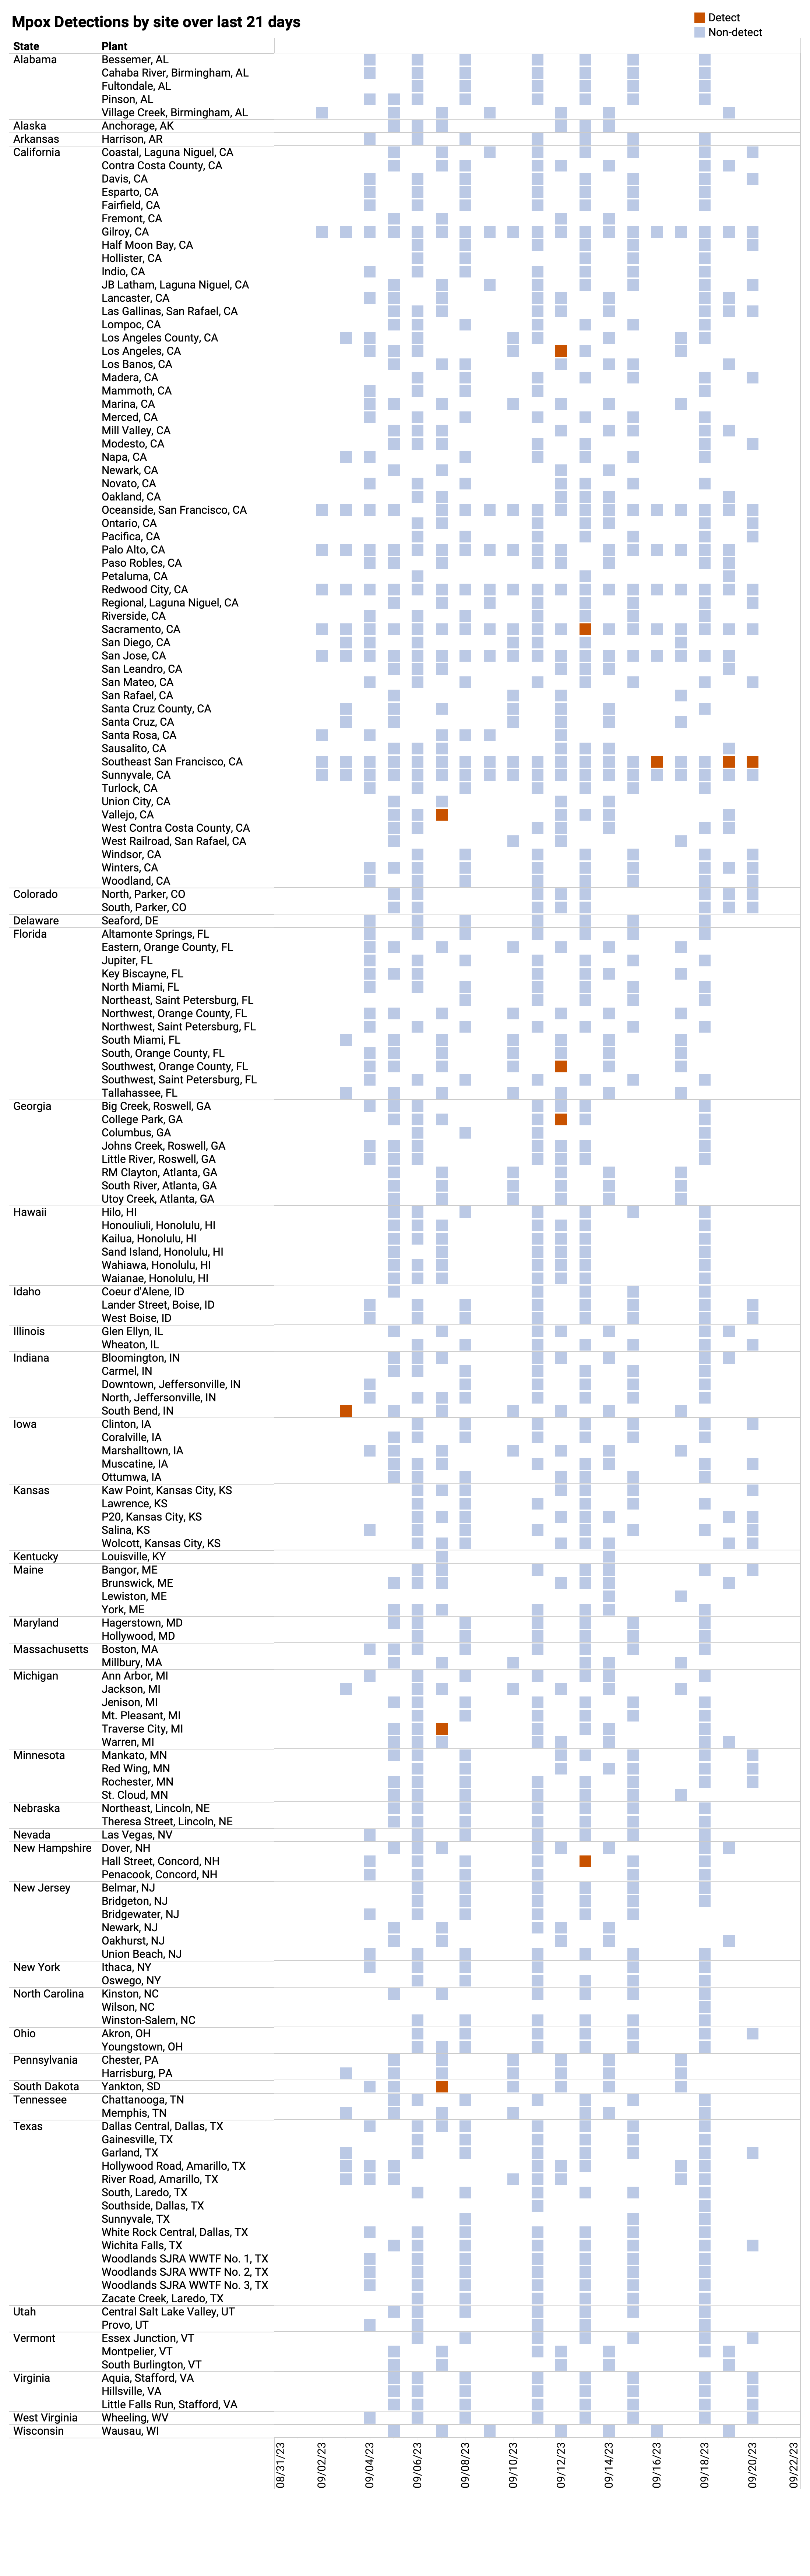
Mpox DNA We have detected Mpox DNA in 12 samples from any site over the past three-weeks. The chart below shows every plant in WWSCAN (181) as rows, and the last 21 days as columns (labeled at the bottom axis). White indicates no samples, blue is non-detect for mpox DNA and red is detect for mpox DNA. As a reminder, you can access our paper in New England Journal of Medicine about how mpox wastewater monitoring compares to clinical reports of infectious here. The wastewater categorization for all sites is LOW.
Recent WWSCAN Scientific Publications
Open source journal links are provided below
There are three recent papers related to this work that you might be interested in:
L. Roldan-Hernandez and A. B. Boehm. 2023. Adsorption of Respiratory Syncytial Virus, Rhinovirus, SARS-CoV-2, and F+ Bacteriophage MS2 RNA onto Wastewater Solids from Raw Wastewater. Environmental Science & Technology. Link.
A. B. Boehm, M. K. Wolfe, B. J. White, B. Hughes, D. Duong, A. Bidwell. 2023. More than a Tripledemic: Influenza A Virus, Respiratory Syncytial Virus, SARS-CoV-2, and Human Metapneumovirus in Wastewater during Winter 2022 - 2023. Environmental Science & Technology Letters, 10, 8, 622-627. Link.
A. B. Boehm, M. K. Wolfe, B. J. White, B. Hughes, D. Duong, N. Banaei, A. Bidwell. Human norovirus (HuNoV) GII RNA in wastewater solids at 145 United States wastewater treatment plants: Comparison to positivity rates of clinical specimens and modeled estimates of HuNoV GII shedders. Journal of Exposure Science and Environmental Epidemiology. Link.
Join us at the next WWSCAN Stakeholder call on October 13th, 2023
At the October WWSCAN Stakeholder meeting we will discuss results from the 1st month of new pathogen data collection (EV-D68, Rotavirus, Human Adenovirus Group F, Hepatitis A, and Candida auris) as well as new website features to help with interpreting wastewater trends and levels.
If you have questions about the website or anything else, submitting them in advance here will help us plan to address everything. We hope to see you there!