Bay Area SCAN weekly update 11/22/22
Happy Thanksgiving! We at project SCAN are thankful for your partnership over the last two years! It is amazing to see how far we have come together over the last two years.
All samples picked up by the couriers as of 11/21/22 have been processed and their data are on the site: wbe.stanford.edu. All data can be accessed through the CSV downloads below, including the new data products for influenza B (IAB) and norovirus (HuNoV). IAB and HuNoV data are also on the website now. The daily measurements of mutations in BA.4 and BA.2.75 are no longer provided although information about those specific variants will come via the sequencing data.
COVID-19
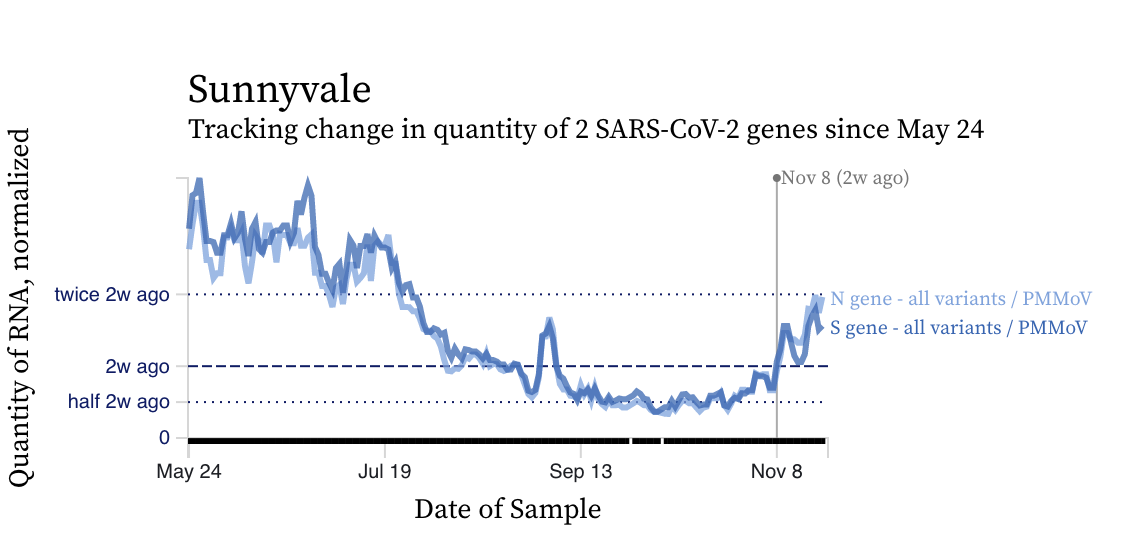
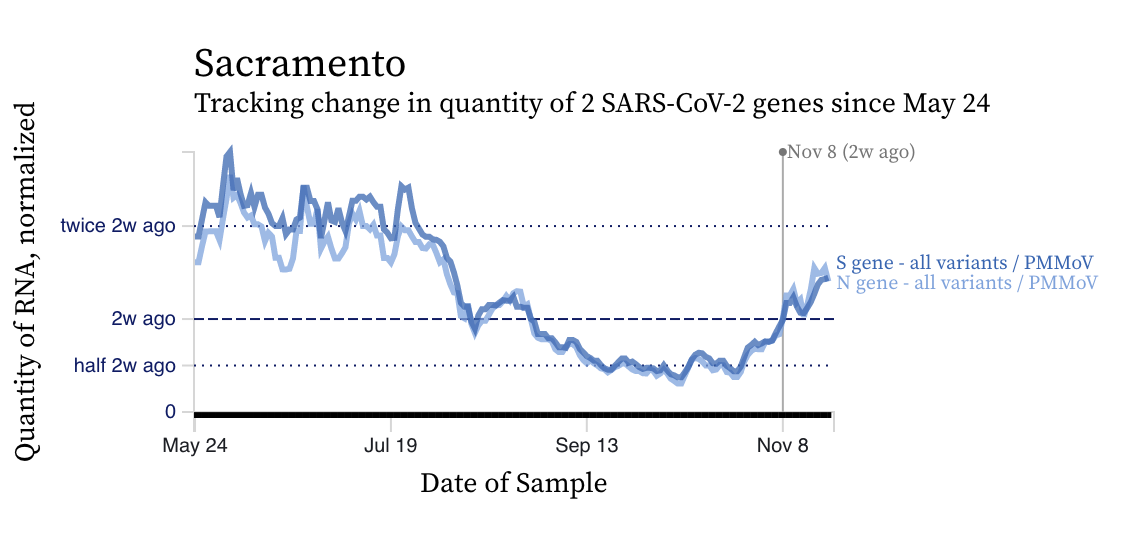
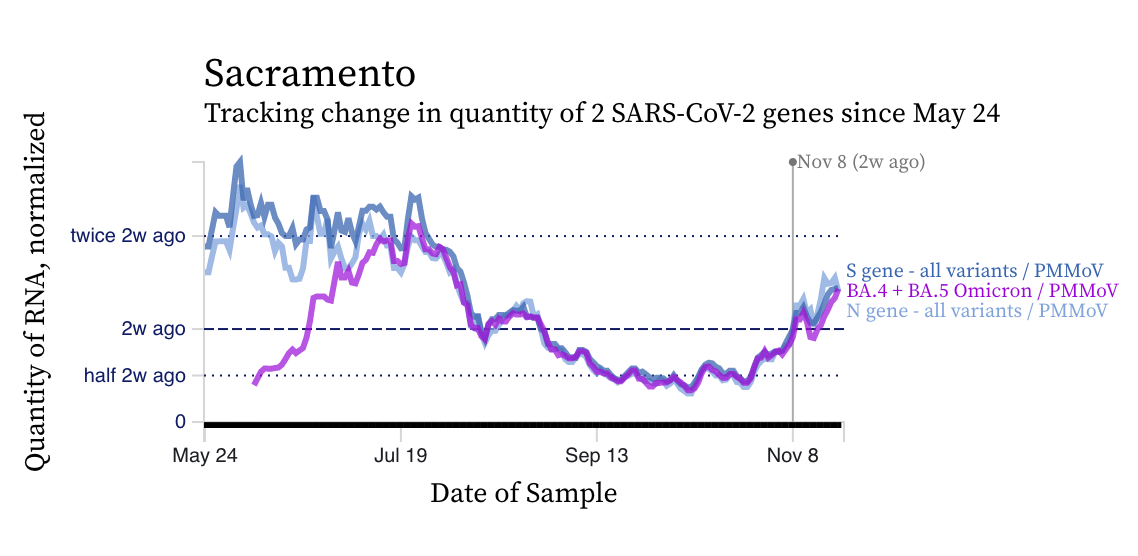
Well, here we are again, with wastewater concentrations of SARS-CoV-2 RNA increasing obviously in most plants. Examples from Sunnyvale and SAC below.
The main circulating variant has the HV69-70 mutation as seen in this chart from SAC below (purple line = HV69-70 which is present in BA.4 and BA.5). The BQ.* sublineage of BA.5 has the HV69-70 mutation, so is still captured by this mutation.
We sequence the S genes from SARS-CoV-2 in the wastewater solids from three samples per week at SAC, Oceanside (OSP), and San Jose (SJ). Data from samples collected between 11/5 and 11/9 indicate: low levels of XBB in OSP and SJ, BA.2.3.20 at all sites, support for increasing B.Q.* in all the samples, and detection of XBC in SJ. We will need to rely on sequencing to infer information about some of emerging variants (including the BQ.1*) that are descendents of BA.5 since their characteristic mutations may be just single SNPs, which are difficult to reliably target with probe-based digital PCR assays.
IAV, IBV, RSV, HMPV
Influenza A (IAV) RNA concentrations are high and increasing for the last two weeks. Here is an example from Palo Alto and Silicon Valley Clean Water:
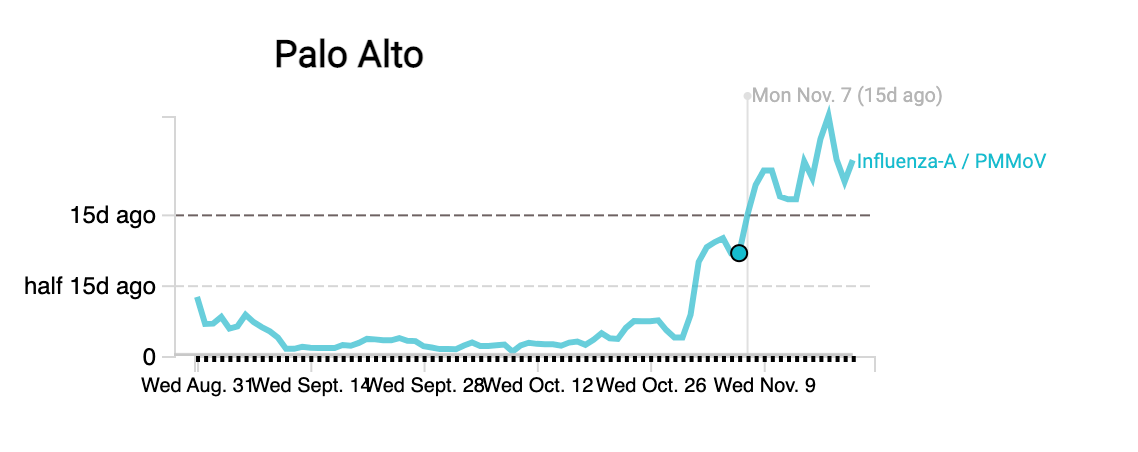
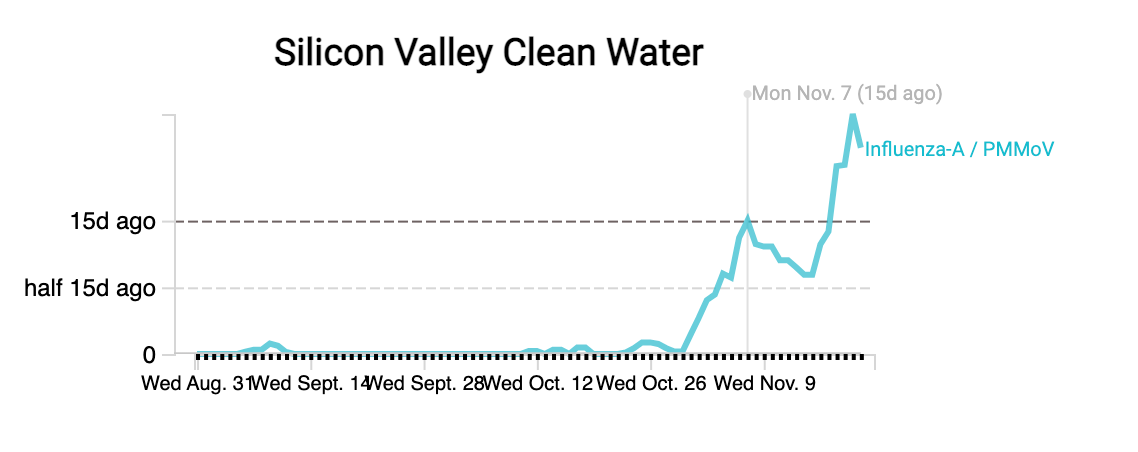
Last week, we noted the downturn in SVCW IAV RNA concentrations and we can now see it has upturned again.
Santa Clara County now has the influenza A data on their county website:
https://publichealthproviders.sccgov.org/diseases/influenza/influenza-report#3925188384-593642738
Click on the wastewater tab at the top of the dashboard.
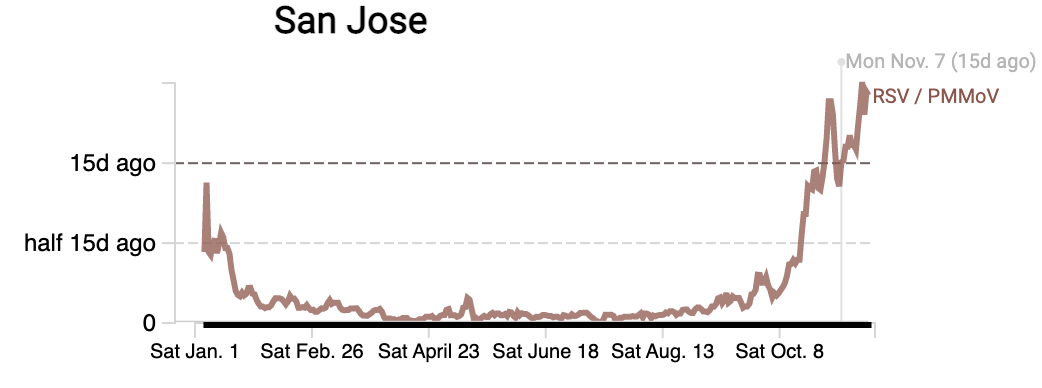
RSV RNA concentrations continue with a upward trend across the SCAN plants, interrupted in some cases by high frequency fluctuations. Here is an example from San Jose, but data from all plants look similar. RSV levels today are higher than those seen last January at the height of the last RSV season. Please head to the website to see data from more plants (link).

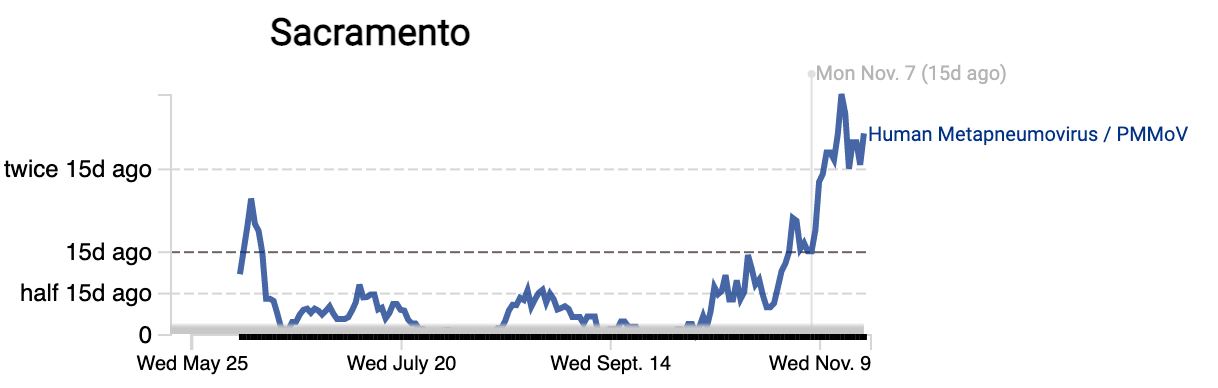
HMPV (human metapneumovirus) RNA concentrations at the SCAN plants have increased over the last 2 weeks . Here is an example from SAC. Most plants show an upward trend like this.
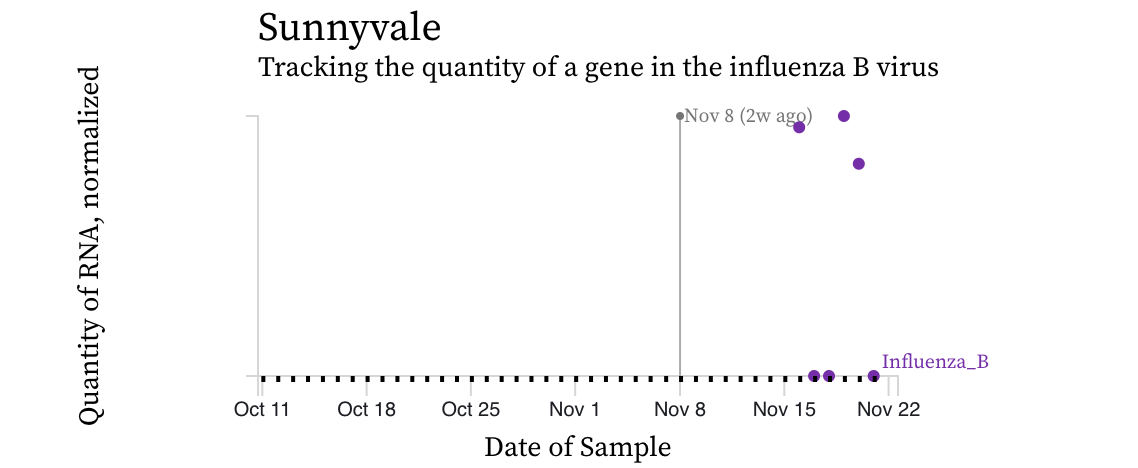
Influenza B (IBV) RNA concentrations are non-detect since we started measuring them last week, except at Sunnyvale where we had three detections at very low concentrations: (you can access plots like this with the raw data on this link)
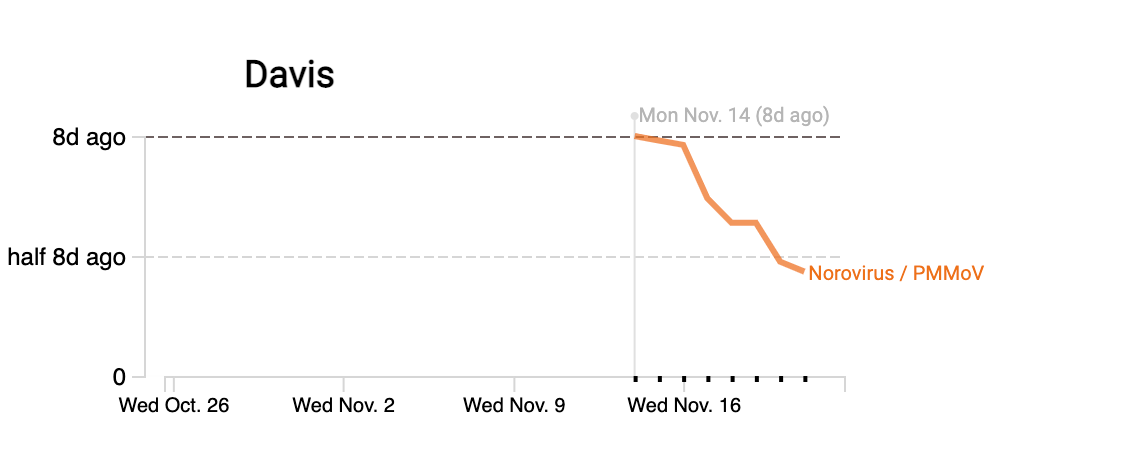
Norovirus RNA concentrations are on the order of 10^6 copies/g across the plants. It is too soon to report any trends. Here is an example graphic from the SCAN website for Davis (click on norovirus on the top to see data for all plants):
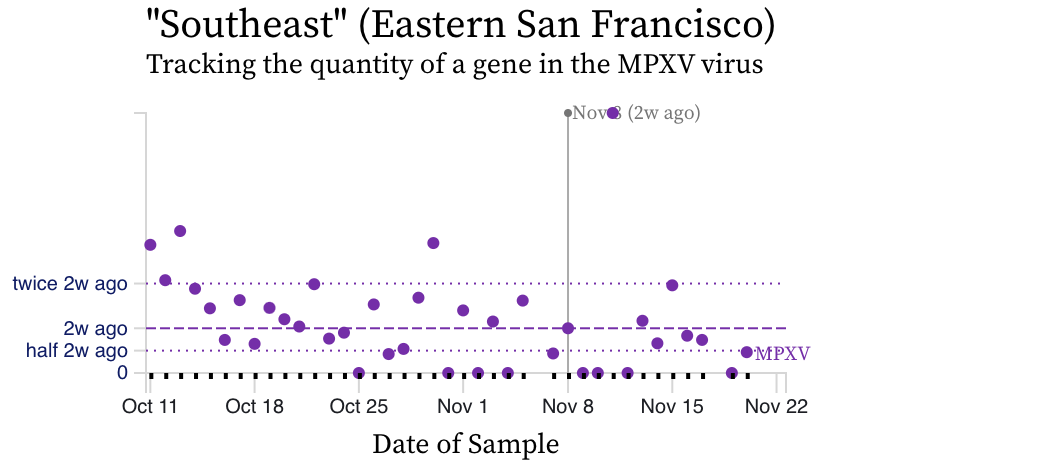
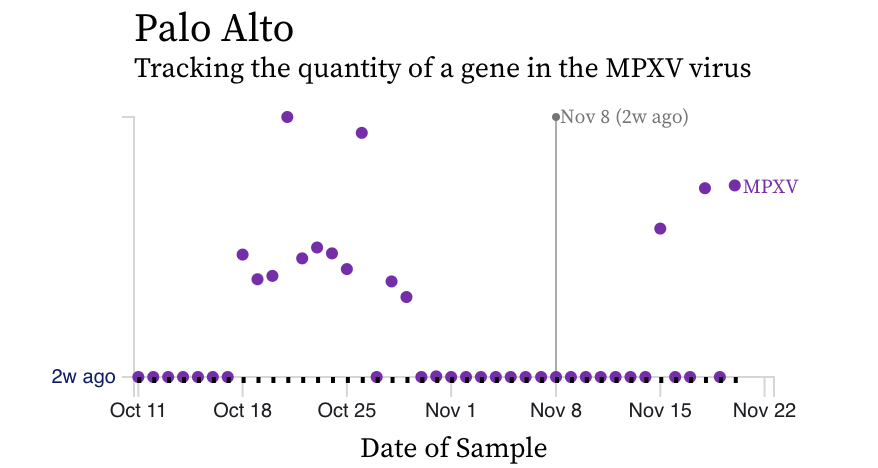
MPXV We are seeing mostly non-detects in the past week for MPXV DNA. Here is an example from Southeast showing just the raw data for the last weeks. This site has the most detects of all the sites. There were also some detects in Palo Alto (also shown below). Overall though, this is good news for MPXV.
Thank you for reading this far. Have a nice holiday!
Ali