SCAN Weekly Update - 1/31/24
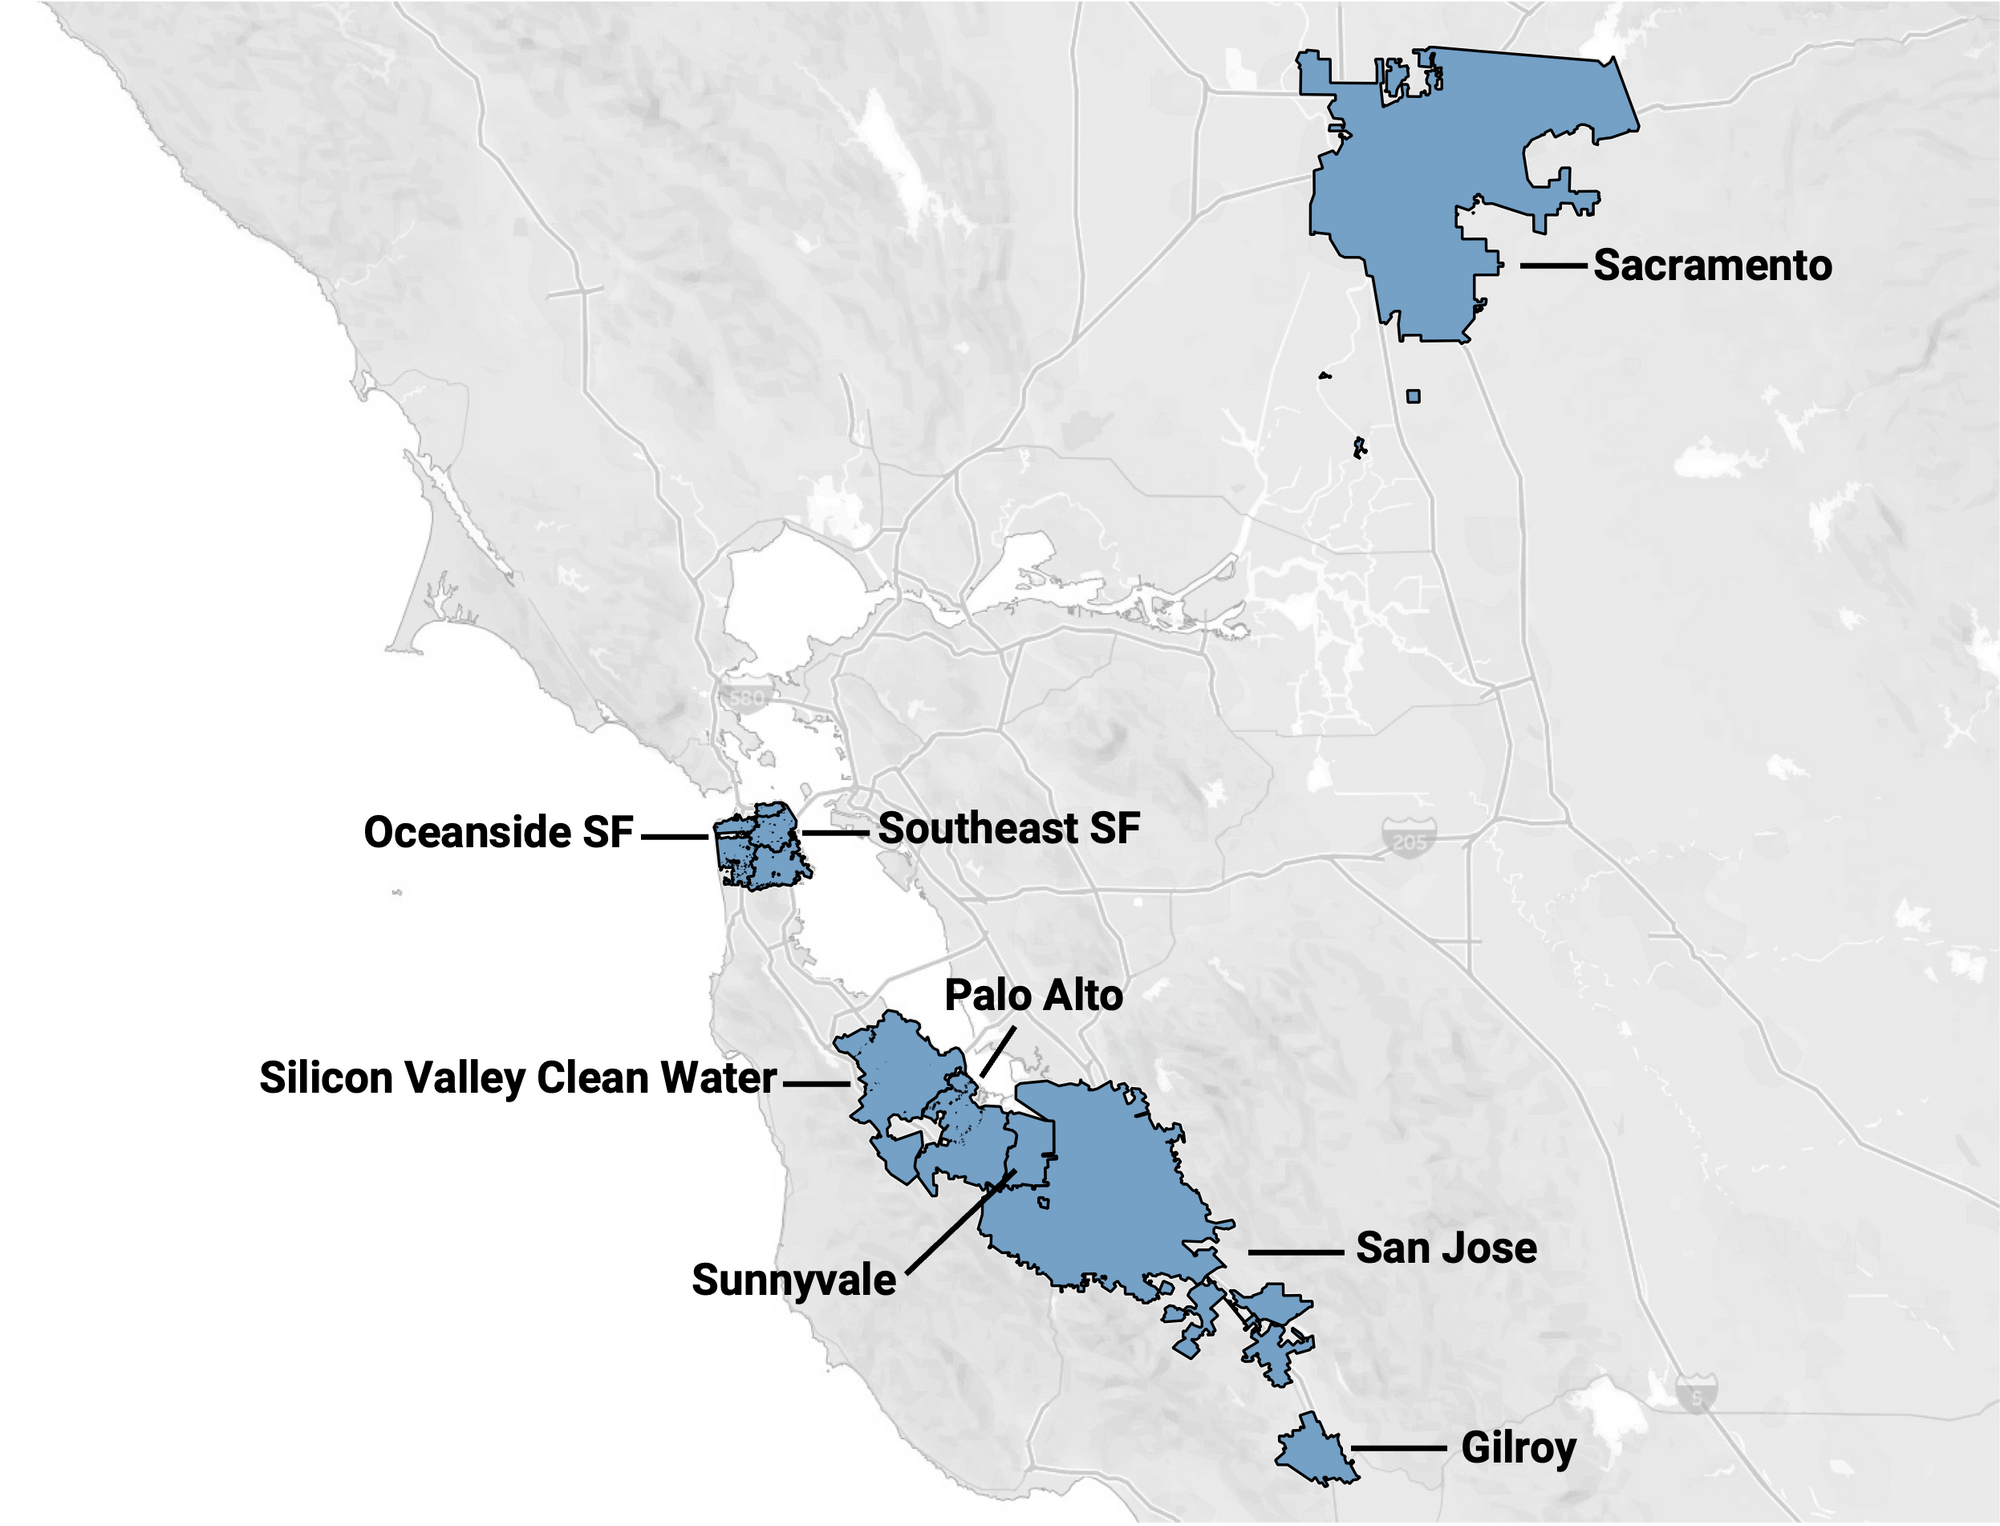
This blog post describes data collected at 8 wastewater treatment plants in the Greater Bay Area of San Francisco, CA, including Sacramento, that are partners in the SCAN project which began in late 2020. The SCAN plants are a subset of the WastewaterSCAN plants.
All samples picked up by the couriers as of 1/28/24 have been processed and their data are on the site: data.wastewaterscan.org. Please email Ali at aboehm@stanford.edu if you identify any bugs on the site.
For more information about the Wastewater Categorization system (i.e., how LOW, MEDIUM, or HIGH categories are determined for each pathogen), please see "How are wastewater categories determined?" in the About page for wastewaterSCAN.
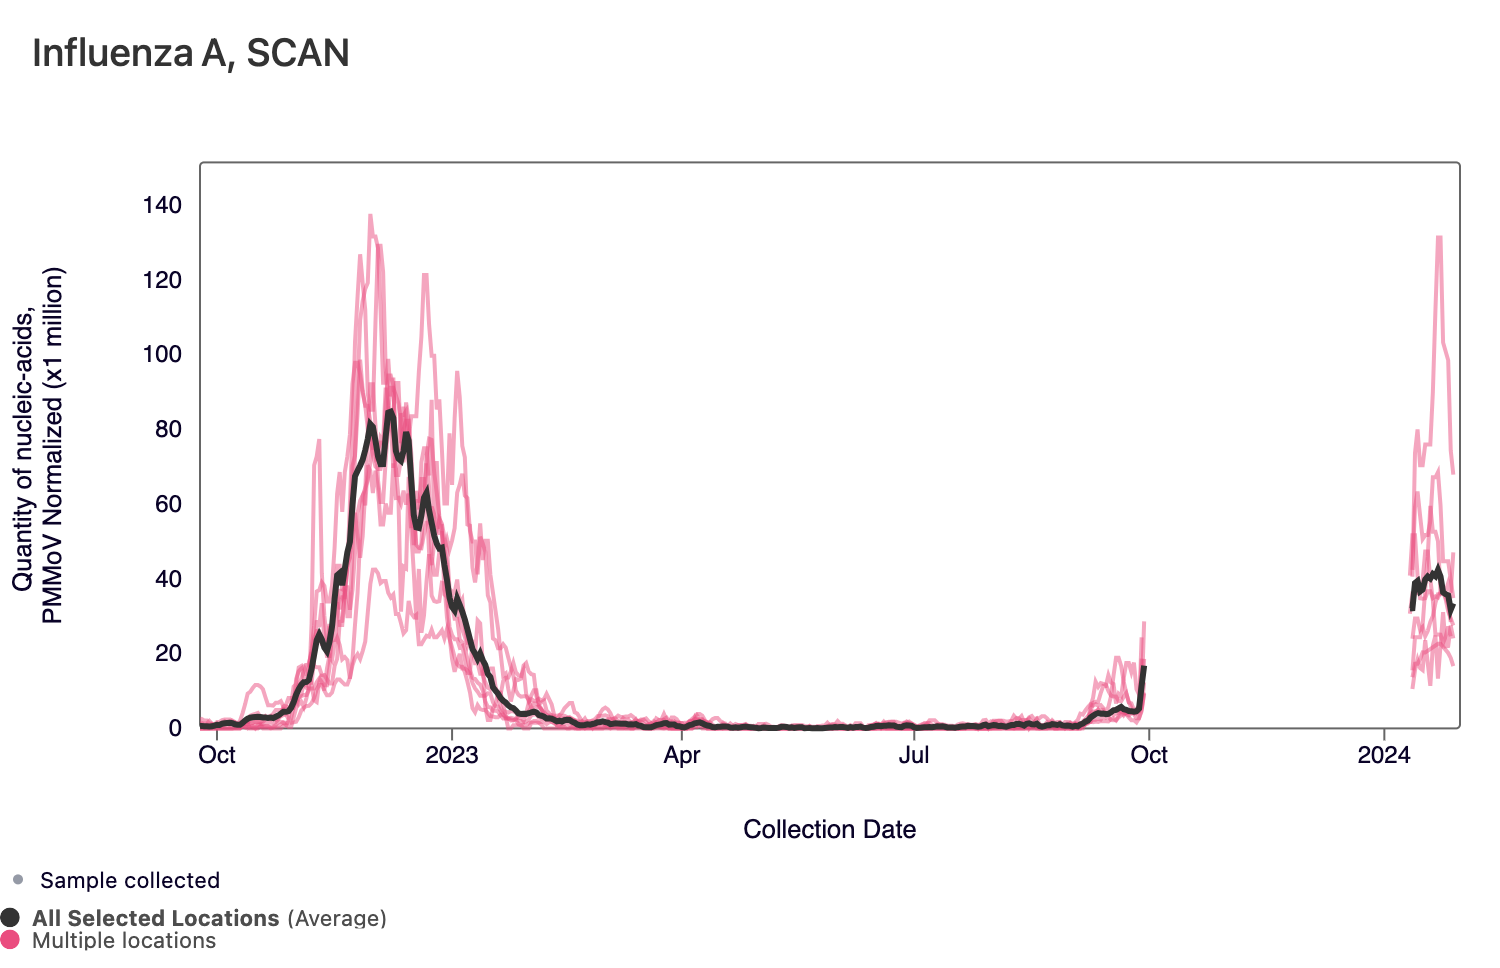
We identified an issue with the IAV assay where the fluorescent molecule on the probe was not performing as expected. We removed impacted IAV data from the dashboard between 1 Oct 2023 and approximately 11 Jan 2024. We have started using a new fluorescent molecule, and new IAV data will be displayed shortly. This issue only affects IAV data.
COVID-19
SARS-CoV-2 and Variants
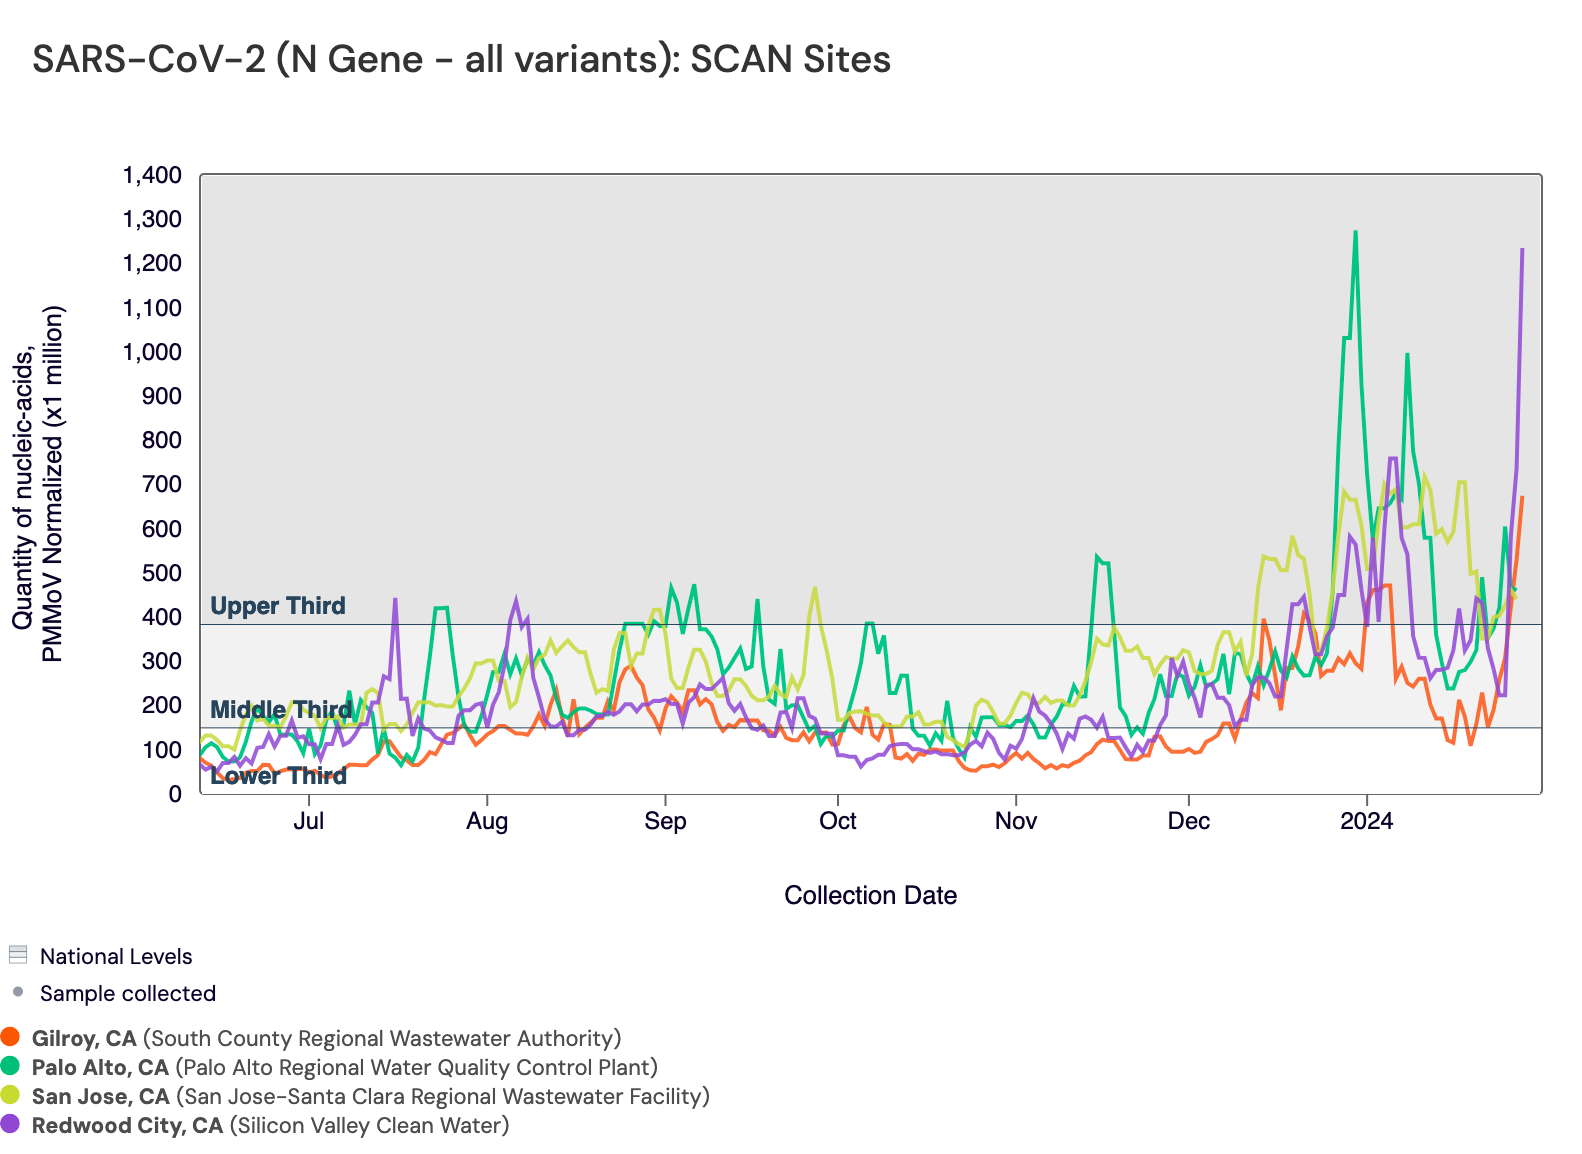
SARS-CoV-2 N gene concentrations are between 100,000 and 1,000,000 copies/g. In the chart below, the National Levels benchmarks are superimposed on the the SARS-CoV-2 concentrations at Gilroy, SVCW, Palo Alto, and San Jose since July.
Below are the current SARS-CoV-2 wastewater categories for the SCAN sites (recall the category is determined by both the trend and the level):
- Sunnyvale, Sacramento, Oceanside SF, and Southeast SF are in the MEDIUM Wastewater Category
- Gilroy, SVCW, Palo Alto, and San Jose are in the HIGH Wastewater Category
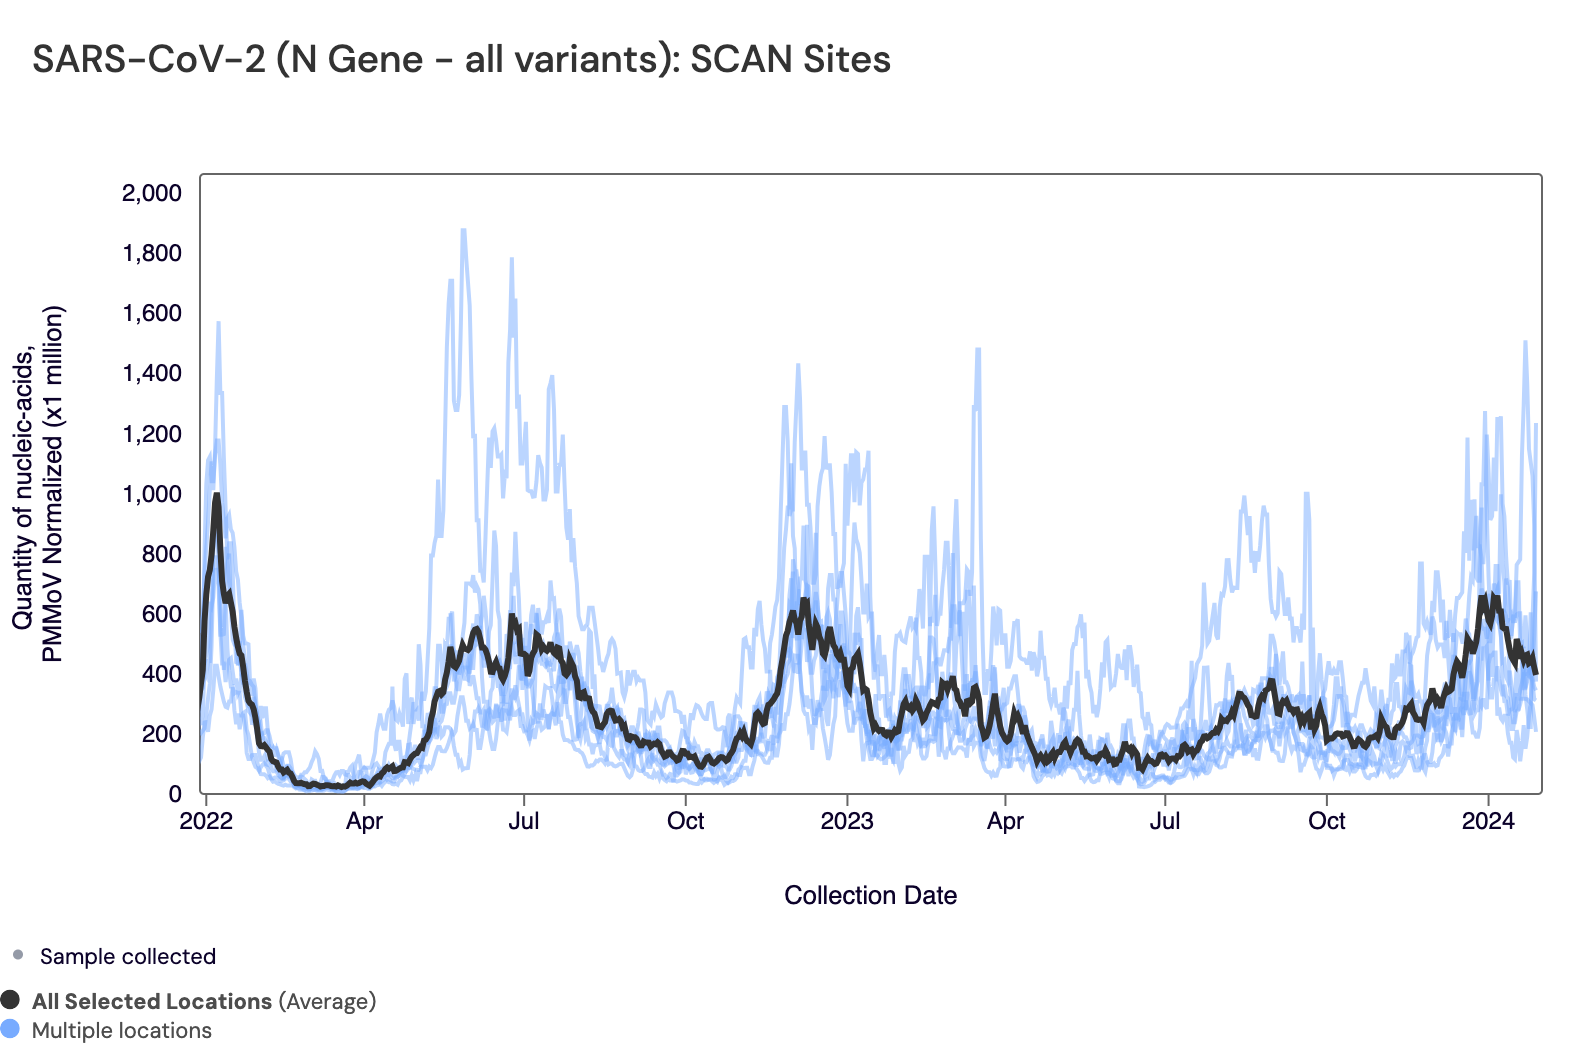
Below are all the data from all the SCAN plants for the last two years. You can access the graph here. The population weighted average across the SCAN plants is shown in black. The population weighted average is as high or higher now than they have been in awhile, consistent with information currently being shared in media coverage of COVID infections, nationally. In our case, we have used consistent methods over time so levels can be compared overtime.
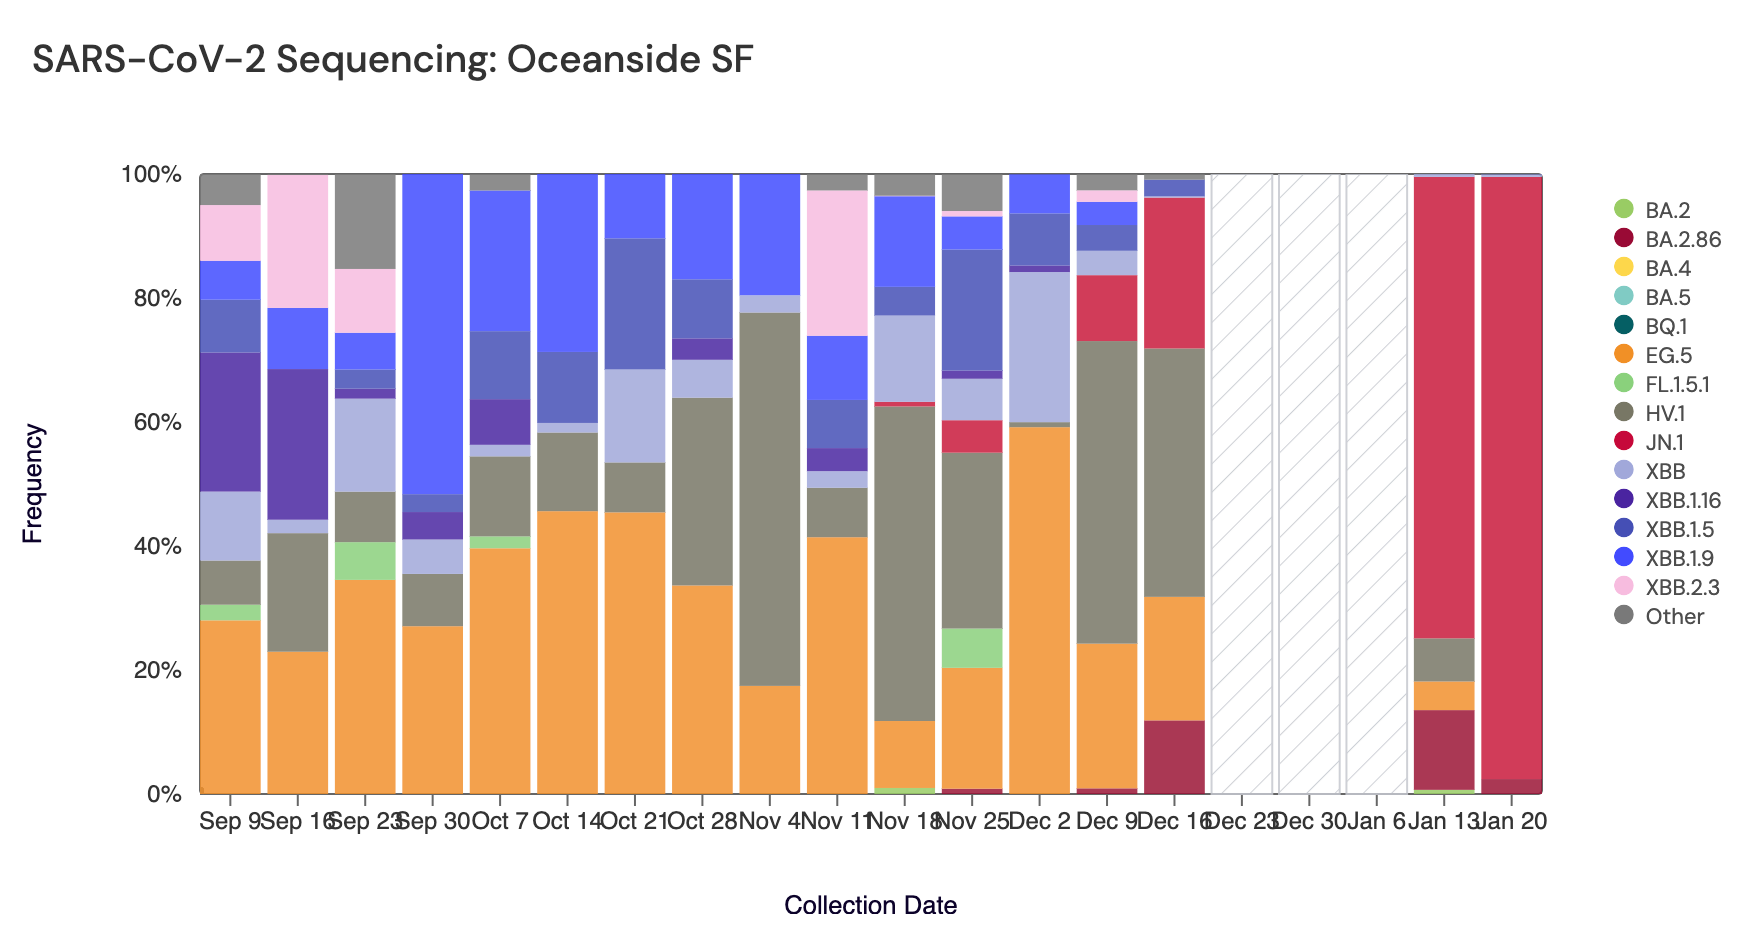
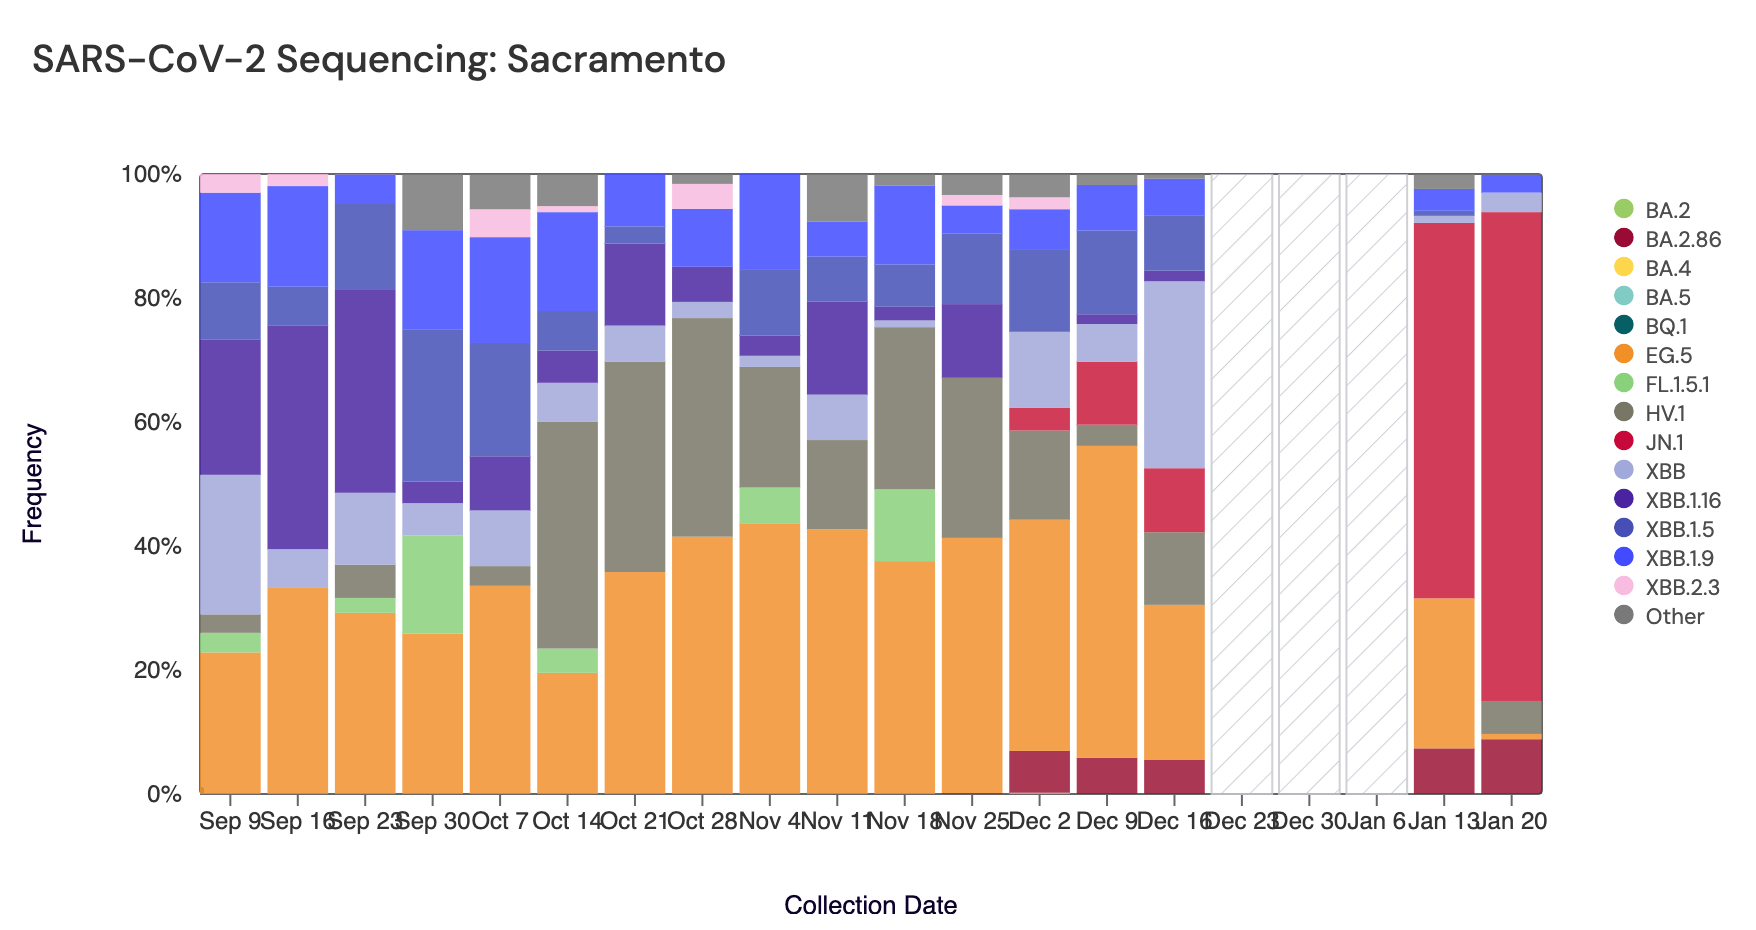
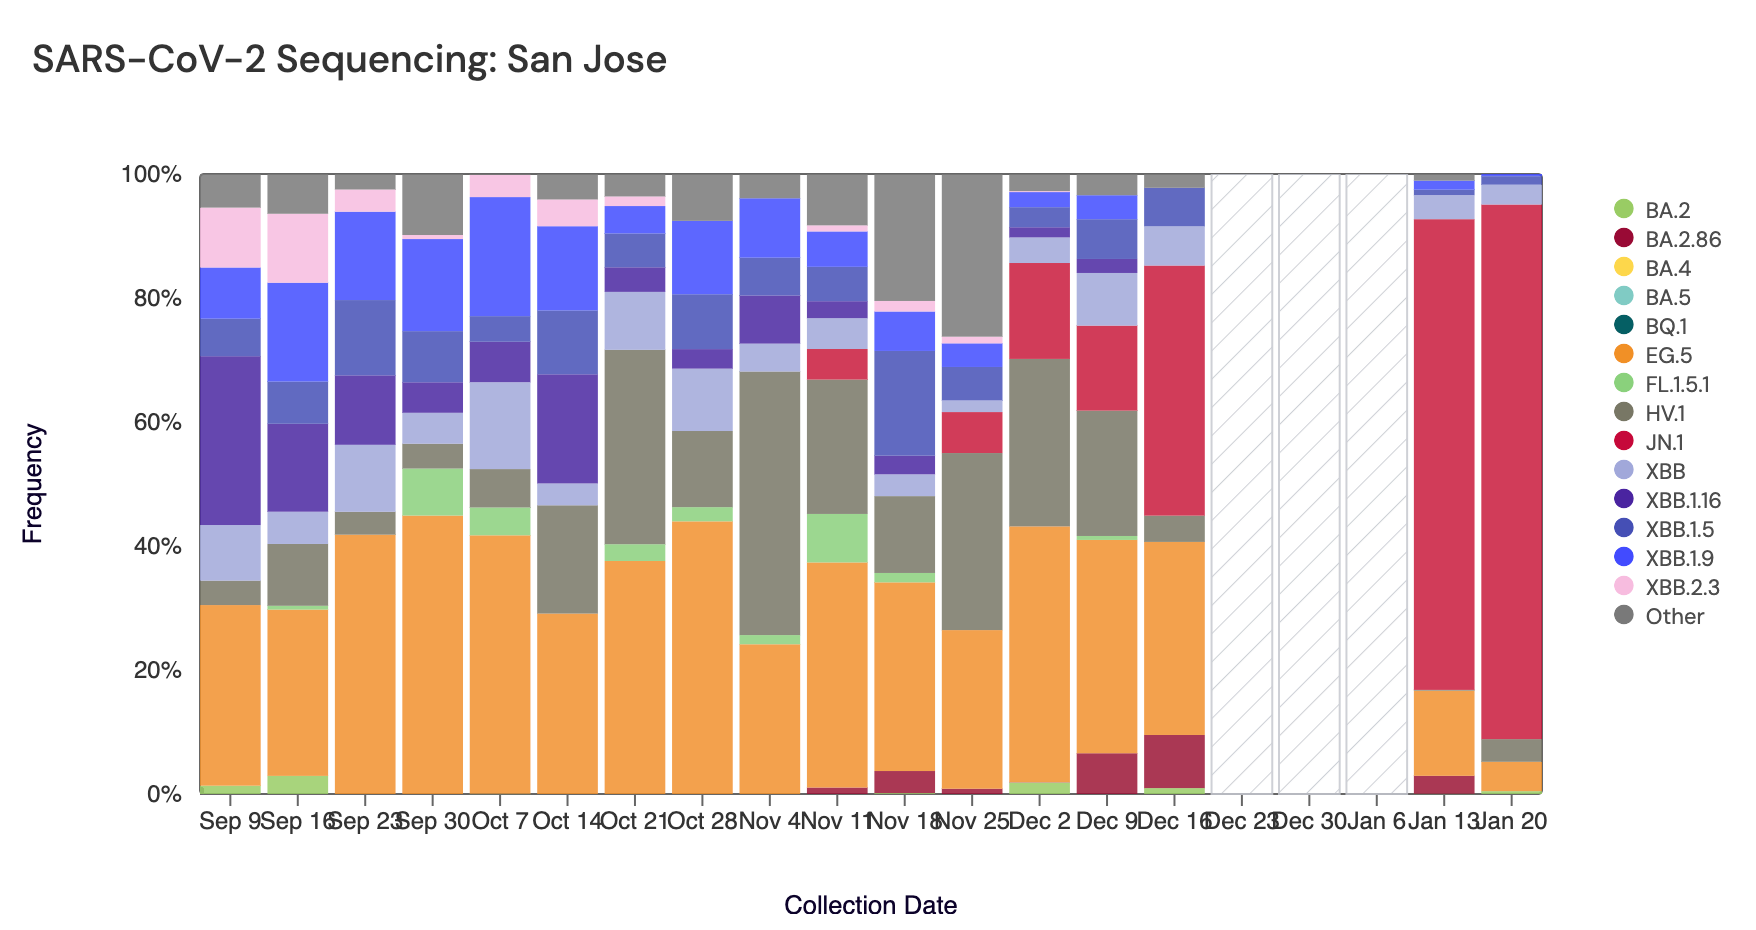
Below are plots from Oceanside SF, Sacramento, and San Jose showing the relative proportions of different variants inferred from sequencing the entire genome of SARS-CoV-2 (Note: the sequencing variant plots are now available on the website, so the plots that are shown below are linked above if you want to interact with them). White and grey striped bars indicate no data is currently available for that date. In the most recent samples, JN.1 (bright red) made up the largest proportion of the lineages detected at Oceanside SF (97%), San Jose (86%), and Sacramento (79%). Note that the sequencing data are always from samples taken between 1- 2 weeks ago. Recent news articles have documented the "rapid spread" of JN.1. The most recent data are from the week of Jan 13, so are about 2-3 weeks in the past. New data should be available soon.
Other Respiratory Targets
Influenza A & B, RSV, HMPV, EV-D68 and Parainfluenza
A few weeks ago, we identified a technical issue with the fluorescent molecule on the influenza A assay probe that impacted the performance of our influenza A digital RT-PCR assay. All of the impacted data (1 Oct 2023 to approximately 11 Jan 2024) were removed from the website. We are now analyzing samples for influenza A RNA using a probe containing a different, better performing fluorescent molecule. New data are on the website, and we are now analyzing data from the impacted period and those new data are being added as they are available. We expect to have the entire duration of impacted data filled in within a few weeks. Here is how the plot looks as of today.
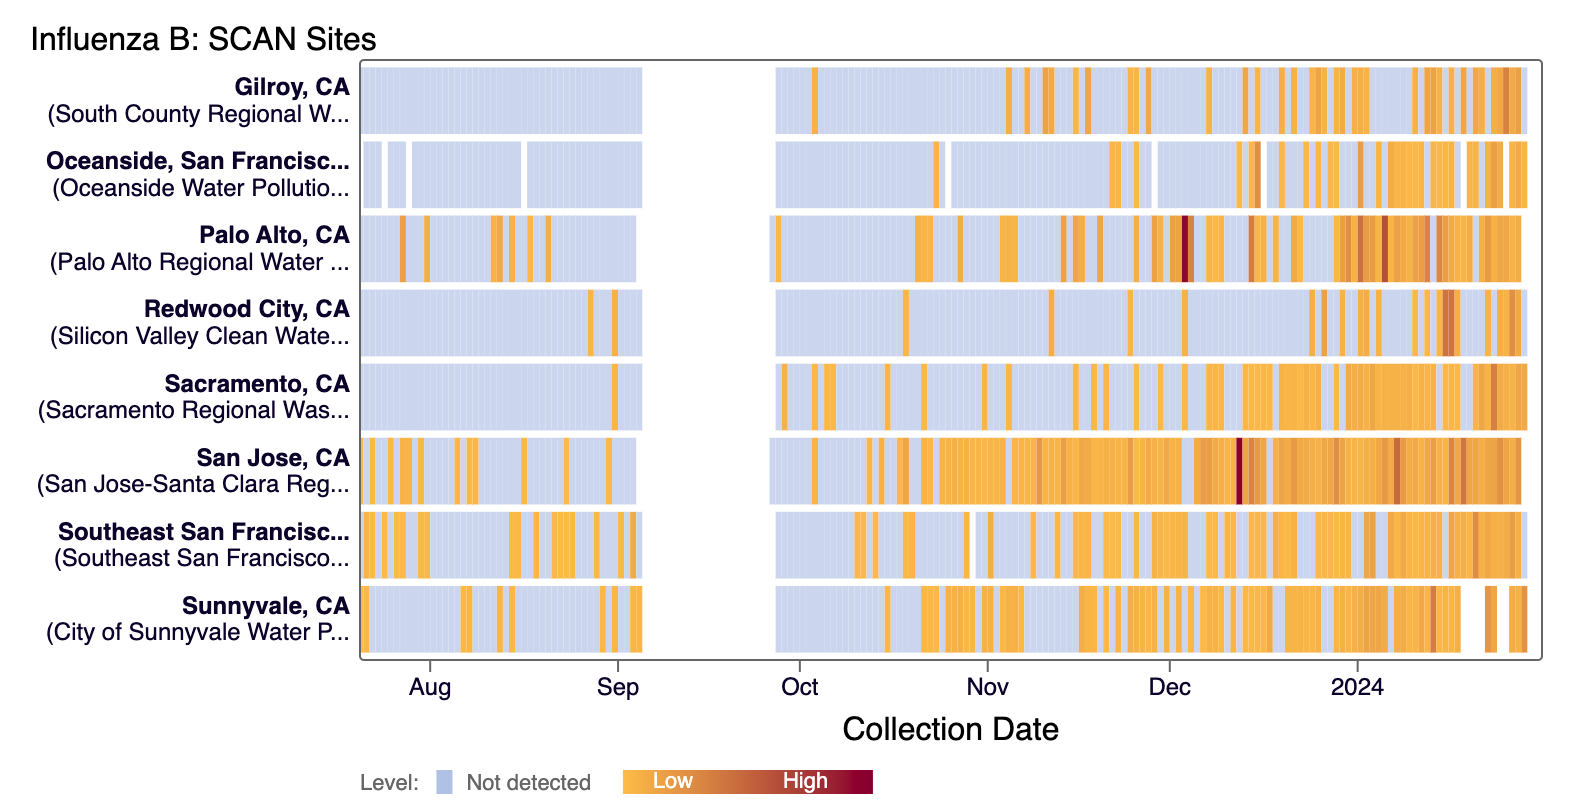
Influenza B (IBV) RNA has been detected the majority of SCAN sites in the last 21 days. The heat map below shows all the SCAN sites as a row and each date as a column. The color blue means the sample was non-detect for IBV RNA and the colors get darker with higher concentrations. White indicates no sample was collected. We briefly stopped monitoring for IBV, which explains gap in data across sites in September. Here is the link to the heat map chart.
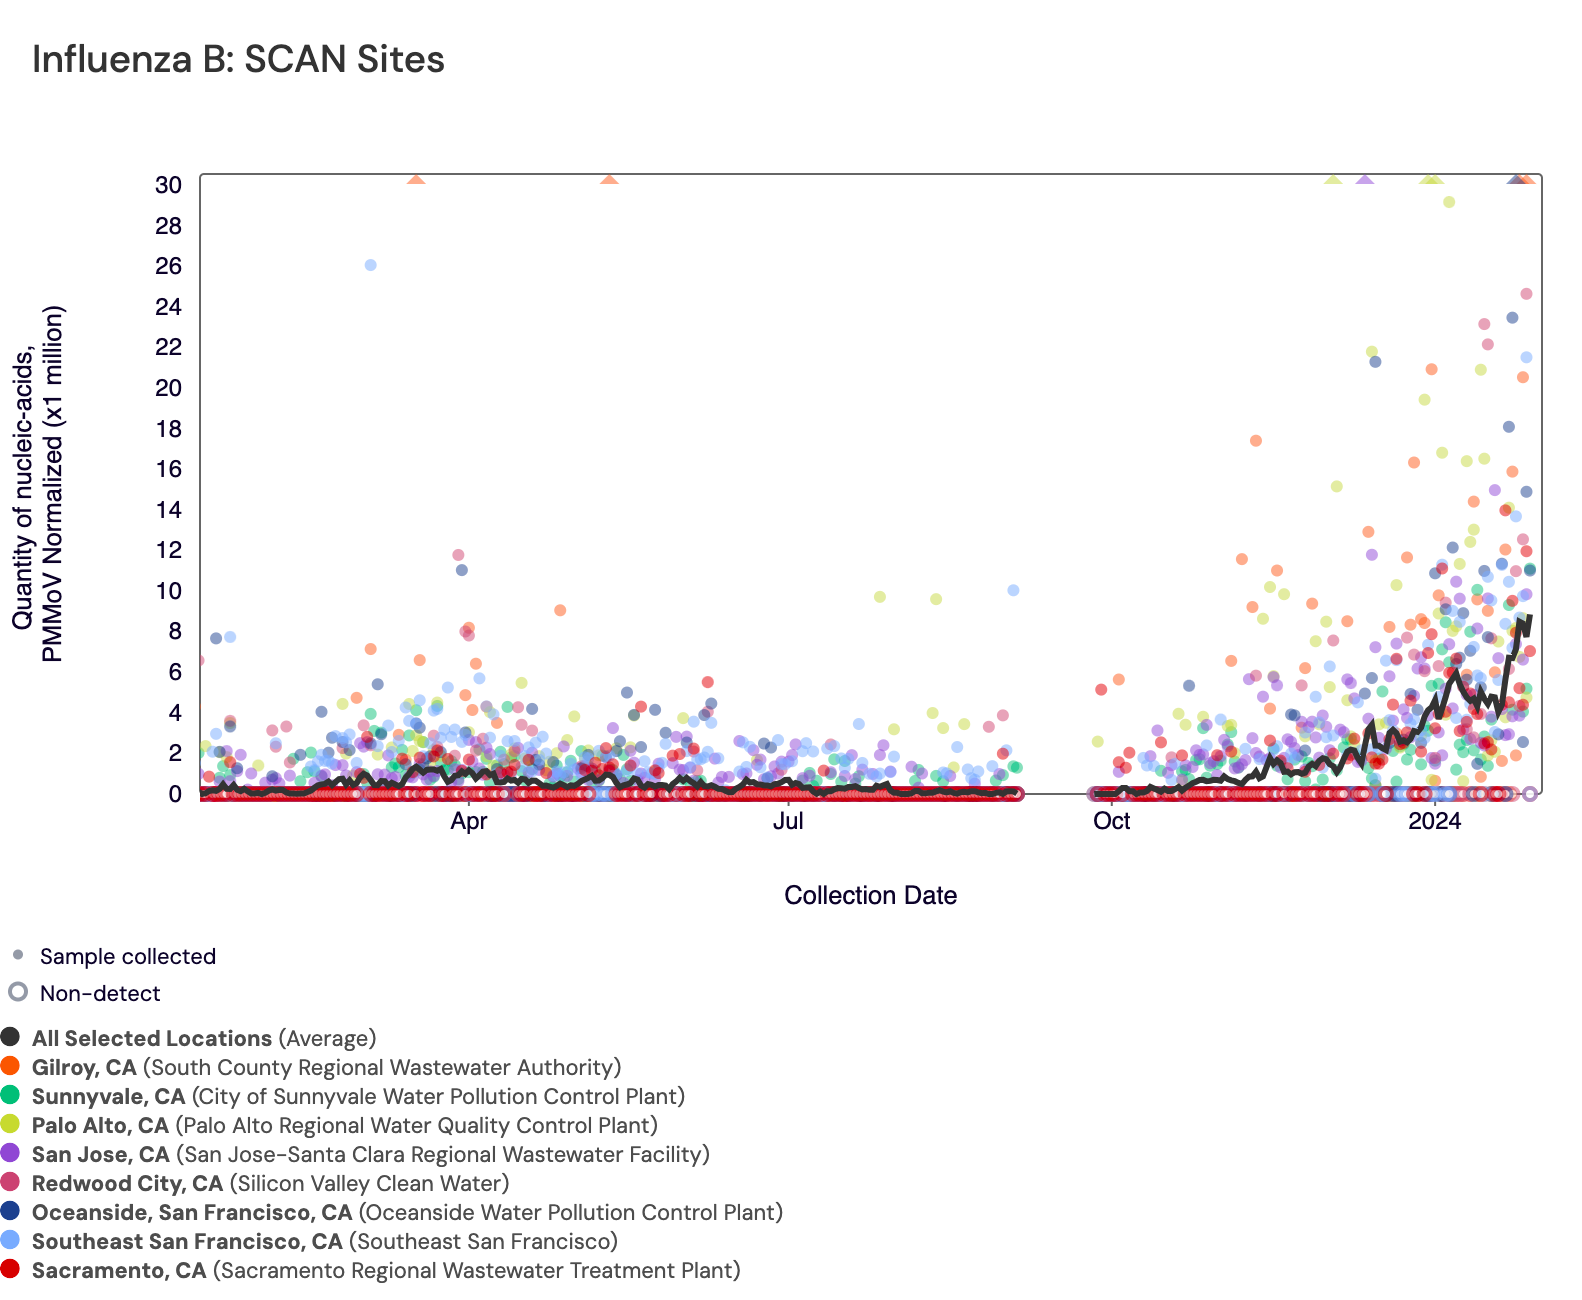
In the chart below, the population weighted average line across all the SCAN plants is shown in black and raw IBV data for the SCAN sites are shown as points. Here is the link to the chart if you want to interact with it.
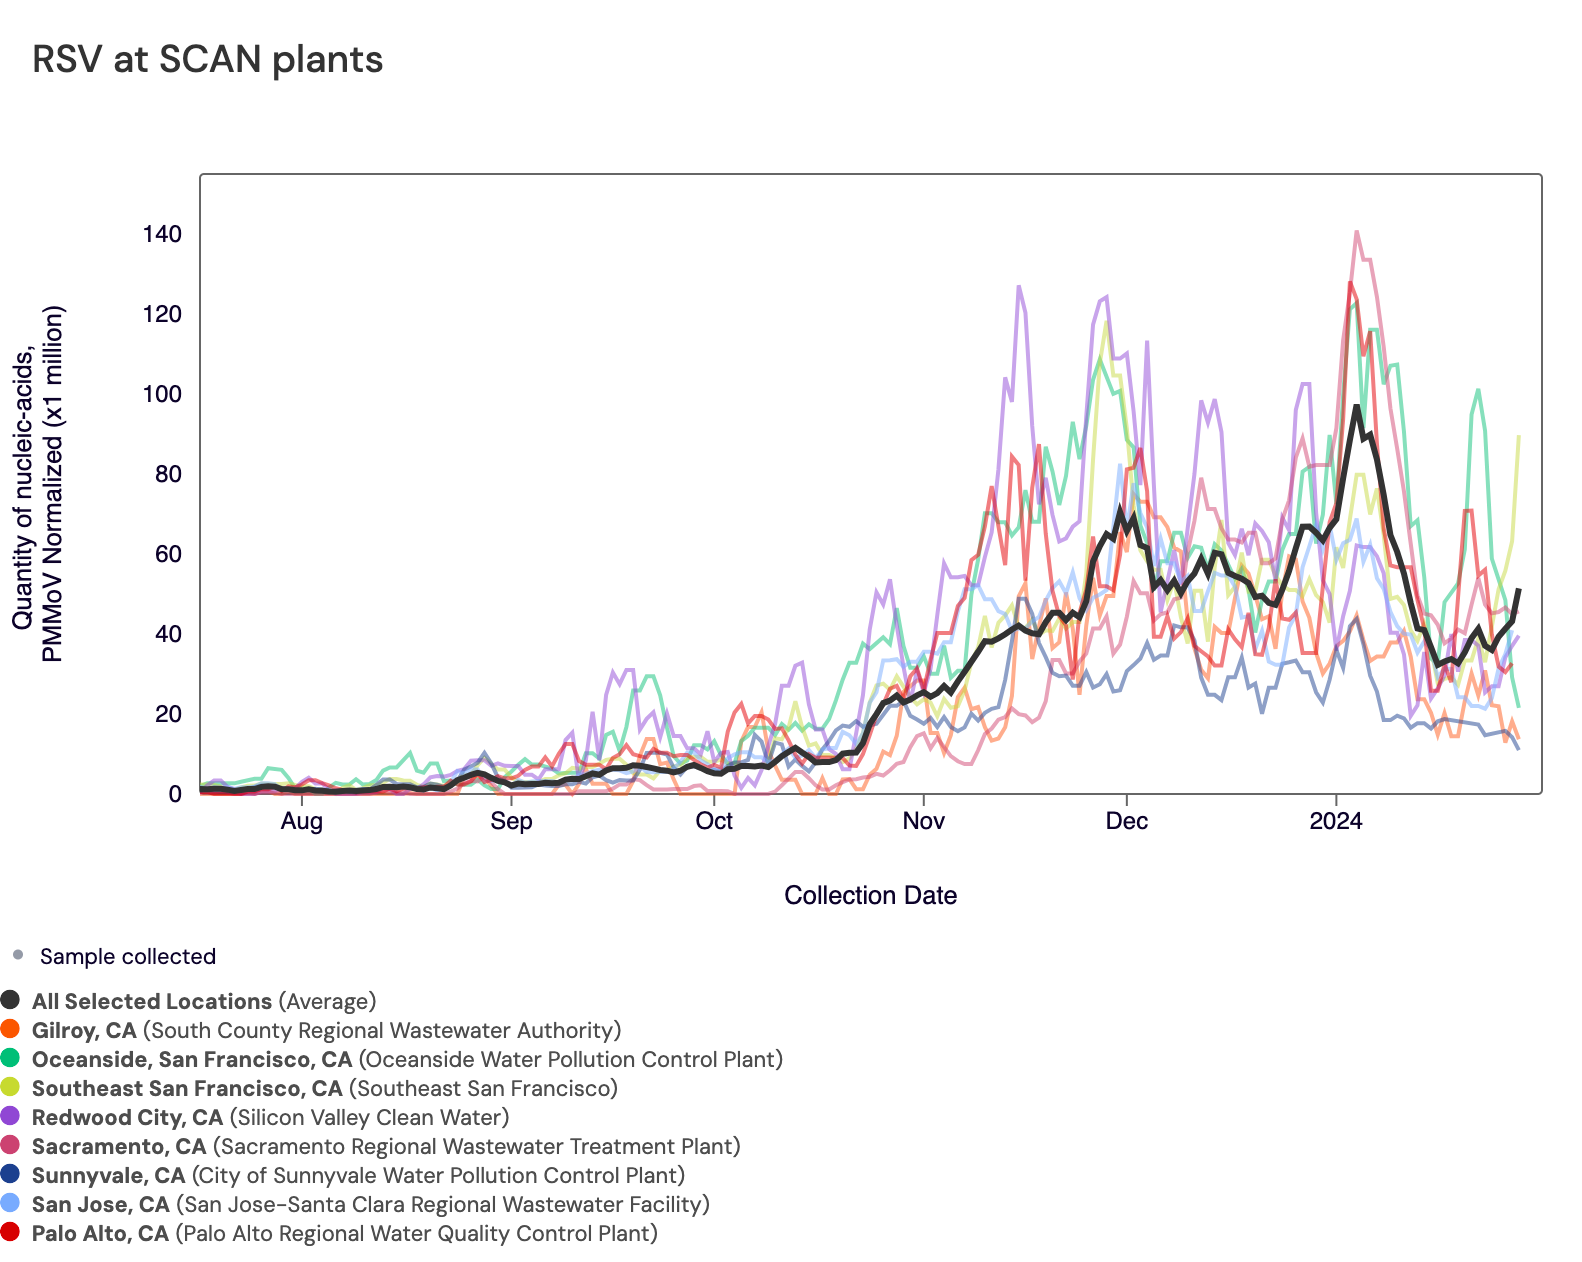
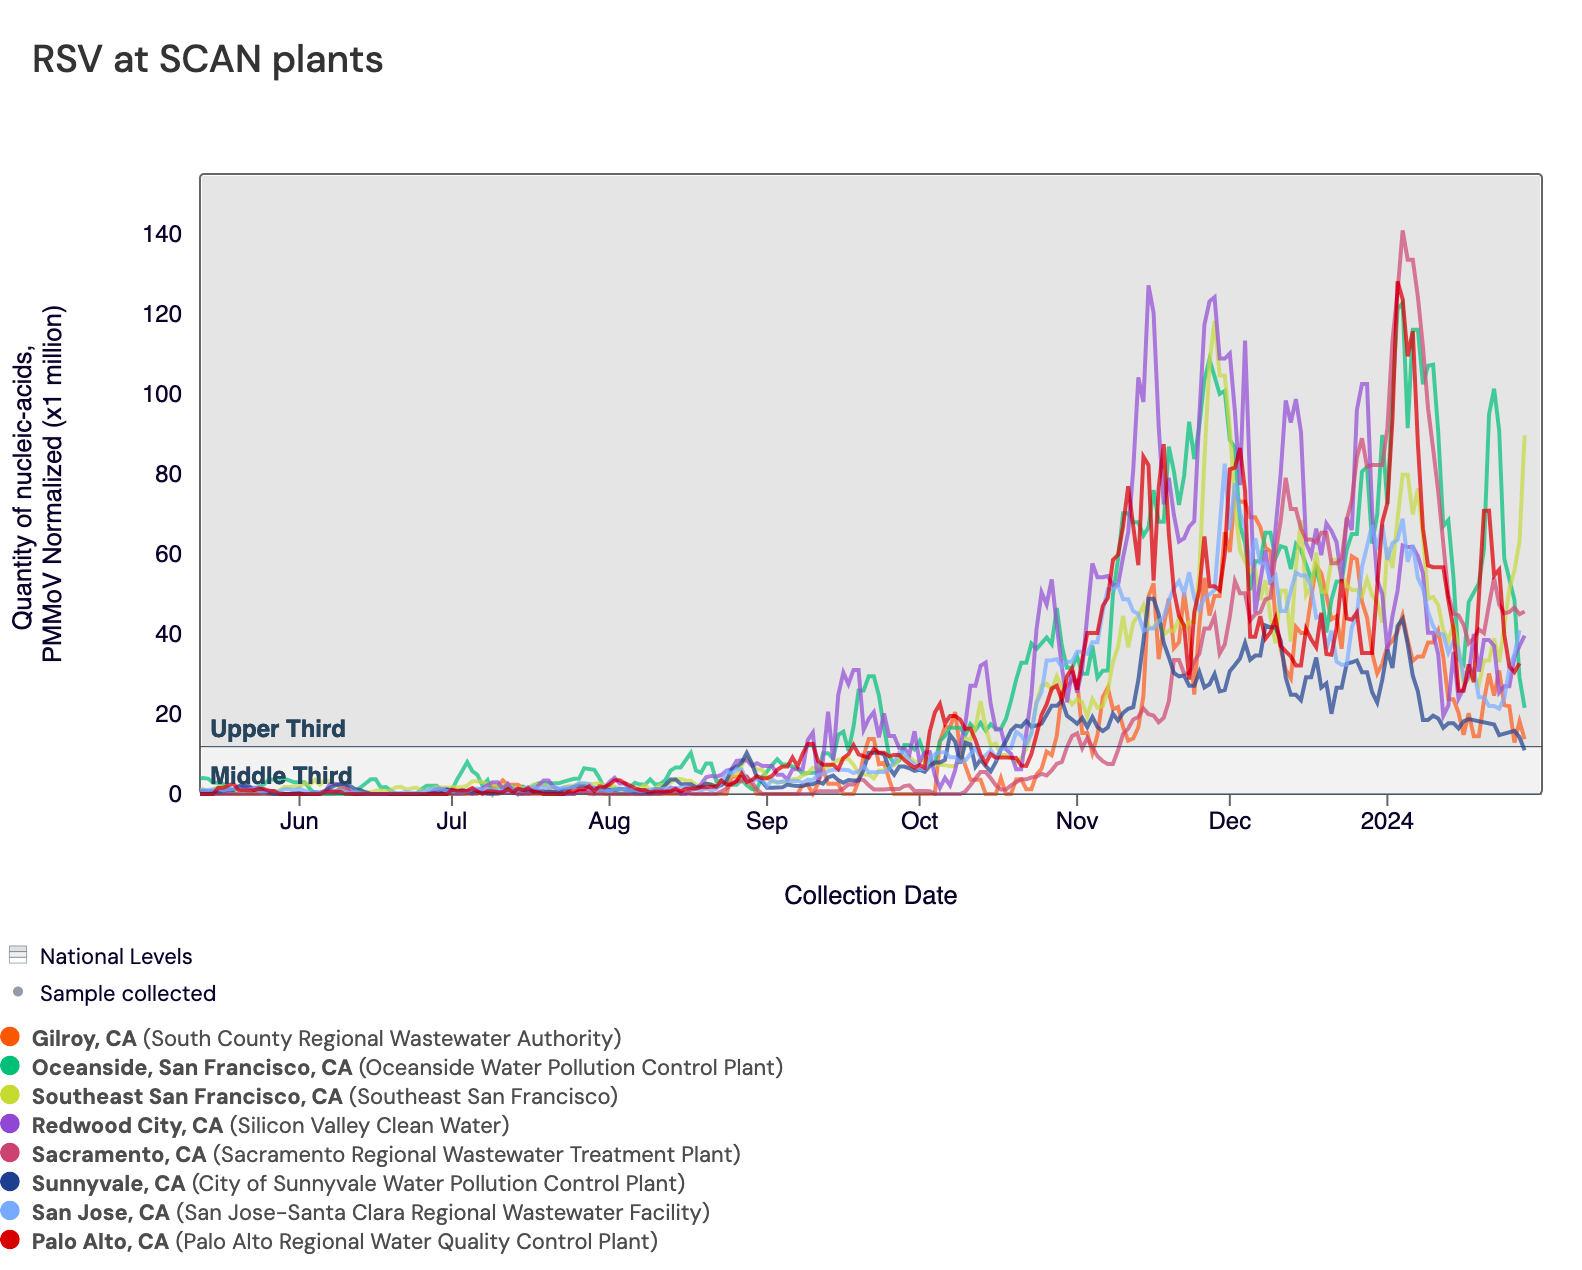
RSV RNA concentrations remain high at most SCAN sites, and all SCAN sites remain in wastewater onset. In the chart below, the population weighted average line across all the SCAN plants (black) is compared to the RSV concentrations at individual SCAN plants since August.
Below are the current RSV wastewater categories for the SCAN sites (recall the category is determined by both the trend and the level):
- Sunnyvale is in the MEDIUM Wastewater Category (in onset)
- Gilroy, SVCW, Palo Alto, Southeast SF, Sacramento, Oceanside SF, and San Jose are in the HIGH Wastewater Category (in onset)
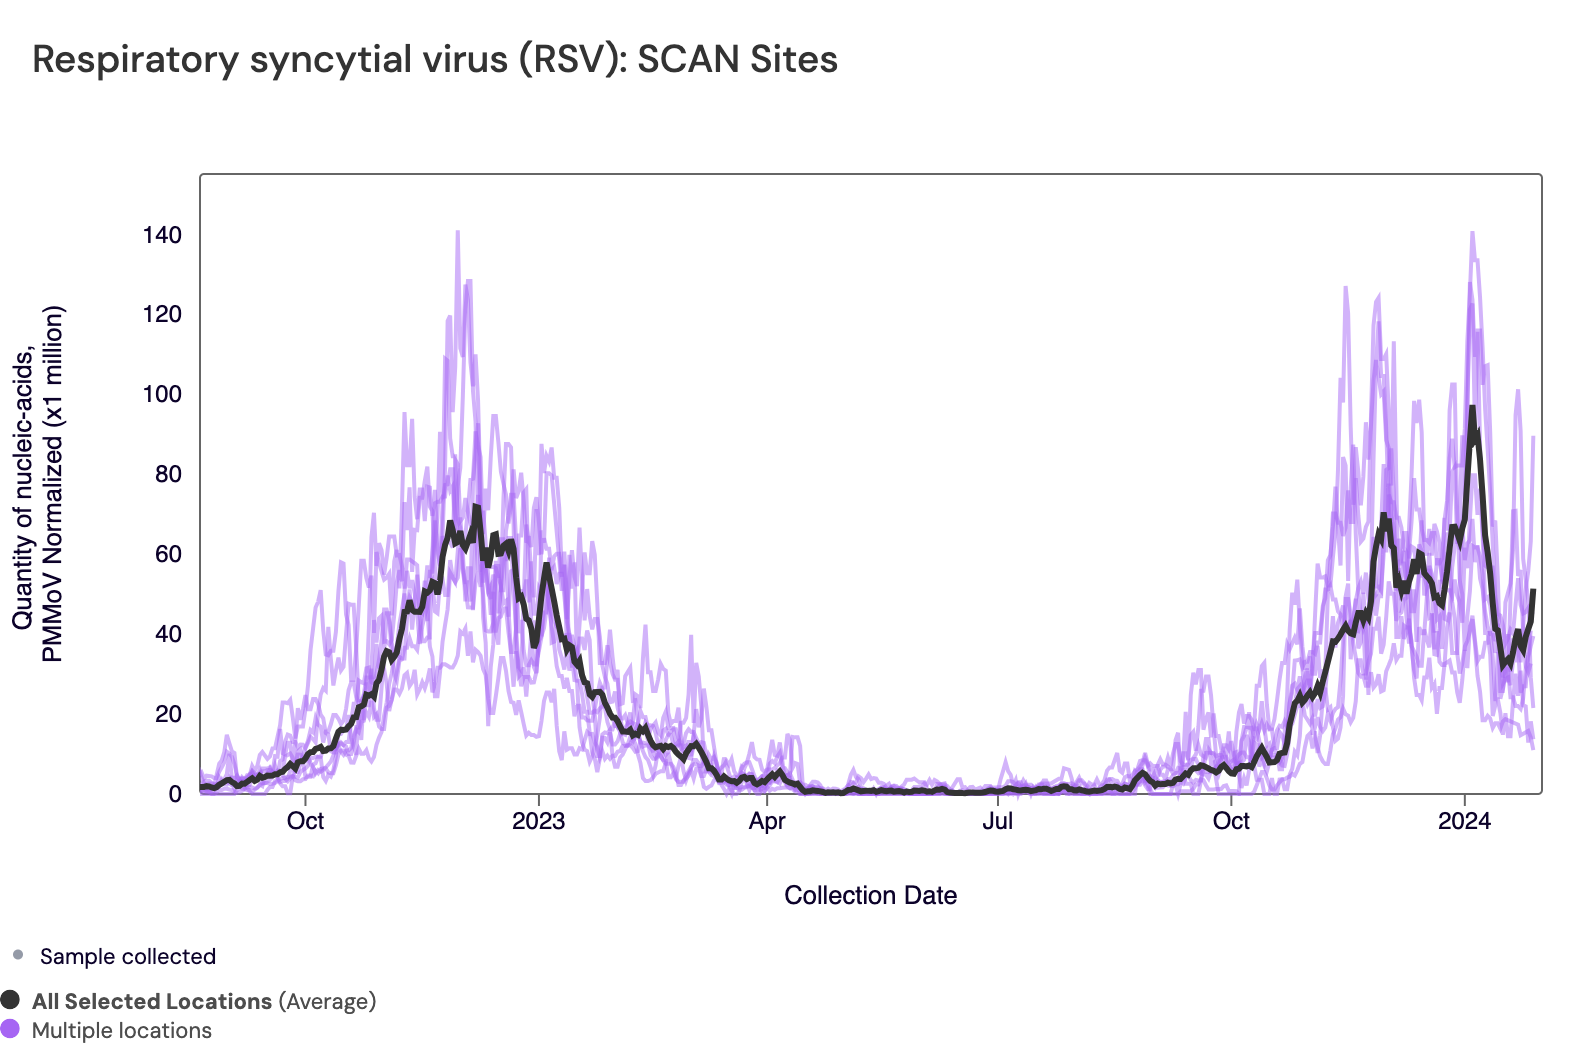
In the chart below, the population weighted average line across all the SCAN sites is shown in black, and you can see the current concentrations relative to the peak RSV levels from last year. The link to the chart below is here if you would like to interact with it.
Below is a chart showing the National Levels benchmarks superimposed on the RSV data from the SCAN sites (you can access this chart here). Currently, most SCAN sites have RSV concentrations in the upper third level, and Sunnyvale has RSV concentrations in the middle third tier.
HMPV (Human metapneumovirus) RNA concentrations are increasing at many SCAN sites. Sunnyvale, San Jose, Sacramento, and, new this week, Southeast SF have met the benchmark for onset. In the chart below, the National Levels benchmarks are superimposed on the the HMPV concentrations at Sunnyvale, San Jose, Sacramento, and Southeast SF since August.
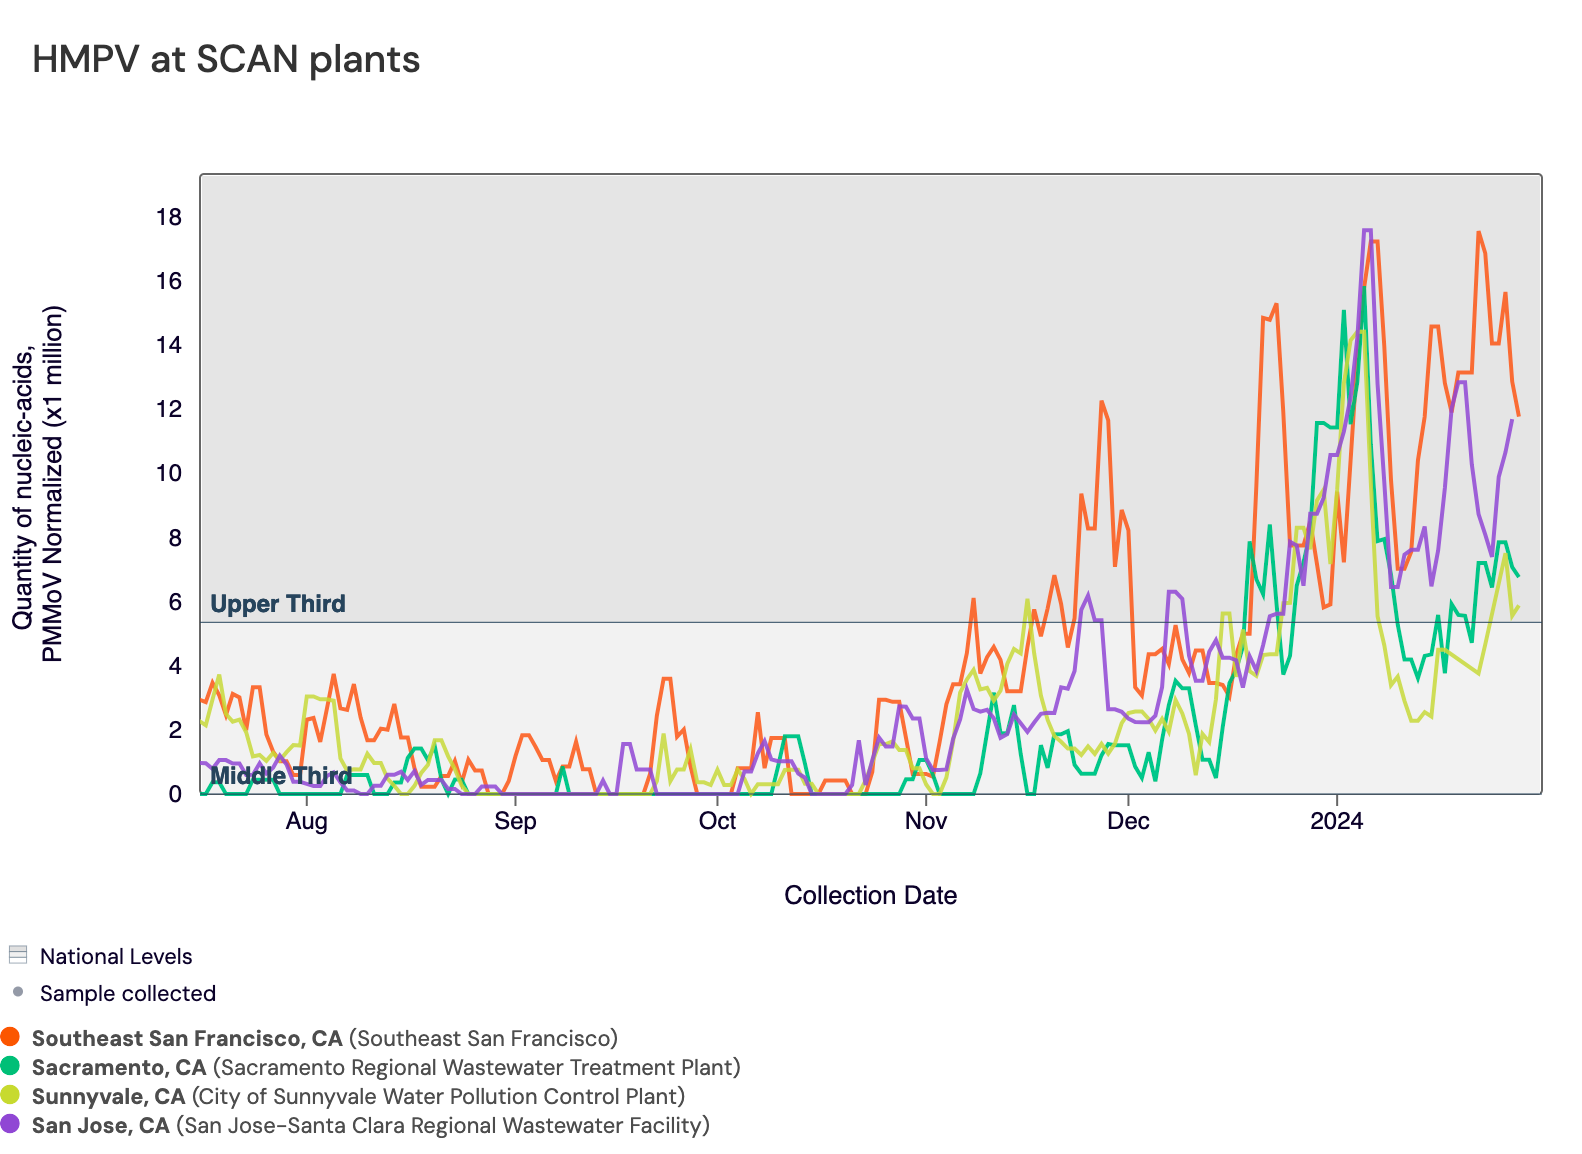
Below are the current wastewater categories for the SCAN sites (recall the category is determined by both the trend and the level):
- Palo Alto, Gilroy, Oceanside SF, and SVCW are in the LOW Wastewater Category (not in onset)
- Sunnyvale, San Jose, Sacramento, and Southeast SF are in the HIGH Wastewater Category (in onset)
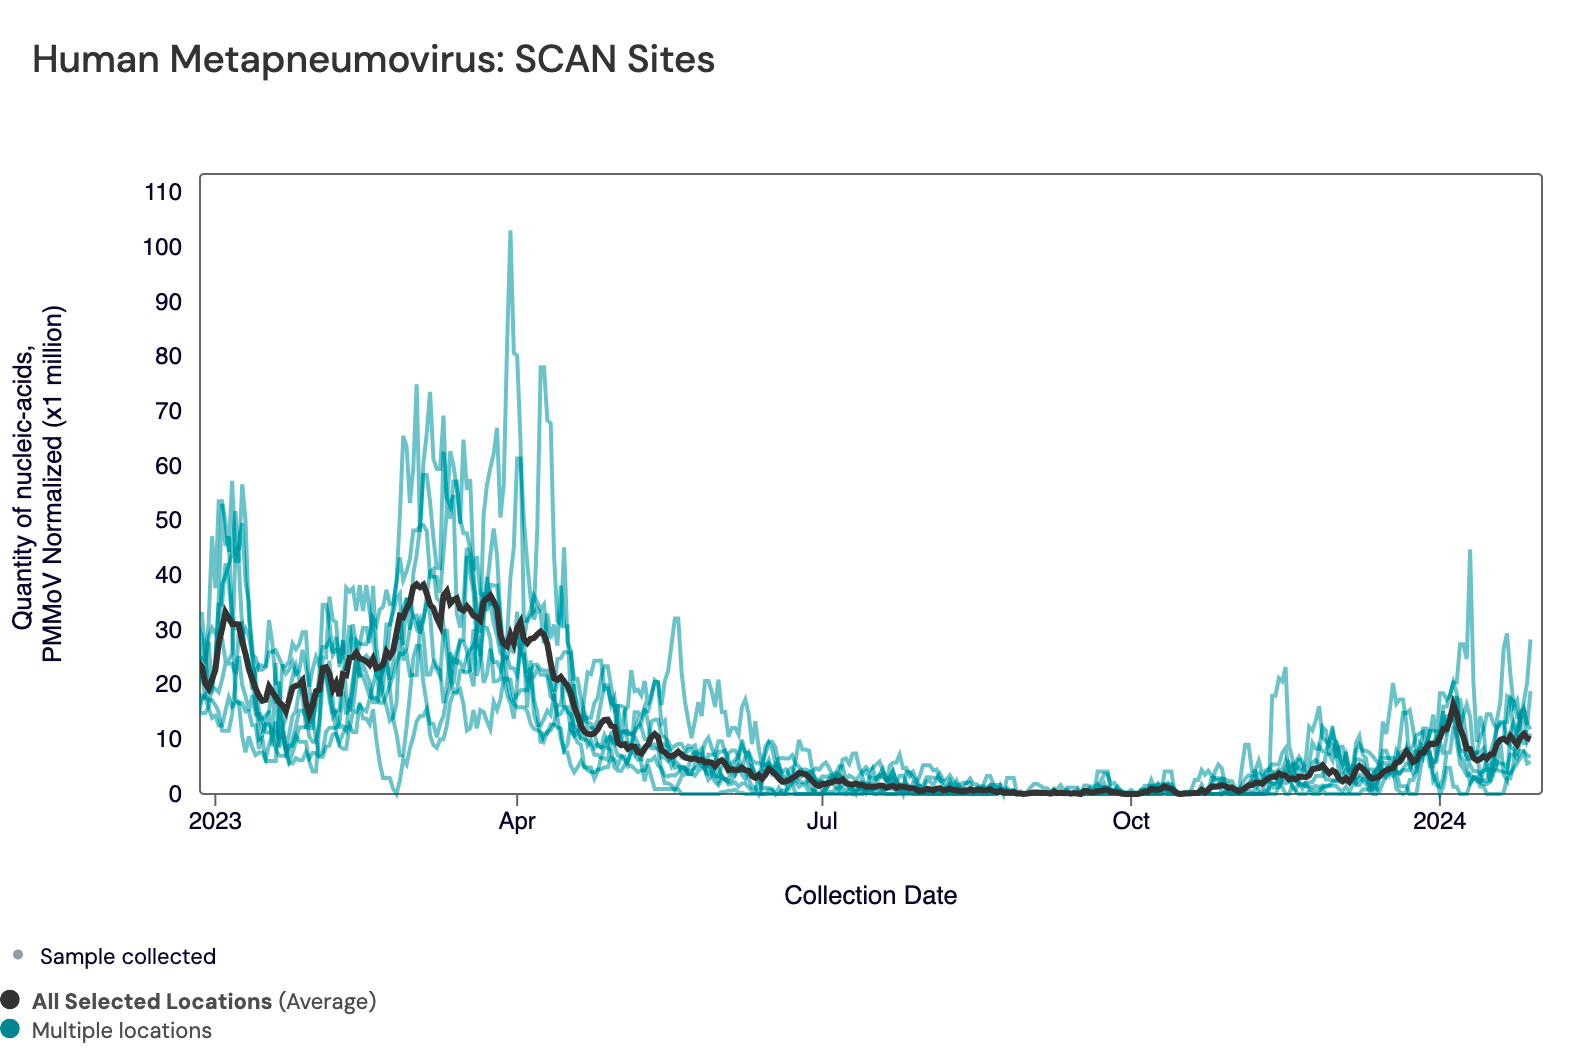
In the chart below, the population weighted average line across all the SCAN plants is shown in black (link here to this chart if you want to interact with it).
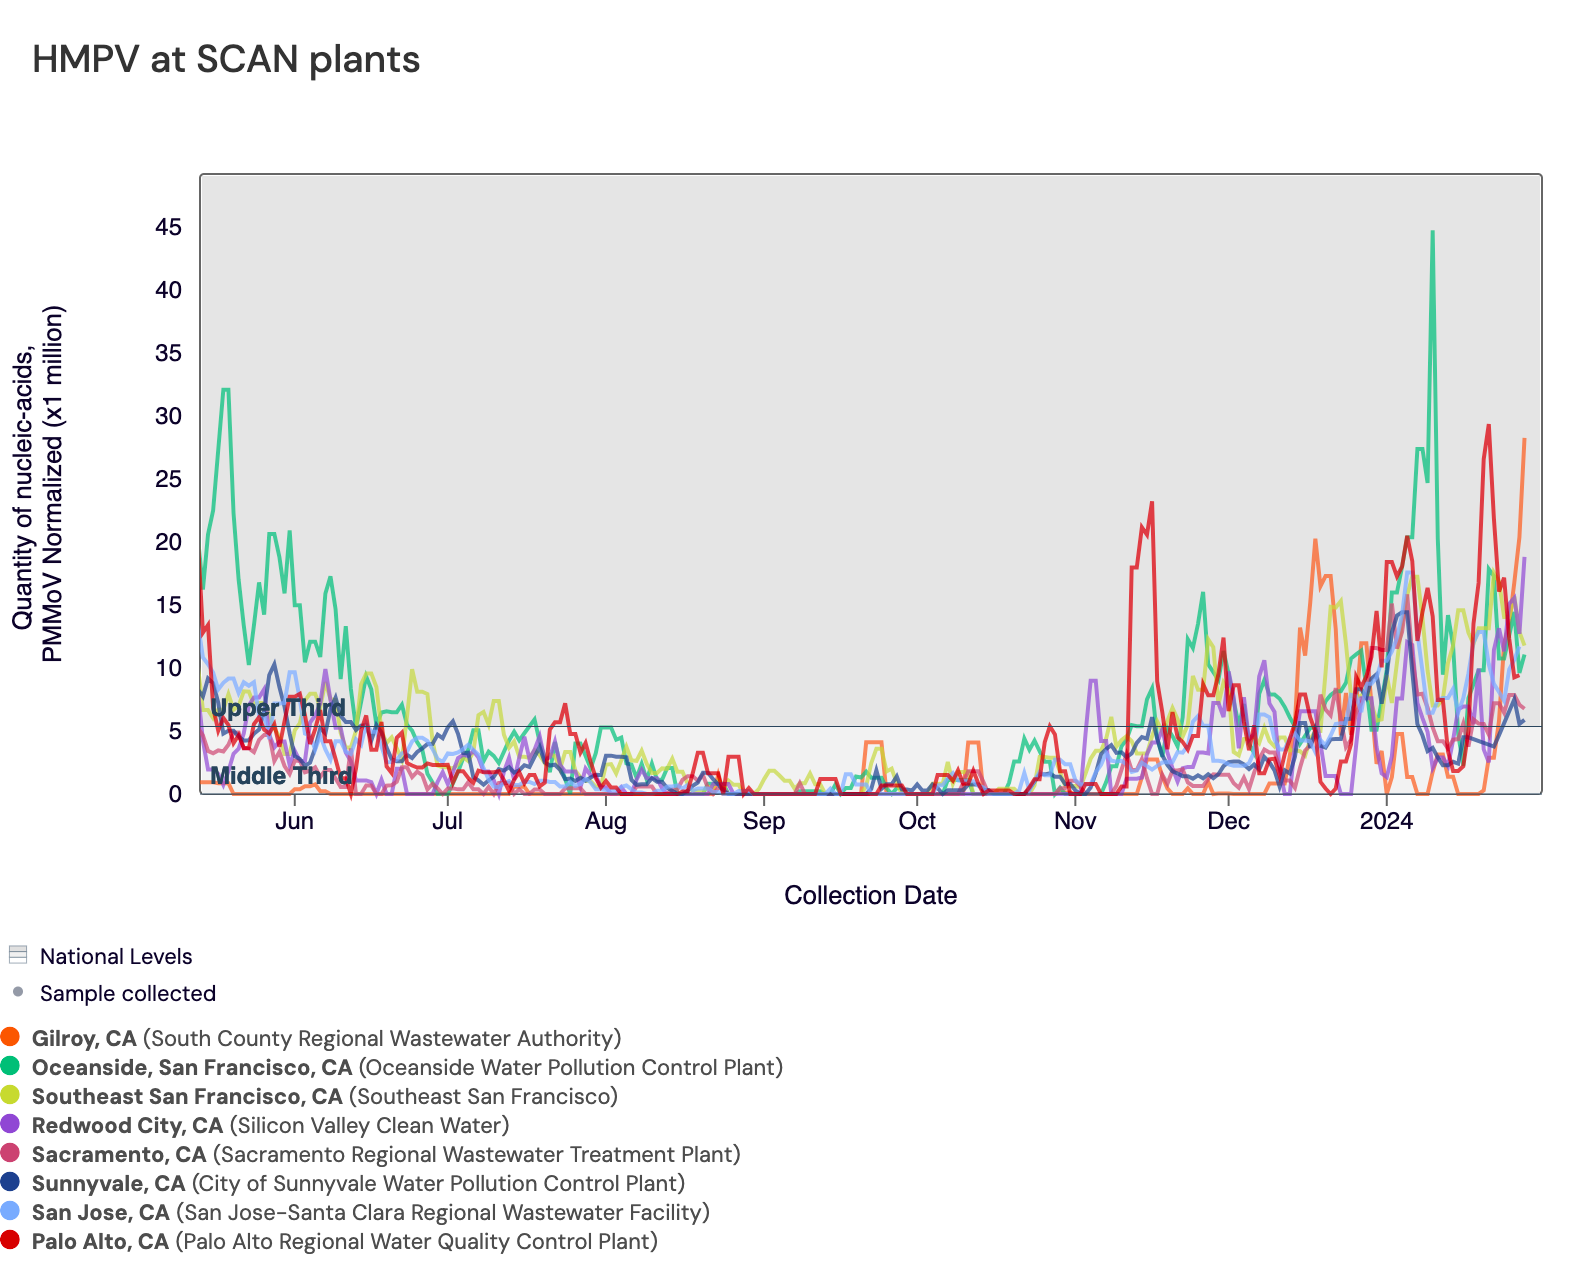
Below is a chart showing the National Levels benchmarks superimposed on the HMPV data from the SCAN sites. (You can access the chart here.) Currently, all SCAN sites have HMPV concentrations in the upper third level.
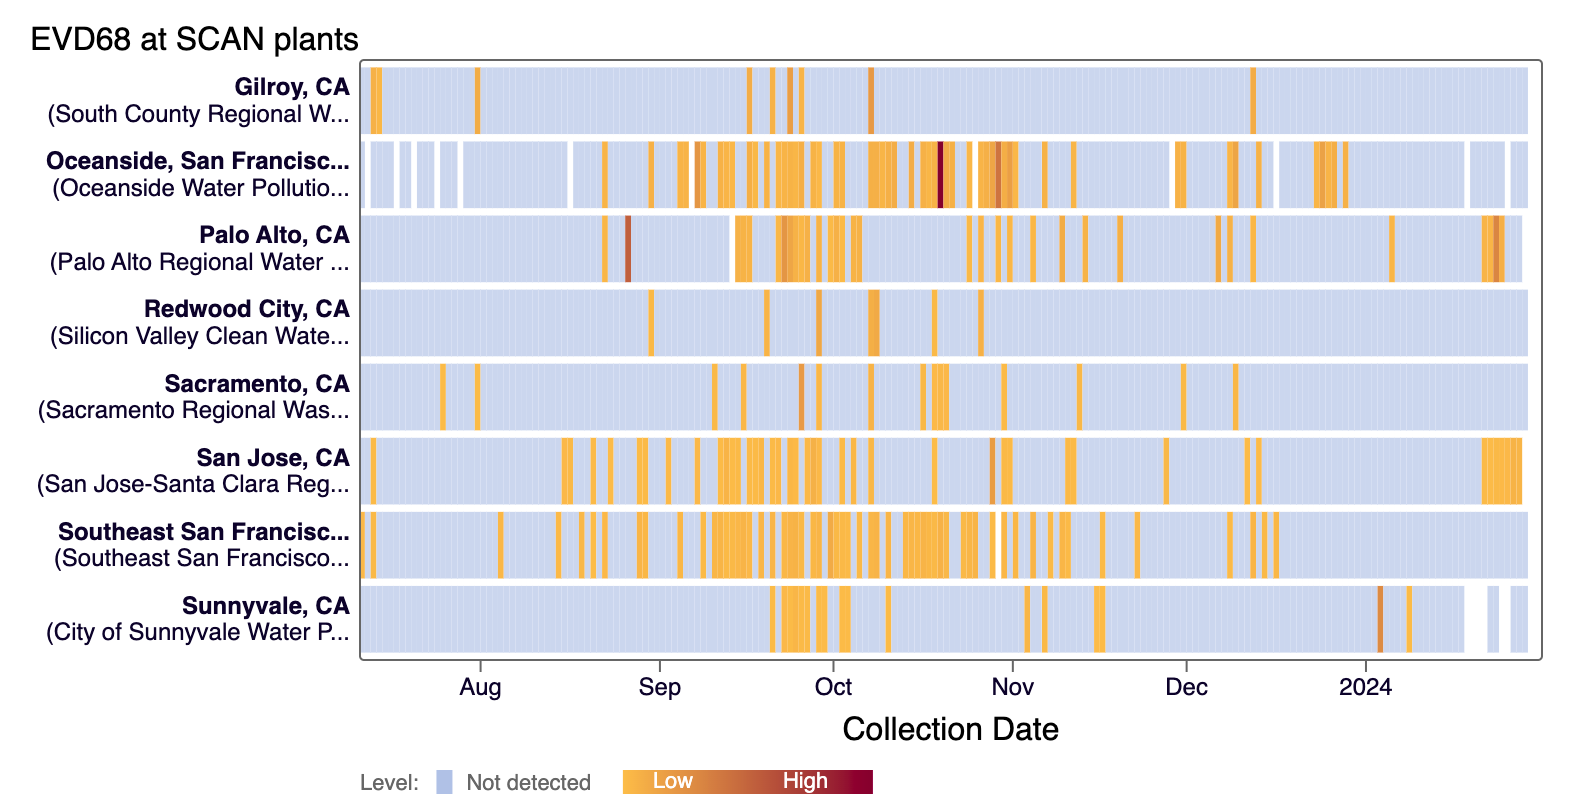
EV-D68 RNA was rarely detected in samples collected in the last 21 days at most SCAN sites, and sporadically detected at Palo Alto and San Jose. The heat map below shows all the SCAN sites as a row, and each date as a column since monitoring began in July. The color blue means the sample was non-detect for EV-D68 RNA and the colors get darker with higher concentrations. White indicates no sample was collected. You can access the chart here.
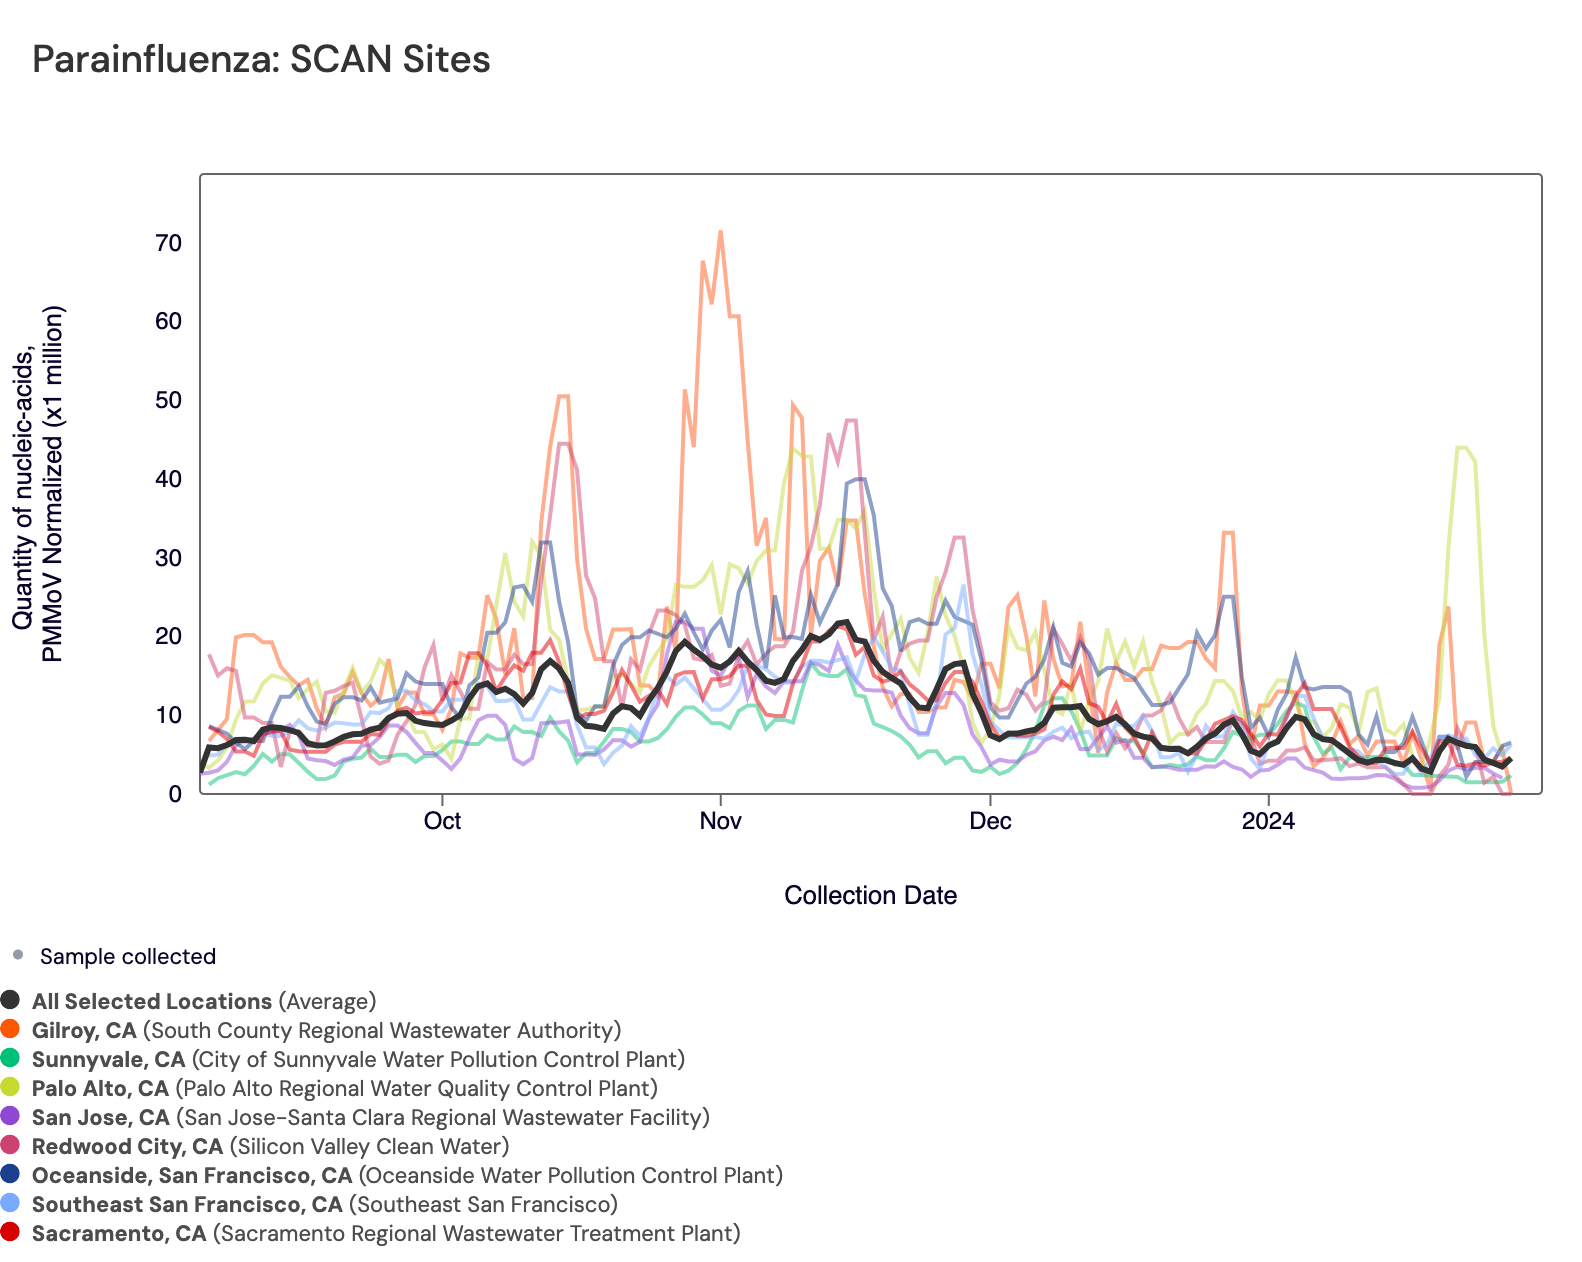
Parainfluenza RNA has been detected in most samples collected from SCAN sites. The population weighted average across SCAN sites is shown in black. You can access the chart here.
Gastrointestinal Targets
Norovirus GII and Rotavirus
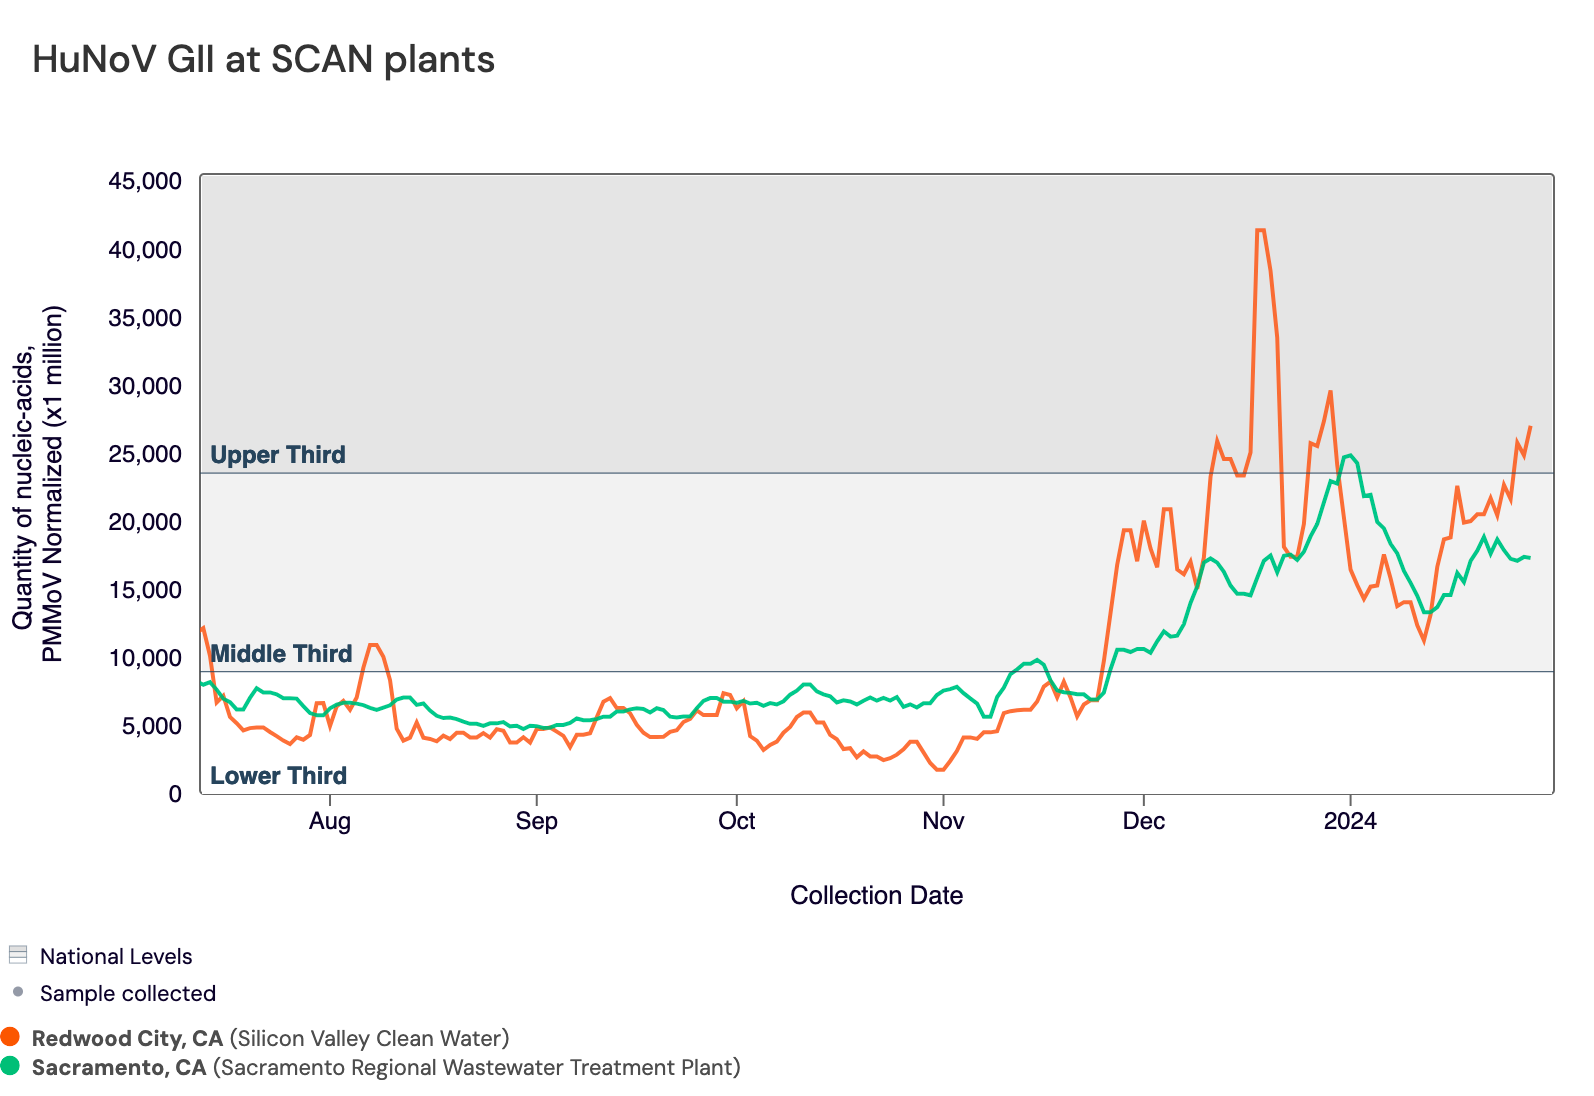
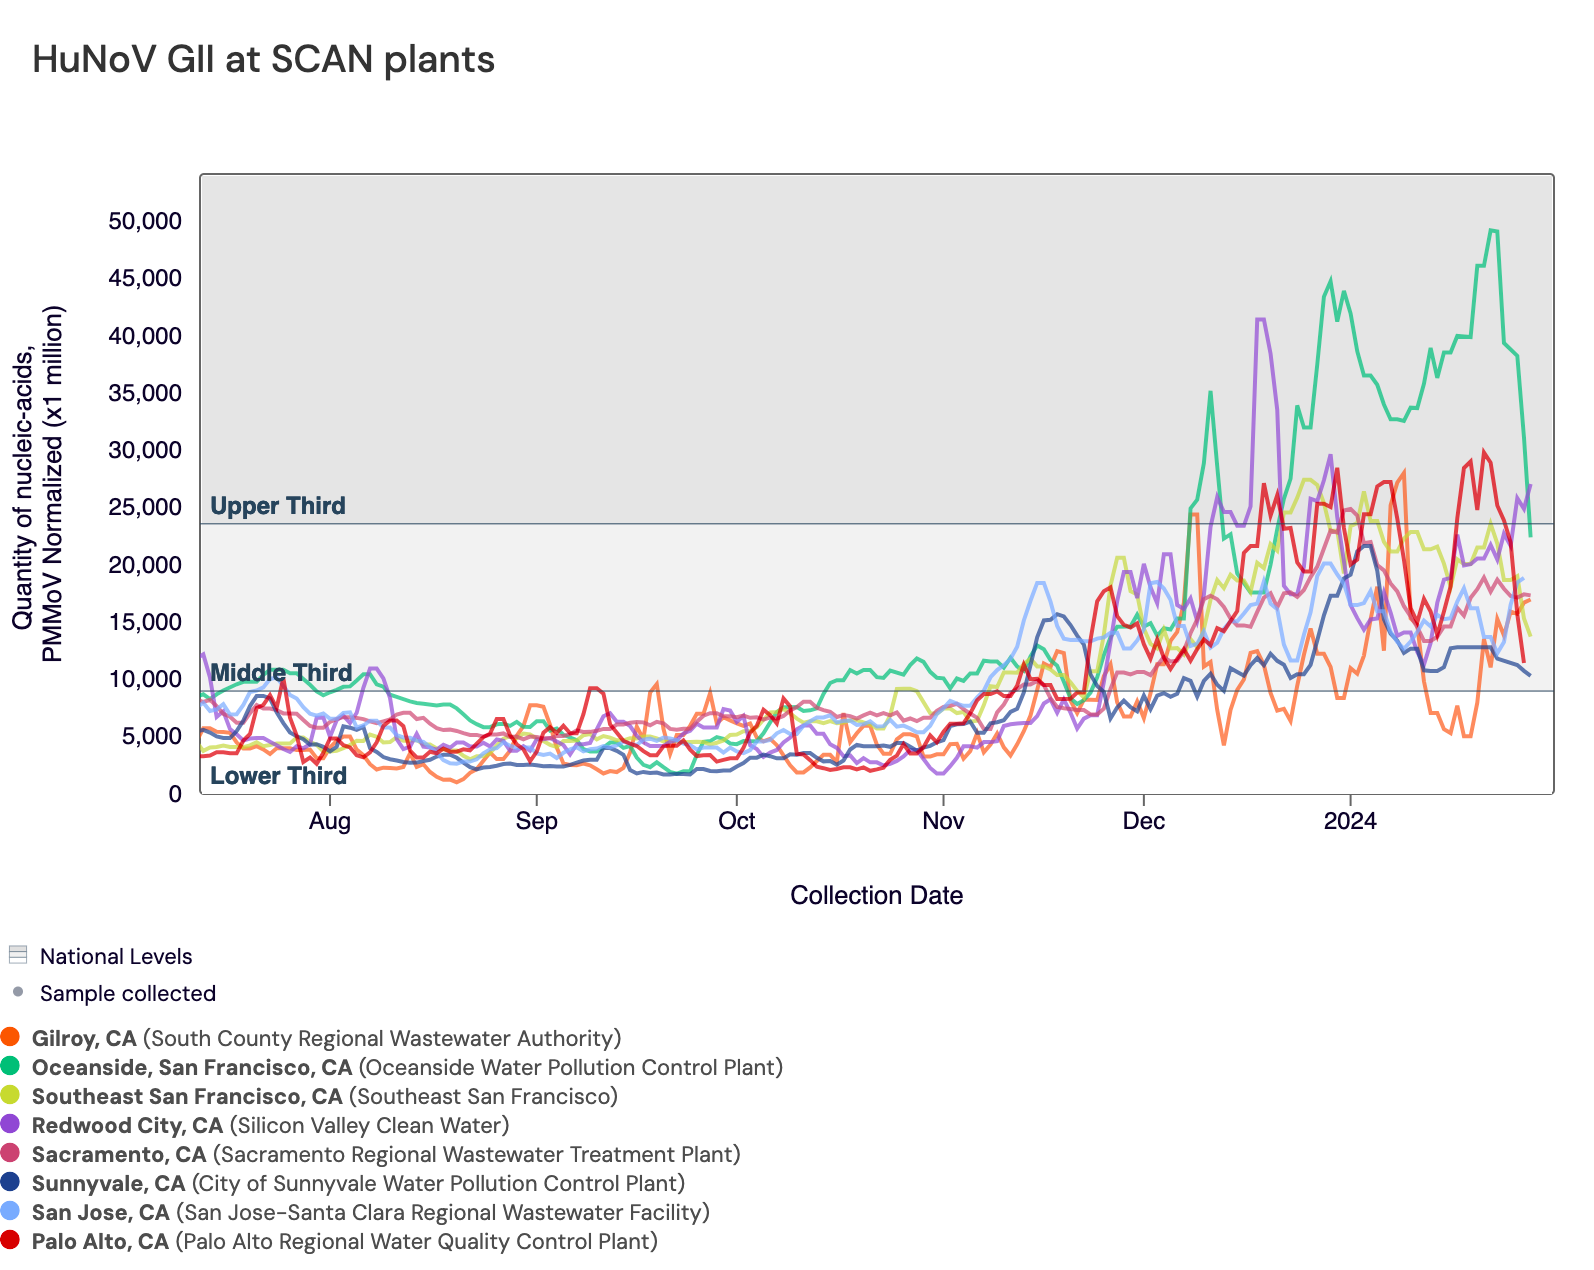
Norovirus GII RNA is commonly detected at all sites. In the chart below, the National Levels benchmarks are superimposed on the the Norovirus concentrations at Sacramento and SVCW since August.
Below are the current Norovirus wastewater categories for the SCAN sites (recall the category is determined by both the trend and the level):
- Southeast SF, Palo Alto, Sunnyvale, Oceanside SF, Gilroy, and San Jose are in the MEDIUM Wastewater Category
- Sacramento and SVCW are in the HIGH Wastewater Category
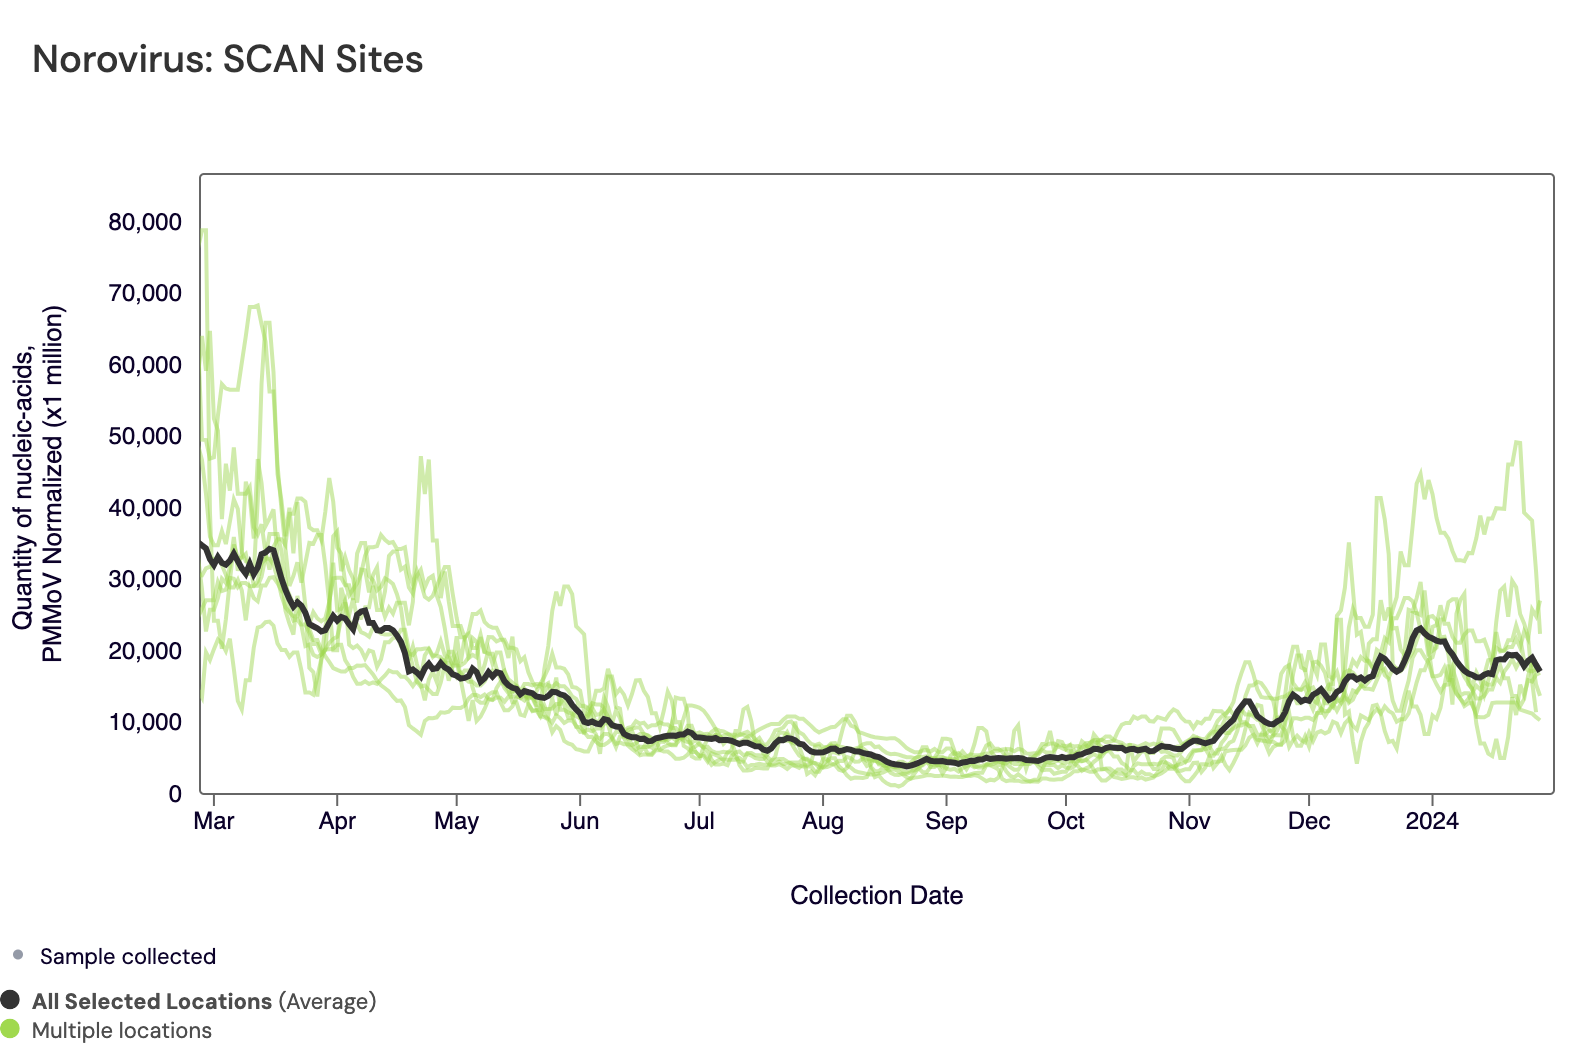
The plot below shows the Norovirus concentrations at the SCAN sites. The population weighted average line is shown in black. You can interact with the chart of all the plants at this link.
Below is a chart showing the National Levels benchmarks superimposed on the Norovirus concentrations from the SCAN sites. (You can access the chart here.) Currently, SVCW is in the upper third tier and all other SCAN sites have Norovirus concentrations in the middle third tier.
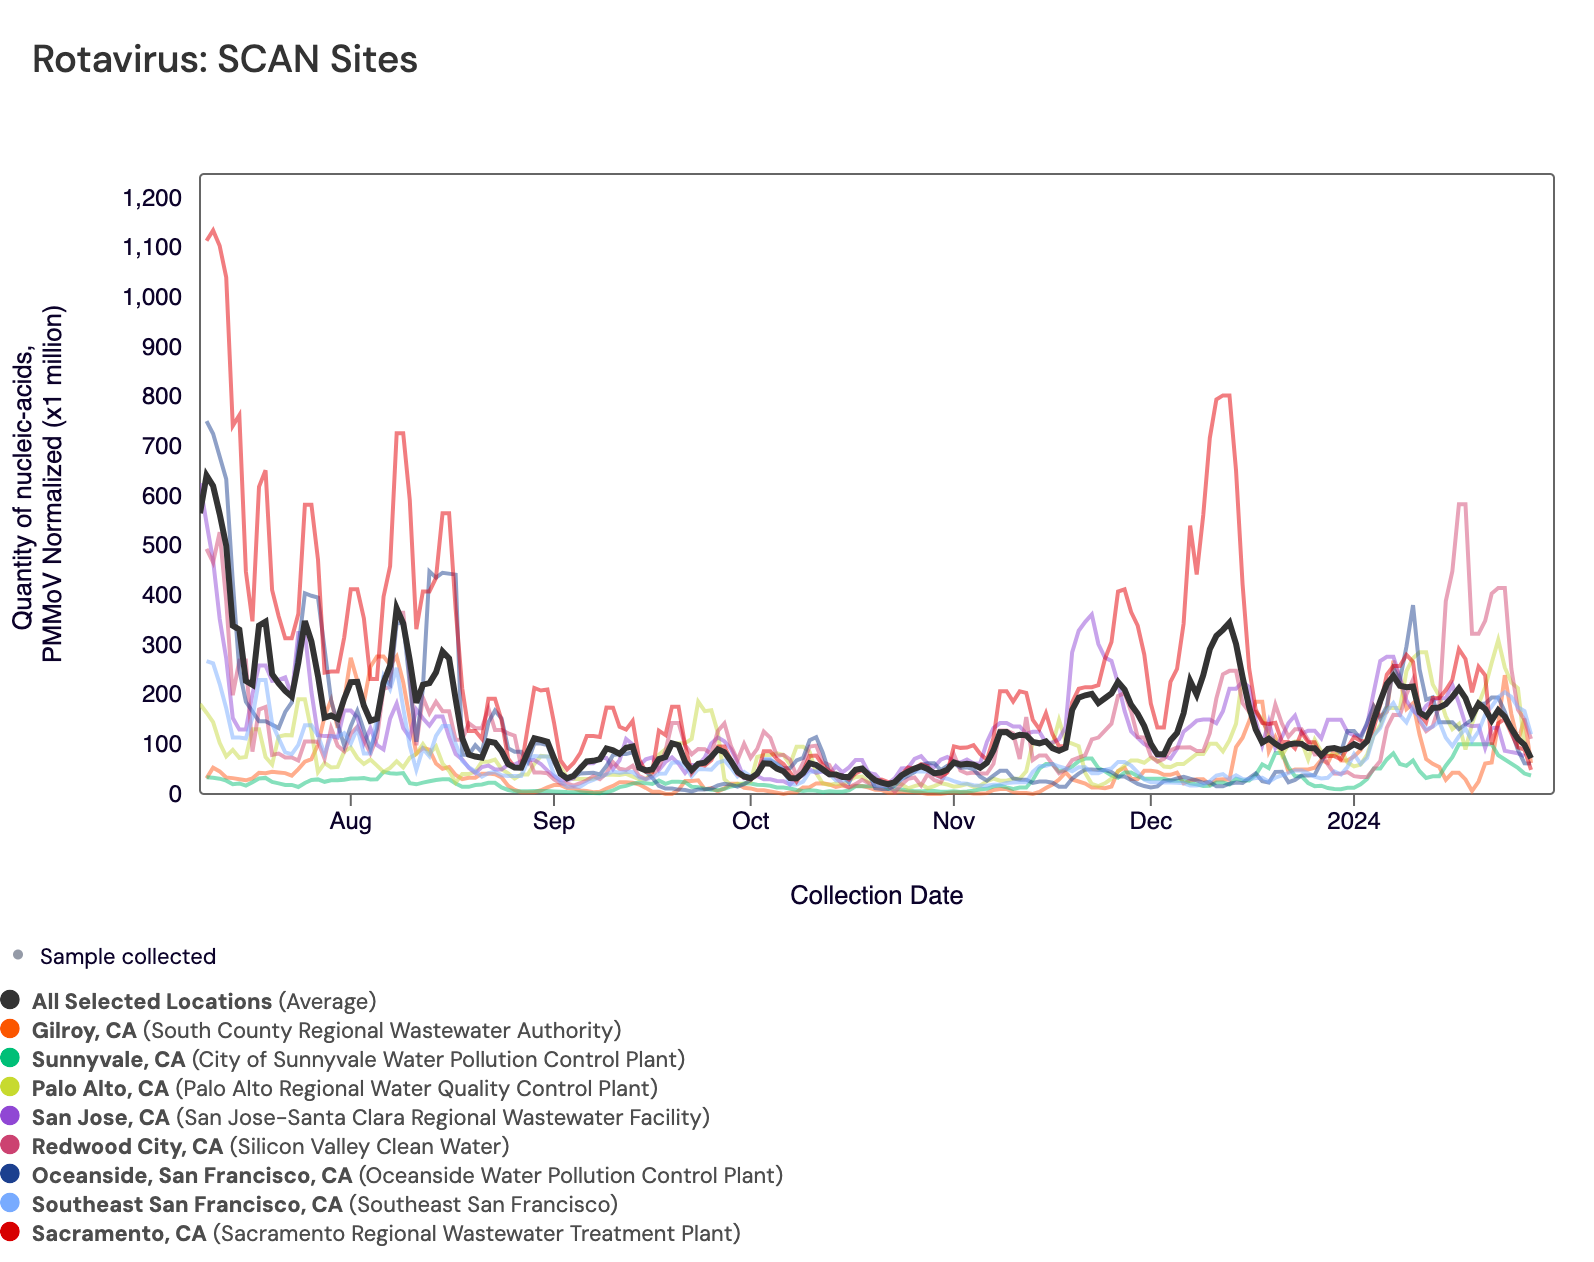
Rotavirus RNA concentrations are shown in the chart below; all the SCAN plants are shown together. The population weighted average line is shown in black. You can interact with the chart of all the plants here.
Other Pathogens of Concern
Mpox, Candida auris, and Hepatitis A
Mpox DNA was rarely detected in samples collected in the last 21 days at all SCAN sites. The heat map below shows all the SCAN sites as a row, and each date as a column since July 2022. The color blue means that MPXV DNA was not detected in the sample, and the dark purple color means it was detected. White indicates no sample was collected. The chart shows all the data we have collected. You can access the chart here.
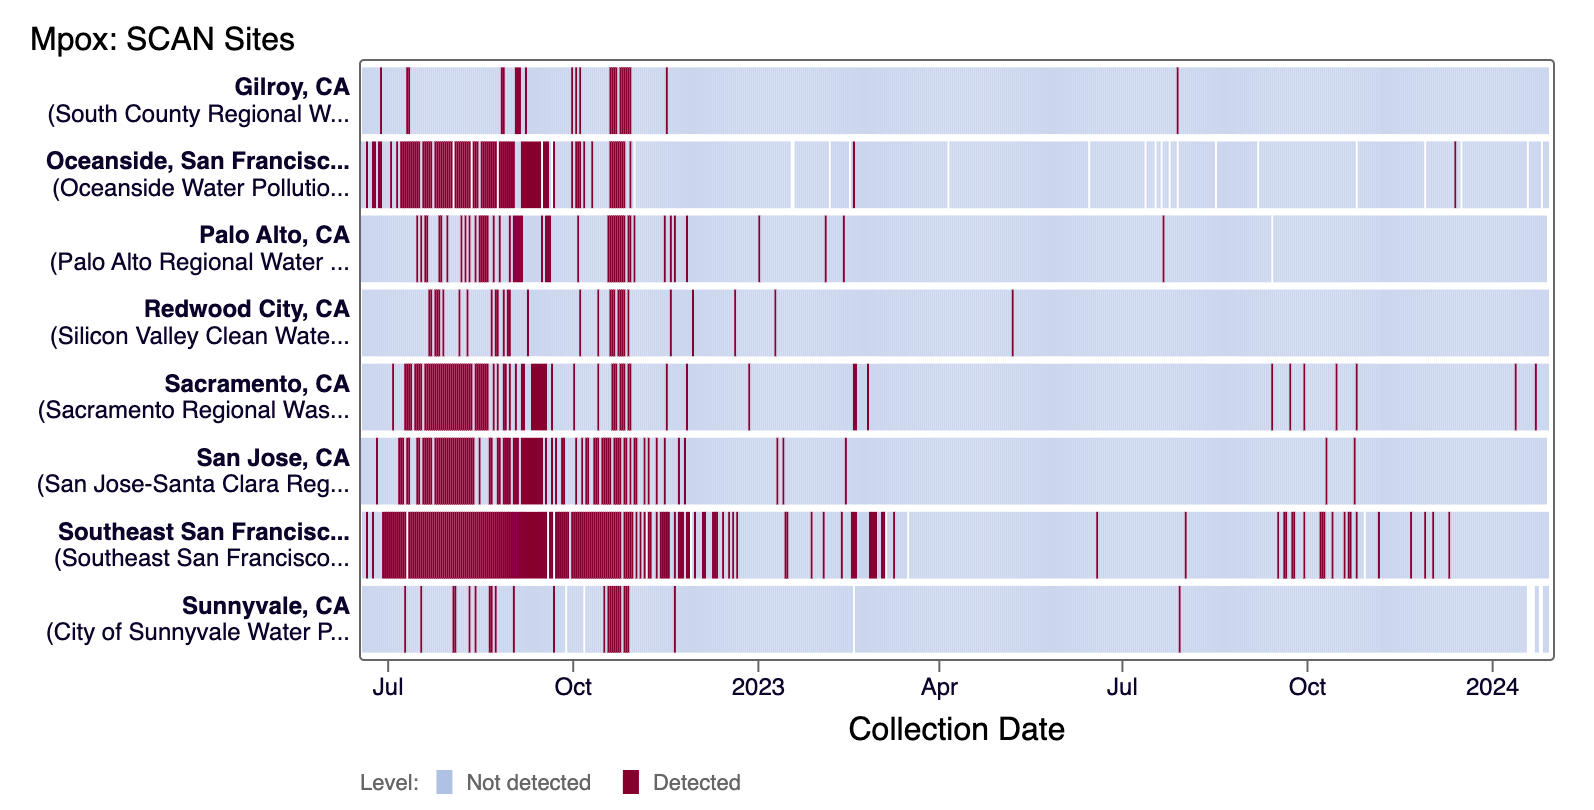
Currently all SCAN sites are in the 'LOW' category for Mpox
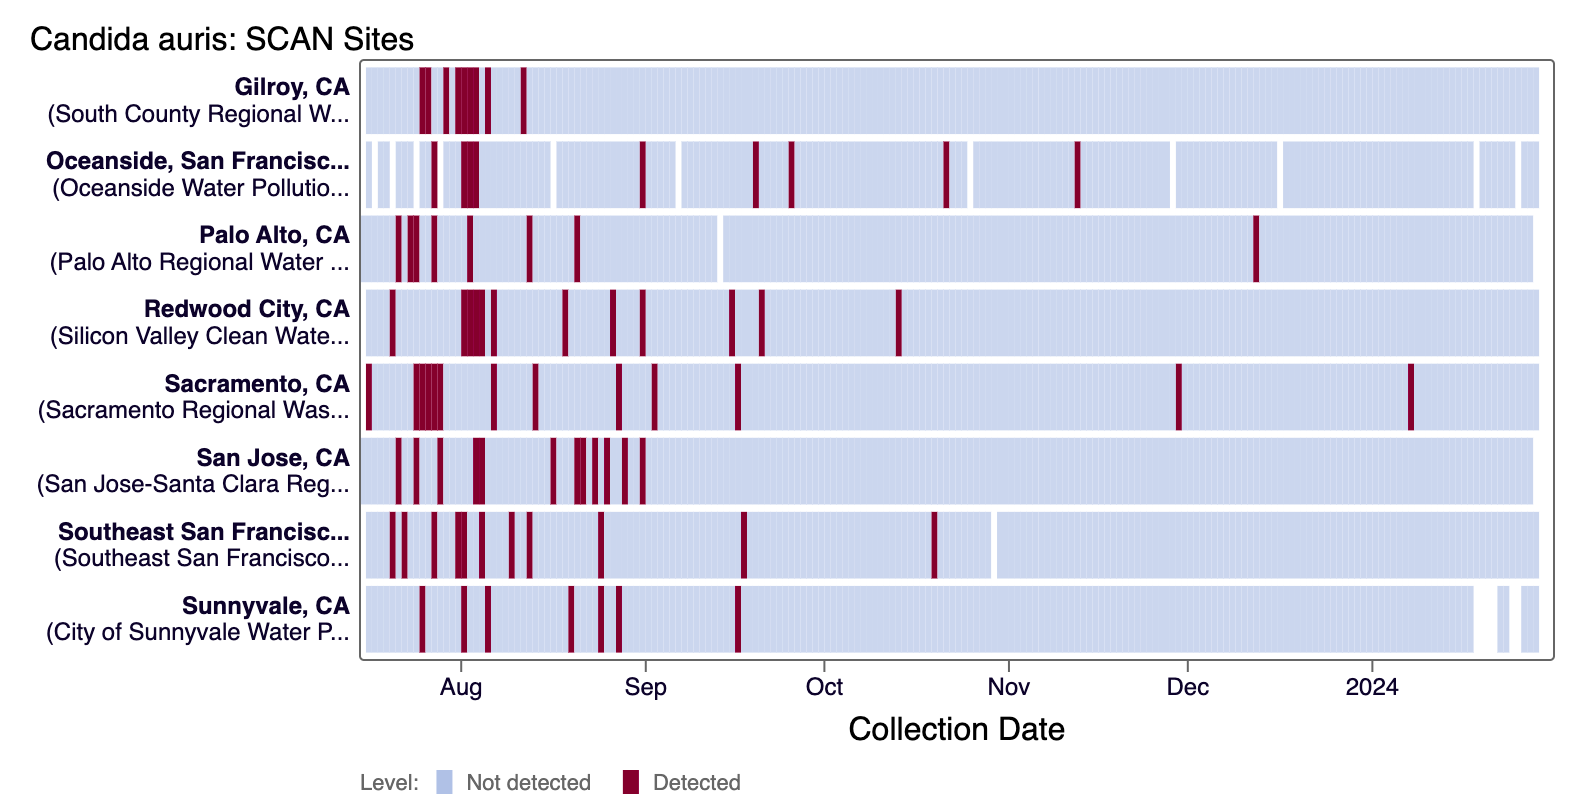
Candida auris DNA was rarely detected in the last 21 days at all SCAN sites. The heat map below shows all the SCAN sites as a row, and each date as a column for all data collected since monitoring began in July. The color blue means that Candida auris DNA was not detected in the sample, and the dark purple color means it was detected. White indicates no sample was collected. You can access the chart here.
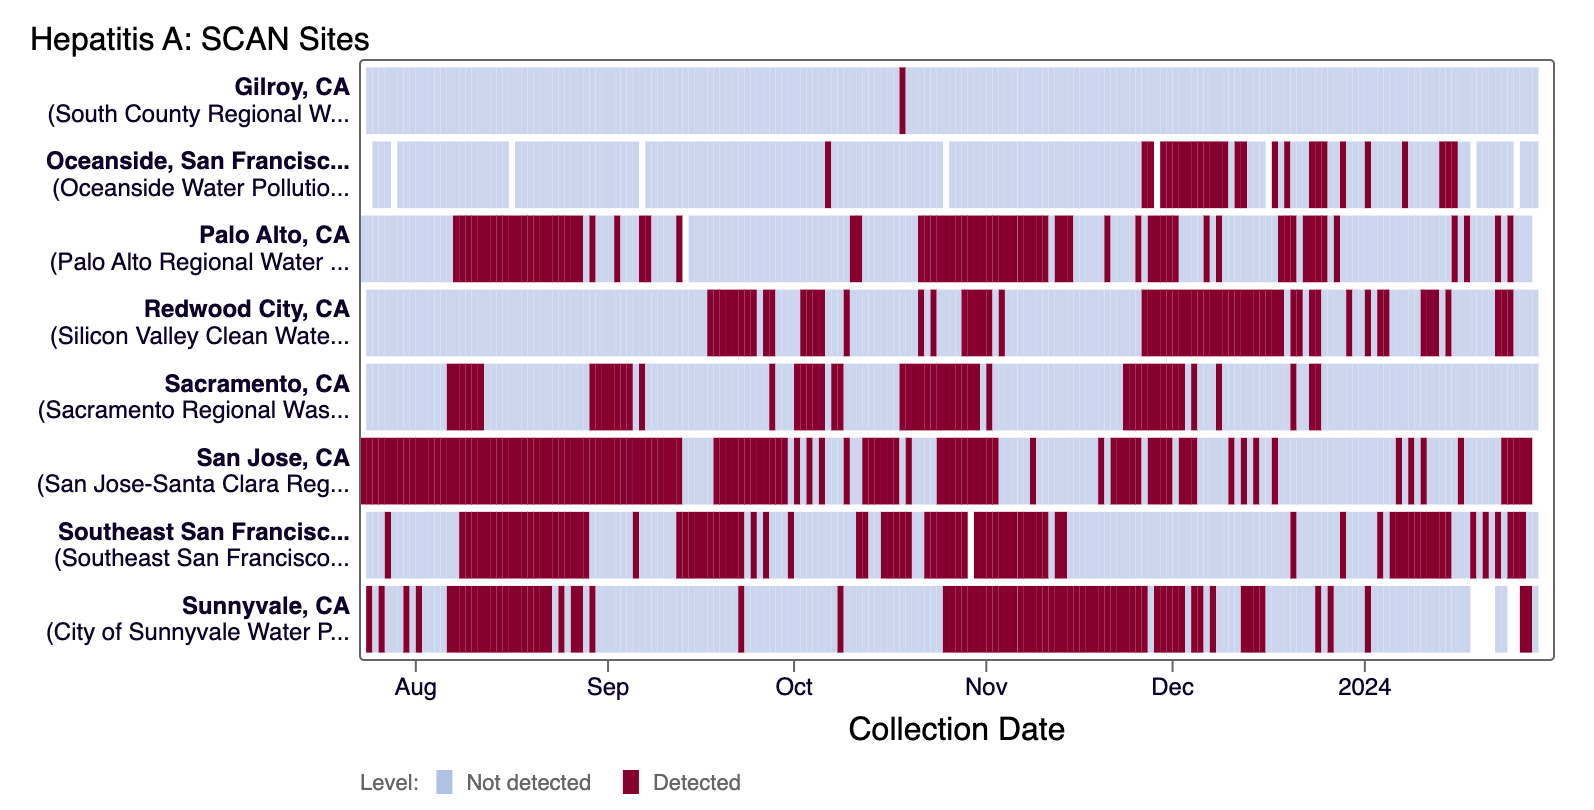
Hepatitis A RNA was detected sporadically at most SCAN sites and was rarely detected at Gilroy, Sacramento, and Sunnyvale in the last 21 days. The heat map below shows all the SCAN sites as a row, and each date as a column for all data collected since monitoring began in July. The color blue means that Hepatitis A RNA was not detected in the sample, and the dark purple color means it was detected. White indicates no sample was collected. You can access the chart here.