Bay Area SCAN weekly update 1/6/23
All samples picked up by the couriers as of 1/5/23 have been processed and their data are on the site: wbe.stanford.edu.
Note that the website changed in that now all non-SARS-CoV-2 pathogens can be found on one page with more control over the visualizations. Check it out here.
COVID-19
SARS-CoV-2 and variants
COVID-19
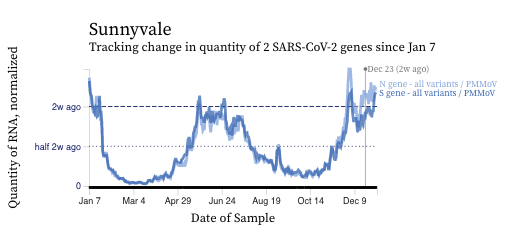
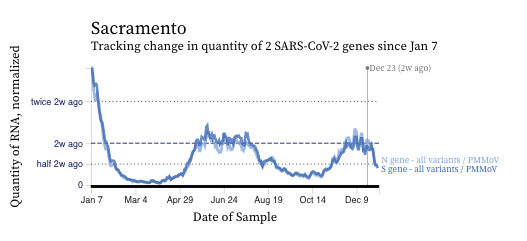
There continue to be different trends in SARS-CoV-2 RNA among the plants over the last two weeks. In some locations concentrations are steady, falling, or rising. An example of a plant with steady levels is Sunnyvale, an example of decreasing levels is Sacramento, and an example with rising levels is Davis. In general, concentrations are still similar to what they were in the last BA.2/BA.5 surge.
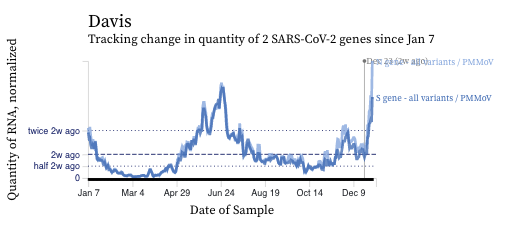
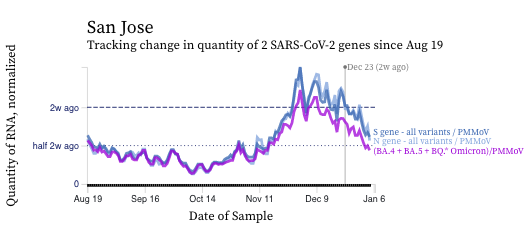
The HV69-70 mutation present in BA.5 and B.Q* sublineages is still present in the majority of circulating SARS-CoV-2 found in wastewater. But you can see that the concentrations of the mutation (in purple below) are now lower than the N and S gene concentrations suggesting a variant without the mutation is gaining traction in the communities.
The ratio of HV69-70/N has been slowly decreasing across the plants as shown in this chart of the HV69-70/N ratio over time at all the plants below. If the ratio is at 100%, it suggests that all the SARS-CoV-2 genomes have the mutation (and we infer that all genomes are from BA.5 or BQ.*). The grey symbols are from all the plants in SCAN (you can access the plot and play around with it here). The current regional ratio of HV69-70/N appears to be about 65%, lower than last week.
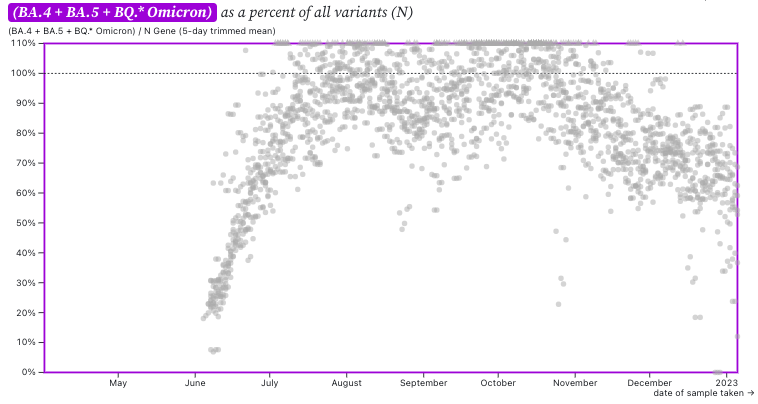
This suggests ~35% of circulating SARS-CoV-2 in wastewater does not have the HV69-70 mutation. XBB and BA.2.75 are among circulating variants that do not have the mutation. The CDC variant tracker nowcast for our region (HHS region 9) predicts that nearly 32% of circulating variants for this week (ending 1/7/23) are XBB and XBB1.5 and if this is indeed true in our area, then this would explain the observed decreases in the ratio.
Unfortunately, we do not have wastewater sequencing data this week again due to supply chain issues during the holidays, but hope to have 3 weeks worth of data to report on next week. We fully expect these sequencing data will corroborate the ratio data and show that XBB is present in growing proportions in the wastewater. We do not have a good targeted assay for XBB; since it represents a recombinant virus, the assays we have tested so far have cross-reacted with the parental strains.
Other respiratory viruses
IAV, IBV, RSV, and HMPV
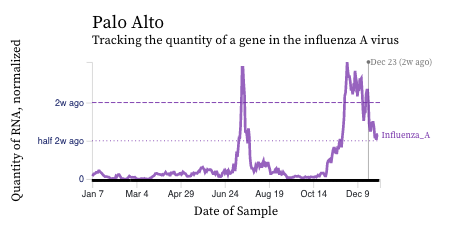
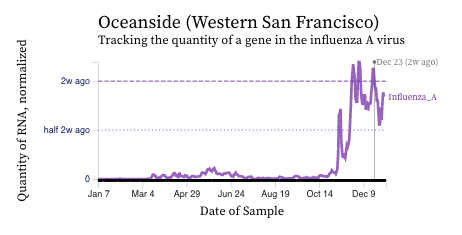
Influenza A (IAV) RNA concentrations continue to drop across the plants over the last week suggesting contributions from infected individuals into the wastewater are also declining. The exceptions, again this week, are the plants in San Francisco County where the concentrations have been steady for the last two weeks.
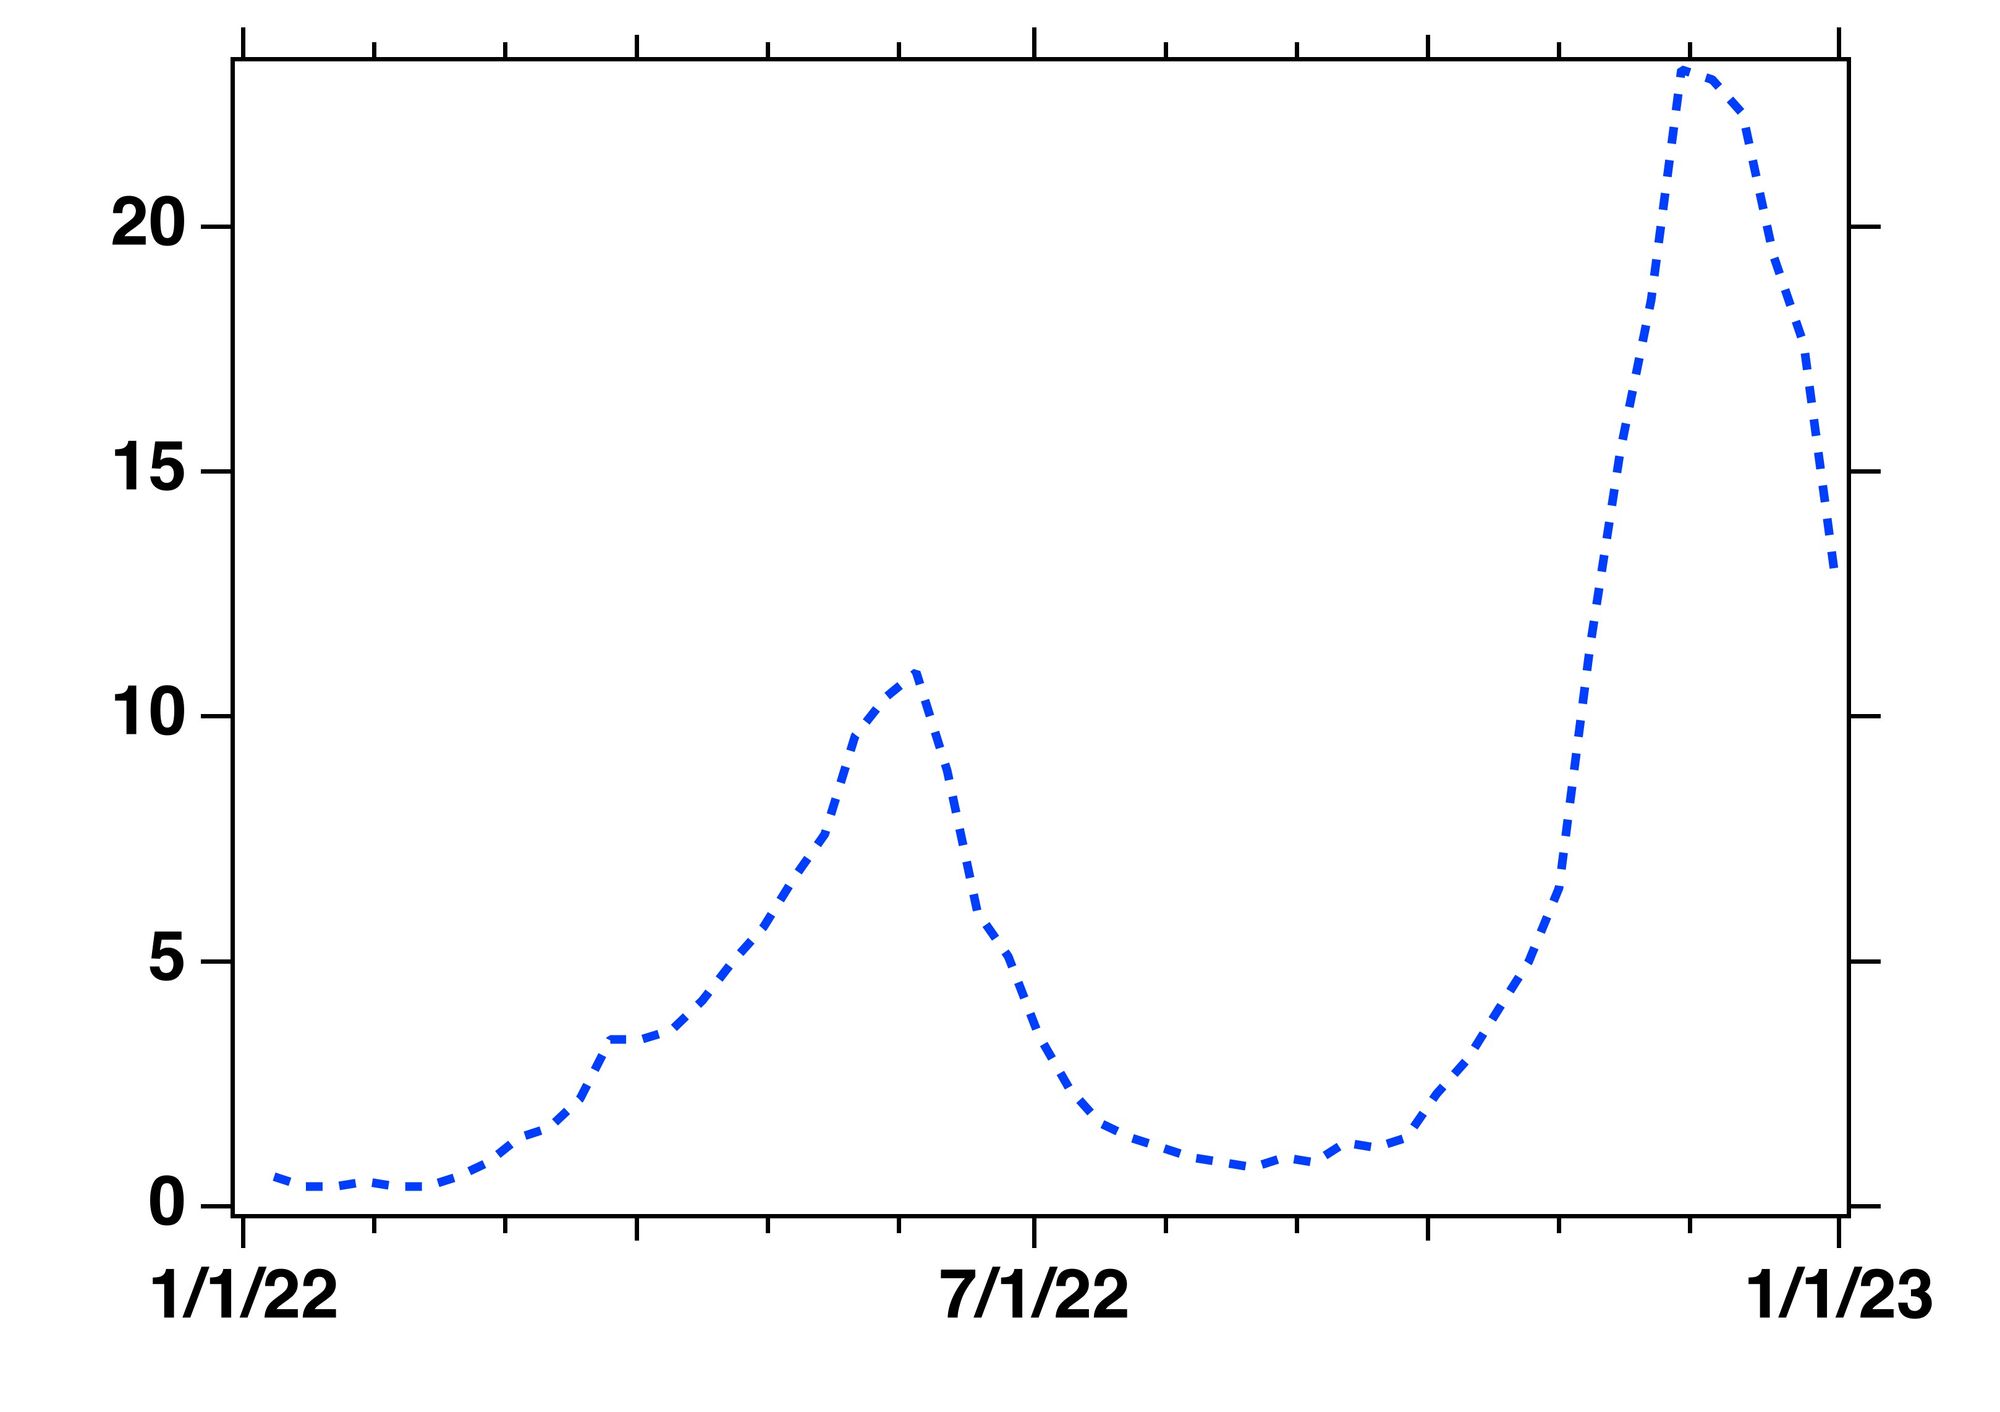
We look at the positivity rates across the State of California for influenza from the CDPH website which are updated on a weekly basis (see chart below). The most recent data are for the week ending of 12/31/22. Note that these data are aggregated across the state and there are likely regional differences in positivity rates and disease occurrence not captured by these data.
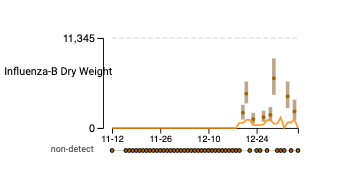
Influenza B (IBV) RNA concentrations are non-detect in most samples over the approximate 7 weeks we have been measuring it. When it is detected, it is mostly at quite low concentrations. We detect it the most often at Palo Alto, San Jose, Sunnyvale, and the two San Francisco plants. Example data from Oceanside are below from the drill down page (here). The units on the y-axis are copies per gram dry weight of solids.
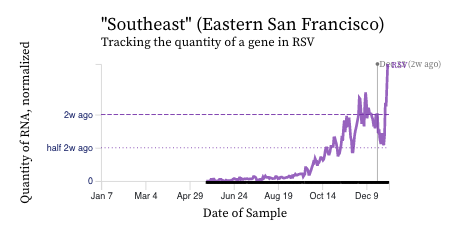
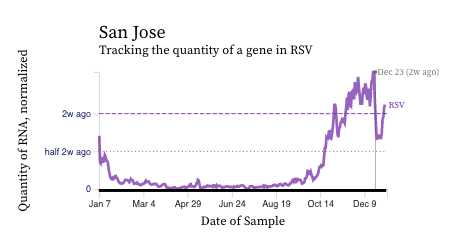
RSV RNA concentrations are falling at most plants, but we do see an uptick over the last week at some plants, perhaps due to the holiday gathering. See examples from Southeast and San Jose below showing the recent uptick.
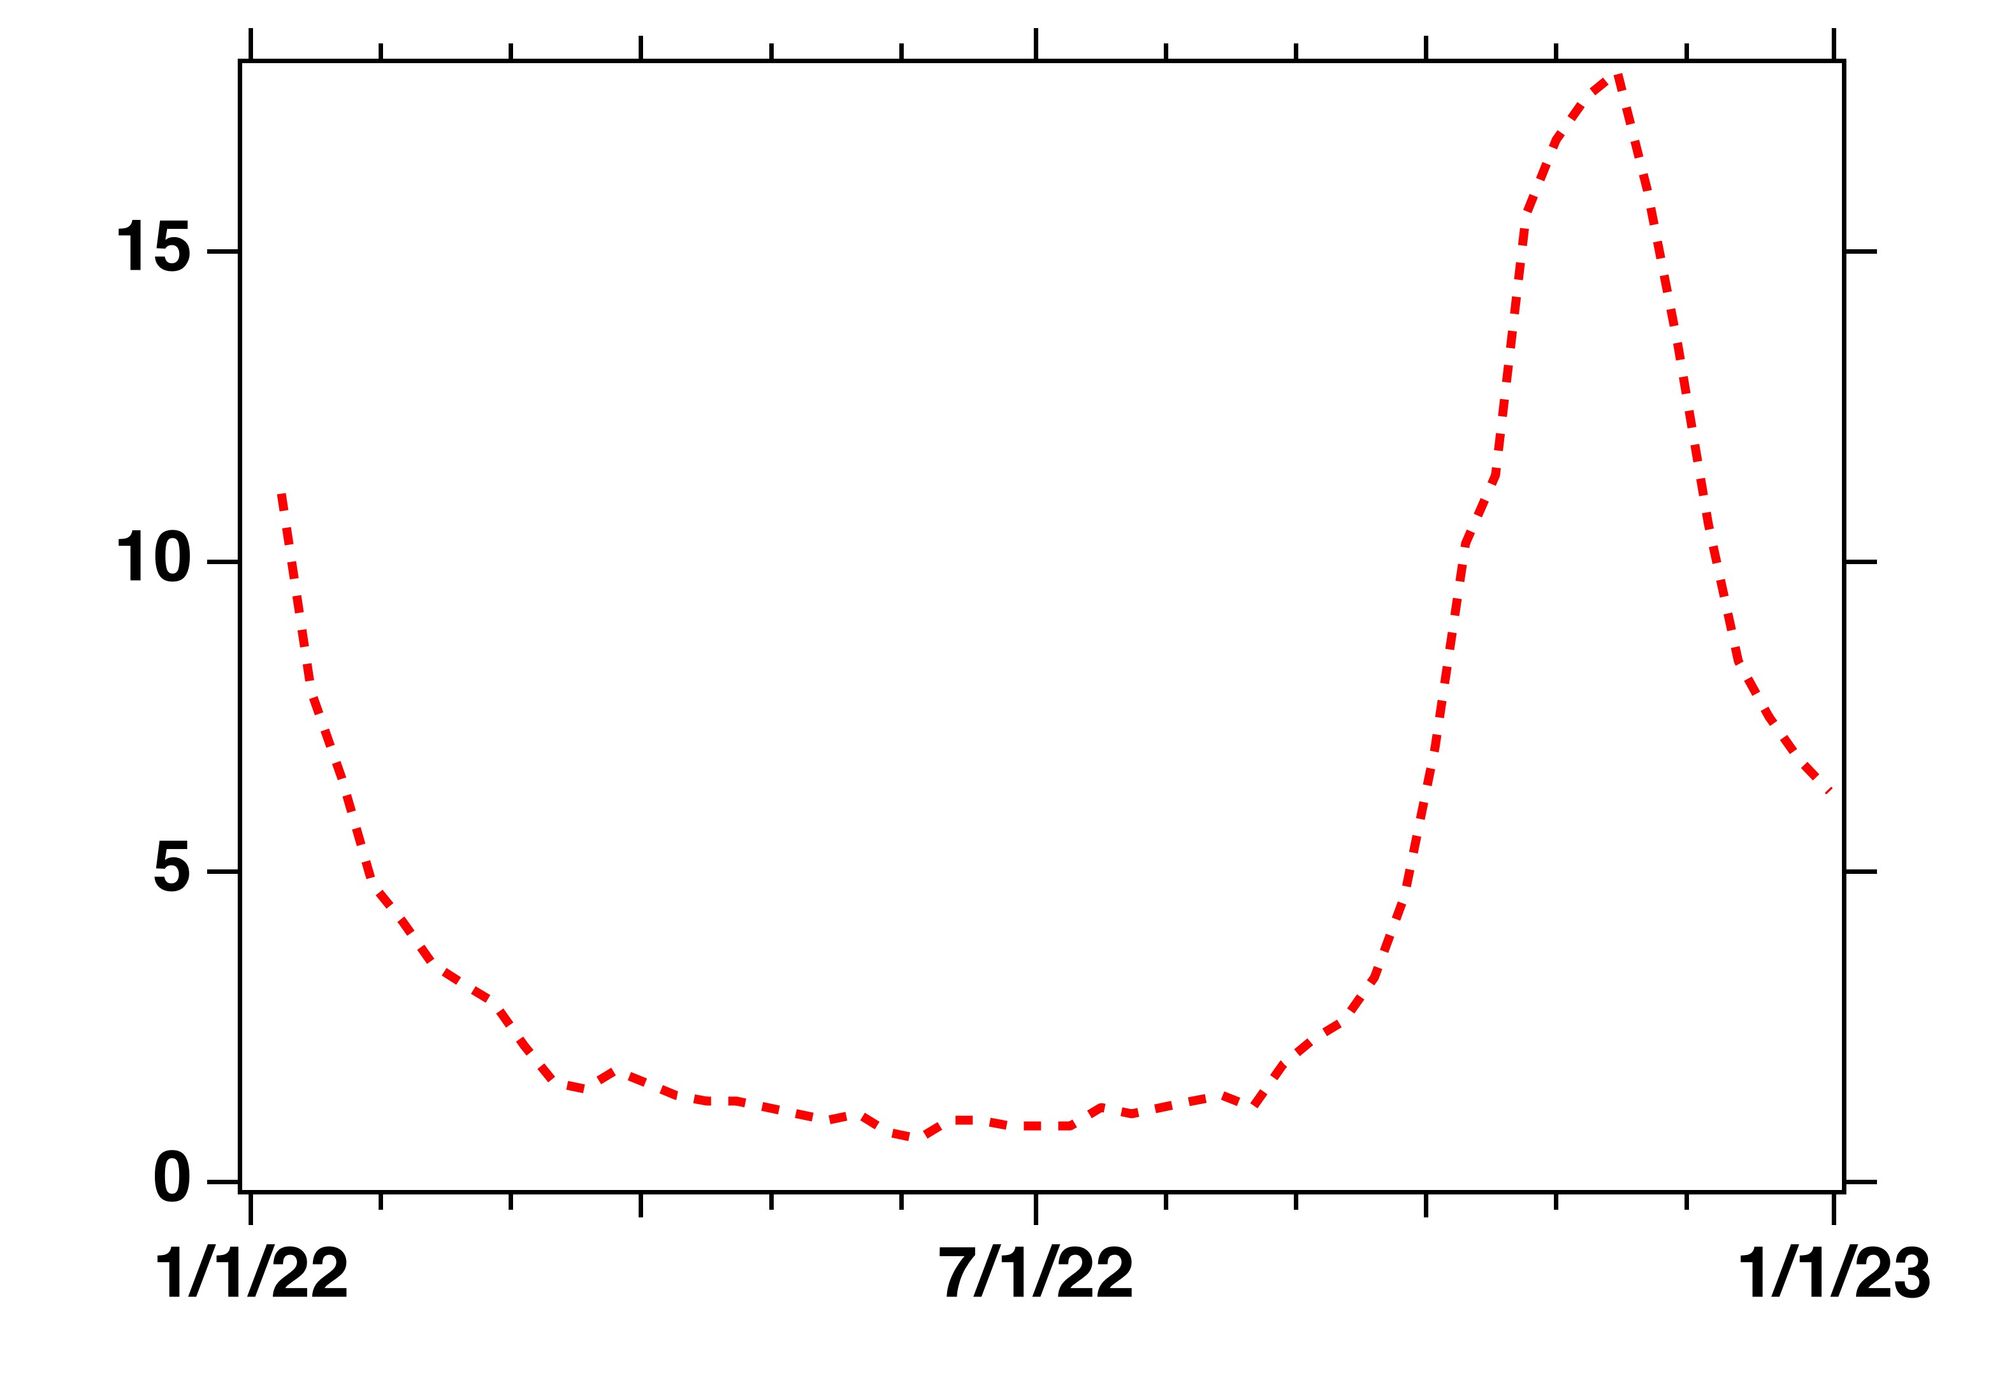
Here is a chart of the weekly RSV positivity rate data across the entire state of California from the CDPH website, also showing a recent decline in RSV case positivity. The most recent data are for the week ending 12/31/22. Note that these data are aggregated across the state and there are likely regional differences in positivity rates and disease occurrence not captured by these data.
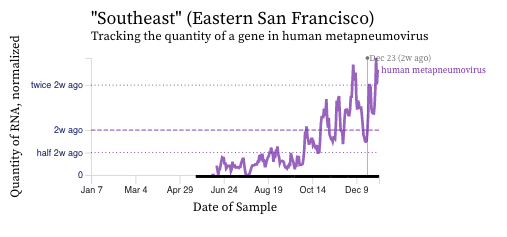
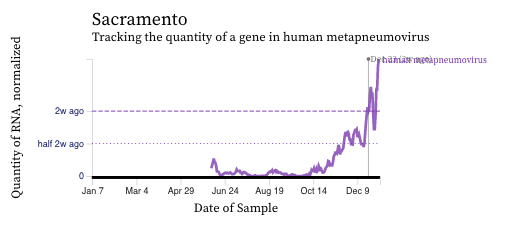
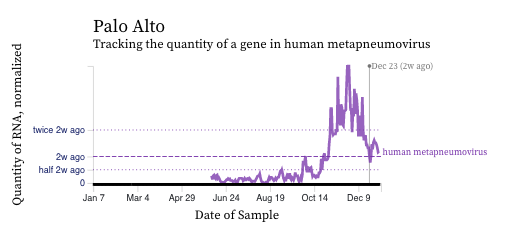
HMPV (human metapneumovirus) RNA concentrations have a diversity in trends over the last two weeks across the plants from strongly increasing (Southeast and Sacramento) to strongly decreasing (Palo Alto).
Norovirus
Assay detects human norovirus GII
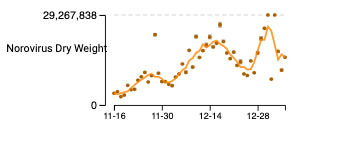
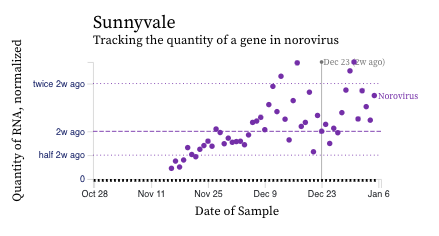
Norovirus GII RNA concentrations have been measured for about 7 weeks now at all the SCAN plants. We have observed concentrations between 10^3 cp/g and 10^9 cp/g. Data appear to be hovering near high levels; trends are mixed across plants. Here is an example from the drill down page for Sunnyvale. The concentrations on the y-axis are on a linear scale and are in units of copies per gram dry weight. Another example from the non-COVID page on the website (here) is shown for Sunnyvale (same plant). Note that the assay we use targets human norovirus GII which is a common genotype of norovirus, but GI can also circulate.
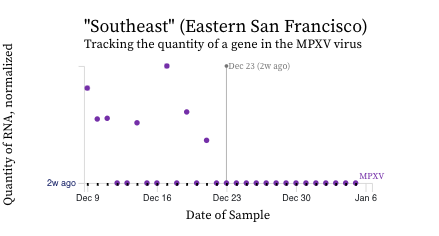
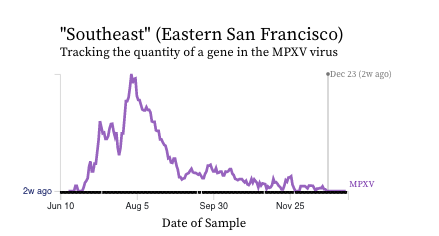
MPOX Virus
MPXV We are seeing non-detects in the past 2 weeks for MPXV DNA at all plants, even southeast. Here are charts of the MPXV DNA data from Southeast showing the raw data (dots in top chart) and 5-d trimmed, centered averages of PMMoV normalized MPXV DNA over the last 6 months.