Bay Area SCAN weekly update 1/11/23
All samples picked up by the couriers as of 1/9/23 have been processed and their data are on the site: wbe.stanford.edu.
Note that the website changed in that now all non-SARS-CoV-2 pathogens can be found on one page with more control over the visualizations. Check it out here.
COVID-19
SARS-CoV-2 and variants
COVID-19
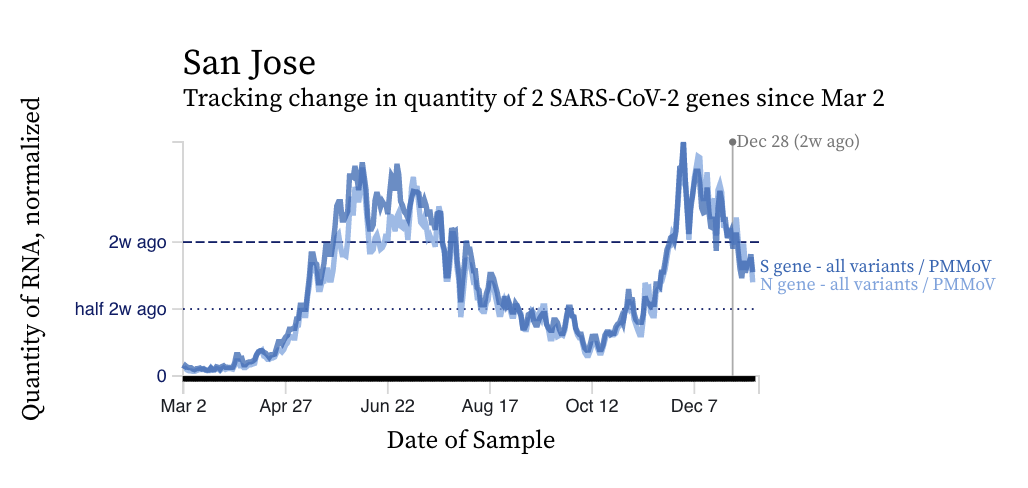
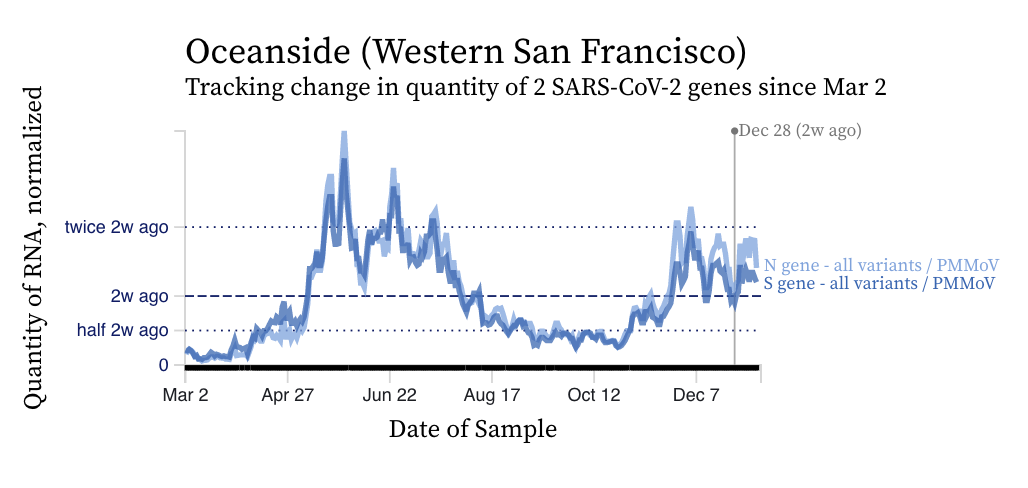
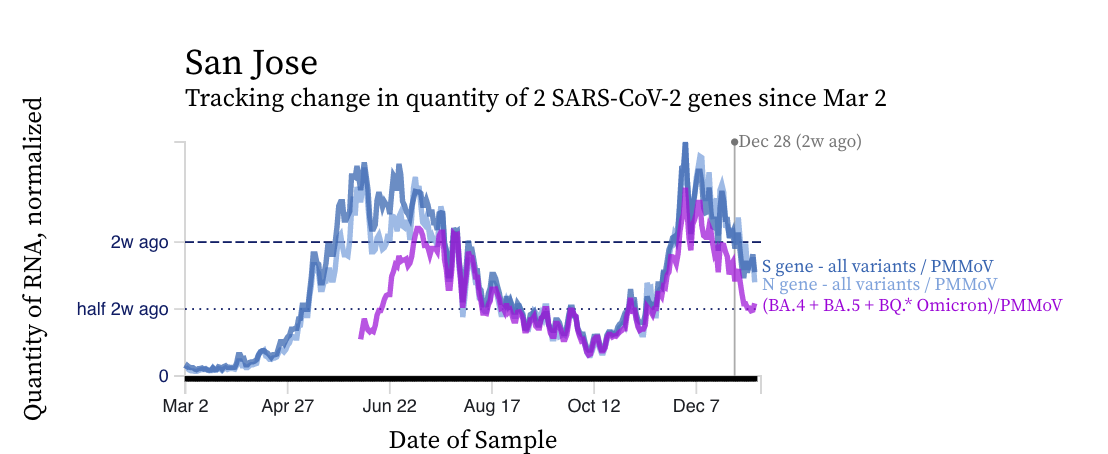
There are different trends in SARS-CoV-2 RNA concentrations among the plants over the last two weeks. In some locations concentrations are steady or falling. An example of decreasing levels is San Jose, and an example with steady levels is Oceanside. In general, concentrations are still similar to what they were in the last BA.2/BA.5 surge.
Although the HV69-70 mutation present in BA.5 and B.Q* sublineages is still present in the majority of circulating SARS-CoV-2 found in wastewater, it is clearly falling off relative to the N and S gene concentrations. But you can see that the concentrations of the mutation (in purple below) are now clearly lower than the N and S gene concentrations suggesting a variant without the mutation is gaining traction in the communities.
This is further evidenced by the decreasing ratio of HV69-70/N across the plants as shown in this chart below. If the ratio is at 100%, it suggests that all the SARS-CoV-2 genomes have the mutation HV69-70 (and we infer that all genomes are from BA.5 or BQ.*). The grey symbols are from all the plants in SCAN (you can access the plot and play around with it here). The current regional ratio of HV69-70/N appears to be about 60%, lower than the last time we sent this newsletter out last week.
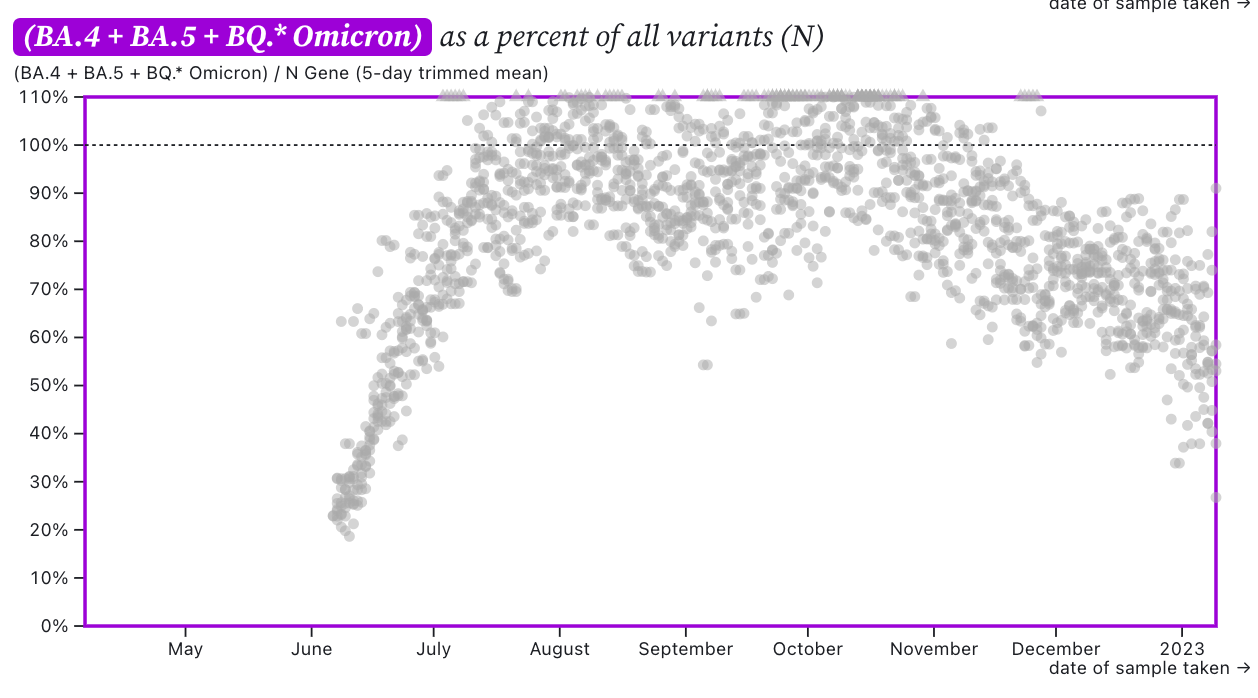
This suggests ~40% of circulating SARS-CoV-2 in wastewater does not have the HV69-70 mutation. XBB and BA.2.75 are among circulating variants that do not have the mutation.
We now have sequencing data from wastewater from San Jose, Sacramento, and Oceanside through the week ending 31 December 2022. That data suggests occurrence of XBB increasing in proportion but does not suggest it is close to 40% regionally at all three sites. Sequencing analysis of the 12/31/22 sample from Oceanside suggests that XBB could represent 50% of the SARS-CoV-2 genomes in the wastewater there at that time; but the 12/31/22 sample from Sacramento and 12/30/22 sample from San Jose suggests XBB represents around 10% of the SARS-CoV-2 genomes in those locations.
We will be launching a new digital PCR assay that targets a unique set of 5 adjacent SNPs in XBB (including XBB1.5) next week and we are interested to see what we learn.
Other respiratory viruses
IAV, IBV, RSV, and HMPV
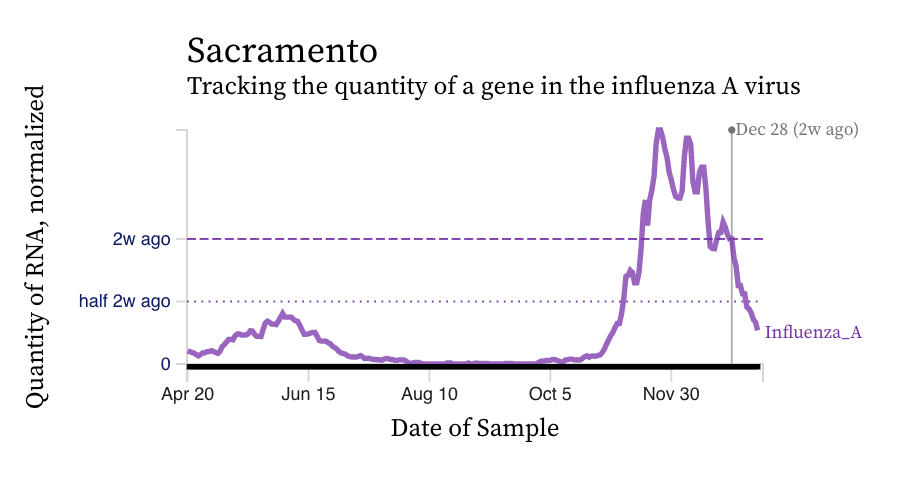
Influenza A (IAV) RNA concentrations are dropping across the plants over the last week suggesting contributions from infected individuals into the wastewater are also declining. An example from Sacramento is shown below.
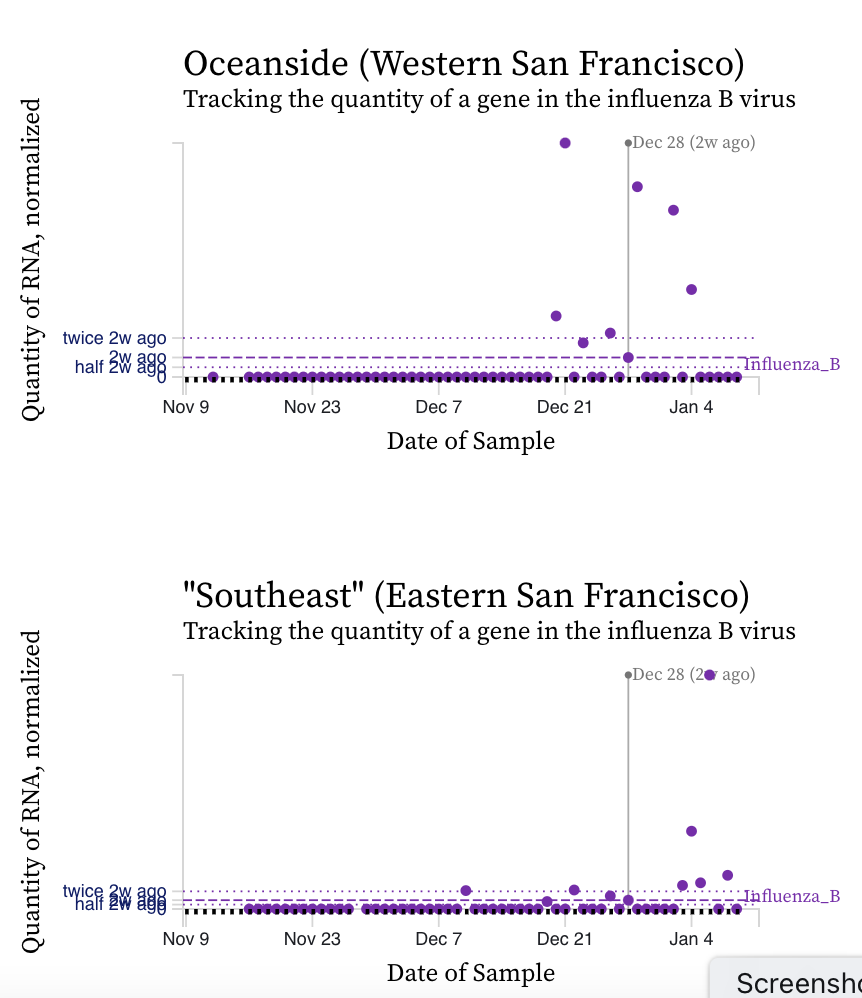
Influenza B (IBV) RNA concentrations are non-detect in most samples over the approximate 8 weeks we have been measuring it. When it is detected, it is mostly at quite low concentrations. We detect it the most often at Palo Alto, San Jose, Sunnyvale, and the two San Francisco plants. Example data from Oceanside and Southeast are below.
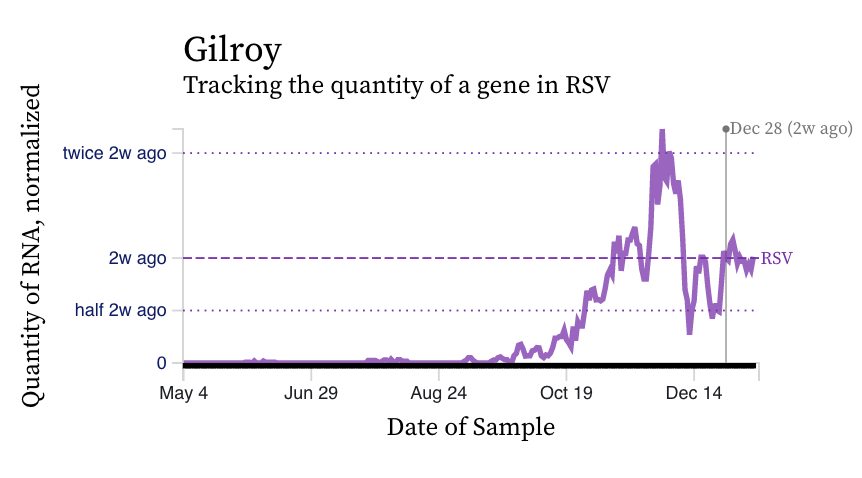
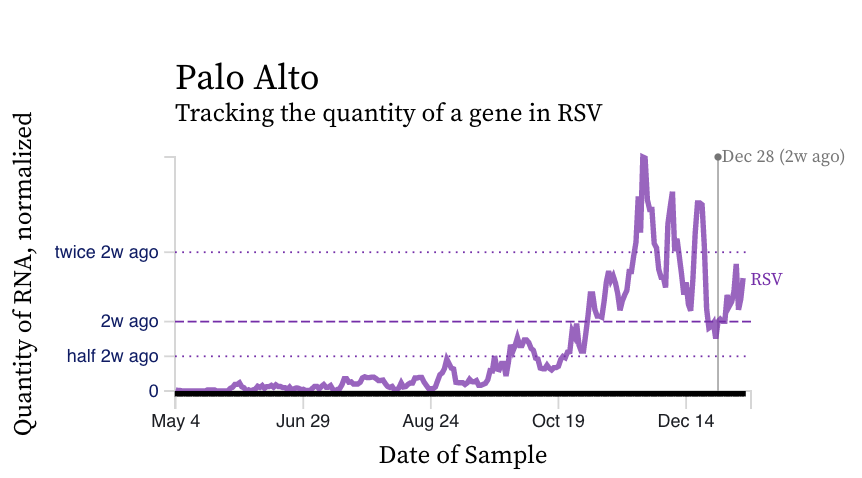
RSV RNA concentrations are falling at most plants, but we see an uptick over the last week at most plants, perhaps due to holiday gatherings. See examples from Gilroy and Palo Alto below showing the recent uptick.
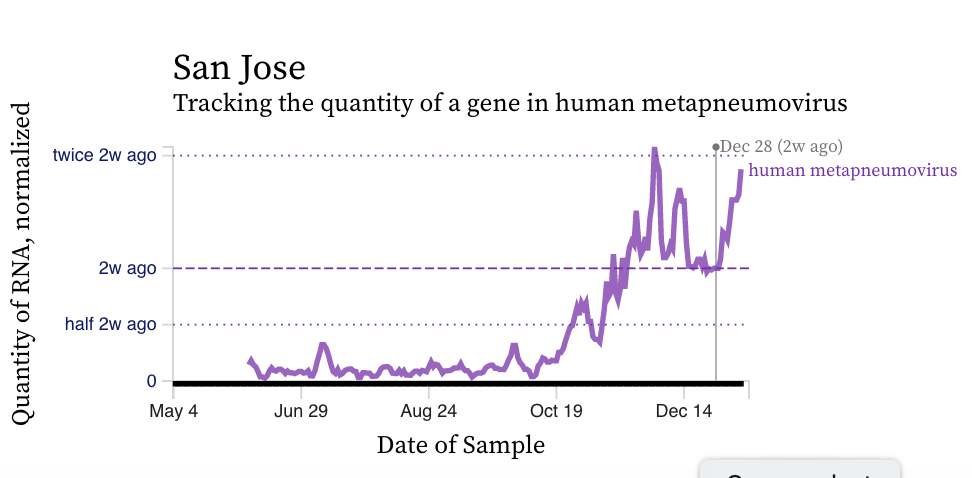
HMPV (human metapneumovirus) RNA concentrations still show a diversity in trends over the last two weeks across the plants. Here is an example from San Jose showing a recent uptick over the couple weeks. HMPV is still elevated at detectable at all plants indicating that it is still circulating.
Norovirus
Assay detects human norovirus GII
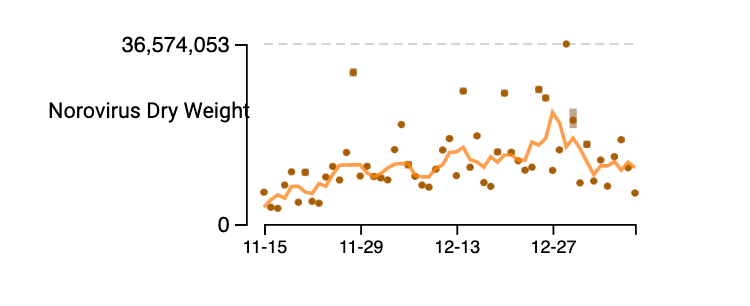
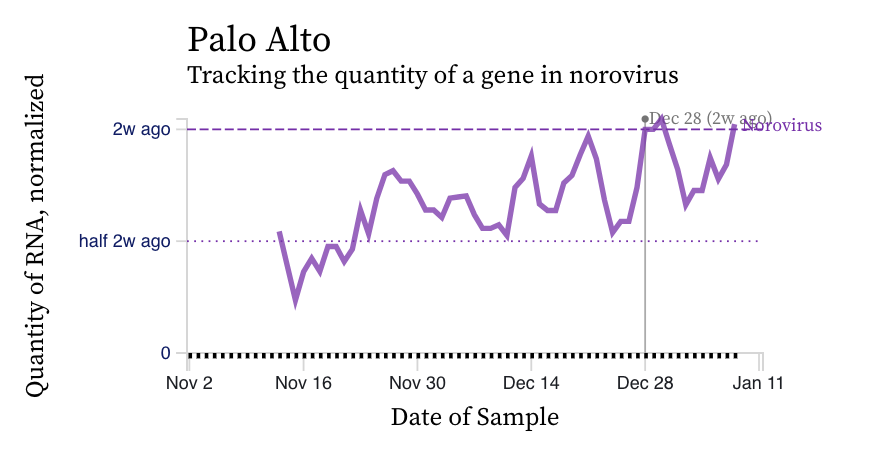
Norovirus GII RNA concentrations have been measured for about 8 weeks now at all the SCAN plants. We have observed concentrations between 10^3 cp/g and 10^9 cp/g. Data appear to be hovering near high levels; trends are mixed across plants. Here is an example from the drill down page for Palo Alto. The concentrations on the y-axis are on a linear scale and are in units of copies per gram dry weight. Another example from the non-COVID page on the website (here) is shown for Palo Alto (same plant). Note that the assay we use targets human norovirus GII which is a common genotype of norovirus, but GI can also circulate.
MPOX Virus
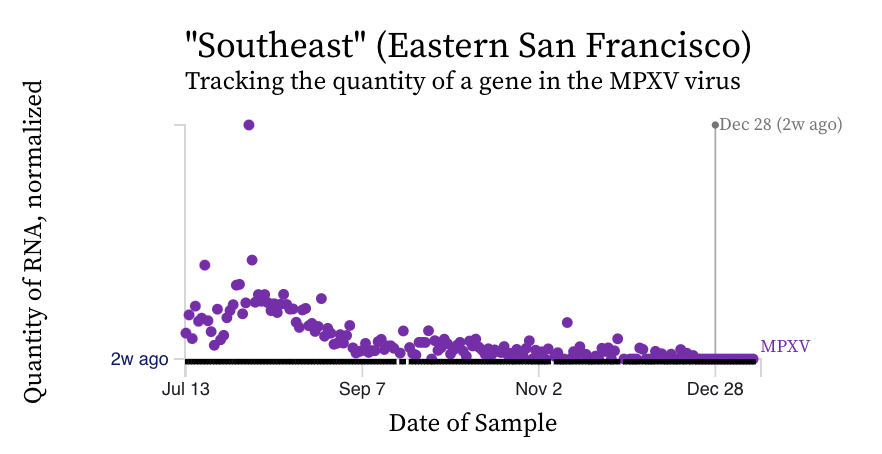
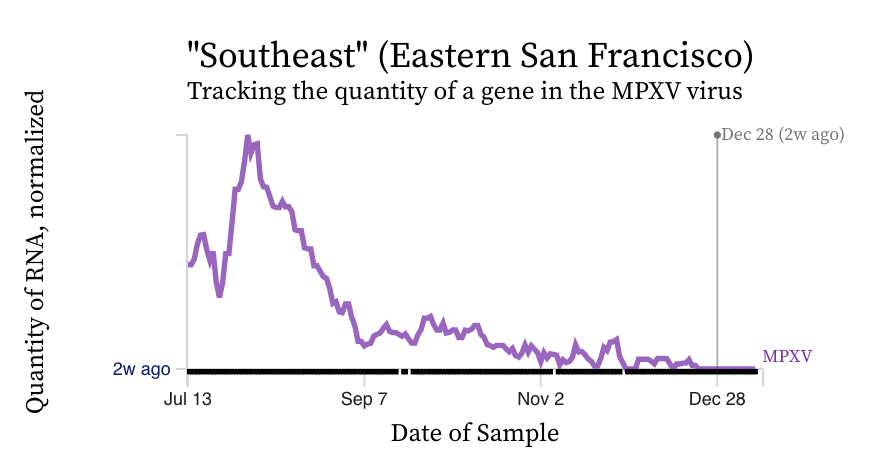
MPXV We see non-detects in the past 2 weeks for MPXV DNA at all plants, except for one sample at Palo Alto. Here are charts of the MPXV DNA data from Southeast showing the raw data (dots in top chart) and 5-d trimmed, centered averages of PMMoV normalized MPXV DNA over the last 6 months - recall this plant historically had the highest concentrations of MPXV DNA. Although the y-axis says "RNA" it should read "DNA".