Bay Area SCAN weekly update 1/19/23
All samples picked up by the couriers as of 1/17/23 have been processed and their data are on the site: wbe.stanford.edu. The data from the SCAN sites are also on the new site designed by Stamen data.wastewaterscan.org.
Our study on MPOX DNA in wastewater in close collaboration with CDPH was published in New England Journal of Medicine yesterday as a correspondence. Here is the link: https://www.nejm.org/doi/full/10.1056/NEJMc2213882.
COVID-19
SARS-CoV-2 and variants
COVID-19
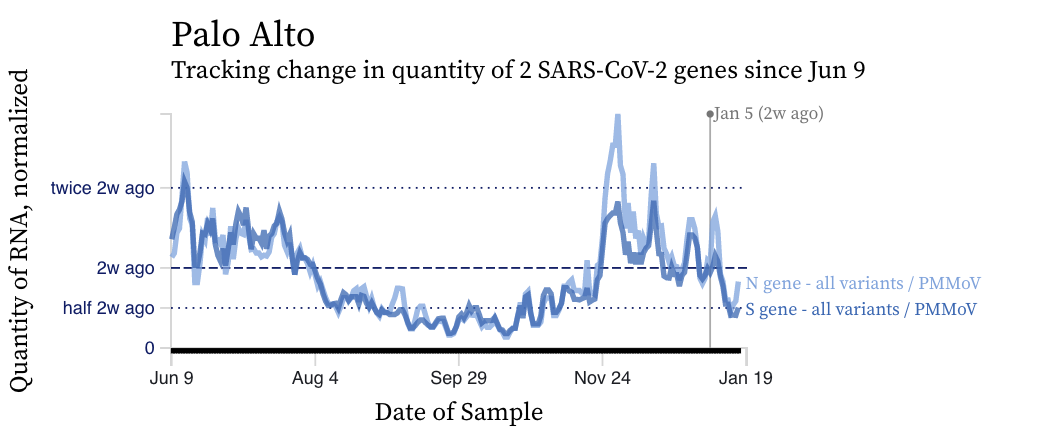
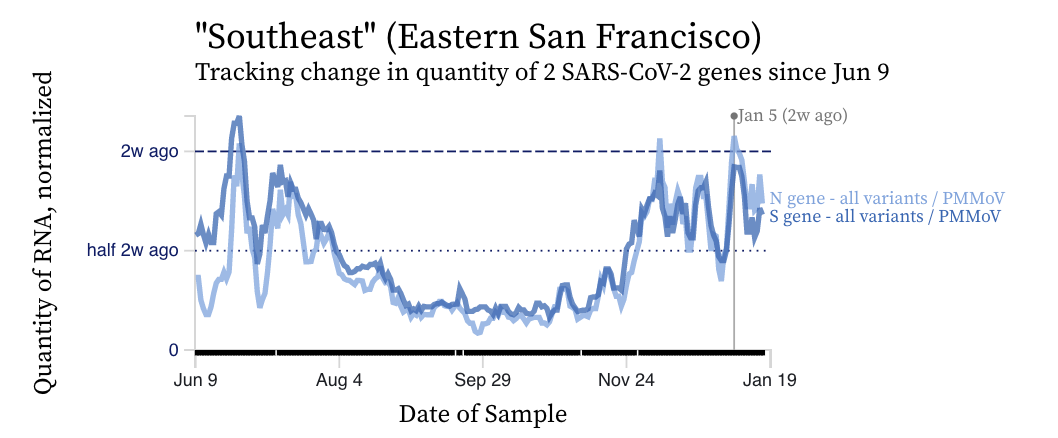
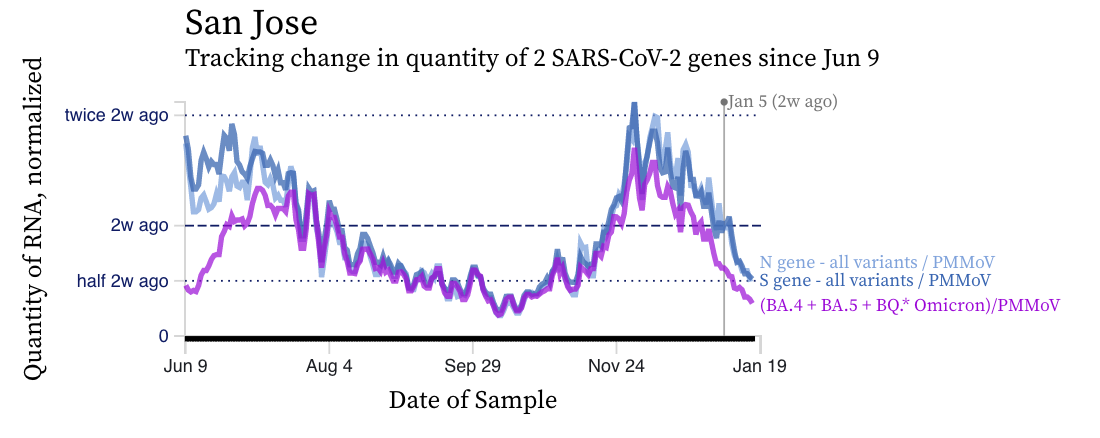
SARS-CoV-2 RNA concentrations are sharply decreasing across plants with the exception of Southeast in San Francisco. Here are examples of the decrease we are seeing (Palo Alto), and the chart for the only plant not decreasing (Southeast).
The HV69-70 mutation found in BA.5 and B.Q* sublineages is present in about 50% the circulating SARS-CoV-2 found in wastewater and has decreased since last week. The concentrations of the HV69-70 mutation (in purple below) are now clearly lower than the N and S gene concentrations suggesting a variant without the mutation is gaining traction in the communities.
The ratio of HV69-70/N across the plants as shown in this chart below. If the ratio is at 100%, it suggests that all the SARS-CoV-2 genomes have the mutation HV69-70 (and we infer that all genomes are from BA.5 or BQ.*). The grey symbols are from all the plants in SCAN (you can access the plot and play around with it here). The current regional ratio of HV69-70/N appears to be about 40-50%, lower than the last time we sent this newsletter out last week.
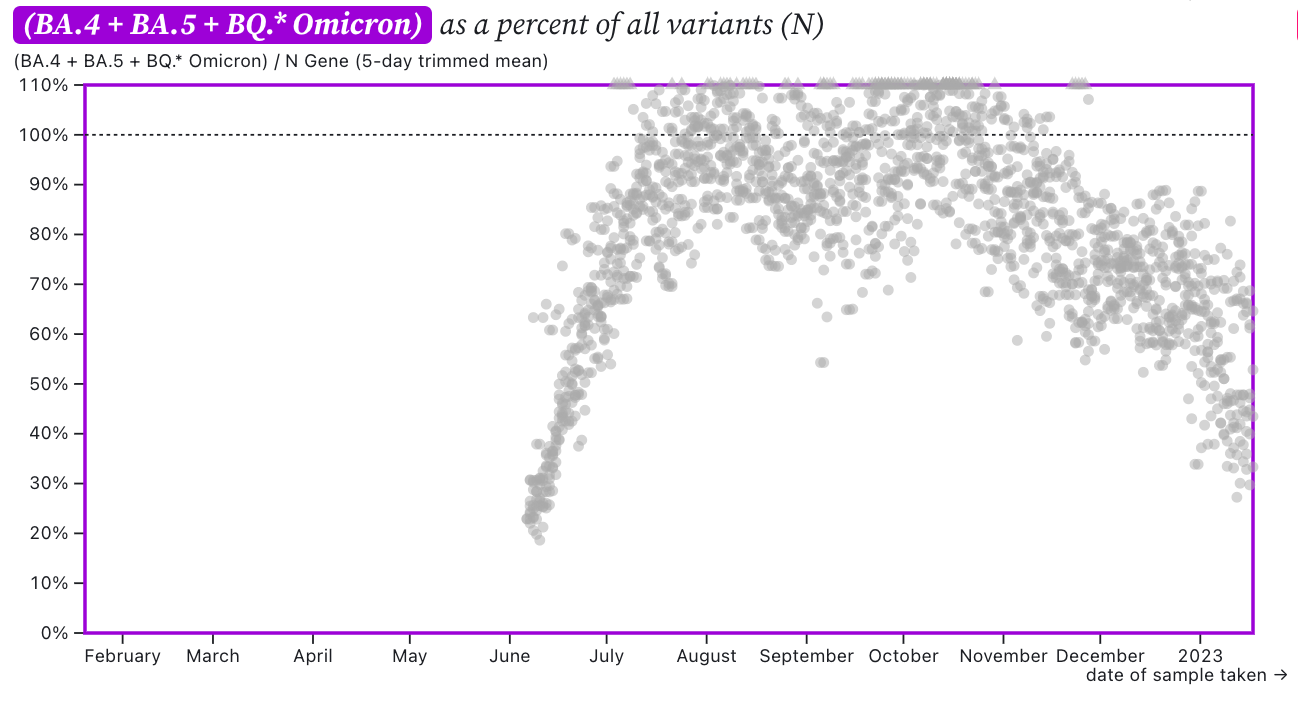
This suggests ~50-60% of circulating SARS-CoV-2 in wastewater does not have the HV69-70 mutation. XBB and BA.2.75 are among circulating variants that do not have the mutation.
We have sequencing data from wastewater from San Jose, Sacramento, and Oceanside through the week ending 7 January 2023. That data suggests occurrence of XBB has been increasing in proportion and represents close to 20% of all SARS-CoV-2 genomes in wastewater from these three sites where as BA.2.75 could be 1-10%.
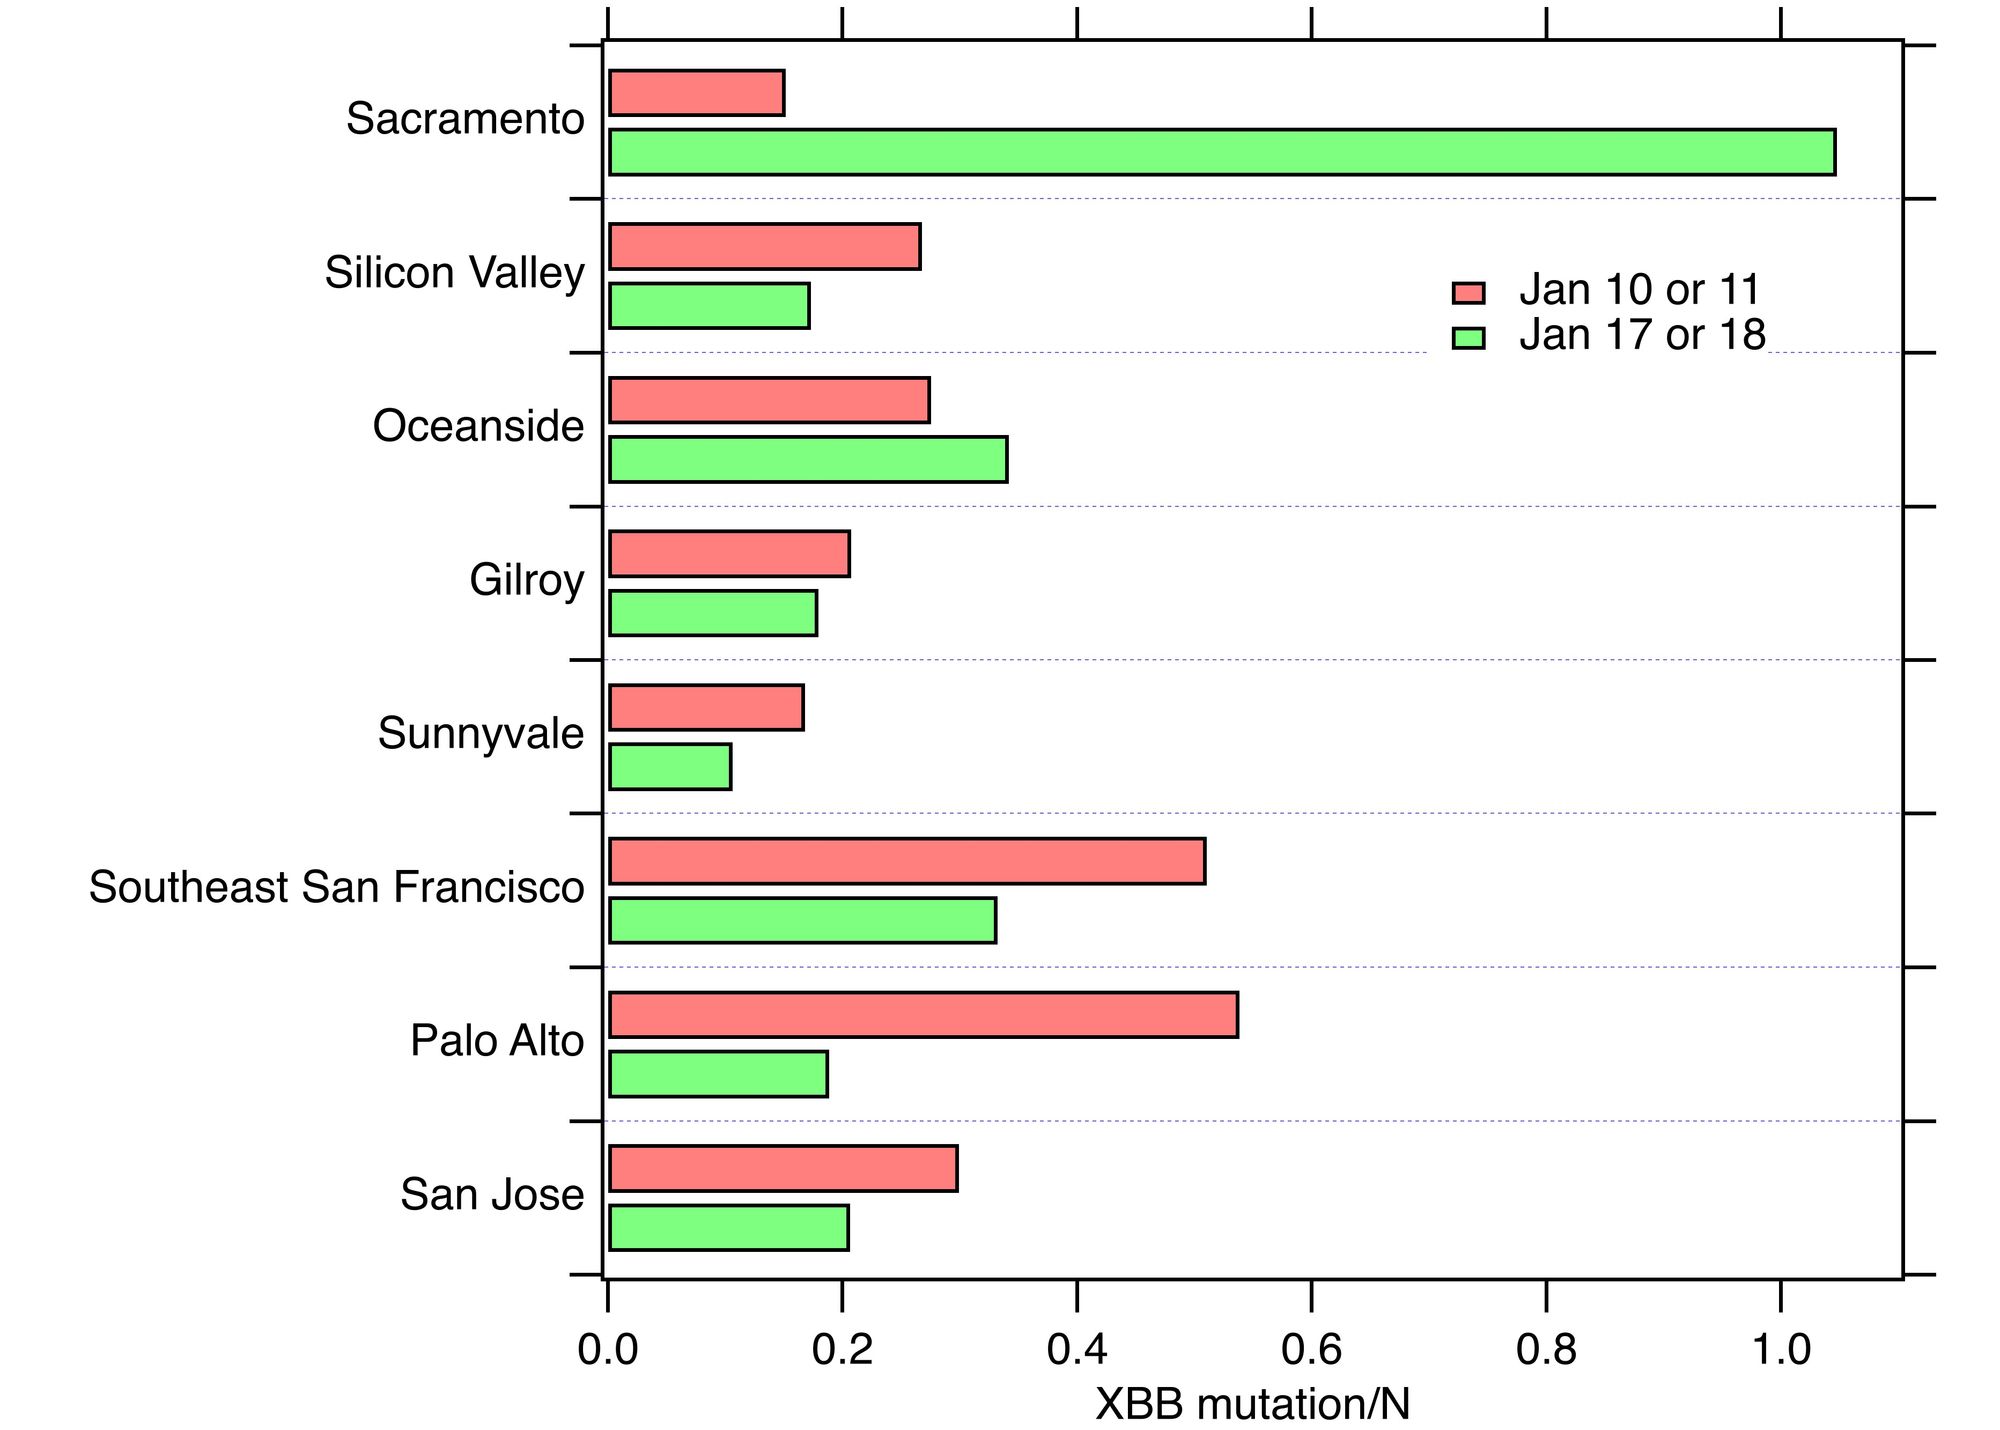
We have a new new digital PCR assay that targets a unique set of 5 adjacent SNPs in XBB* (including XBB1.5). We will run this assay in place of the S gene (as soon as we receive the supplies - hopefully next week) on every sample. In the meantime, we ran the assay on one sample per plant last week (sample from 1/10 or 1/11) and one sample per plant this week (sample from 1/17 or 1/18). The results of the mutation assay suggest that last week, XBB* represented ~20-100% of the genomes (depending on the plant and date of sample).
Here is a plot of the ratio of the XBB* mutation/N at the SCAN plants for the samples we have analyzed. If the ratio is 1, it means all SARS-CoV-2 genomes in wastewater solids have the mutation.
Other respiratory viruses
IAV, IBV, RSV, and HMPV
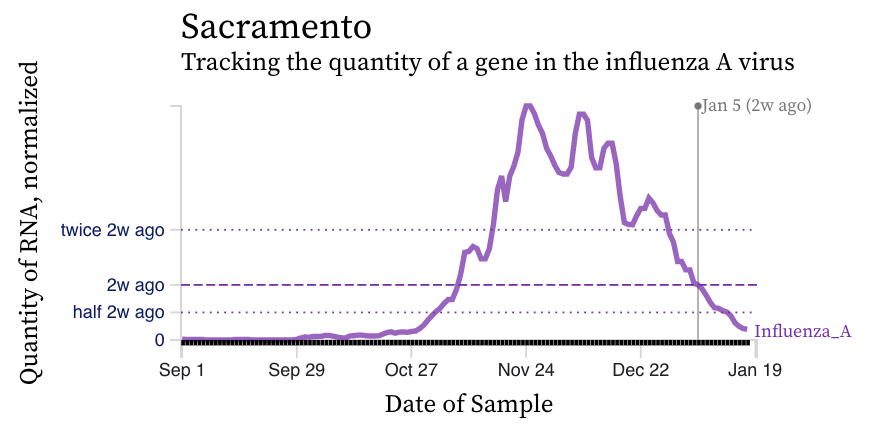
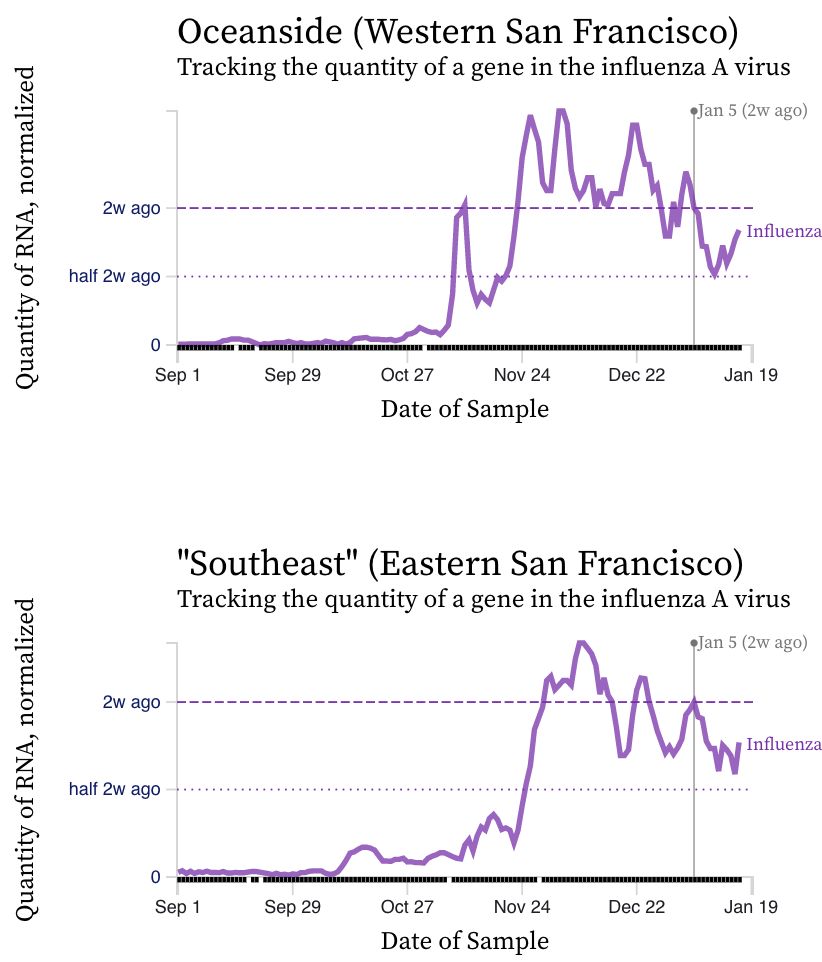
Influenza A (IAV) RNA concentrations have dropped sharply across the plants over the last week suggesting contributions from infected individuals into the wastewater are declining. The exception are the two plants in San Francisco where levels have not changed over the last couple weeks. Here are examples from Sacramento (similar trends at all SCAN plants except SF), and then the two SF plants.
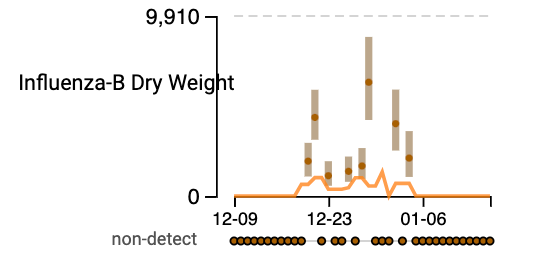
Influenza B (IBV) RNA concentrations are non-detect in most samples over the approximate 10 weeks we have been measuring it. When it is detected, it is mostly at quite low concentrations and detections are sporatic. Here is an example of data from the drilldown page for oceanside. The units of the y-axis are copies per gram dry weight of solids and the scale is linear.
I heard from a colleague in Ottawa, Canada that their influenza A concentrations in wastewater are near zero now after their flu season, but they are now seeing upticks in influenza B in wastewater. They also use wastewater solids as their matrix. In case you are interested, here is a link to their provincial public health dashboard which includes influenza and RSV as well as COVID: link to Ottawa Public Health Dashboard.
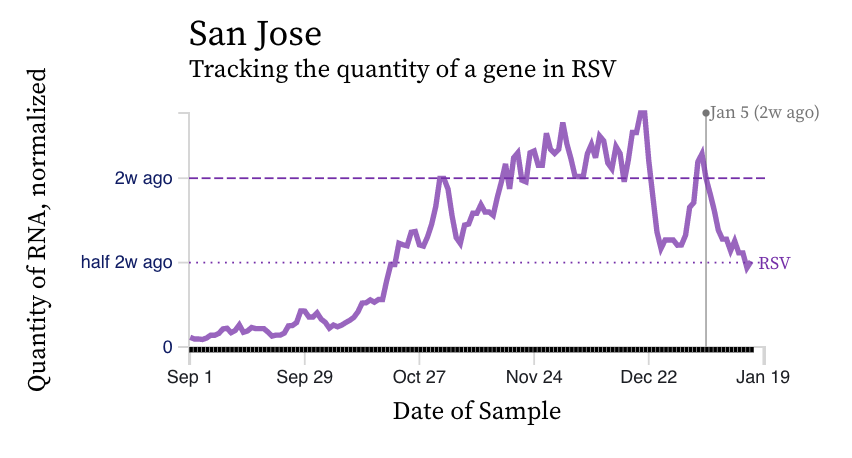
RSV RNA concentrations are falling at most plants across the last week or two. We saw an uptick at most plants around the new year (but oddly not in the influenza A data), and now levels are declining, but not as sharply as influenza A. Here is an example from San Jose, but many plants have similar patterns.
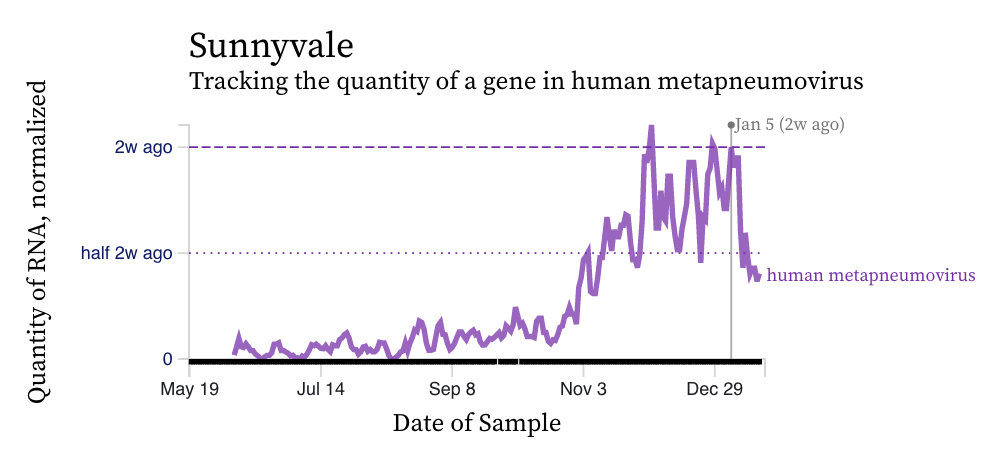
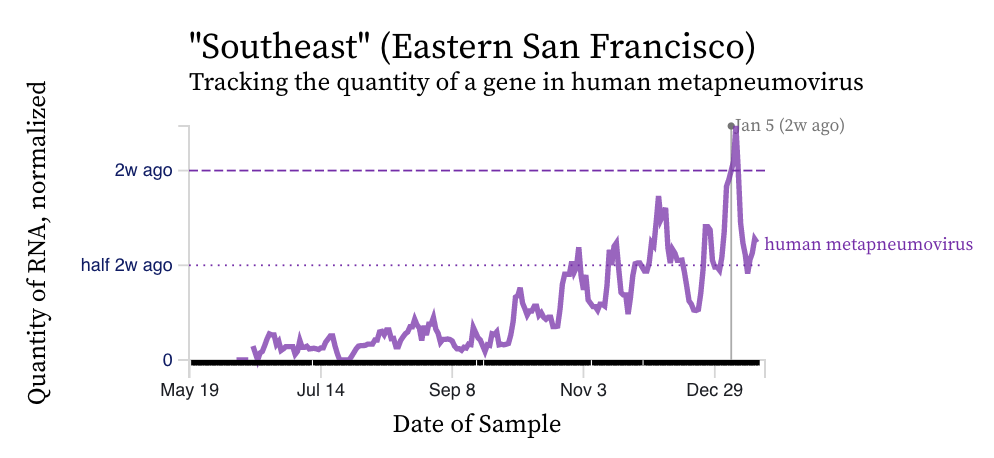
HMPV (human metapneumovirus) RNA concentrations show a diversity in trends over the last two weeks across the plants. Here is an example from San Jose showing a recent uptick over the couple weeks. HMPV is still elevated at detectable at all plants indicating that it is still circulating. Here is an example from Southeast and Sunnyvale showing different patterns. HMPV is still circulating in the communities and its patterns seem more similar to RSV than influenza A.
Norovirus
Assay detects human norovirus GII
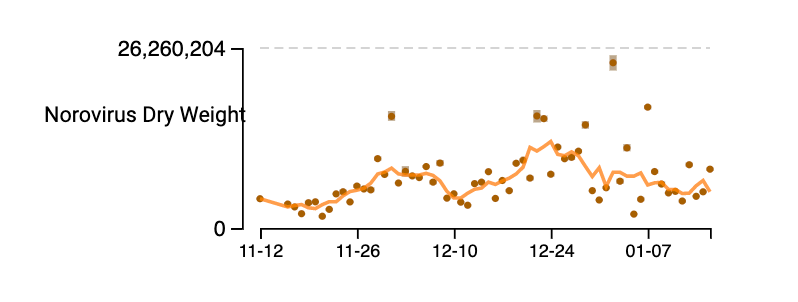
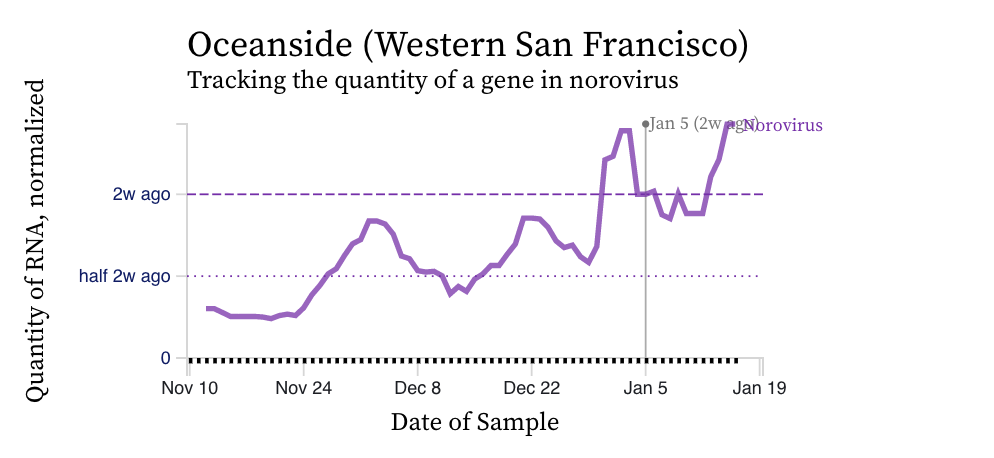
Norovirus GII RNA concentrations have been measured for about 10 weeks now at all the SCAN plants. We have observed concentrations between 10^3 cp/g and 10^9 cp/g. Data are hovering near high levels; trends are mixed across plants. Here is an example from the drill down page for Oceanside. The concentrations on the y-axis are on a linear scale and are in units of copies per gram dry weight. Another example from the non-COVID page on the website (here) is shown for Oceanside (same plant). Note that the assay we use targets human norovirus GII which is a common genotype of norovirus, but GI can also circulate.
MPOX Virus
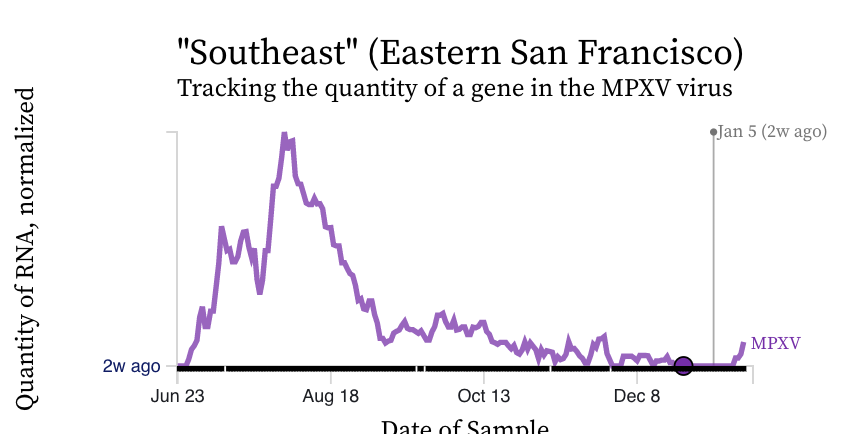
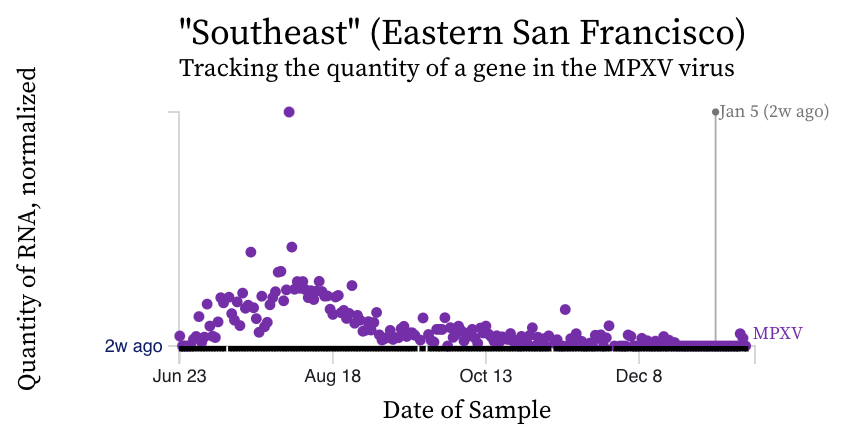
MPXV We see non-detects in the past 2 weeks for MPXV DNA at most plants. We saw a couple detections at Southeast and San Jose, and one detection at Palo Alto.
Here are charts of the MPXV DNA data from Southeast showing the raw data (dots in top chart) and 5-d trimmed, centered averages of PMMoV normalized MPXV DNA over the last 30 weeks - recall this plant historically had the highest concentrations of MPXV DNA. Although the y-axis says "RNA" it should read "DNA".