
Nationwide WWSCAN Update 1/20/23
Hi everyone,
This newsletter contains updates on the WastewaterSCAN program. Below you will find information on the program in terms of participating partners, review of targets being measured, as well as trends in concentrations of infectious disease targets. We have added trend analysis to identify locations where there are statistically significant upward and downward trends in concentrations of infectious disease targets.
Enjoy your weekend,
Ali & Marlene
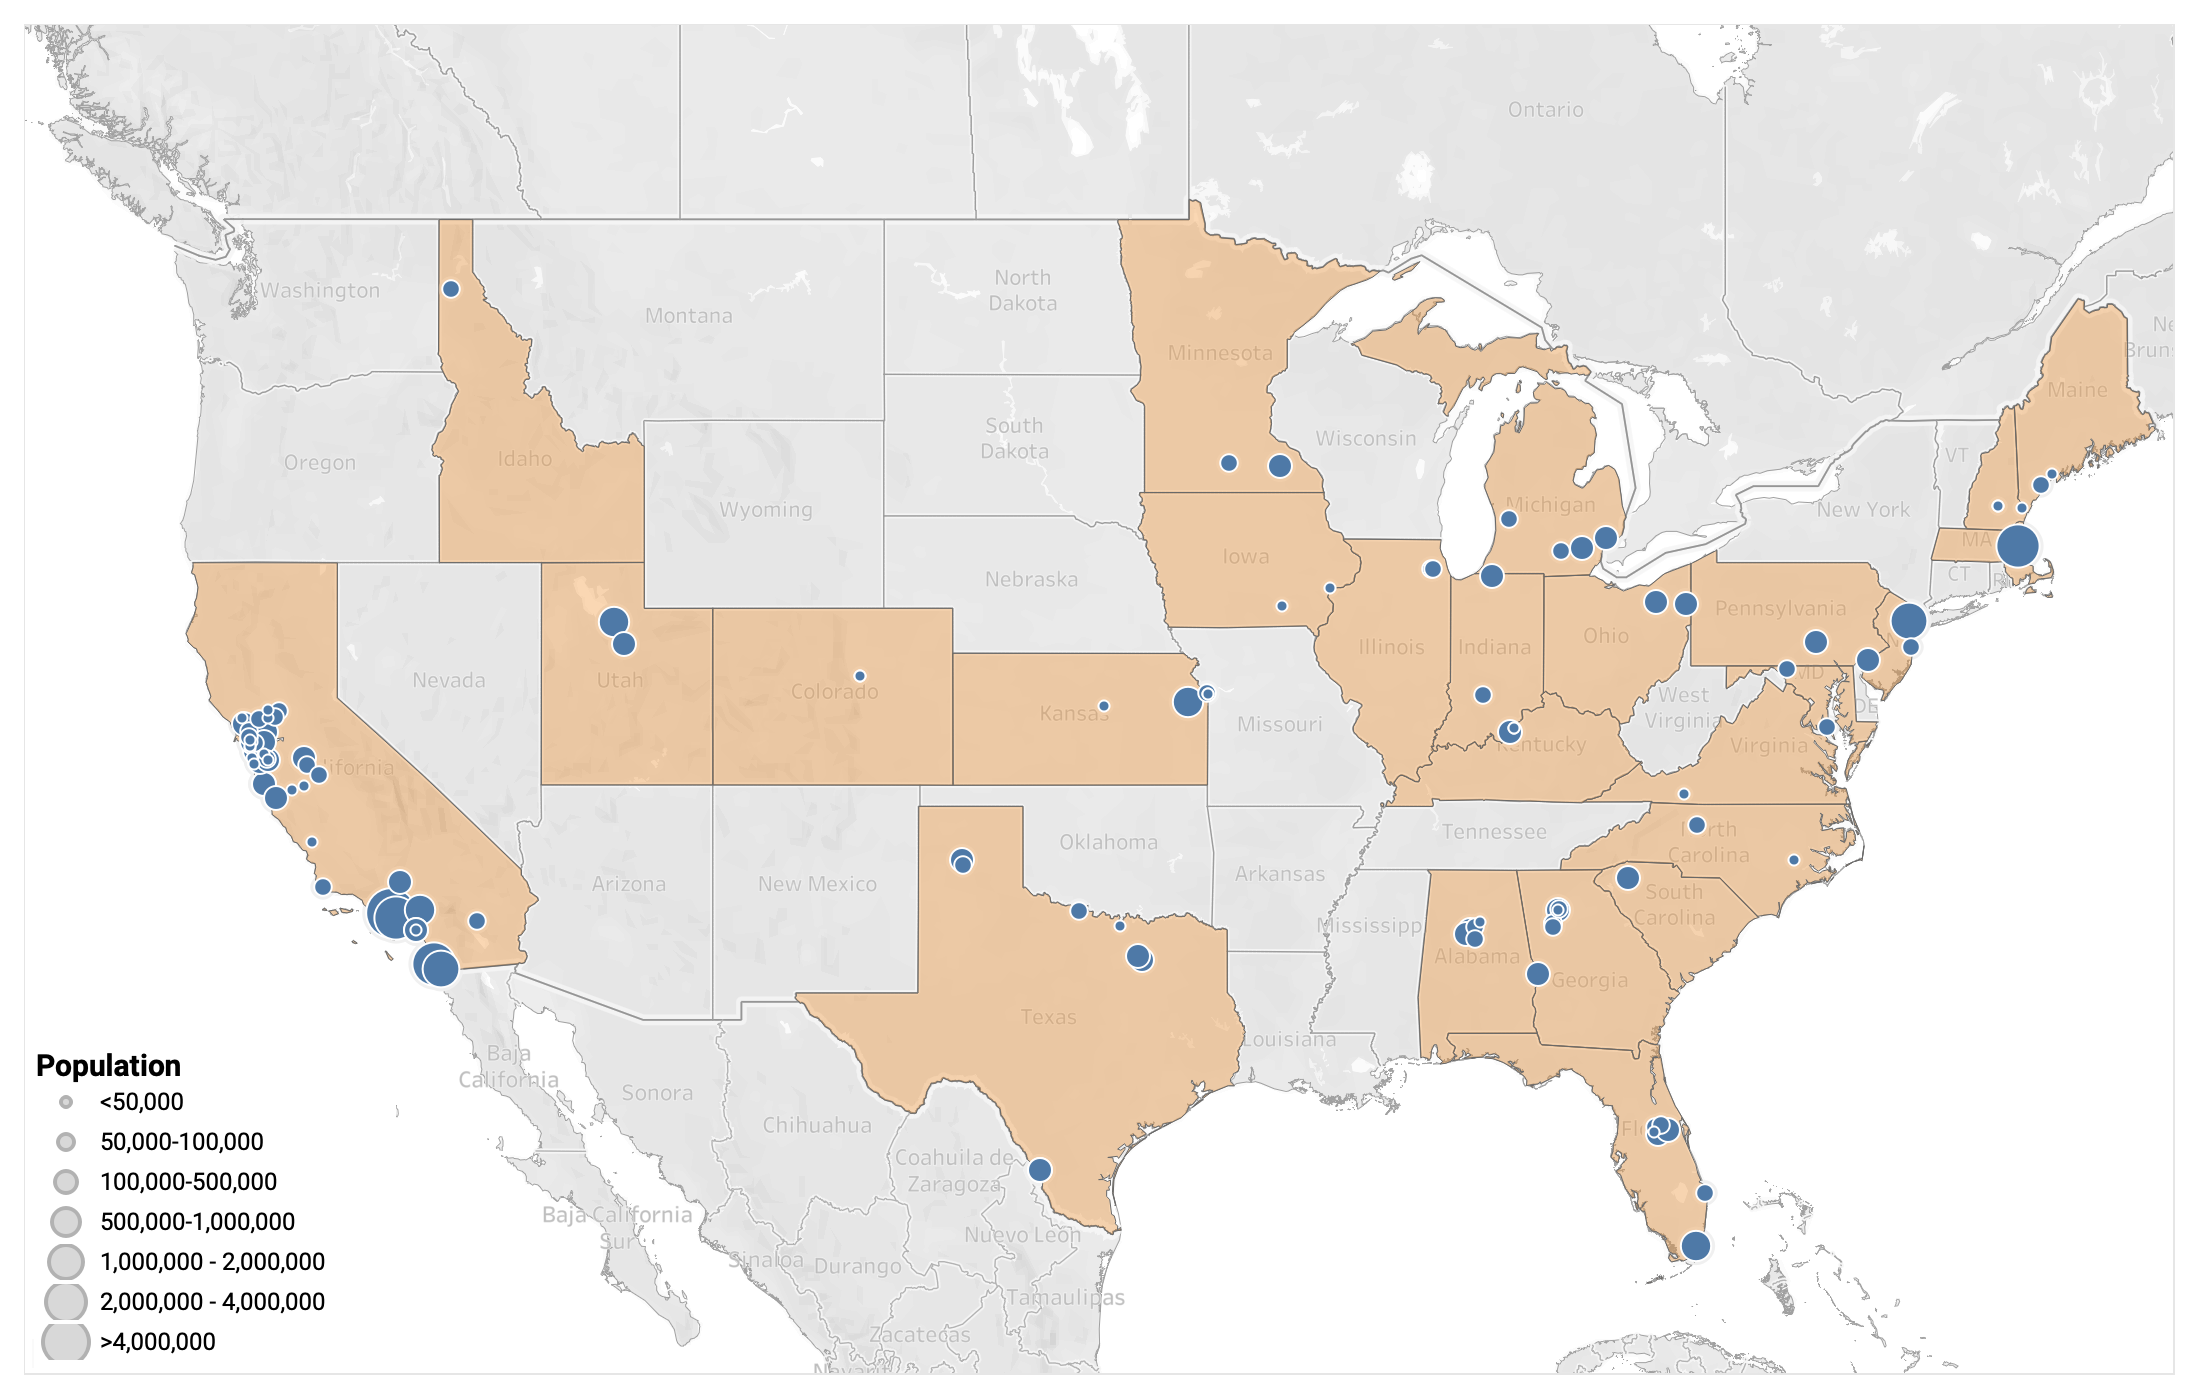
Participating Partners
We hit a milestone at the end of the year and now have over 100 plant sampling which represents almost 10% of the US population in 25 states!
Participants:
- 127 plants sampling
- 133 plants onboarded
- 9.90% US population represented (32,632,553 people)
- 25 states represented
Welcome, New Plants!
- California (2): Windsor, and Riverside
- Florida (3): Key Biscayne, Miami, and North Miami
- Iowa (5): Muscatine, Coralville, Clinton, Ottumwa, and Marshalltown
- Maine (1): York Beach
- Maryland (1): Lexington Park
- Michigan (1): Traverse City
- Ohio (1): Akron
Infectious Disease Target Review
We are currently measuring SARS-CoV-2, IAV, IBV, RSV, HMPV, Mpox, and HuNoV
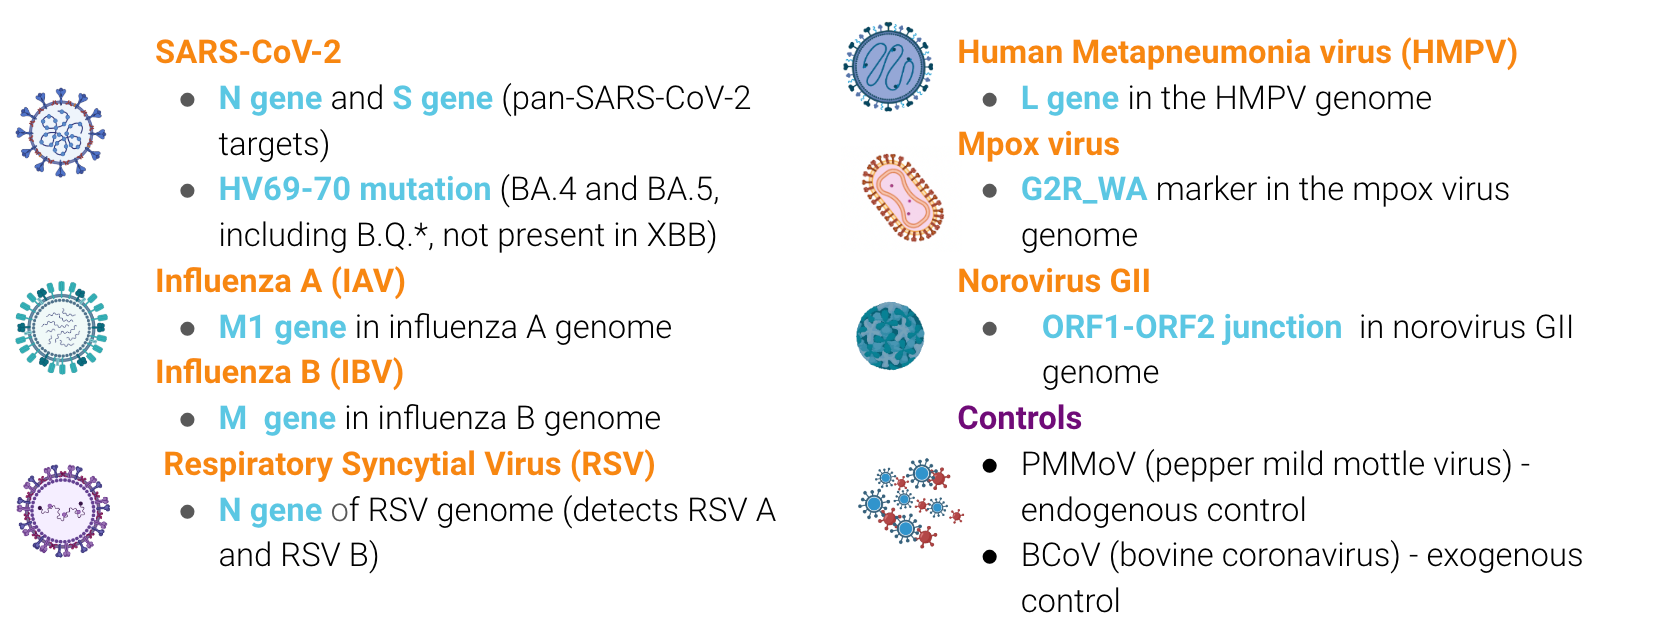
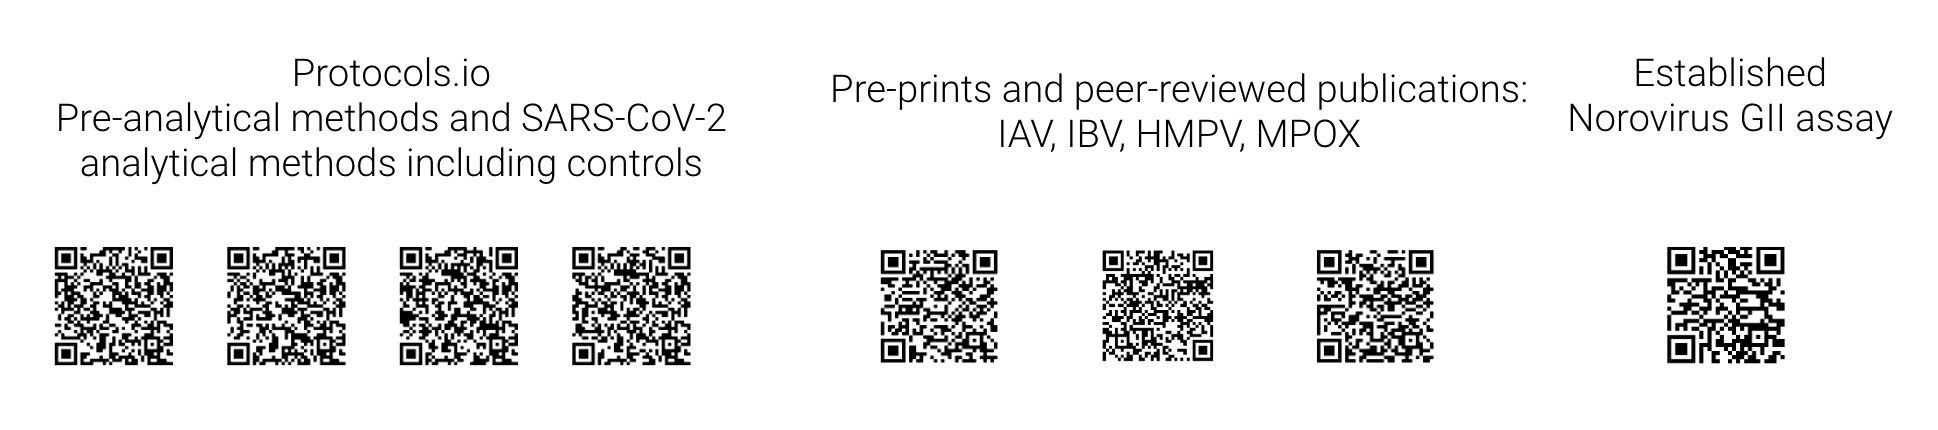
The methods are in the public domain and you can access them using these QR codes:
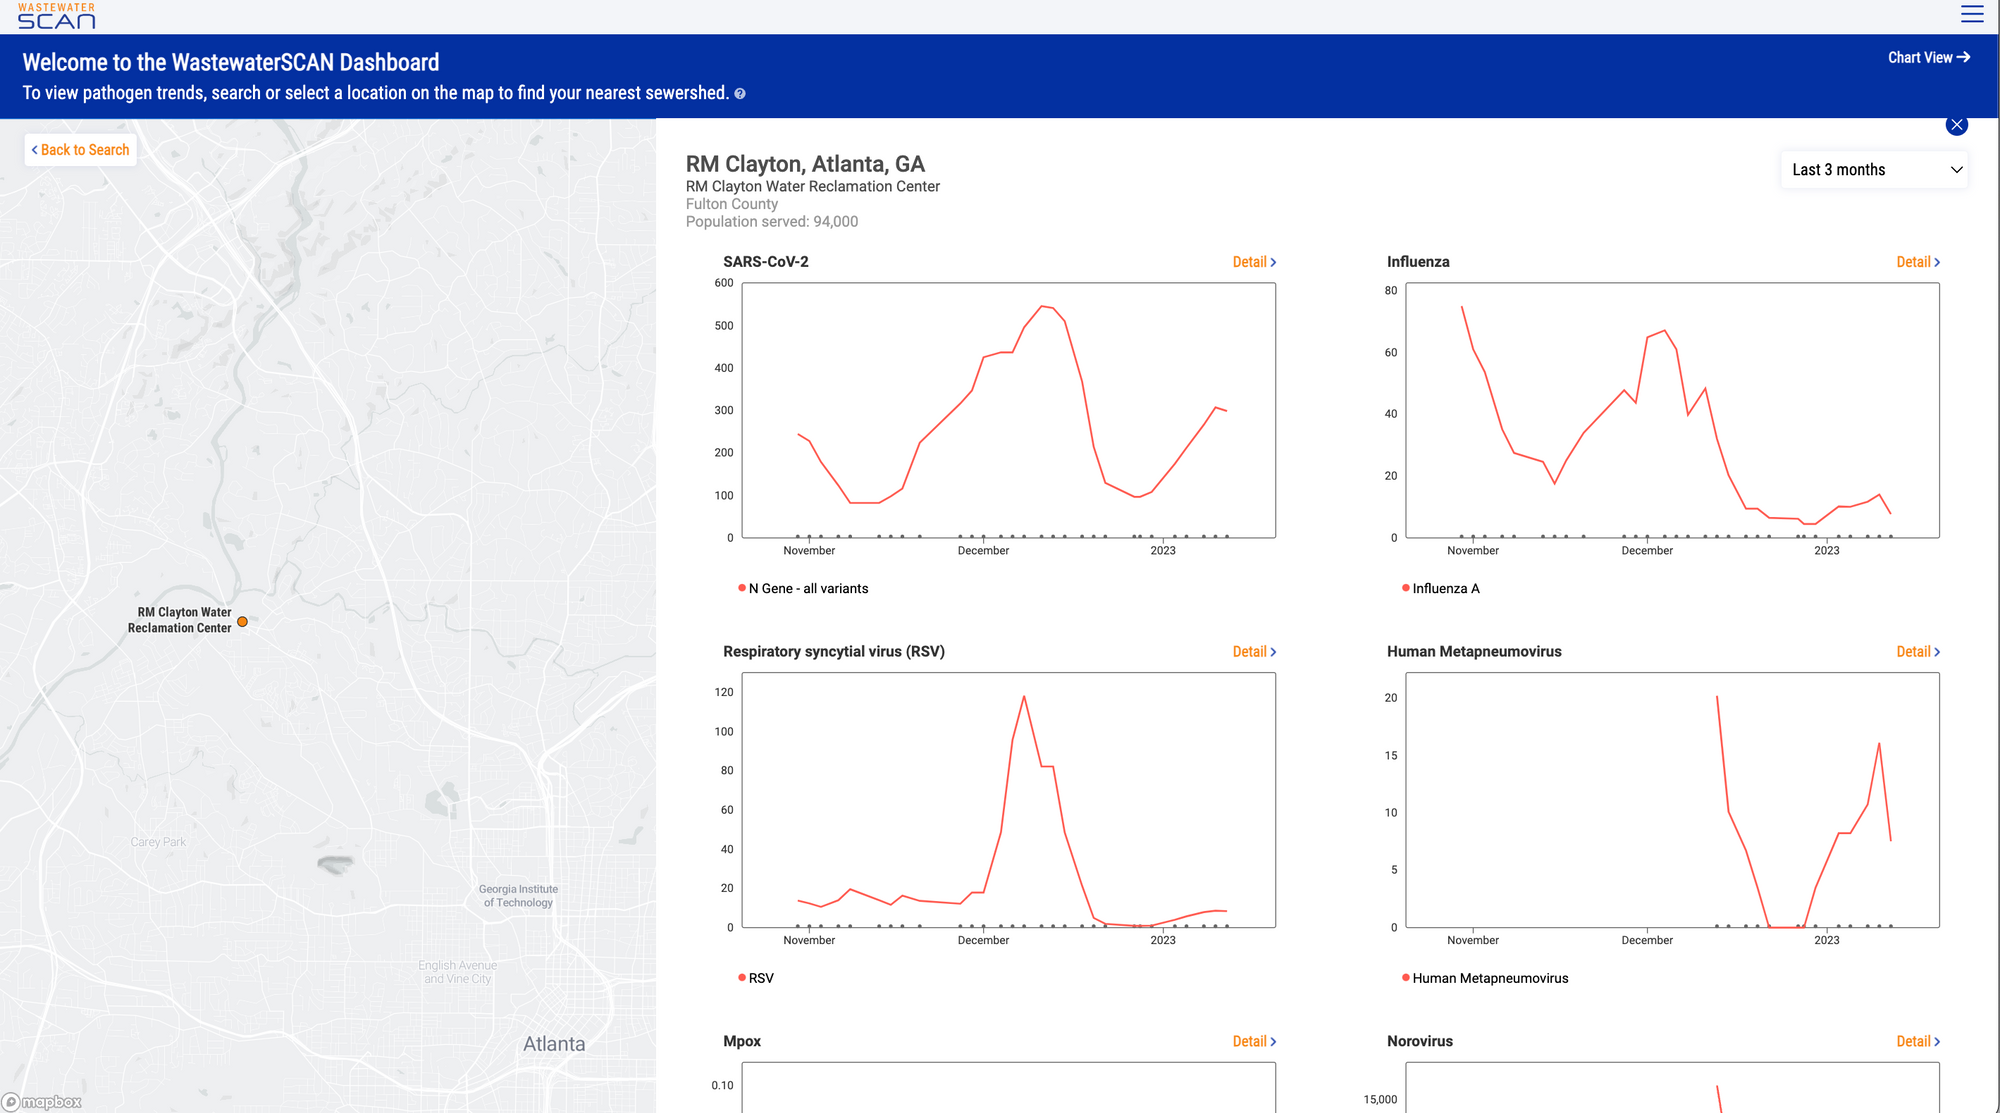
New Data Platform!
Visit data.wastewaterscan.org to learn more
The new data platform went live last Friday (1/13/23)! We plan to add more features in future iterations, but we hope you have been enjoying the new site.
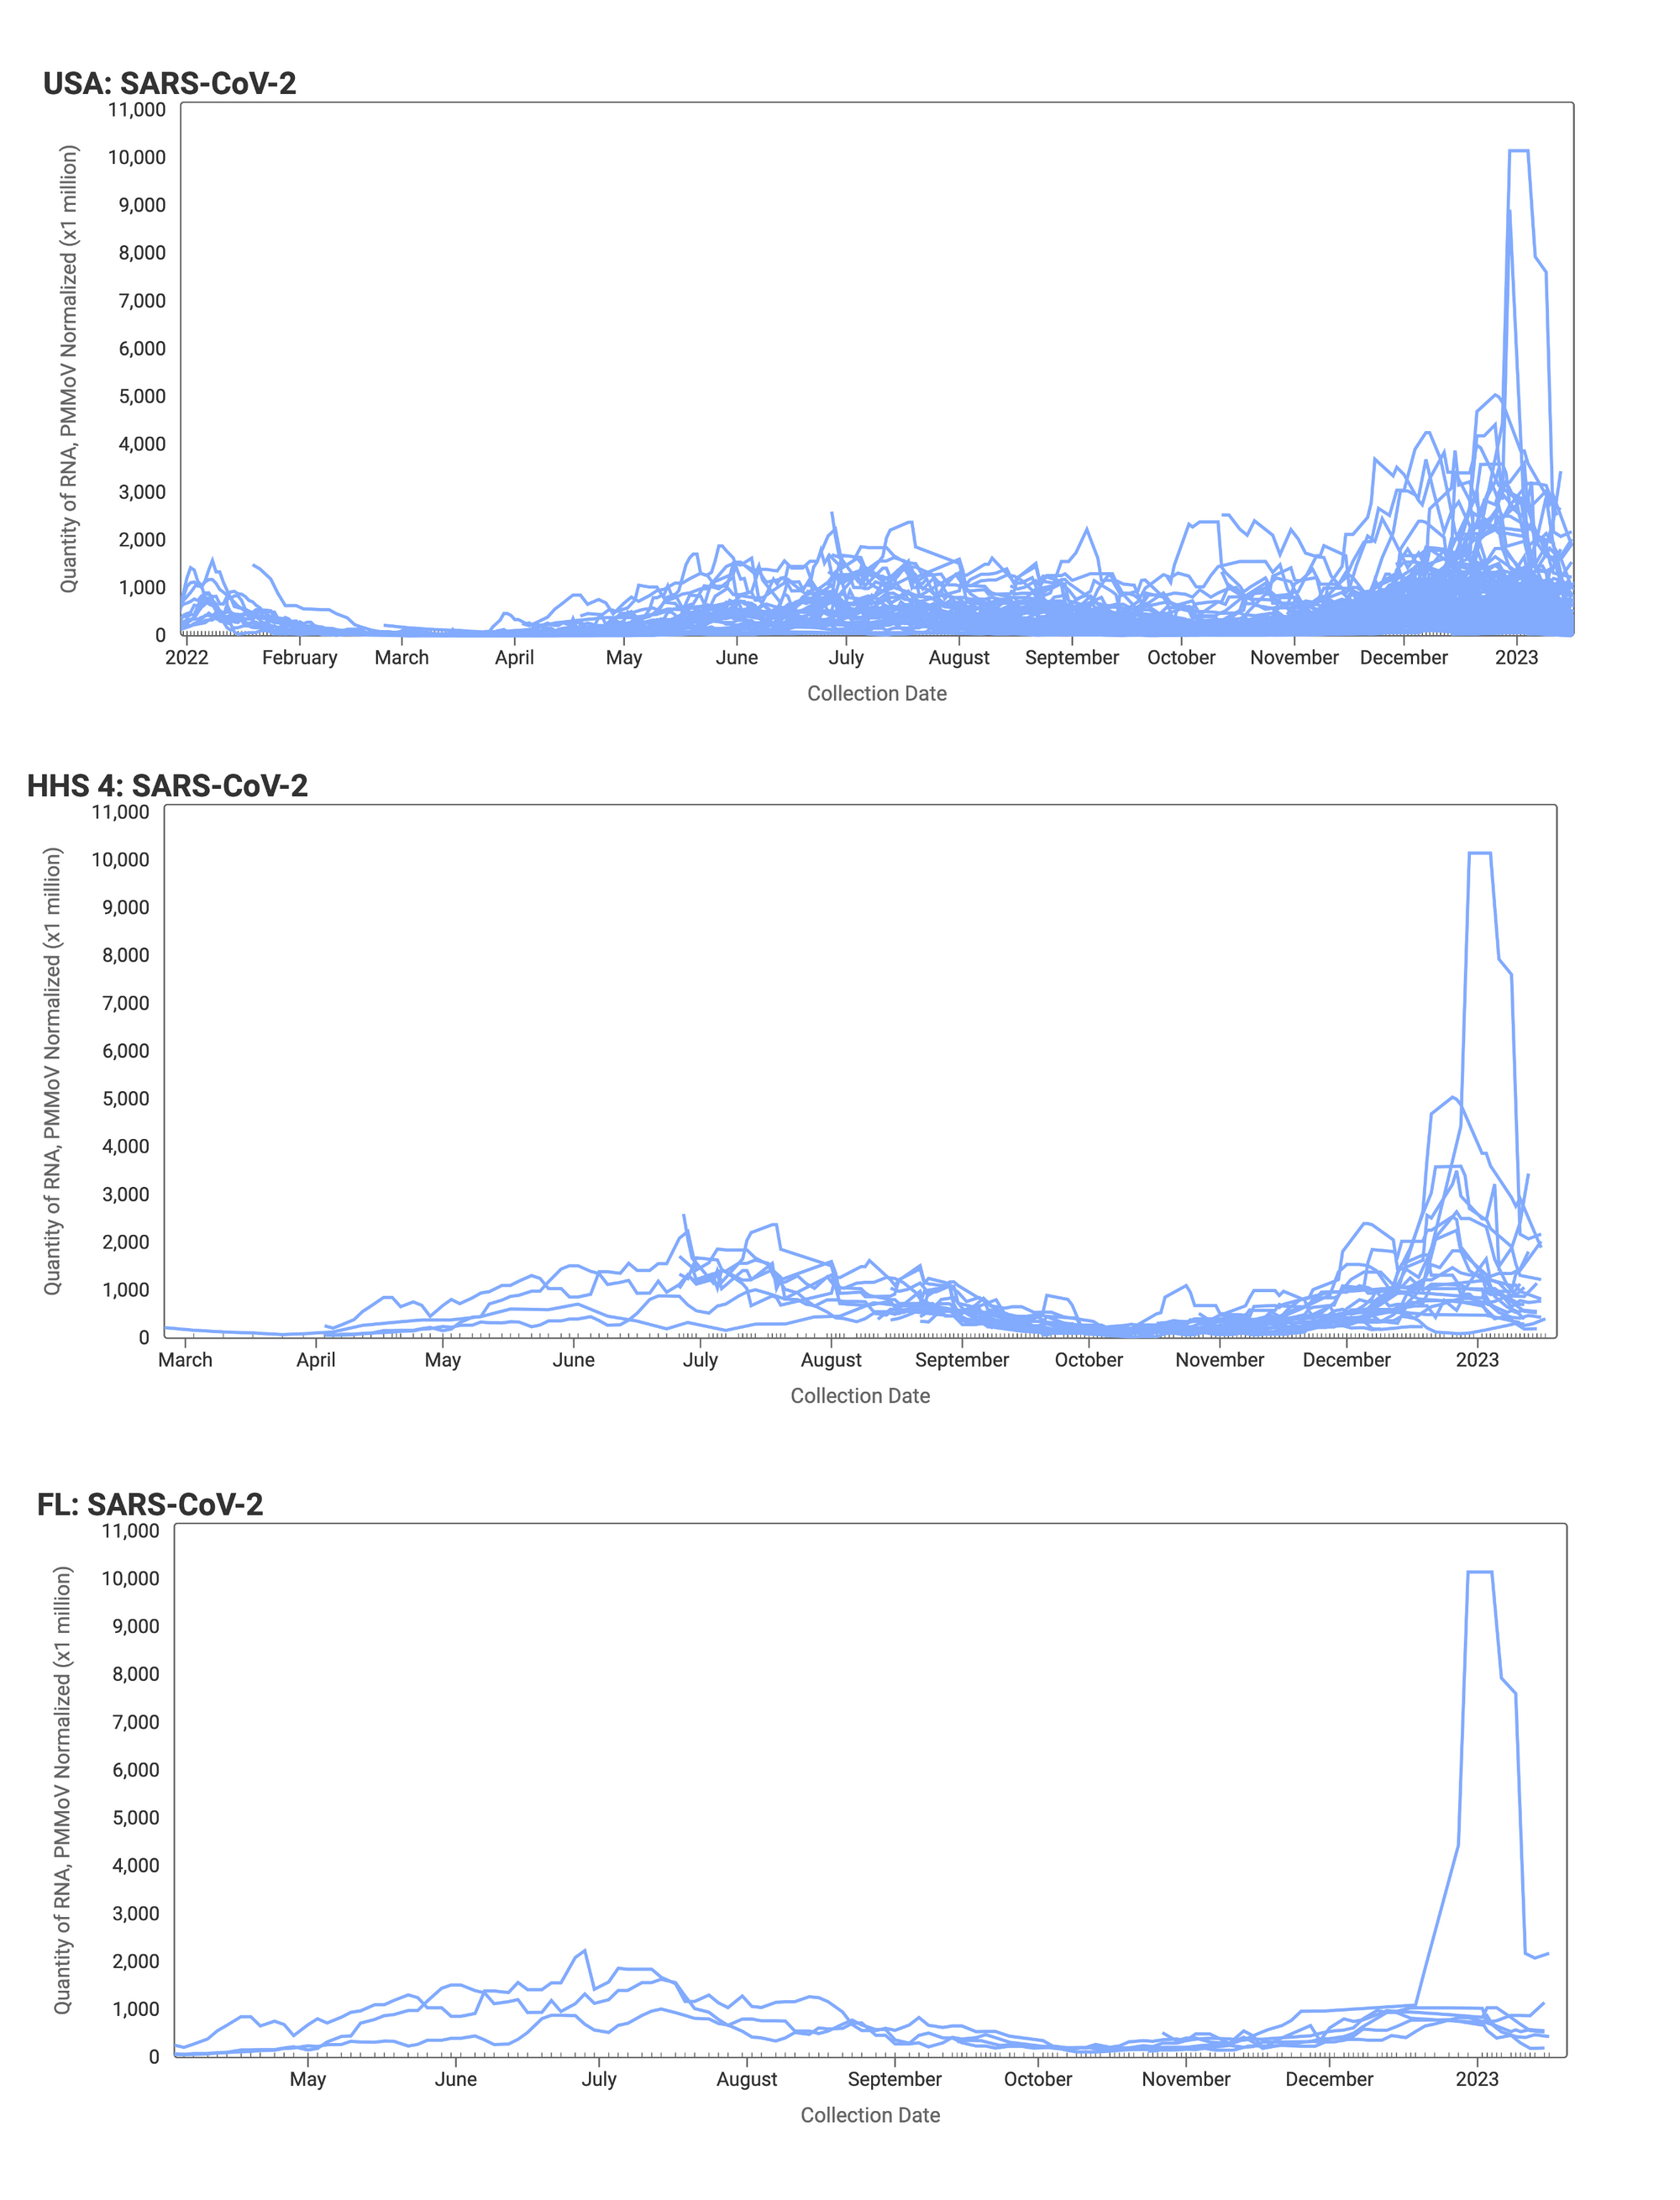
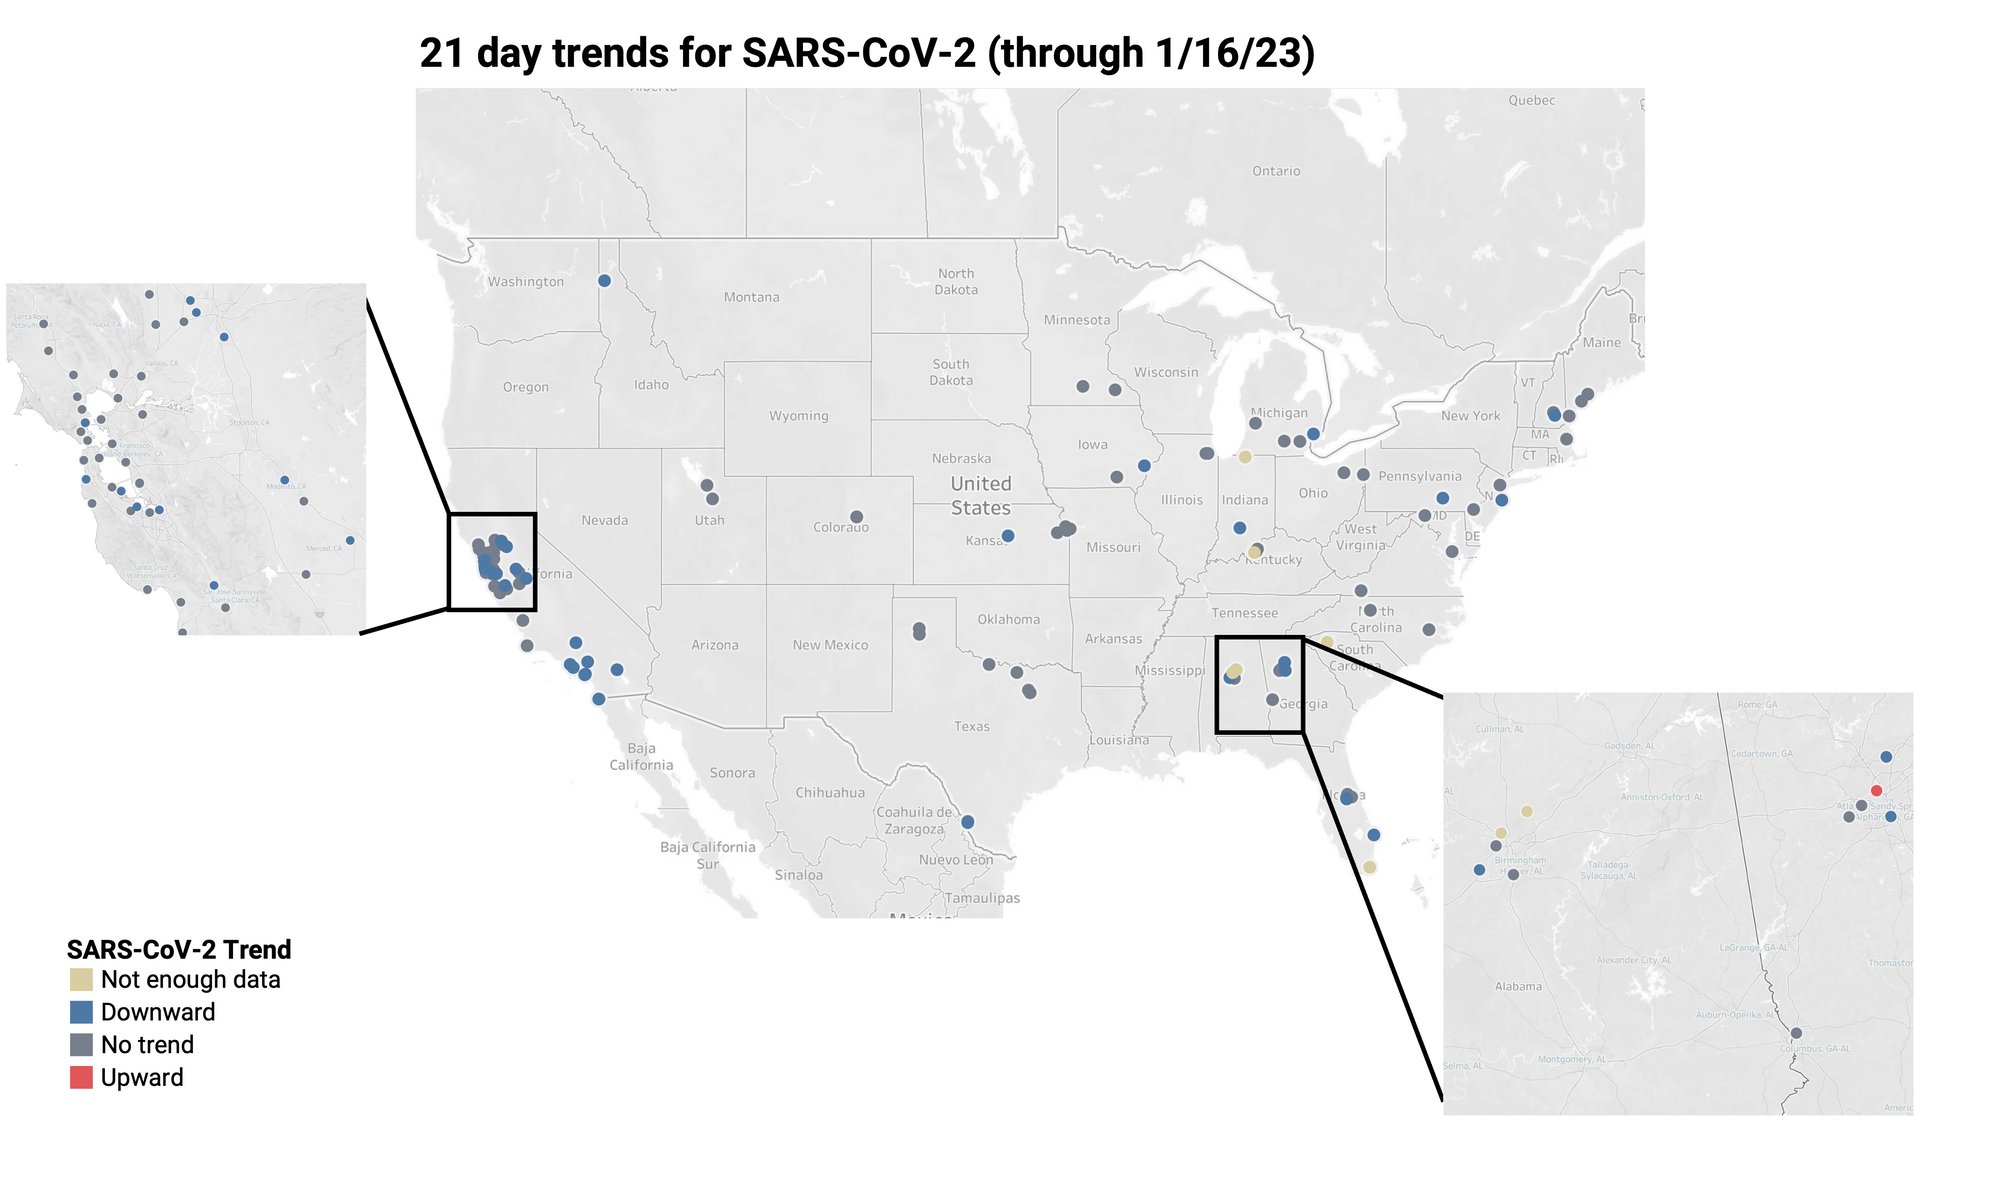
SARS-CoV-2 Trends
21-day nationwide wastewater trends
We are seeing a decrease in SARS-CoV-2 RNA concentrations in wastewater solids in many locations. Below are the concentrations from all the sites across the country in the program, those in HHS region 4, and those in Florida. All the charts in this newsletter can be viewed and explored further on our new data platform at data.wastewaterscan.org.
Below is the trend analysis for the SARS-CoV-2 RNA concentrations (normalized by PMMoV) in wastewater solids at the plants. Red indicates a significant upward trend, blue is a significant downward trend, and dark grey is no trend. Tan indicates that there were not enough data points to calculate a trend.
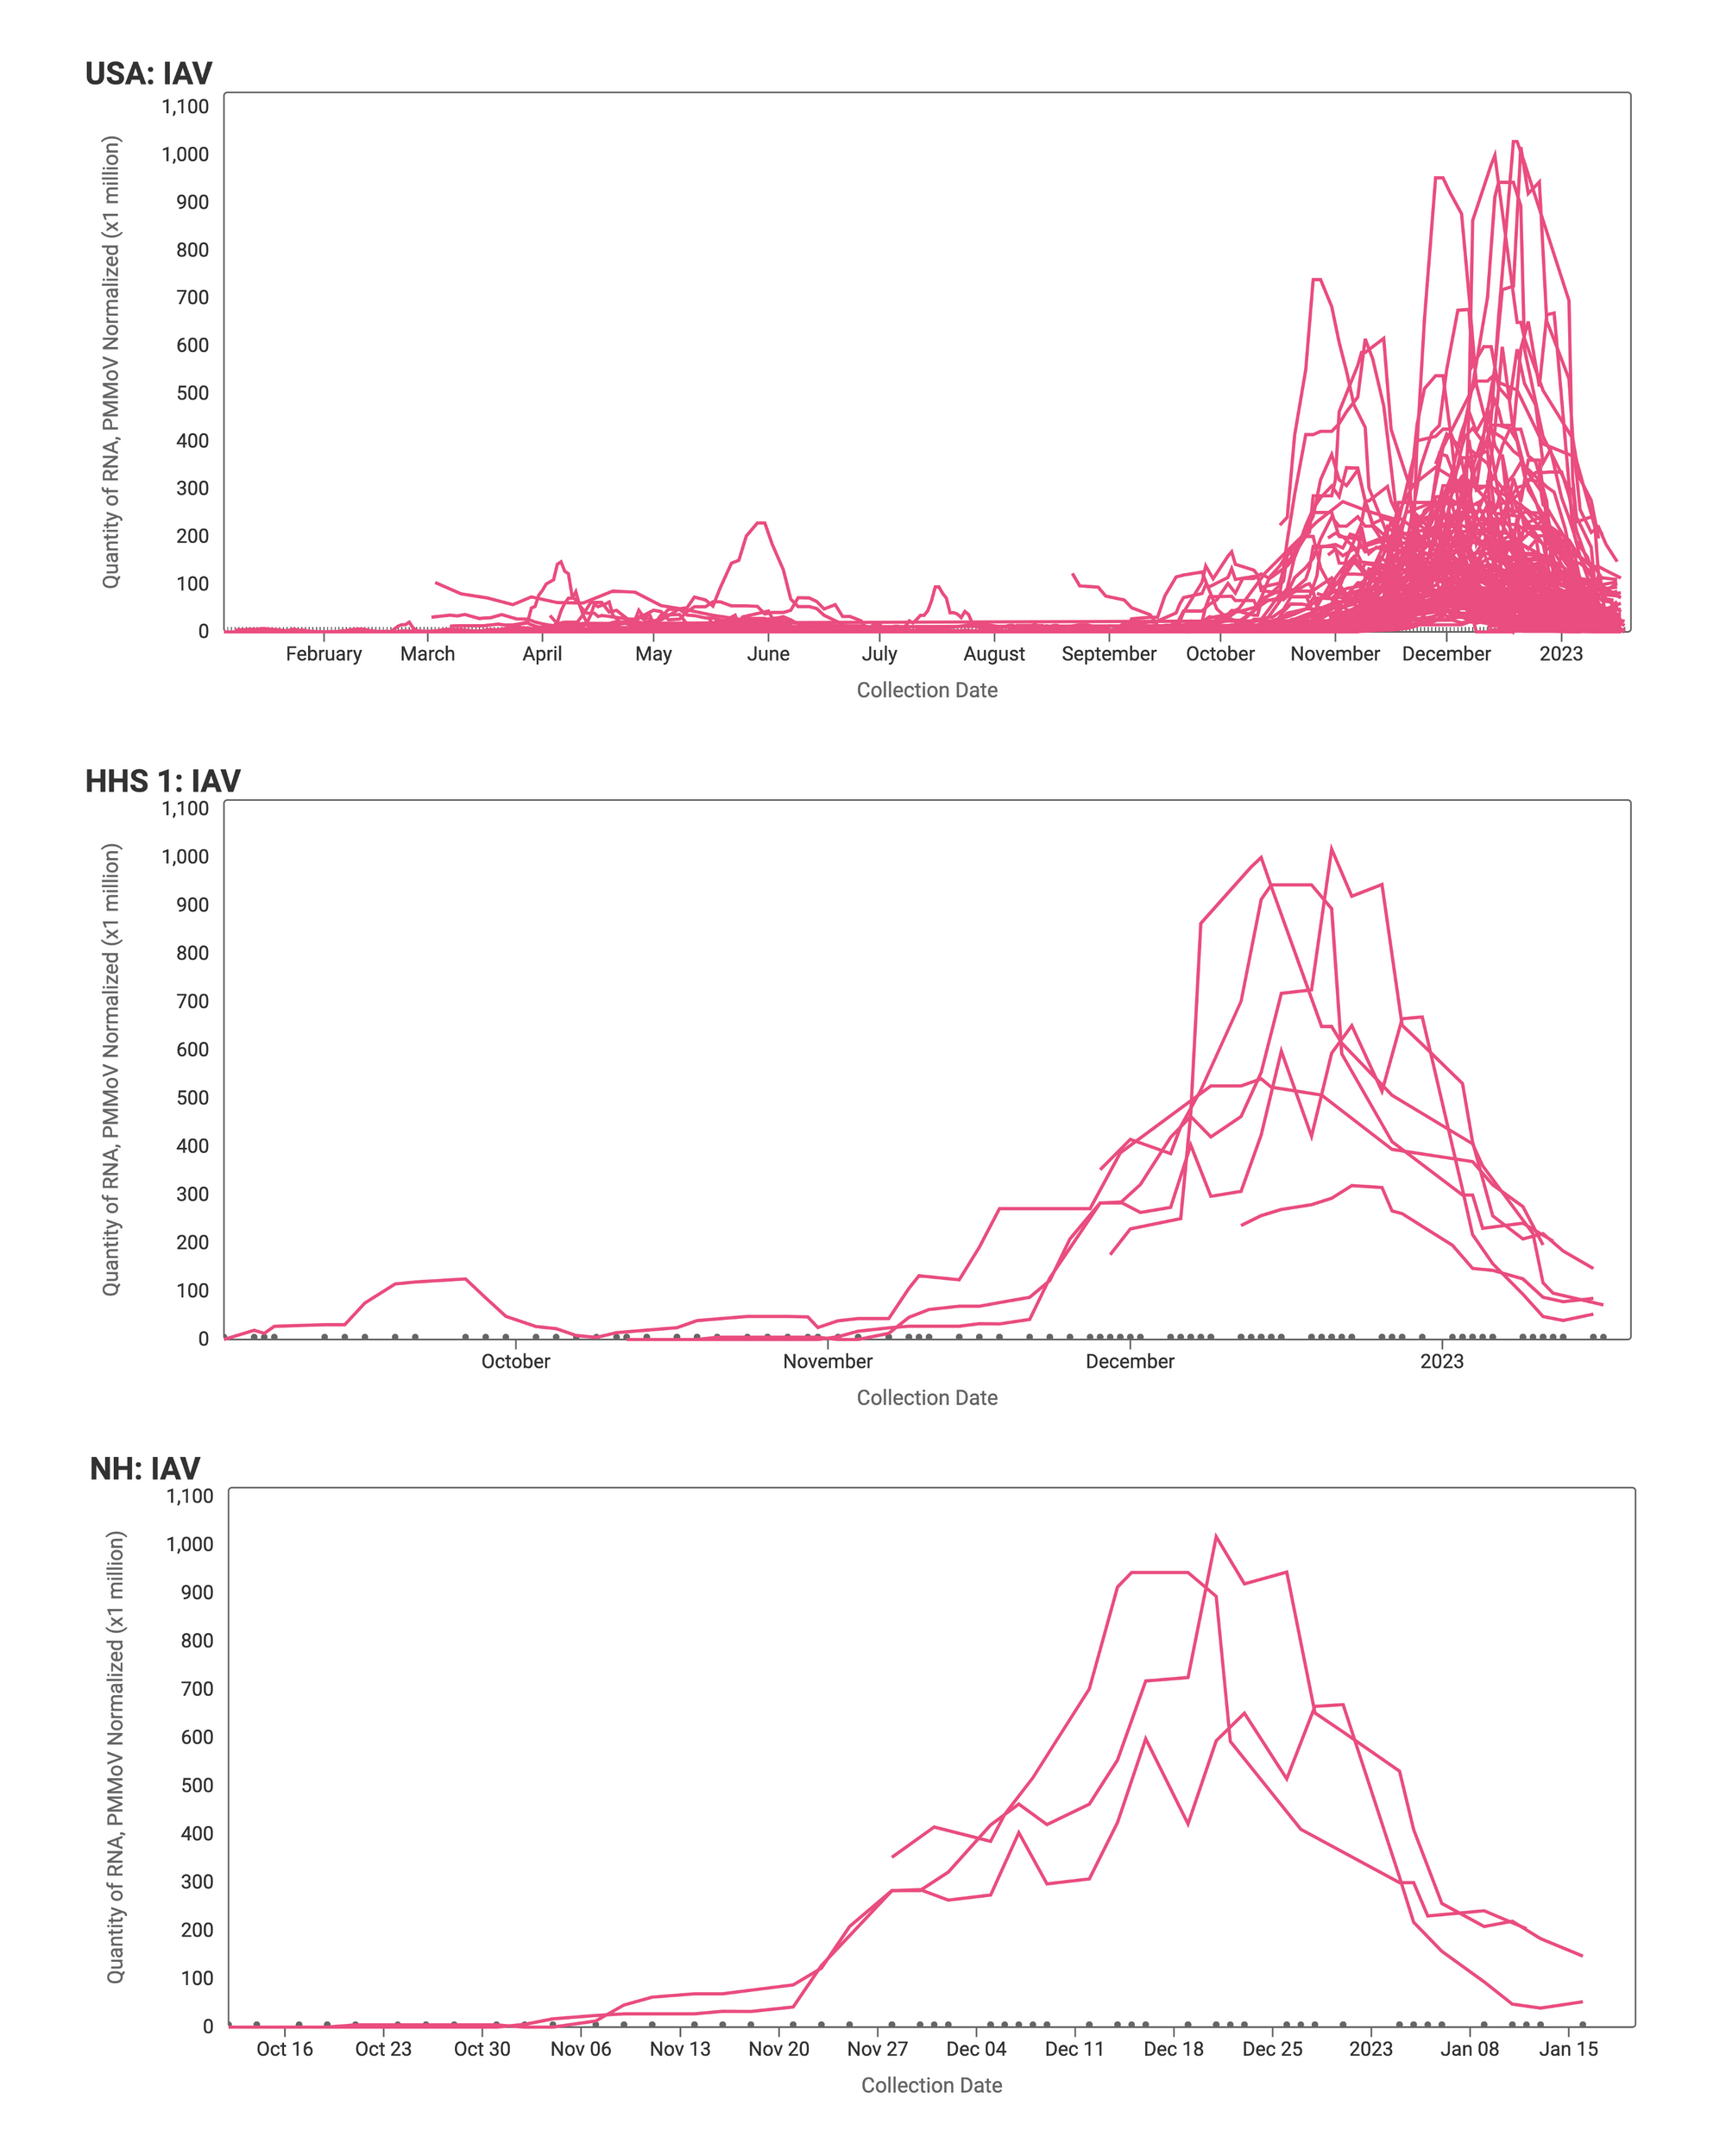
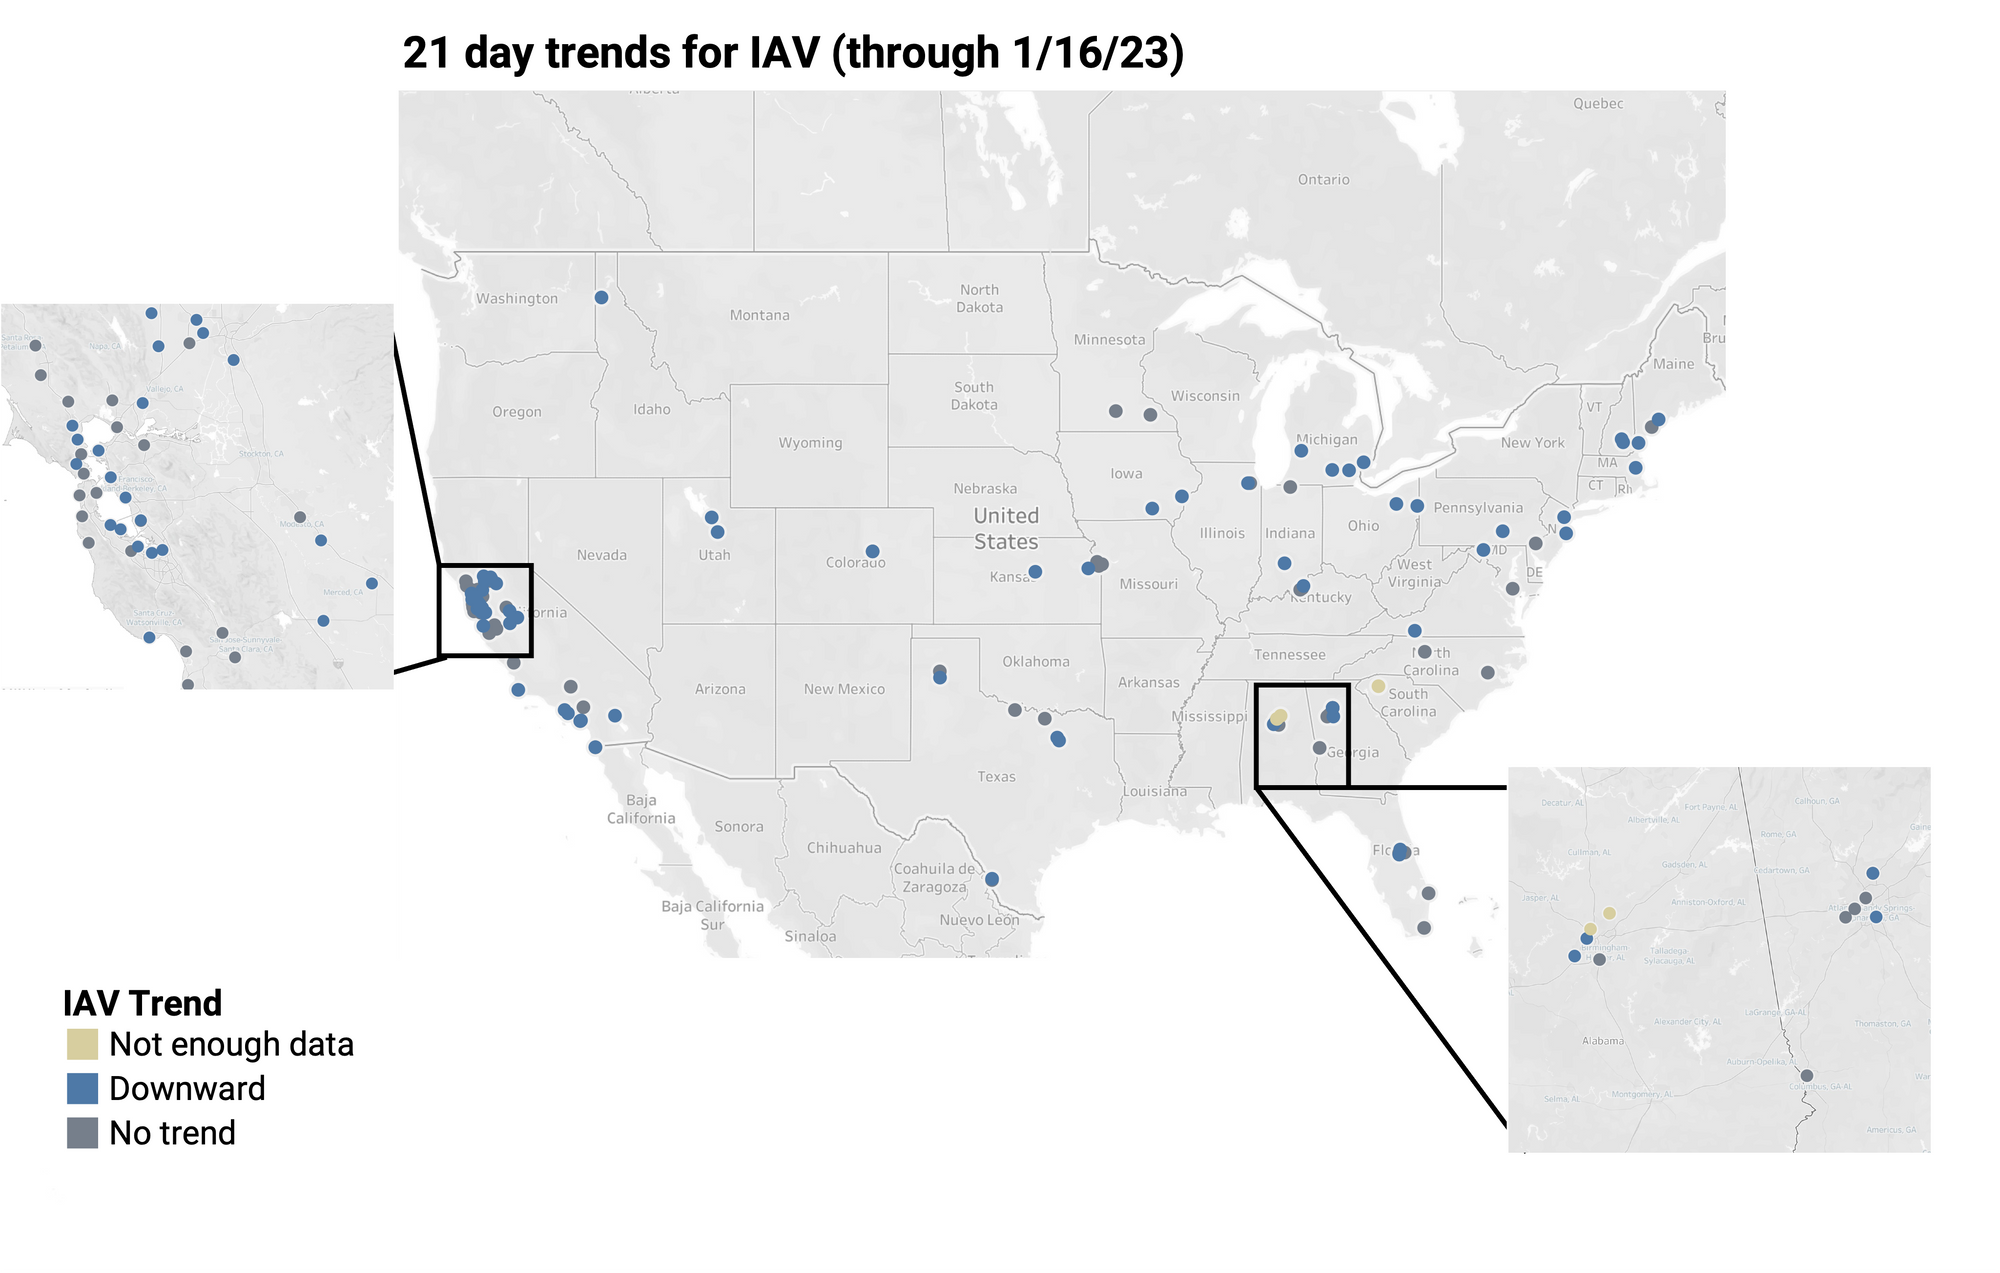
Influenza Trends
21-day nationwide wastewater trends for IAV
We continue to seeing downward trends in IAV RNA concentrations of in wastewater solids across partner plants. Examples below are from all the sites across the country in the program, HHS region 1, and New Hampshire.
Below is the trend analysis for the IAV RNA concentrations (normalized by PMMoV) in wastewater solids at the plants. Red indicates a significant upward trend, blue is a significant downward trend, and dark grey is no trend. Tan indicates that there were not enough data points to calculate a trend.
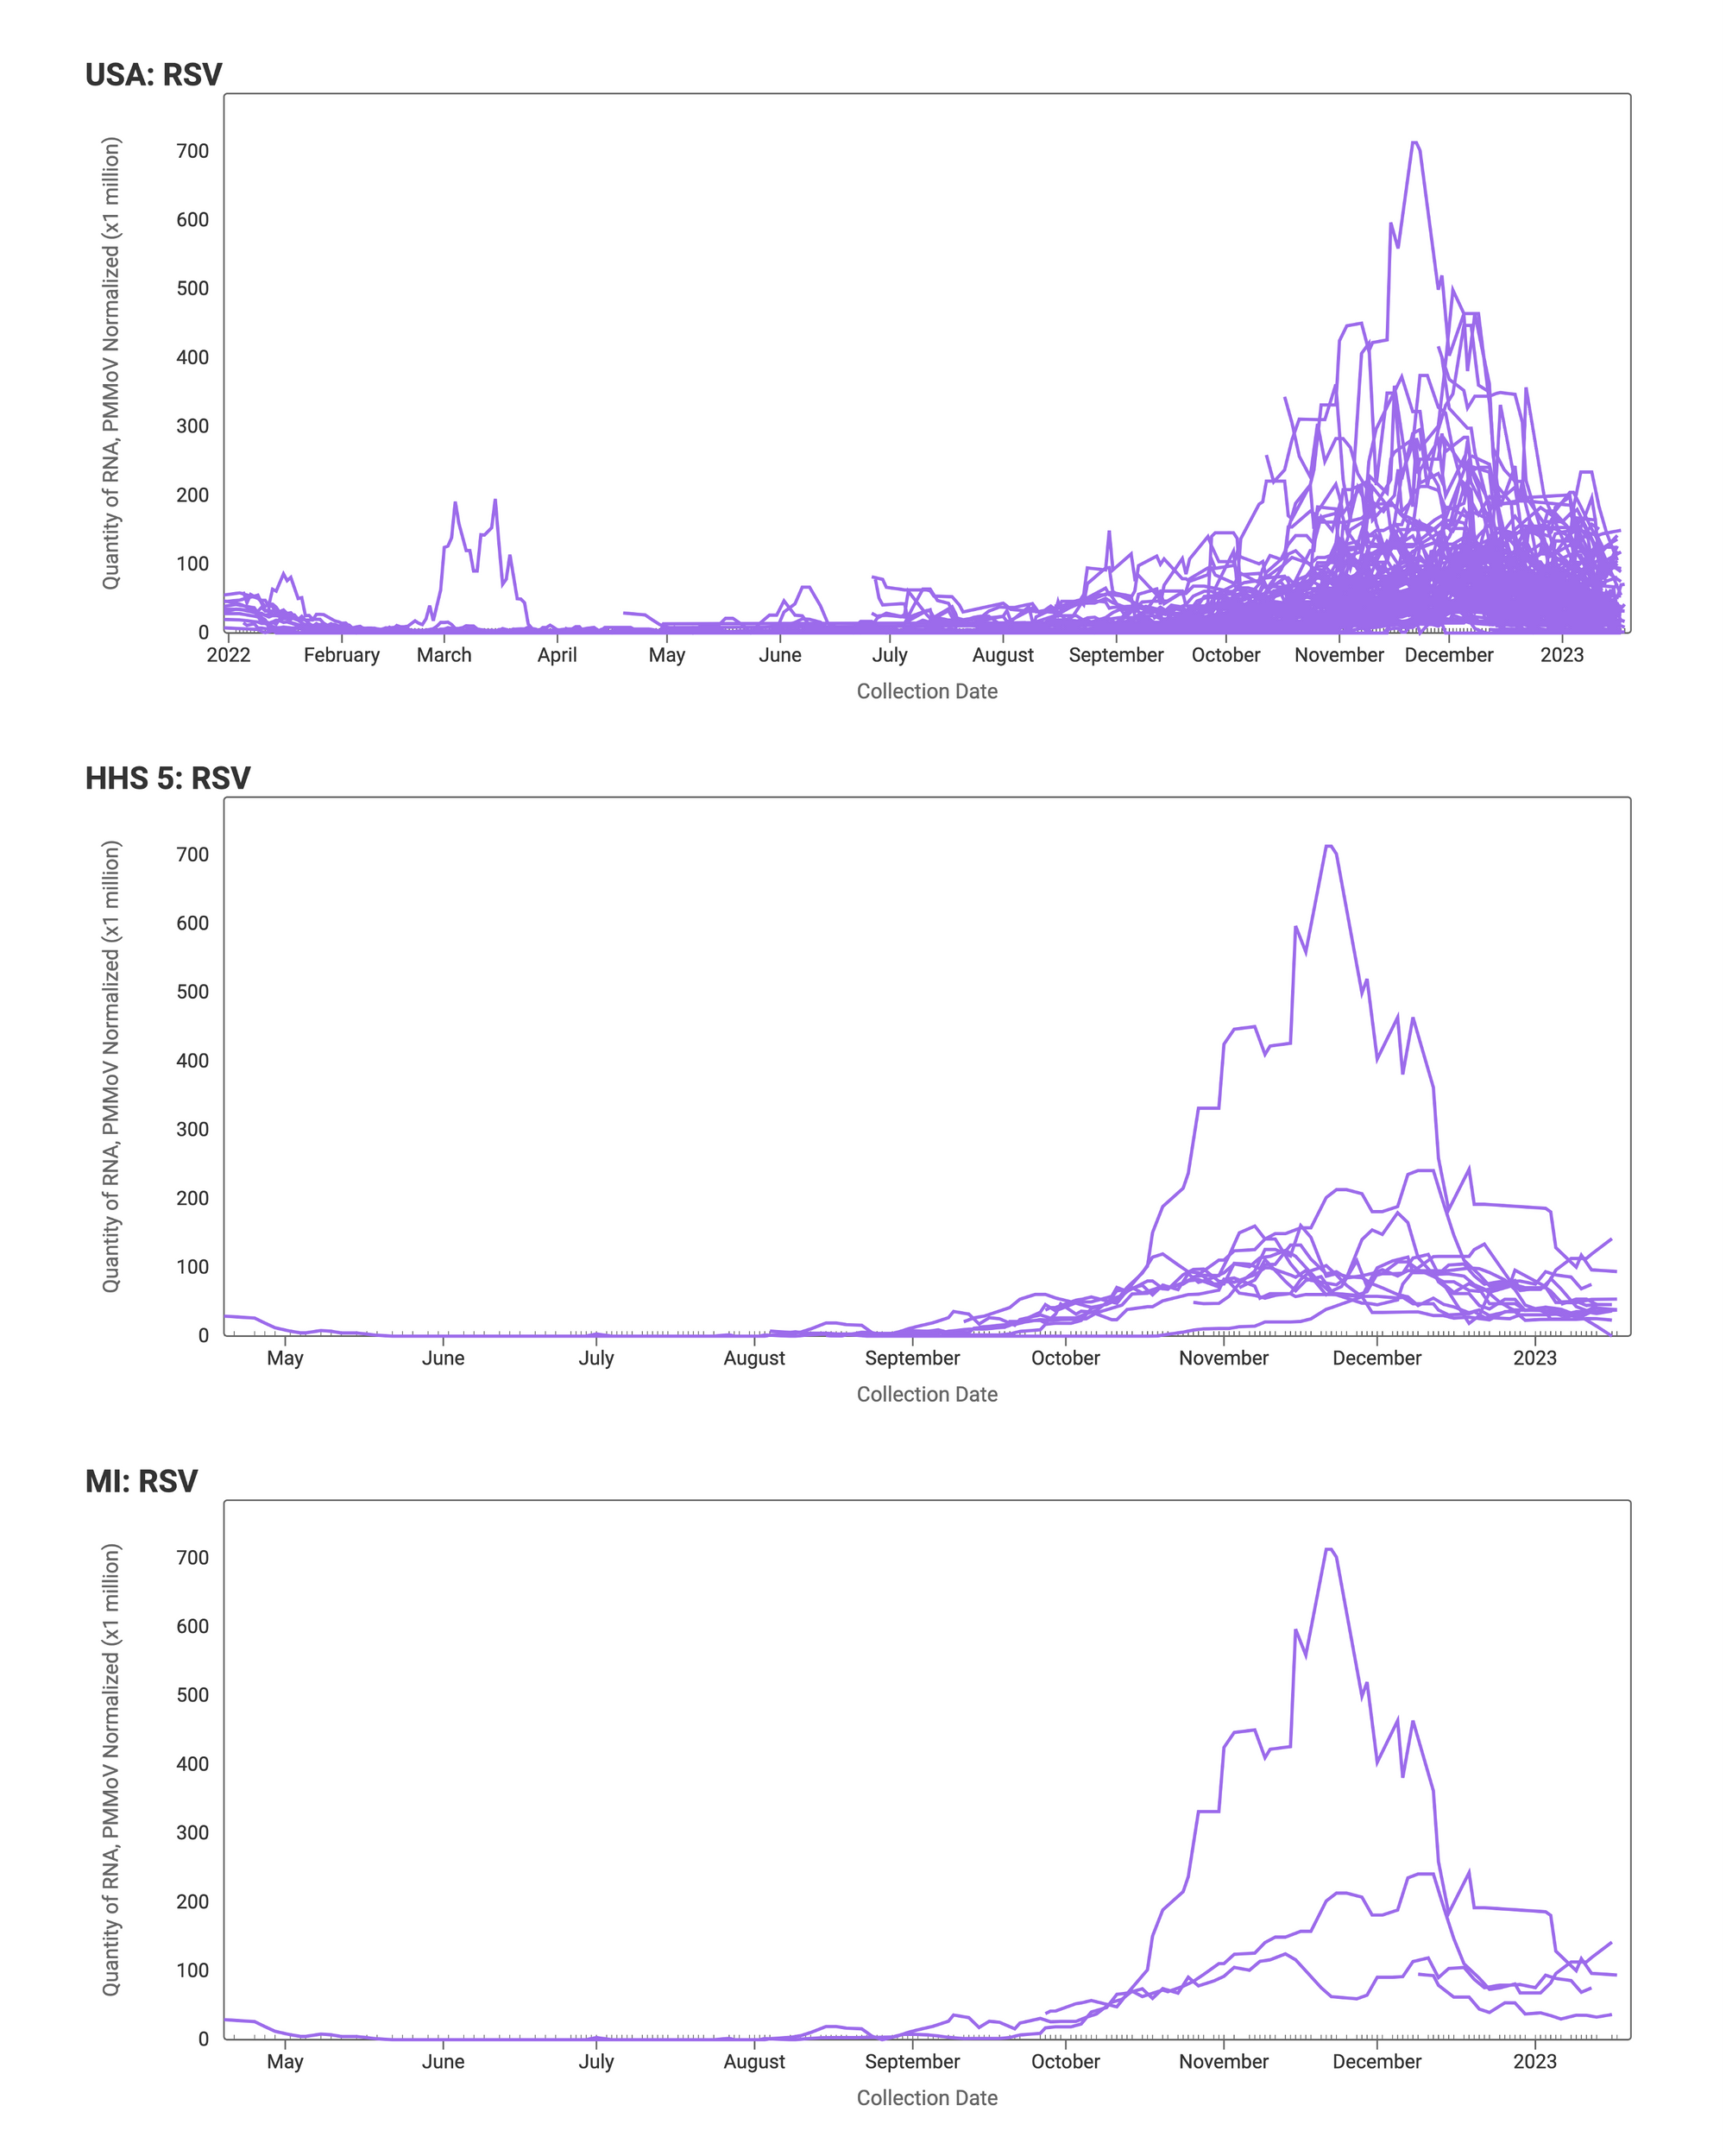
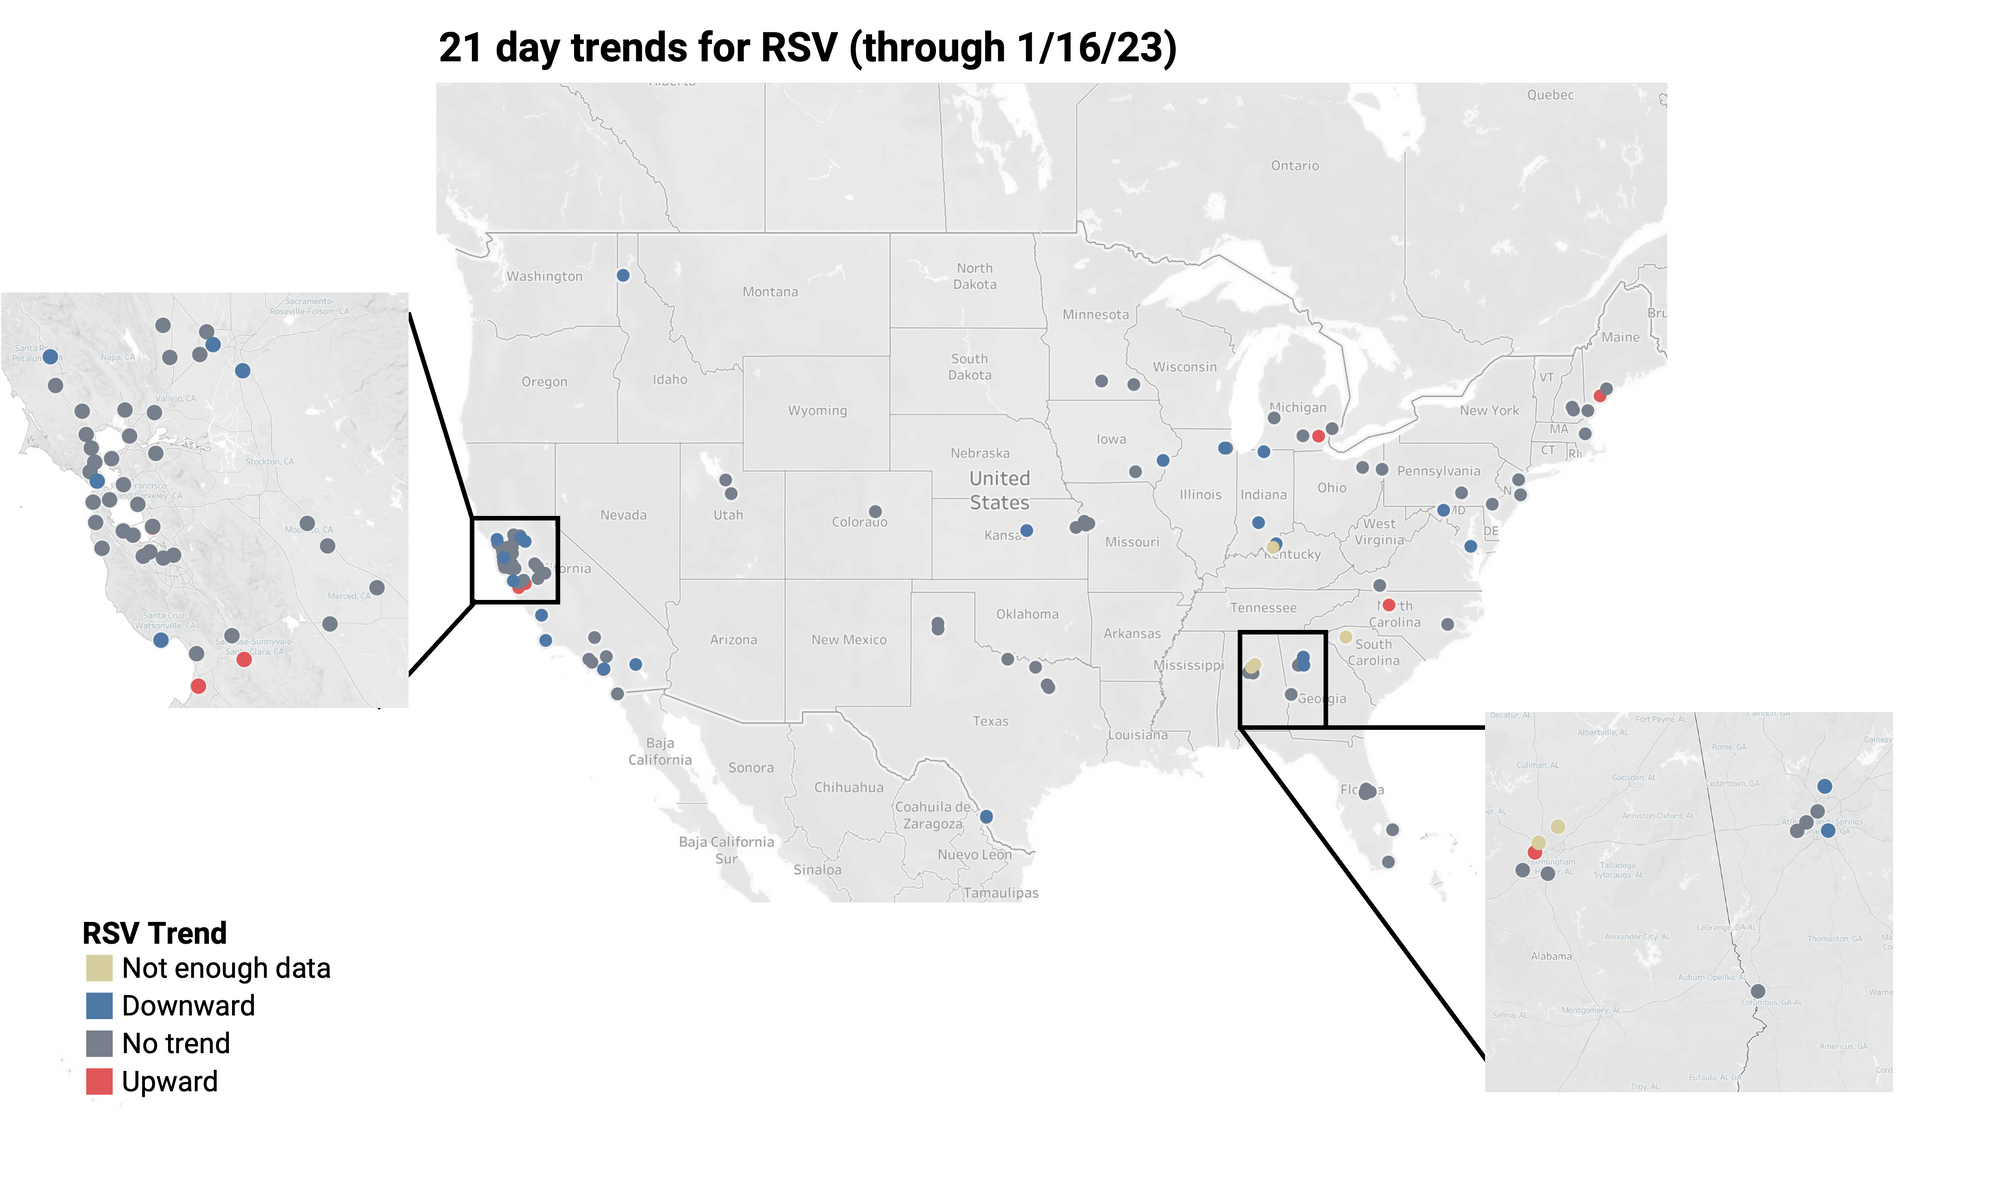
RSV Trends
21-day nationwide wastewater trends
We continue to see relatively elevated concentrations of RSV RNA in wastewater solids at participating sites. Examples below are from all the sites across the country in the program, HHS region 5, and Michigan.
Below is the trend analysis for the RSV RNA concentrations (normalized by PMMoV) in wastewater solids at the plants. Red indicates a significant upward trend, blue is a significant downward trend, and dark grey is no trend. Tan indicates that there were not enough data points to calculate a trend.
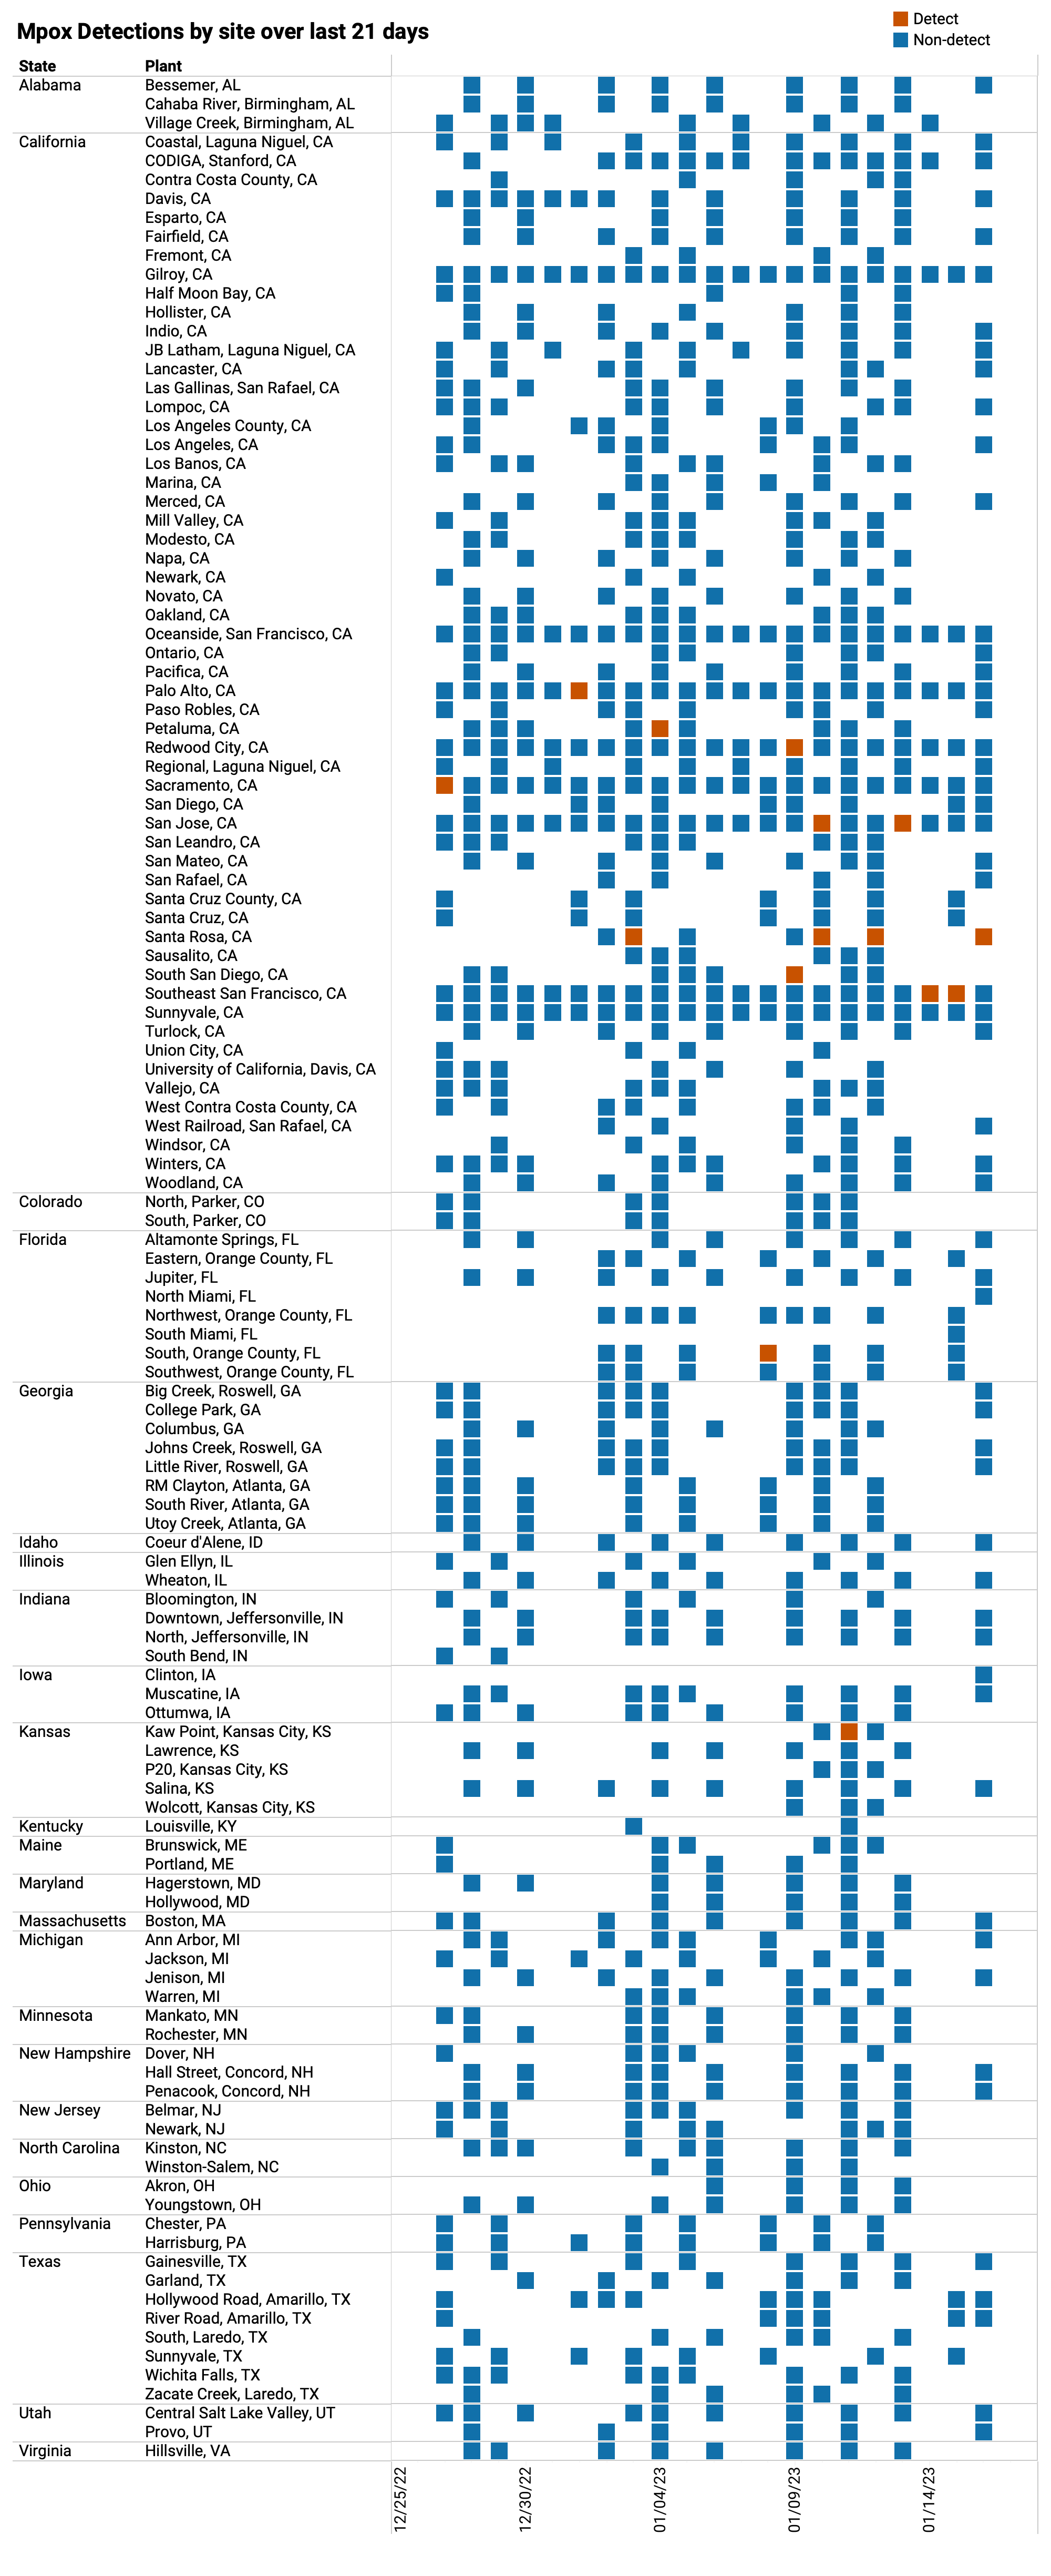
Mpox virus Trends
Detection of Mpox DNA in wastewater solids across partner sites is rare
Mpox continues to be rarely detected across all sites. Below you can see, in red, positive samples during the past 21 days. Even in locations with recent positives detections, we are not seeing consistent, increasing concentrations.
Other Targets
Influenza B (IBV), Human Metapneumovirus (HMPV) and Norovirus GII (HuNoV)
We started to monitor for IBV, HMPV, and HuNoV in mid December 2022. To date we have only 7 - 12 samples per plant so far and so aren’t ready to share trend analysis yet. Look for trends at the next stakeholder meeting on Friday February 3, 2023!
