Bay Area SCAN weekly update 1/26/23
All samples picked up by the couriers as of 1/24/23 have been processed and their data are on the site: wbe.stanford.edu. The data from the SCAN sites are also on the new site designed by Stamen data.wastewaterscan.org. If you notice any bugs on the new site or have any comments about it, please alert us.
We stopped measuring the S gene earlier this week so we could run an assay for 5 uniquely adjacent SNPs in XBB. The new primers and probe sequences are available at our protocols.io site. XBB1.5 differs from XBB by one SNP in the sequence of our reverse primer. We are still determining whether our assay picks up XBB1.5, and we may change the reverse primer so that it will be complementary to both XBB and XBB1.5 sequences in the next week or so. We will keep you posted.
Our study on MPOX DNA in wastewater in close collaboration with CDPH was published in New England Journal of Medicine last week as a correspondence. Here is the link: https://www.nejm.org/doi/full/10.1056/NEJMc2213882.
COVID-19
SARS-CoV-2 and variants
COVID-19
SARS-CoV-2 RNA concentrations continue to decrease across plants, even Southeast where concentrations were not decreasing last time we sent an update. Here is an example chart of Southeast (located in San Fran County).
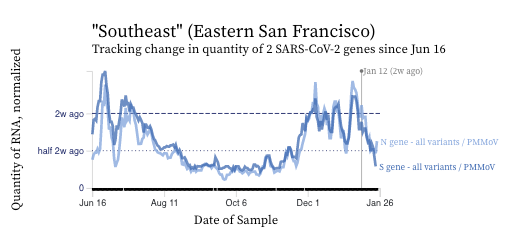
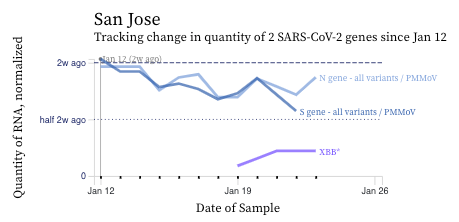
The concentrations of the HV69-70 mutation (in purple below) are now clearly lower than the N and S gene concentrations suggesting a variant without the mutation is gaining traction in the communities. You can see the first few measurements from the XBB assay in light purple. Recall HV69-70 is present in BA.5 and BQ.* sublineages.
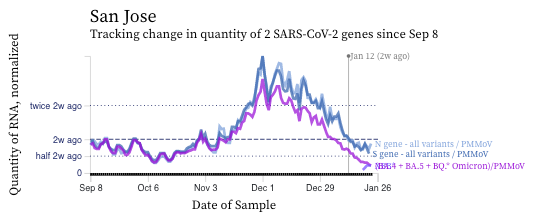
I have zoomed in on the last 2 weeks in the chart below so you can see that we stopped measuring S and you can see the XBB levels.
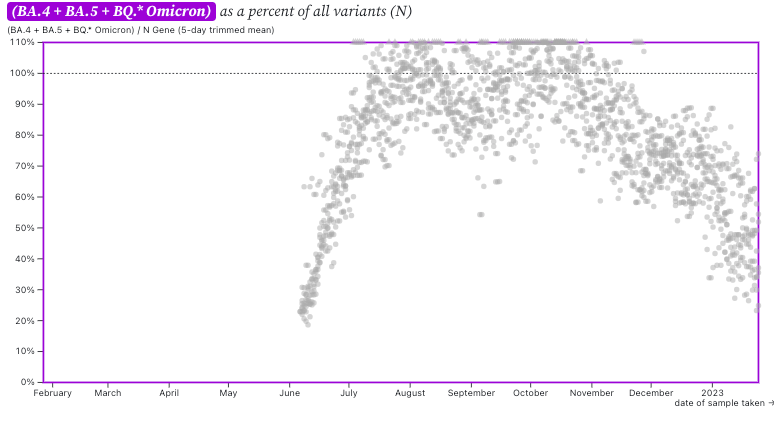
The ratio of HV69-70/N across the plants as shown in this chart below. If the ratio is at 100%, it suggests that all the SARS-CoV-2 genomes have the mutation HV69-70 (and we infer that all genomes are from BA.5 or BQ.*). The grey symbols are from all the plants in SCAN (you can access the plot and play around with it here). The current regional ratio of HV69-70/N appears to be about 40-50%, similar to the value I reported in this update last week. Next week, we will likely have a visualization like this for XBB. Based on the ratio of XBB mutations measured by the XBB assay to the N gene in daily samples, the regional average of this ratio is 30% (range 10% - 70%) at the SCAN plants between 1/21/23 and 1/24/23.
We have sequencing data from wastewater from San Jose, Sacramento, and Oceanside through the week ending 15 January 2023. That data suggests occurrence of XBB and XBB1.5 to be about 20%, on average, of all SARS-CoV-2 genomes in wastewater from these three sites where as BA.2.75 could be 1-10%.
Other respiratory viruses
IAV, IBV, RSV, and HMPV
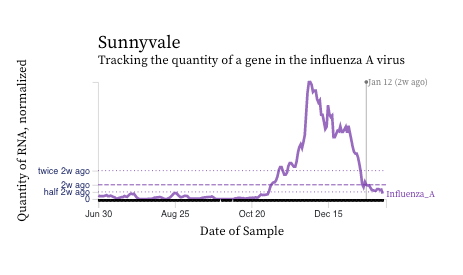
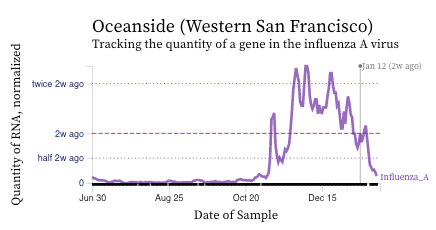
Influenza A (IAV) RNA concentrations are dropping across the plants suggesting contributions from infected individuals into the wastewater are declining. Last week, the concentrations if IAV RNA at plants in San Fran County had not started to clearly decrease, but their levels are now clearing going down. Here are two example charts from Sunnyvale (Santa Clara County) and Oceanside (SF County).
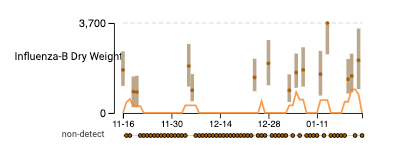
Influenza B (IBV) RNA concentrations continue to be sporadically detected at low concentrations. Here is an example of data from the drilldown page for Sunnyvale. The units of the y-axis are copies of IBV RNA per gram dry weight of solids and the scale is linear.
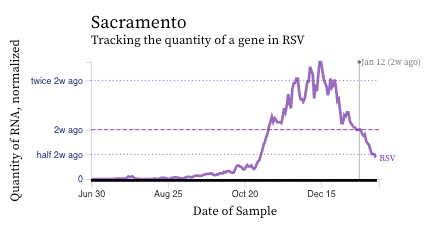
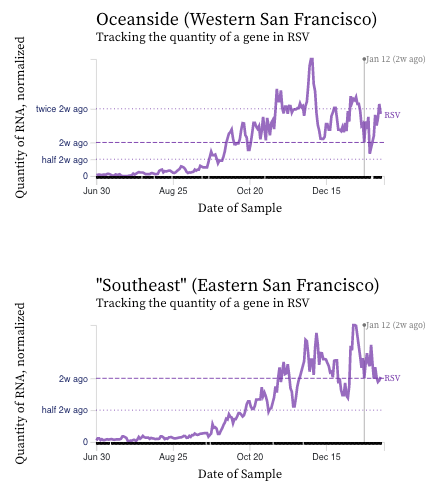
RSV RNA concentrations are falling at most plants across the last week or two (see example chart from Sacramento). But oddly, the SF plants are not showing the decrease.
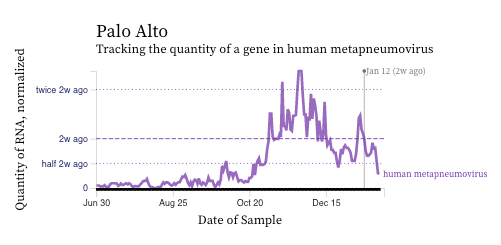
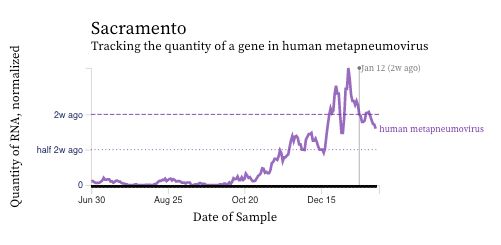
HMPV (human metapneumovirus) RNA concentrations have either decreased over the past 2 weeks (example of Palo Alto below) or stayed constant (example of Sacramento below). HMPV is still elevated and detectable at all plants indicating that it is still circulating.
Norovirus
Assay detects human norovirus GII
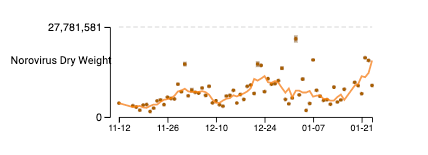
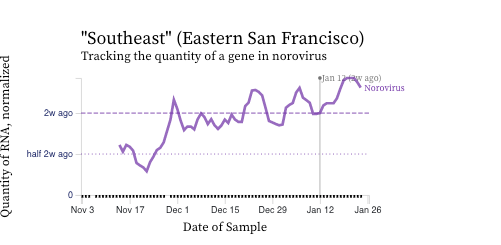
Norovirus GII RNA concentrations have been measured for about 11 weeks now at all the SCAN plants. We have observed concentrations between 10^3 cp/g and 10^9 cp/g. Data are hovering near high levels; trends are mixed across plants. The concentrations on the y-axis are on a linear scale and are in units of copies per gram dry weight. Another example from the non-COVID page on the website (here) is shown for Oceanside (same plant). Note that the assay we use targets human norovirus GII which is a common genotype of norovirus, but GI can also circulate.
MPOX Virus
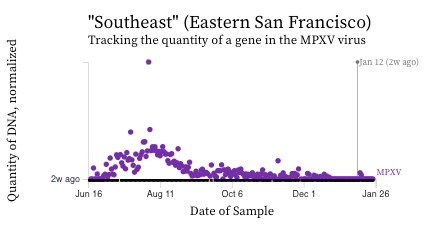
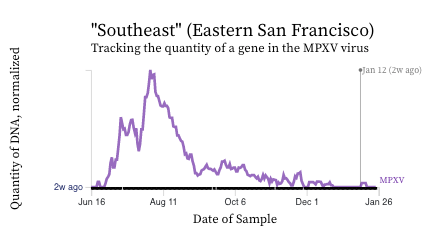
MPXV. We see non-detects in the past 2 weeks for MPXV DNA at most plants. We measured 2 detections over the last 14 days at Southeast, and 1 in San Jose.
Here are charts of the MPXV DNA data from Southeast showing the raw data (dots in top chart) and 5-d trimmed, centered averages (lines in bottom chart) of PMMoV normalized MPXV DNA over the last 30 weeks - recall this plant historically had the highest concentrations of MPXV DNA. Thank you Zan for changing the axis to say DNA last week. :)