Bay Area SCAN weekly update 2/3/23
All samples picked up by the couriers as of 2/1/23 have been processed and their data are on the site: wbe.stanford.edu. The data from the SCAN sites are also on the new site designed by Stamen data.wastewaterscan.org. If you notice any bugs on the new site or have any comments about it, please alert us.
We stopped measuring the S gene so we could run an assay for 5 uniquely adjacent SNPs in XBB*. The new primers and probe sequences are available at our protocols.io site. The new assay is designed to detect both XBB and XBB1.5.
COVID-19
SARS-CoV-2 and variants
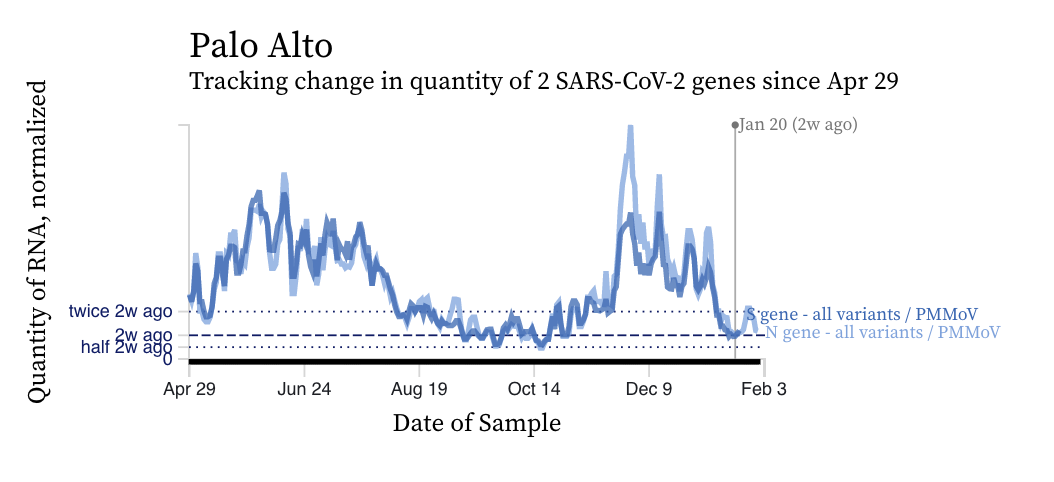
SARS-CoV-2 RNA concentrations continue to decrease across plants from the last local maximum that began around Thanksgiving. Although concentrations are relatively low, they are still two orders of magnitude (100 times) higher than our detection limit. Concentrations have been relatively flat over the last two weeks. Here is an example from Palo Alto.
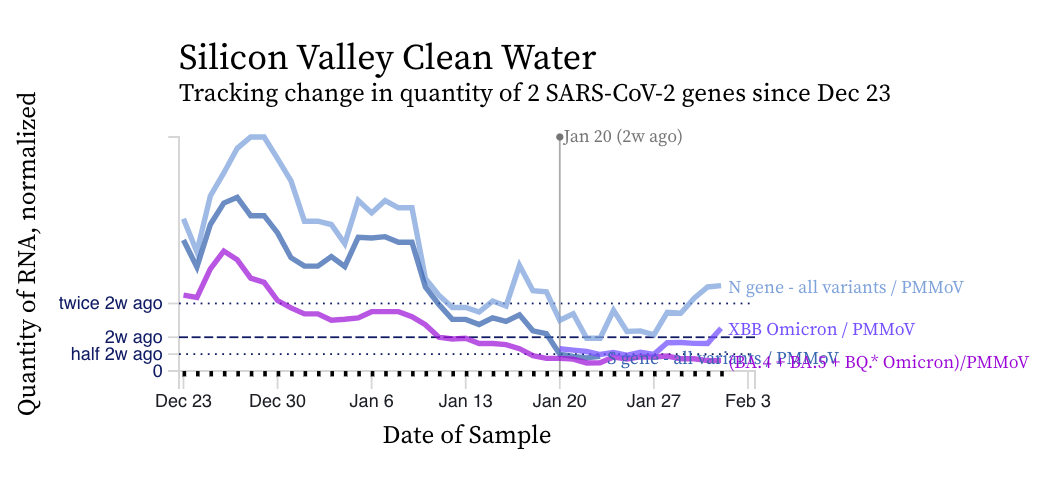
The concentrations of the HV69-70 mutation (in bright purple below) are now clearly lower than the N gene concentrations suggesting a variant without the mutation is gaining traction in the communities. Recall HV69-70 is present in BA.5 and BQ.* sublineages. You can see the first approximate week of measurements from the XBB* mutation assay in light purple. The concentration of the XBB* mutation is trending upward.
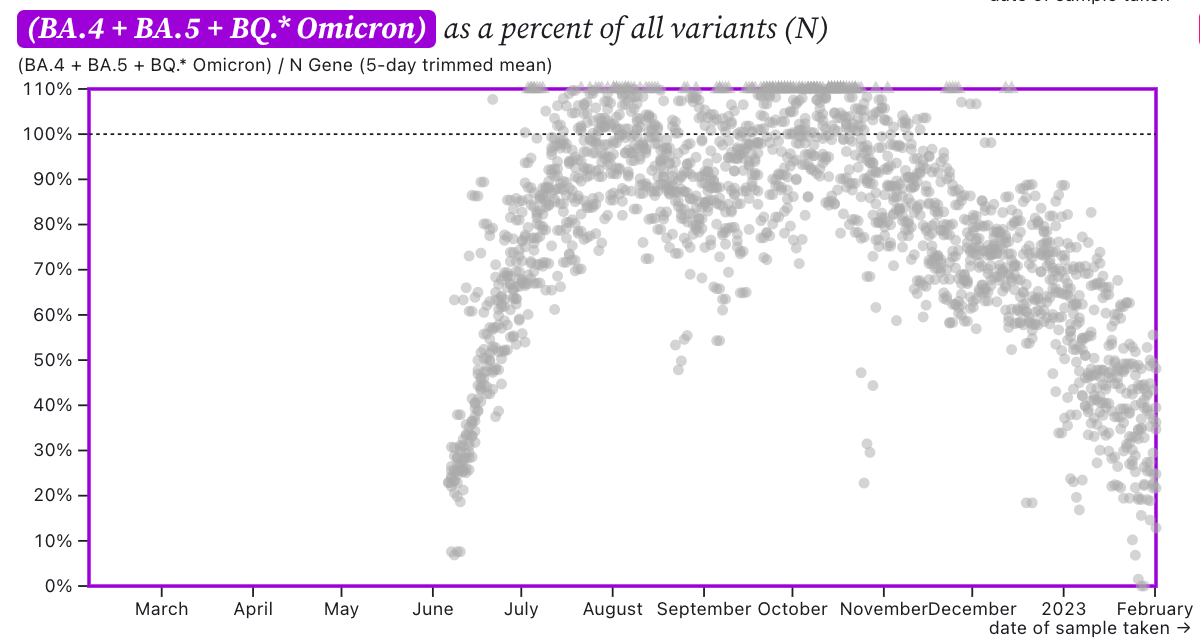
The ratio of HV69-70/N across the SCAN plants is shown in this chart below. If the ratio is at 100%, it suggests that all the SARS-CoV-2 genomes have the mutation HV69-70 (and we infer that all genomes are from BA.5 or BQ.*). The grey symbols are from all the plants in SCAN (you can access the plot and play around with it here). The current regional ratio of HV69-70/N appears to be about 30-40% suggesting 30-40% of the infections are caused by BA.5 or BQ.* variants.
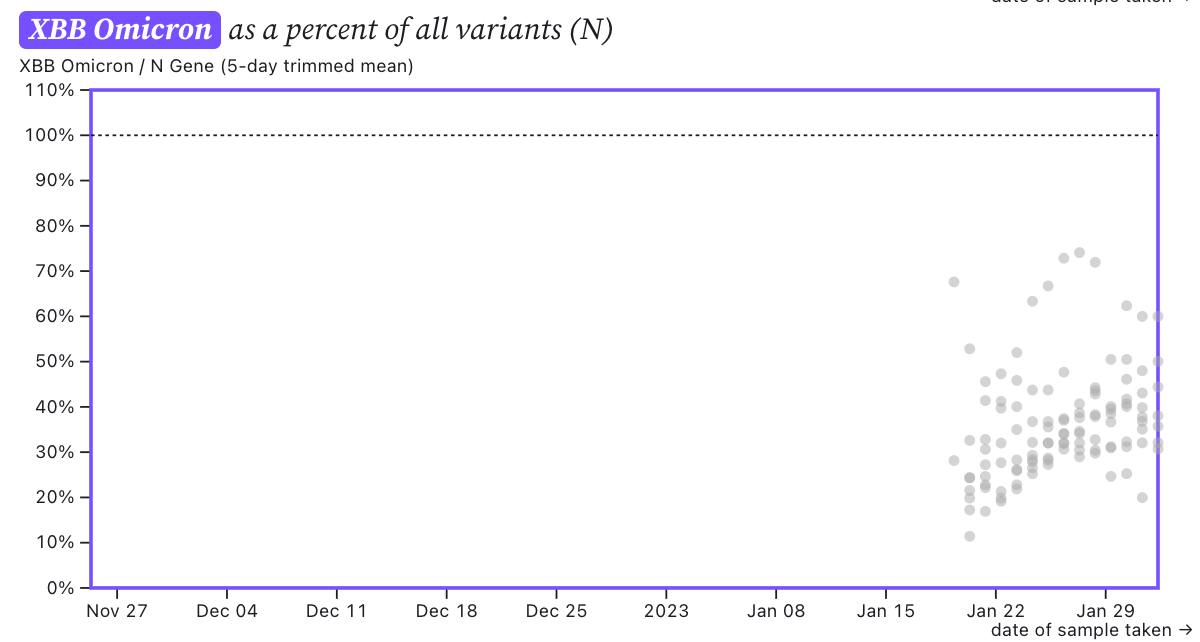
The ratio of the XBB* mutations/N across SCAN plants is shown in the chart below and it can read the same as the chart above. It suggests that the regional average ratio XBB* mutations/N is ~30-40%, and there is an increasing trend. This suggests 30-40% of infections in the communities are caused by XBB or XBB1.5 and the level is increasing.
Other respiratory viruses
IAV, IBV, RSV, and HMPV
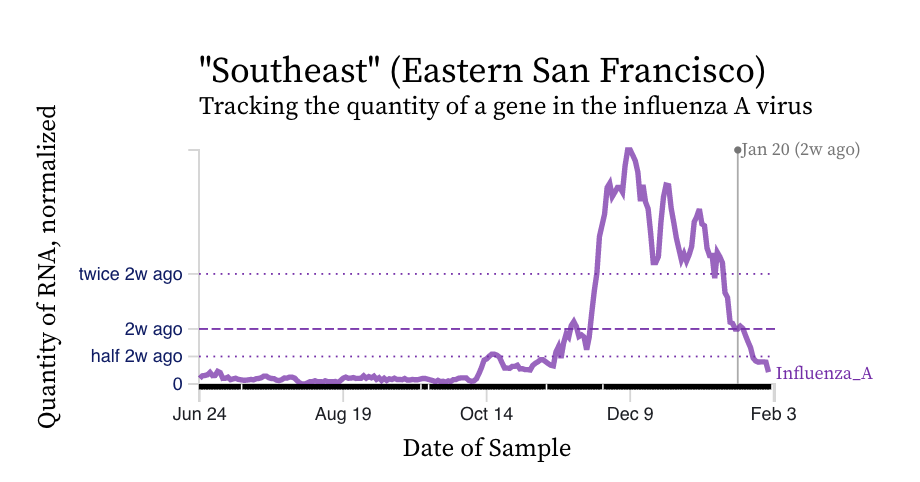
Influenza A (IAV) RNA concentrations have dropped precipitously across the plants. Here is an example chart from Southeast in San Francisco. IAV concentrations are near our detection limit and we have even had a few non-detects at some plants.
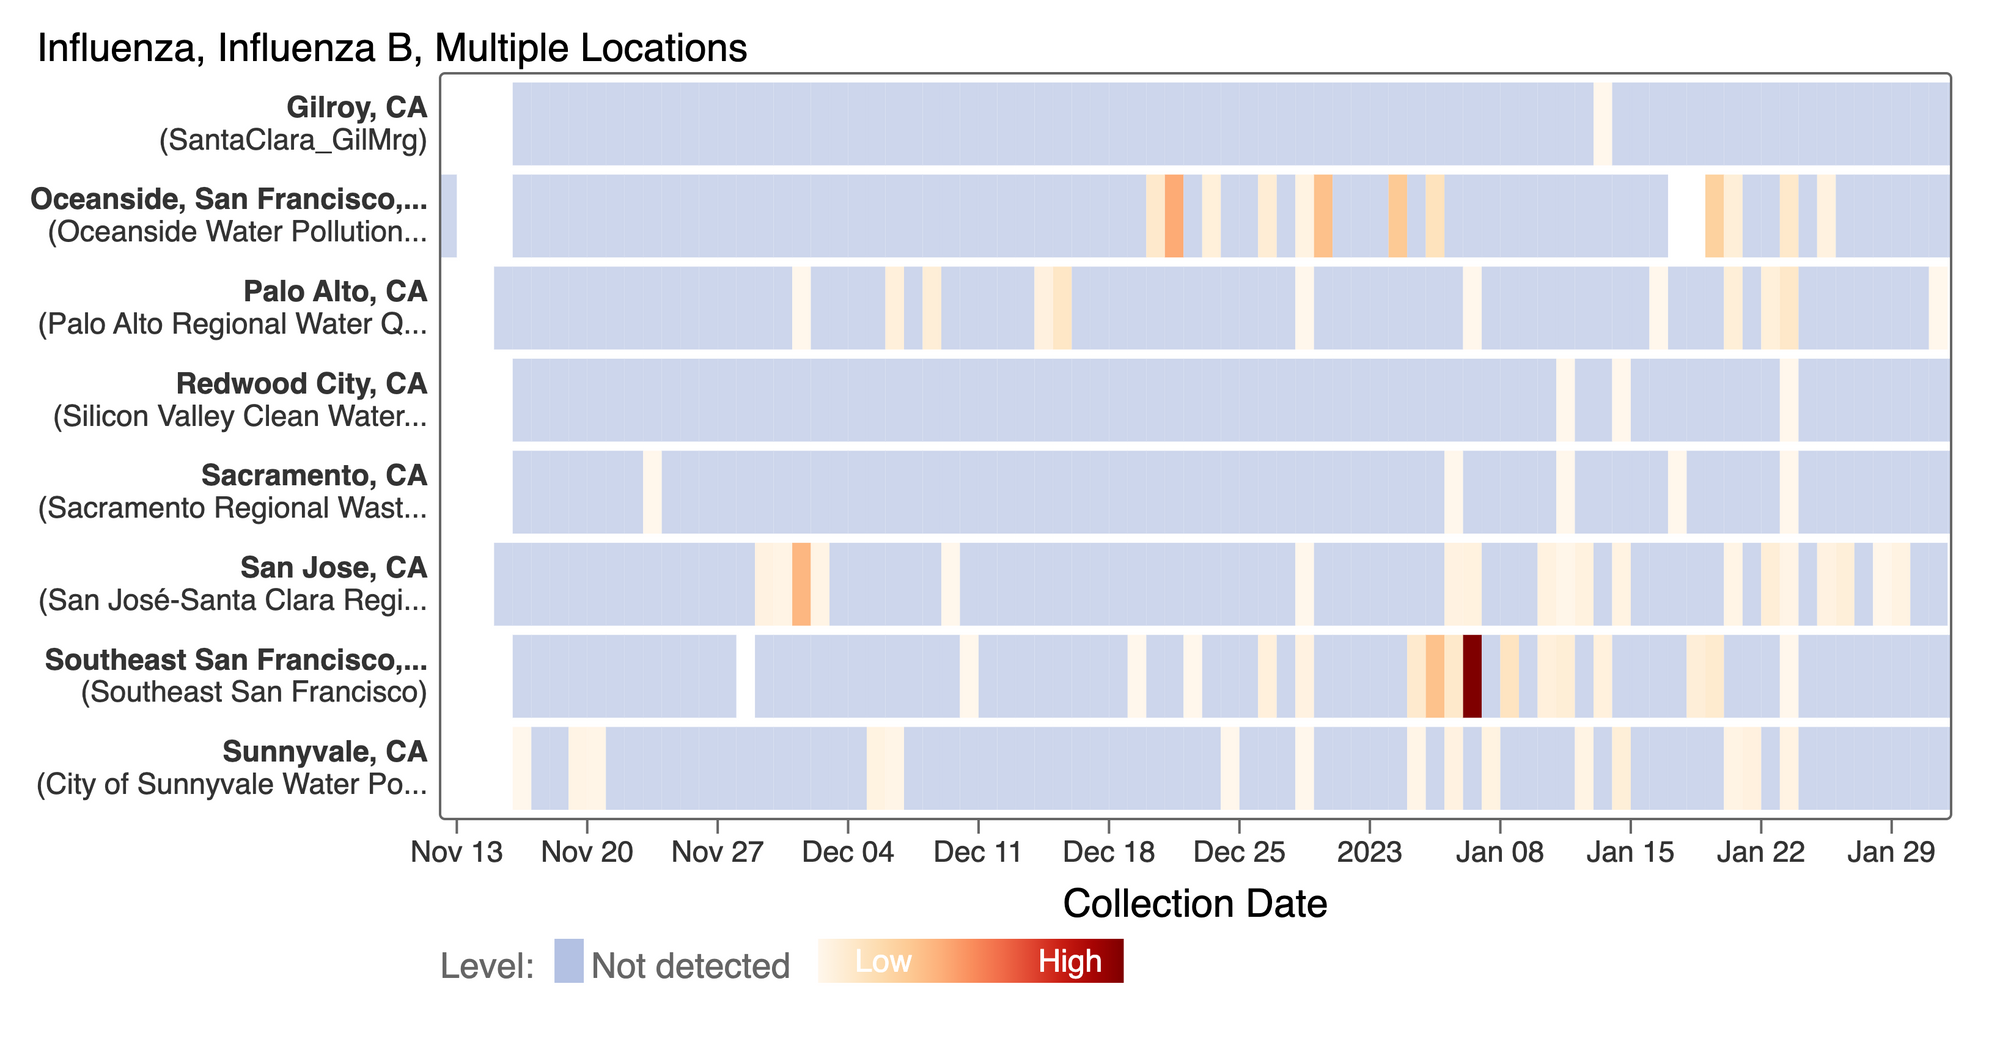
Influenza B (IBV) RNA concentrations continue to be sporadically detected at low concentrations at the SCAN plants. This heat map shows all the SCAN sites as a row, and each date as a column. The color blue means the sample was non-detect for IBV and the colors get darker with higher concentrations. So far, we have had mostly non-detects and sporadic detections which is consistent with low detection of IBV infections currently by clinical testing. [Note - this chart is from the data.wastewaterscan.org site.]
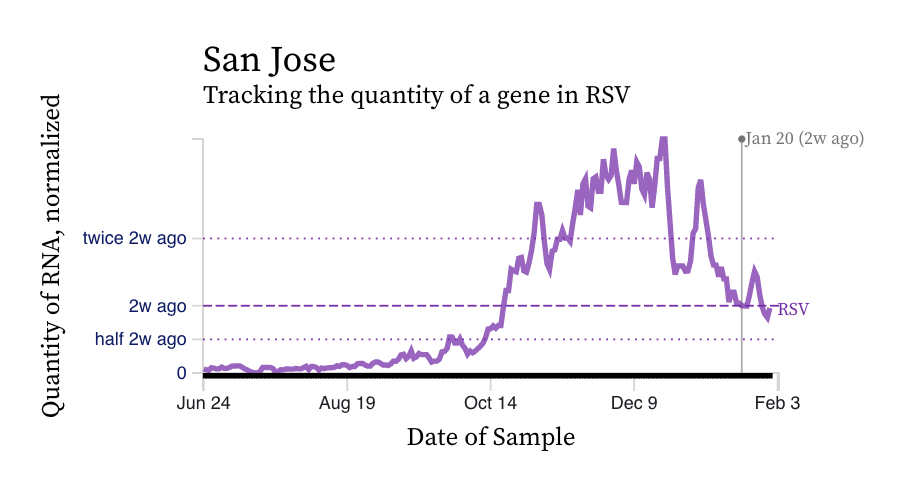
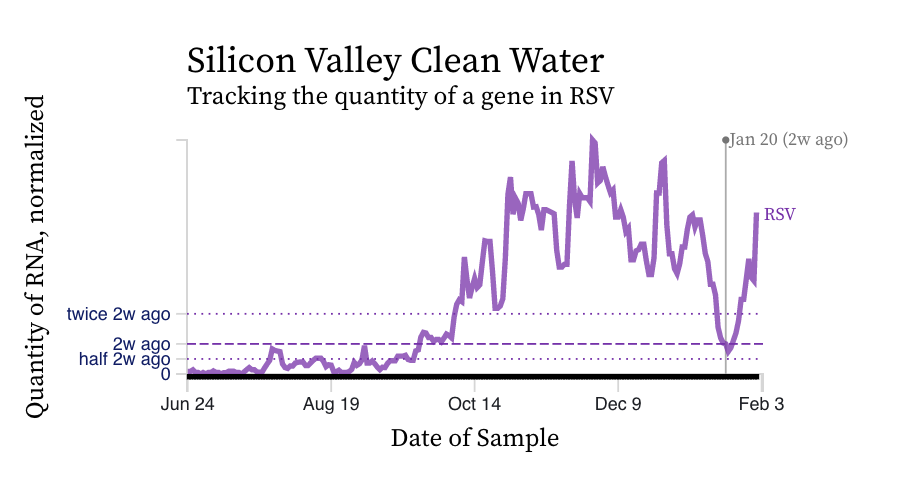
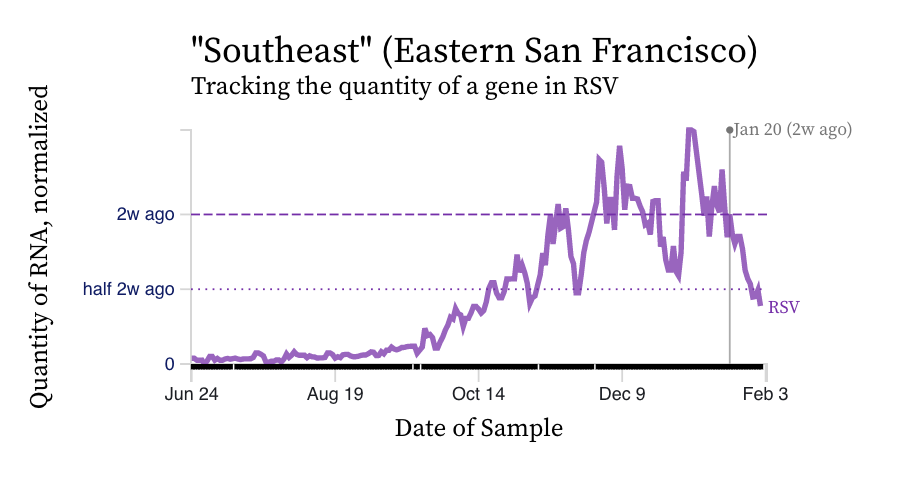
RSV RNA concentrations trends are not similar to IAV. While levels have decreased from their highest levels, concentration remain elevated at ~ 10,000 copies/g, ten times our lower detection limit. While some plants' trends have been constant over the last two weeks (San Jose), others are increasing (Silicon Valley Clean Water) and others decreasing (Southeast).
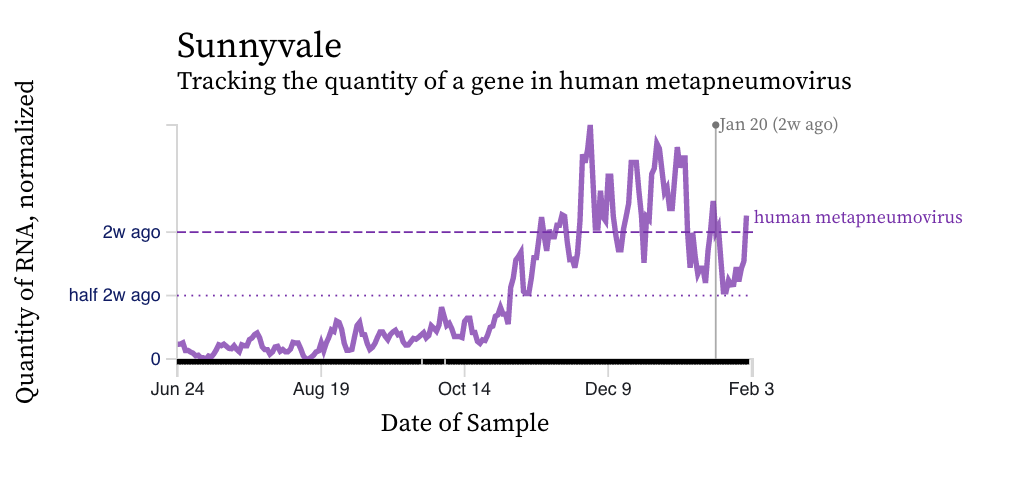
HMPV (human metapneumovirus) RNA concentration trends are more similar to RSV than IAV. There is a diversity of trends, but all data suggest the virus is still circulating, and being shed into wastewater in the communities, albeit with fewer inputs into the plants now than a month ago.
Norovirus
Assay detects human norovirus GII
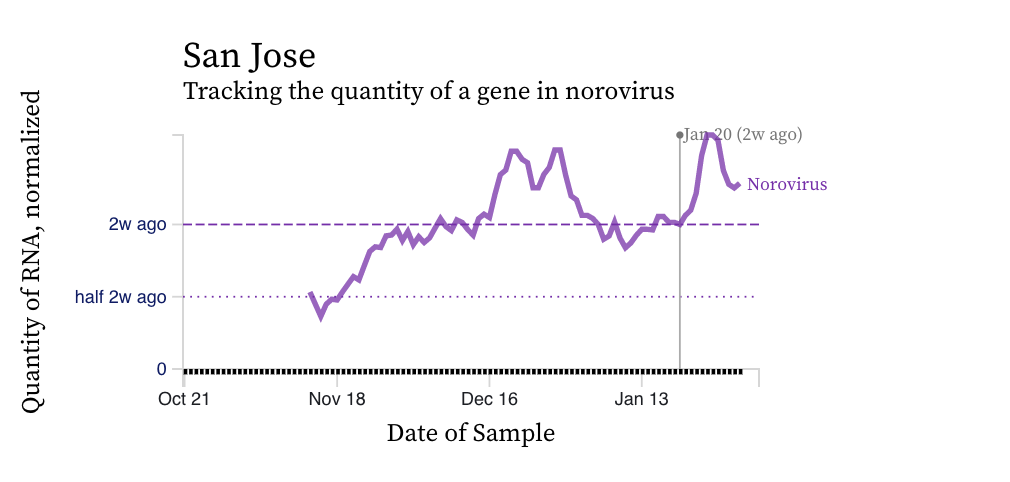
Norovirus GII RNA concentrations are high relative to concentrations of SARS-CoV-2. The median is 10^7 copies per gram dry weight (the highest we measure SARS-CoV-2 at is about 10^6 copies per gram). Norovirus GII trends vary across plants and an example chart is below for San Jose. Norovirus GII can be shed in feces of newly infected individuals at concentrations as high as 10^11 copies per gram stool, so the high concentrations we are observing are not unrealistic. A modeling exercise could be done to relate the concentrations we observe to the number of people shedding since there are some good shedding data for norovirus GII. We do not measure norovirus GI, which can also be present in wastewater.
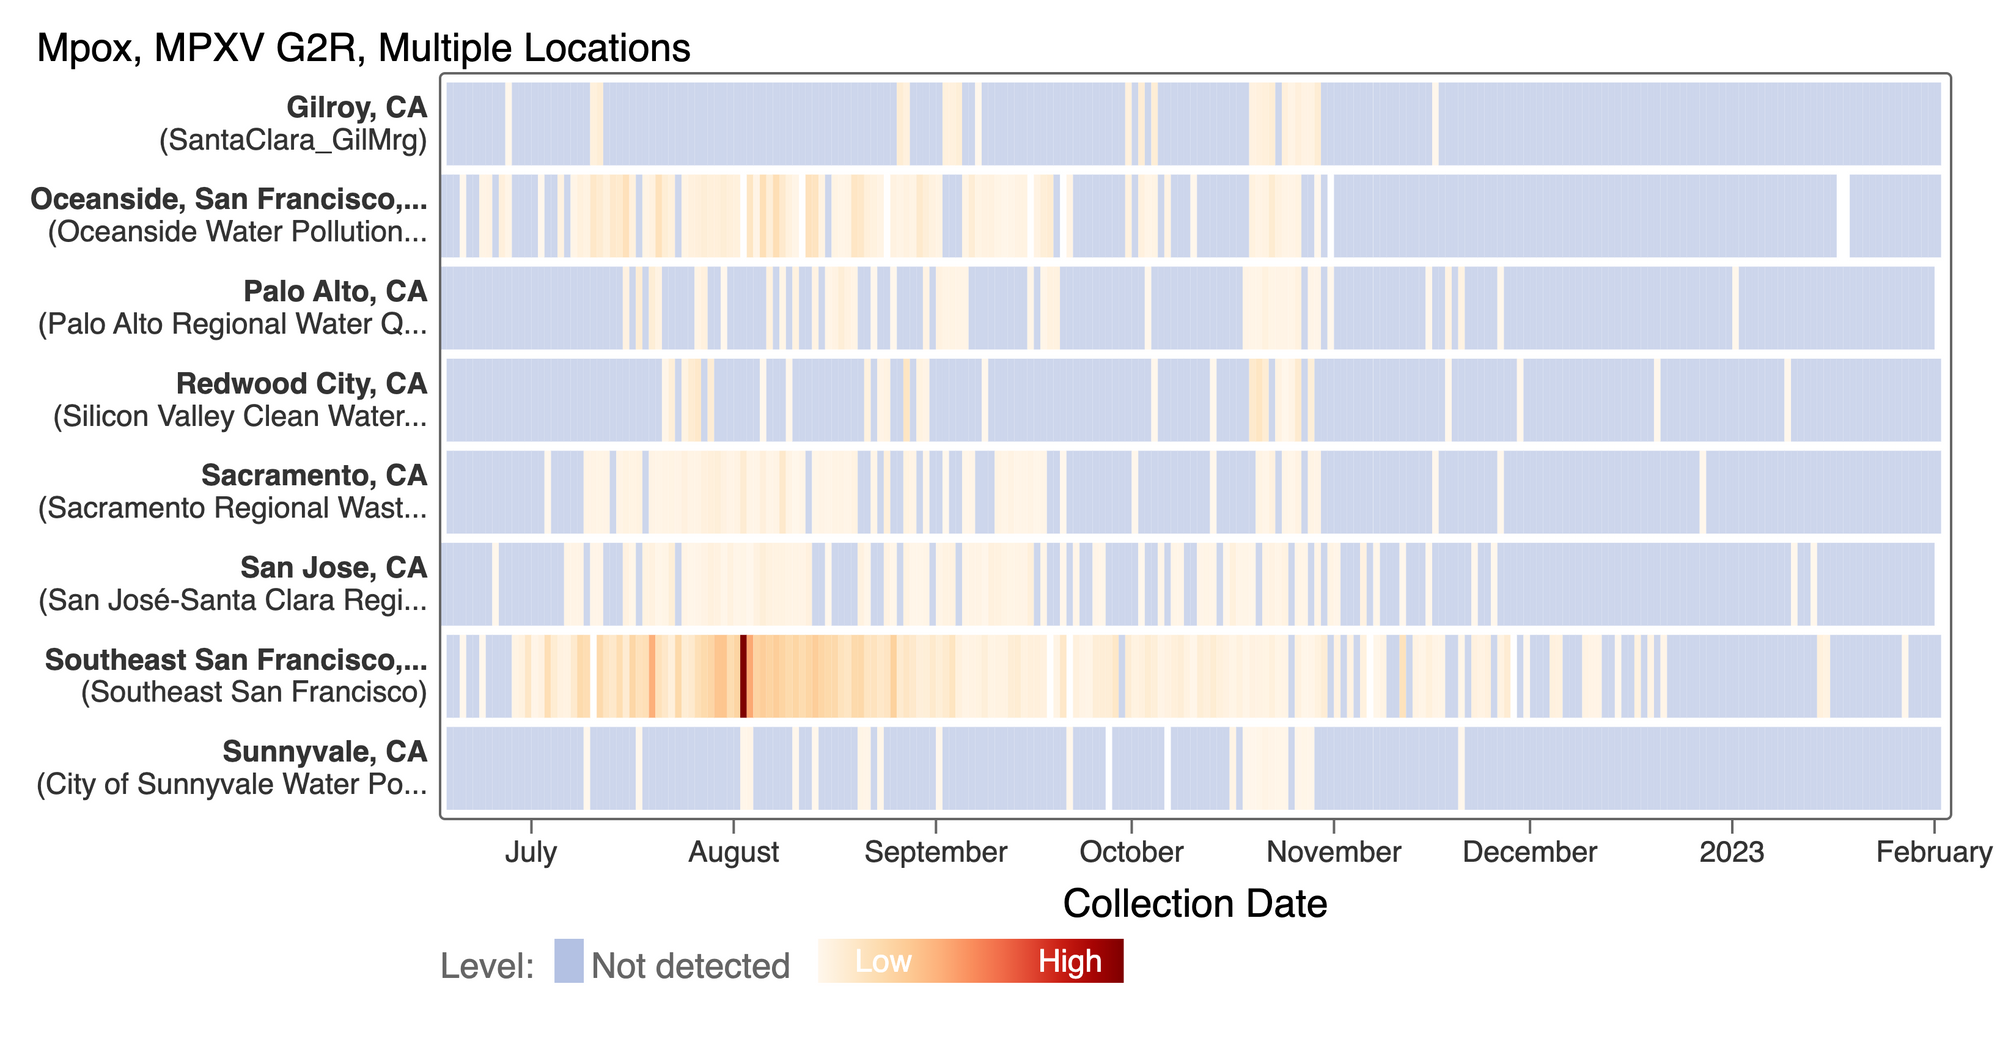
MPOX Virus
We see mostly non-detects in the past 2 weeks for MPXV DNA at most plants. This heat map shows all the SCAN sites as a row, and each date as a column. The color blue means the sample was non-detect for MPXV and the colors get darker with higher concentrations. This highlights that we rarely have detections of MPXV DNA at these SCAN plants recently, but we can see how we had much more in the past. The state of CA just ended the public health emergency for MPOX this past week.