Bay Area SCAN weekly update 12/15/22
Hi Everyone-
All samples picked up by the couriers as of 12/13/22 have been processed and their data are on the site: wbe.stanford.edu. The data from 12/14/22 will be posted later today.
Note that the website changed a bit in that now all non-SARS-CoV-2 pathogens can be found on one page with more control over the visualizations. Check it out here.
COVID-19
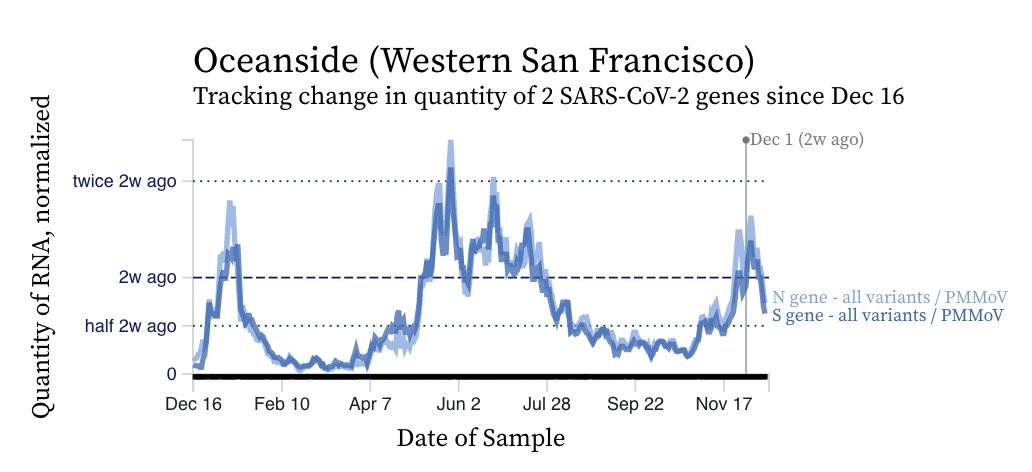
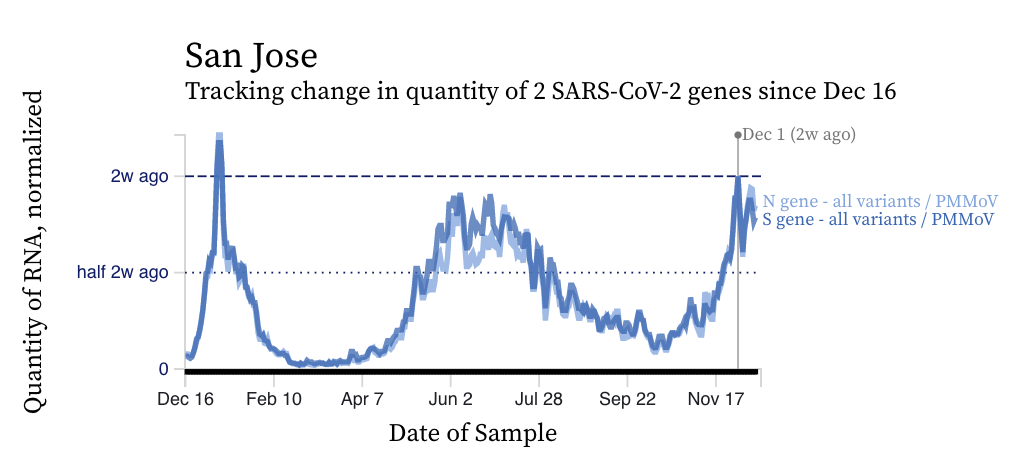
The concentrations of SARS-CoV-2 RNA we are seeing in wastewater are high, approaching or higher than levels observed during the BA.1 and/or BA.2/BA.5 surge at some plants. However, there do not appear to be increasing trends over the last two weeks.
Here are example data from Oceanside and San Jose. Most plants have concentrations today about where they were two weeks ago, or lower than two weeks ago suggesting there are no increasing trends at the present time.
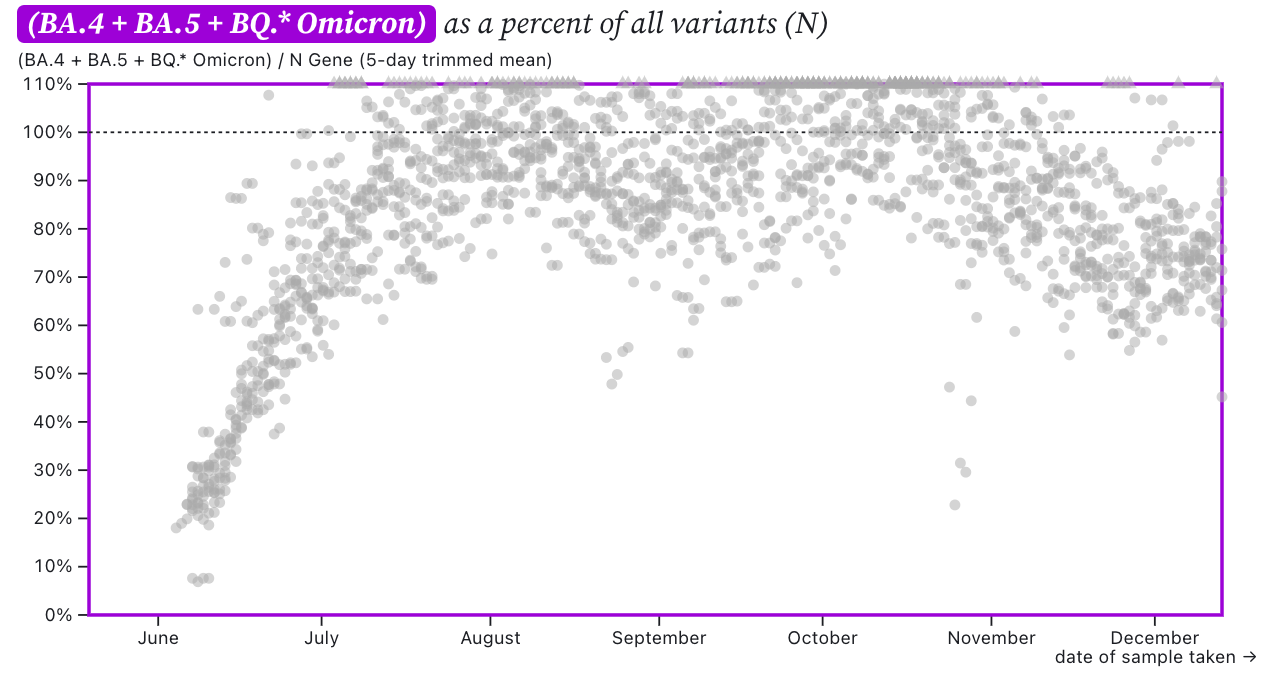
The HV69-70 mutation present in BA.5 and B.Q* sublineages is still present in the majority of circulating SARS-CoV-2, but as we pointed out last week, the ratio of HV69-70/N appears to be starting to decrease. Here is a plot of the HV69-70/N ratio over time at all the plants. The grey symbols are from all the plants in SCAN (you can access the plot and play around with it here). This is a bit of a mystery since HV69-70 is present in nearly all BA.5 and BQ.*. There are some sublineages where HV69-70 deletion is not present at 100% including BQ.1.1.9 and BQ.1.8.90. Otherwise, XBB and BA.2.75 do not have the mutation. We do not have sequencing data to really support an explanation (since the most recent sequencing data is from 12/3/22), but hopefully next week, we will have that and can better understand why we are seeing this, and if this decrease is real or just variability in the data.
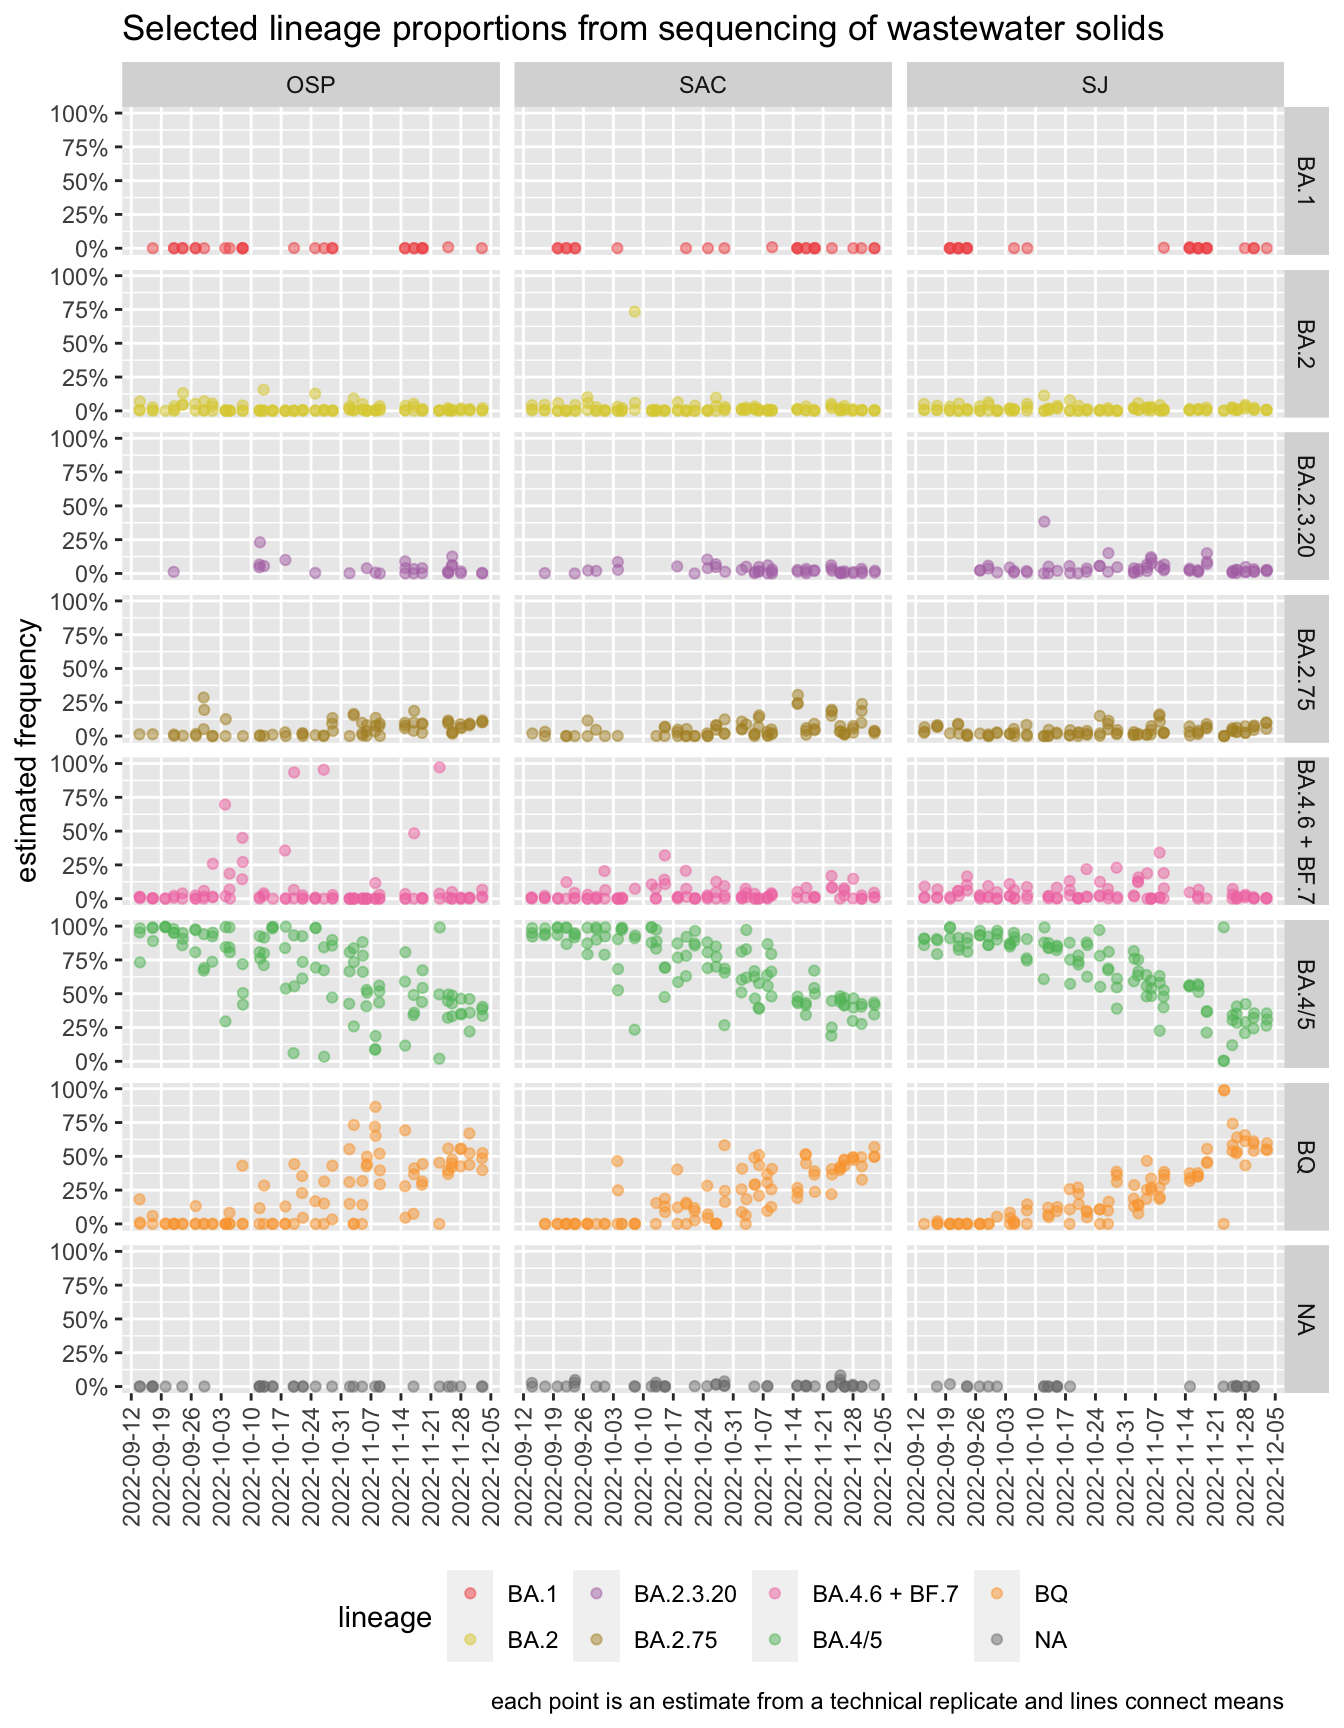
The sequencing data from wastewater samples from SAC, Oceanside, and SJ between 11/27 and 12/3 suggest that BQ.1* is dominate in wastewater and we continue to see evidence of BA.2.75, BA.2.3.20, and XBB at all three sites, but none of these other non-BQ variants appear to be increasing in proportion of total SARS-CoV-2. Here is a plot showing a time series at the three plants we sequence SARS-CoV-2 S gene at of the proportion of different variants in wastewater since the start of 2022.
IAV, IBV, RSV, HMPV
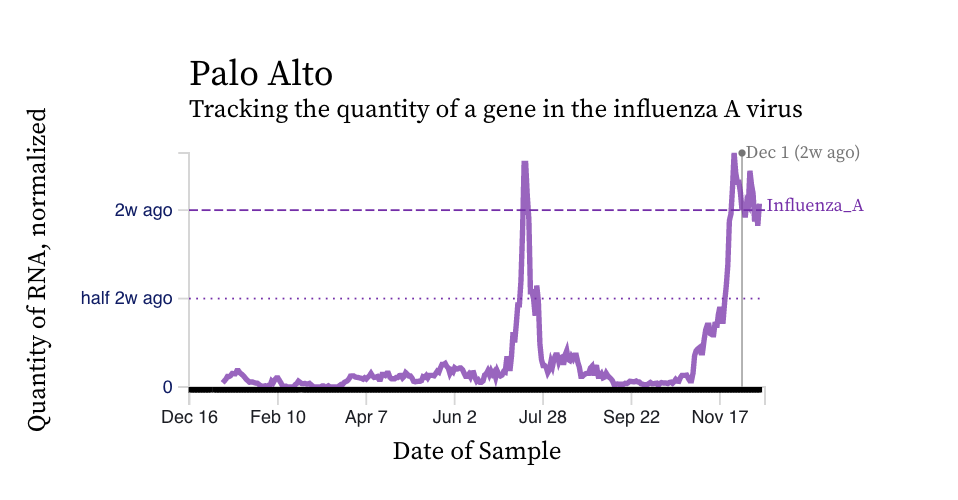
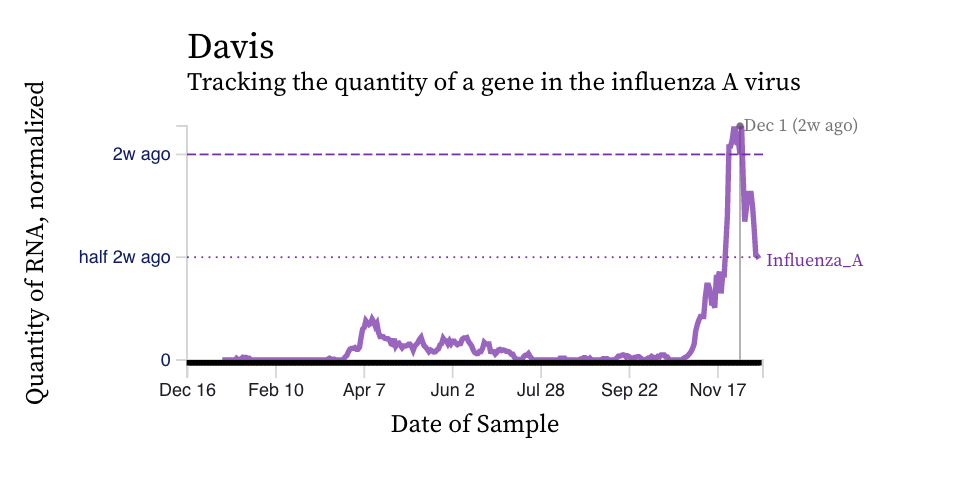
Influenza A (IAV) RNA concentrations are high (between 10^4 and 10^5 copies/gram) across the plants. Data at plants appear to fall into two categories - levels today are the same as they were two weeks ago (example of Palo Alto below), or levels are lower than they were two weeks ago (example of Davis below). Fingers crossed there are no further increases, but we will see what happens during the winter holidays.
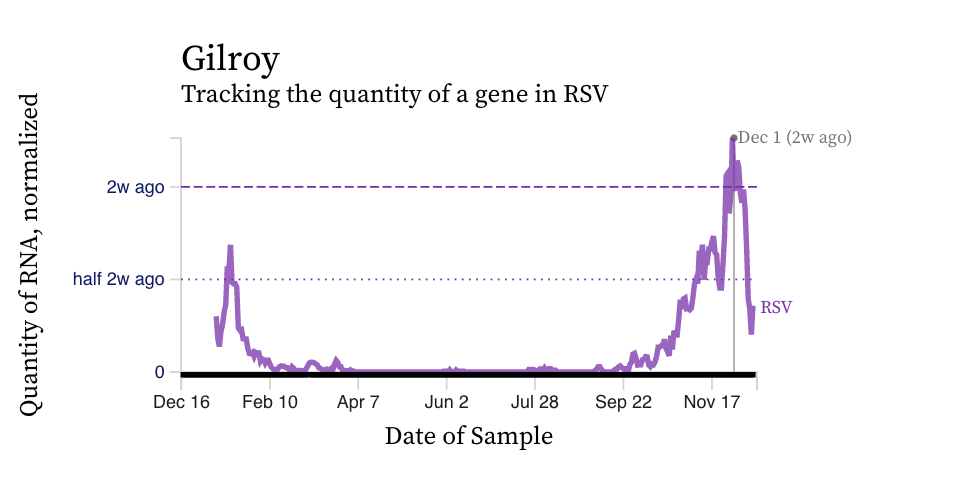
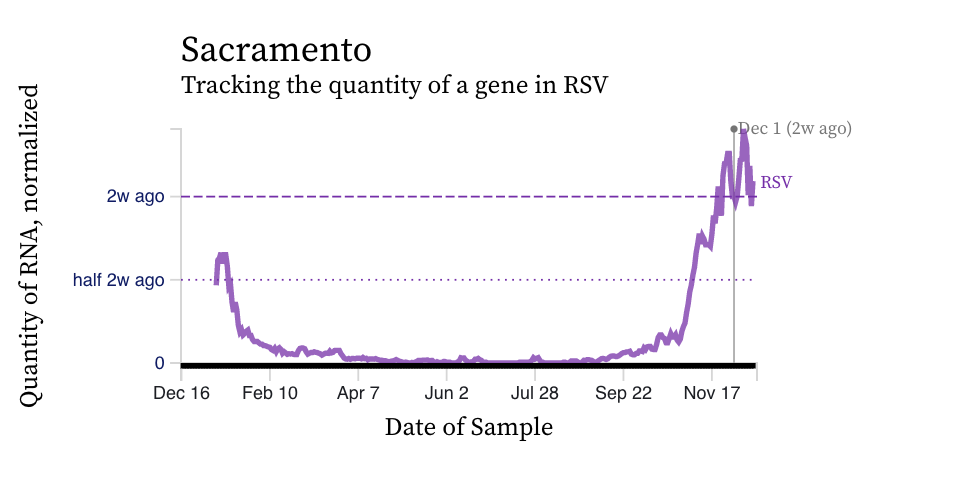
RSV RNA concentrations this week seem to be lower than last week (now on the order of 10^4 copies/g). We see the same trends for RSV RNA as for influenza A RNA: some plants are showing decreases over the last two weeks (see Gilroy below for a really obvious example!) and some plants are showing similar levels as two weeks ago (see Sacramento below).
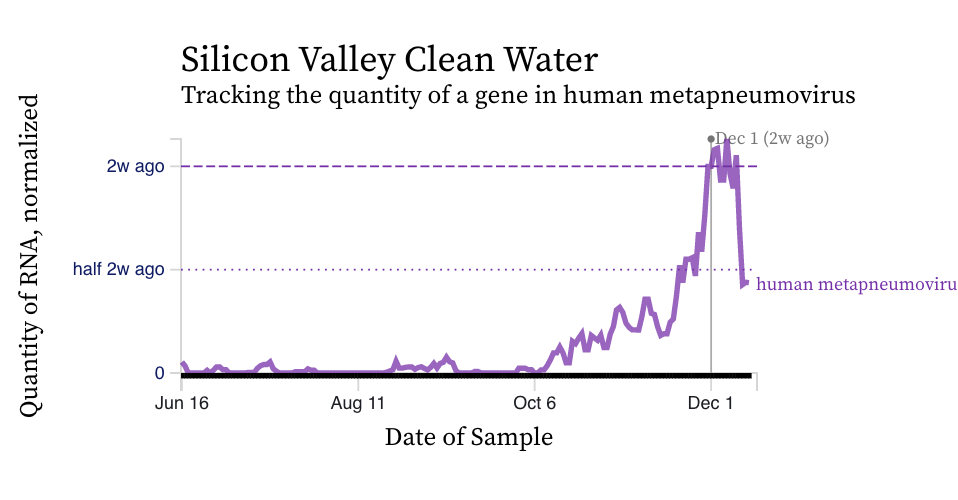
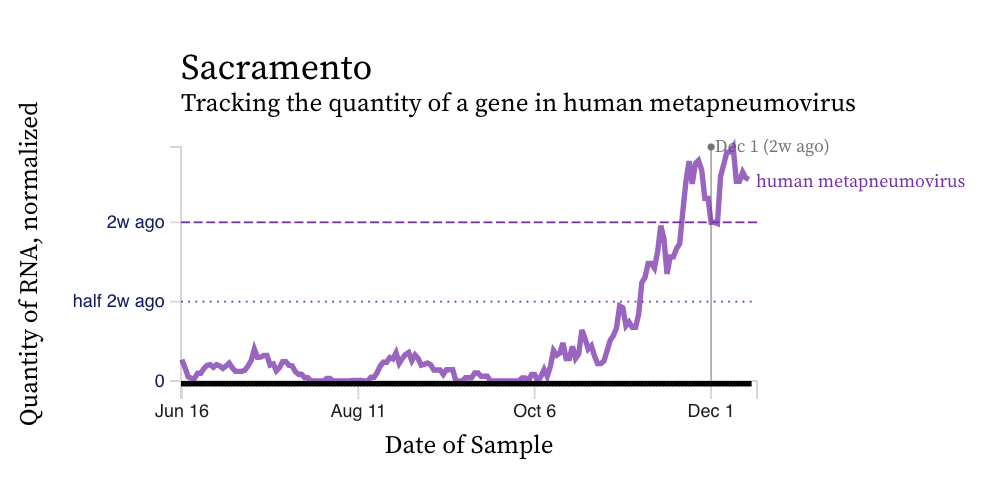
HMPV (human metapneumovirus) RNA concentrations have started to also decrease (see Silicon Valley Clean Water below) or plateau (see Sacramento below) across the plants over the last 2 weeks.
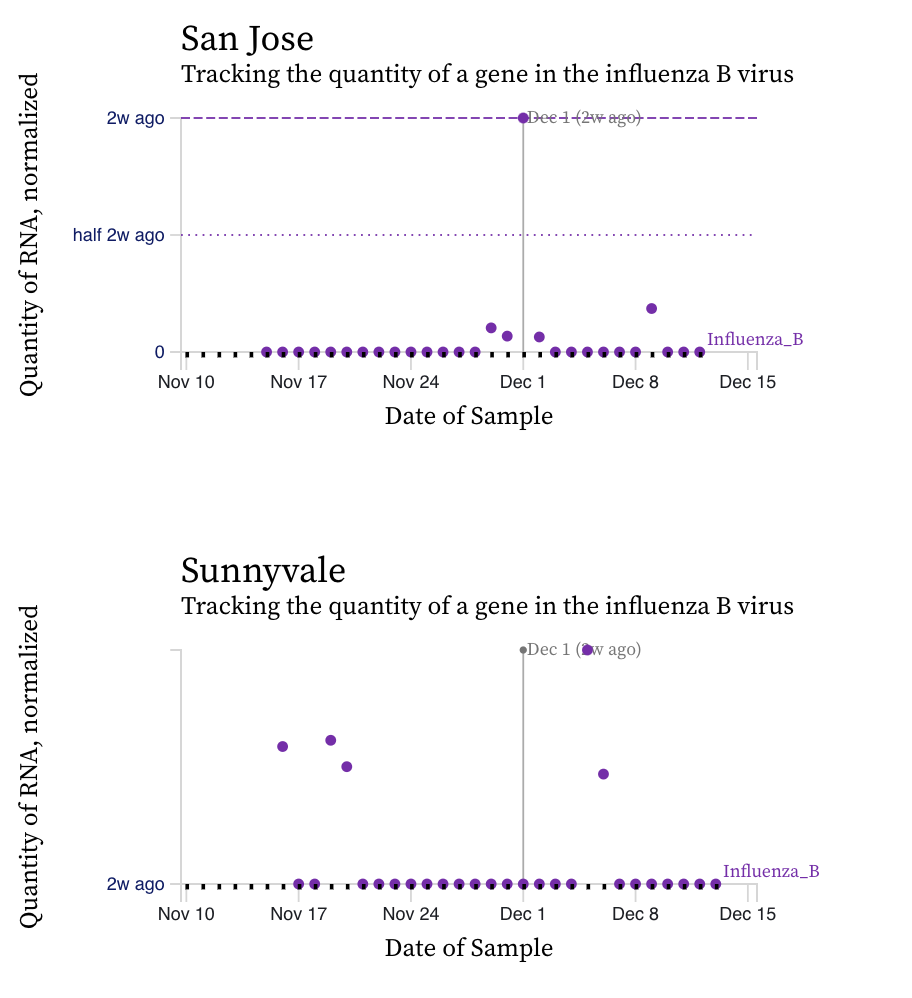
Influenza B (IBV) RNA concentrations are non-detect in most samples over the approximate 4 weeks we have been measuring it. We have detected it most frequently at San Jose (5 times) and Sunnyvale (5 times). The plots below show the raw data at those plants as time series. The data with actual values on the y-axis can be found on the drill down page (here).
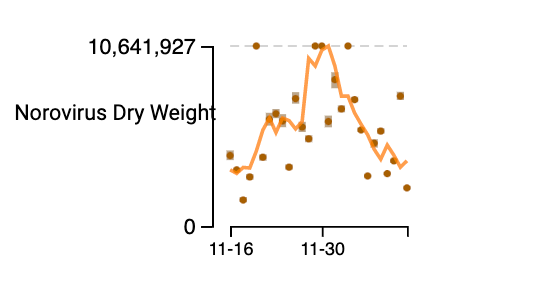
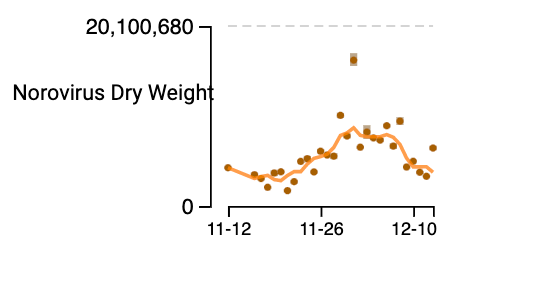
Norovirus RNA concentrations have been measured for about 4 weeks now at all the SCAN plants. We have observed concentrations between 10^4 cp/g and 10^8 cp/g. Data appear to be hovering near high levels without much of a trend over the last two weeks. Here are examples from the drill down page for Oceanside (which we featured last week as increasing - this week is appears to have decreased some) and Gilroy (also showing an increase followed by a decrease). The concentrations on the y-axis are on a linear scale and are in units of copies per gram dry weight.
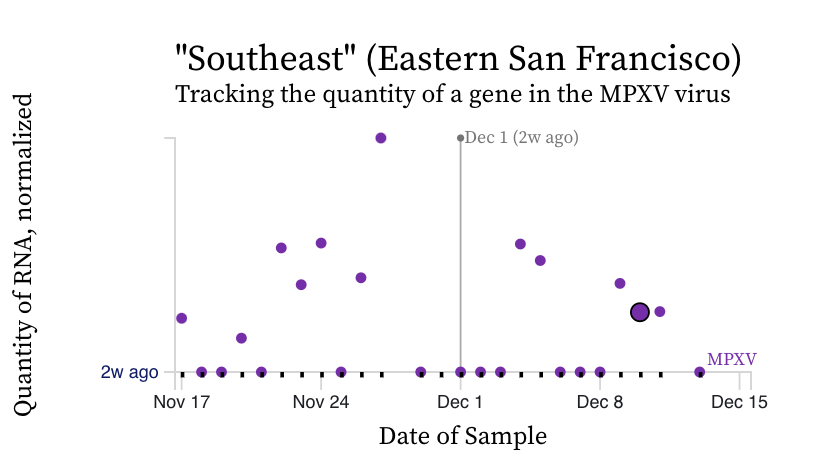
MPXV We are seeing mostly non-detects in the past 2 weeks for MPXV DNA. The only exception is for Southeast where we still have detections, at low levels. Here is a plot of the MPXV data from Southeast showing the raw data (the larger purple circle is my mouse over effect from having my mouse over a point):