National WWSCAN Update 12/15/22
Hi everyone -
This newsletter contains updates on the WastewaterSCAN program. Below you will find information on the program in terms of participating partners, review of targets being measured, as well as trends in concentrations of infectious disease targets. We have added a new trend analysis to identify locations where there are statistically significant upward and downward trends in concentrations of infectious disease targets. Details of how these trends are identified are provided below.
Enjoy the holidays!
Ali & Marlene
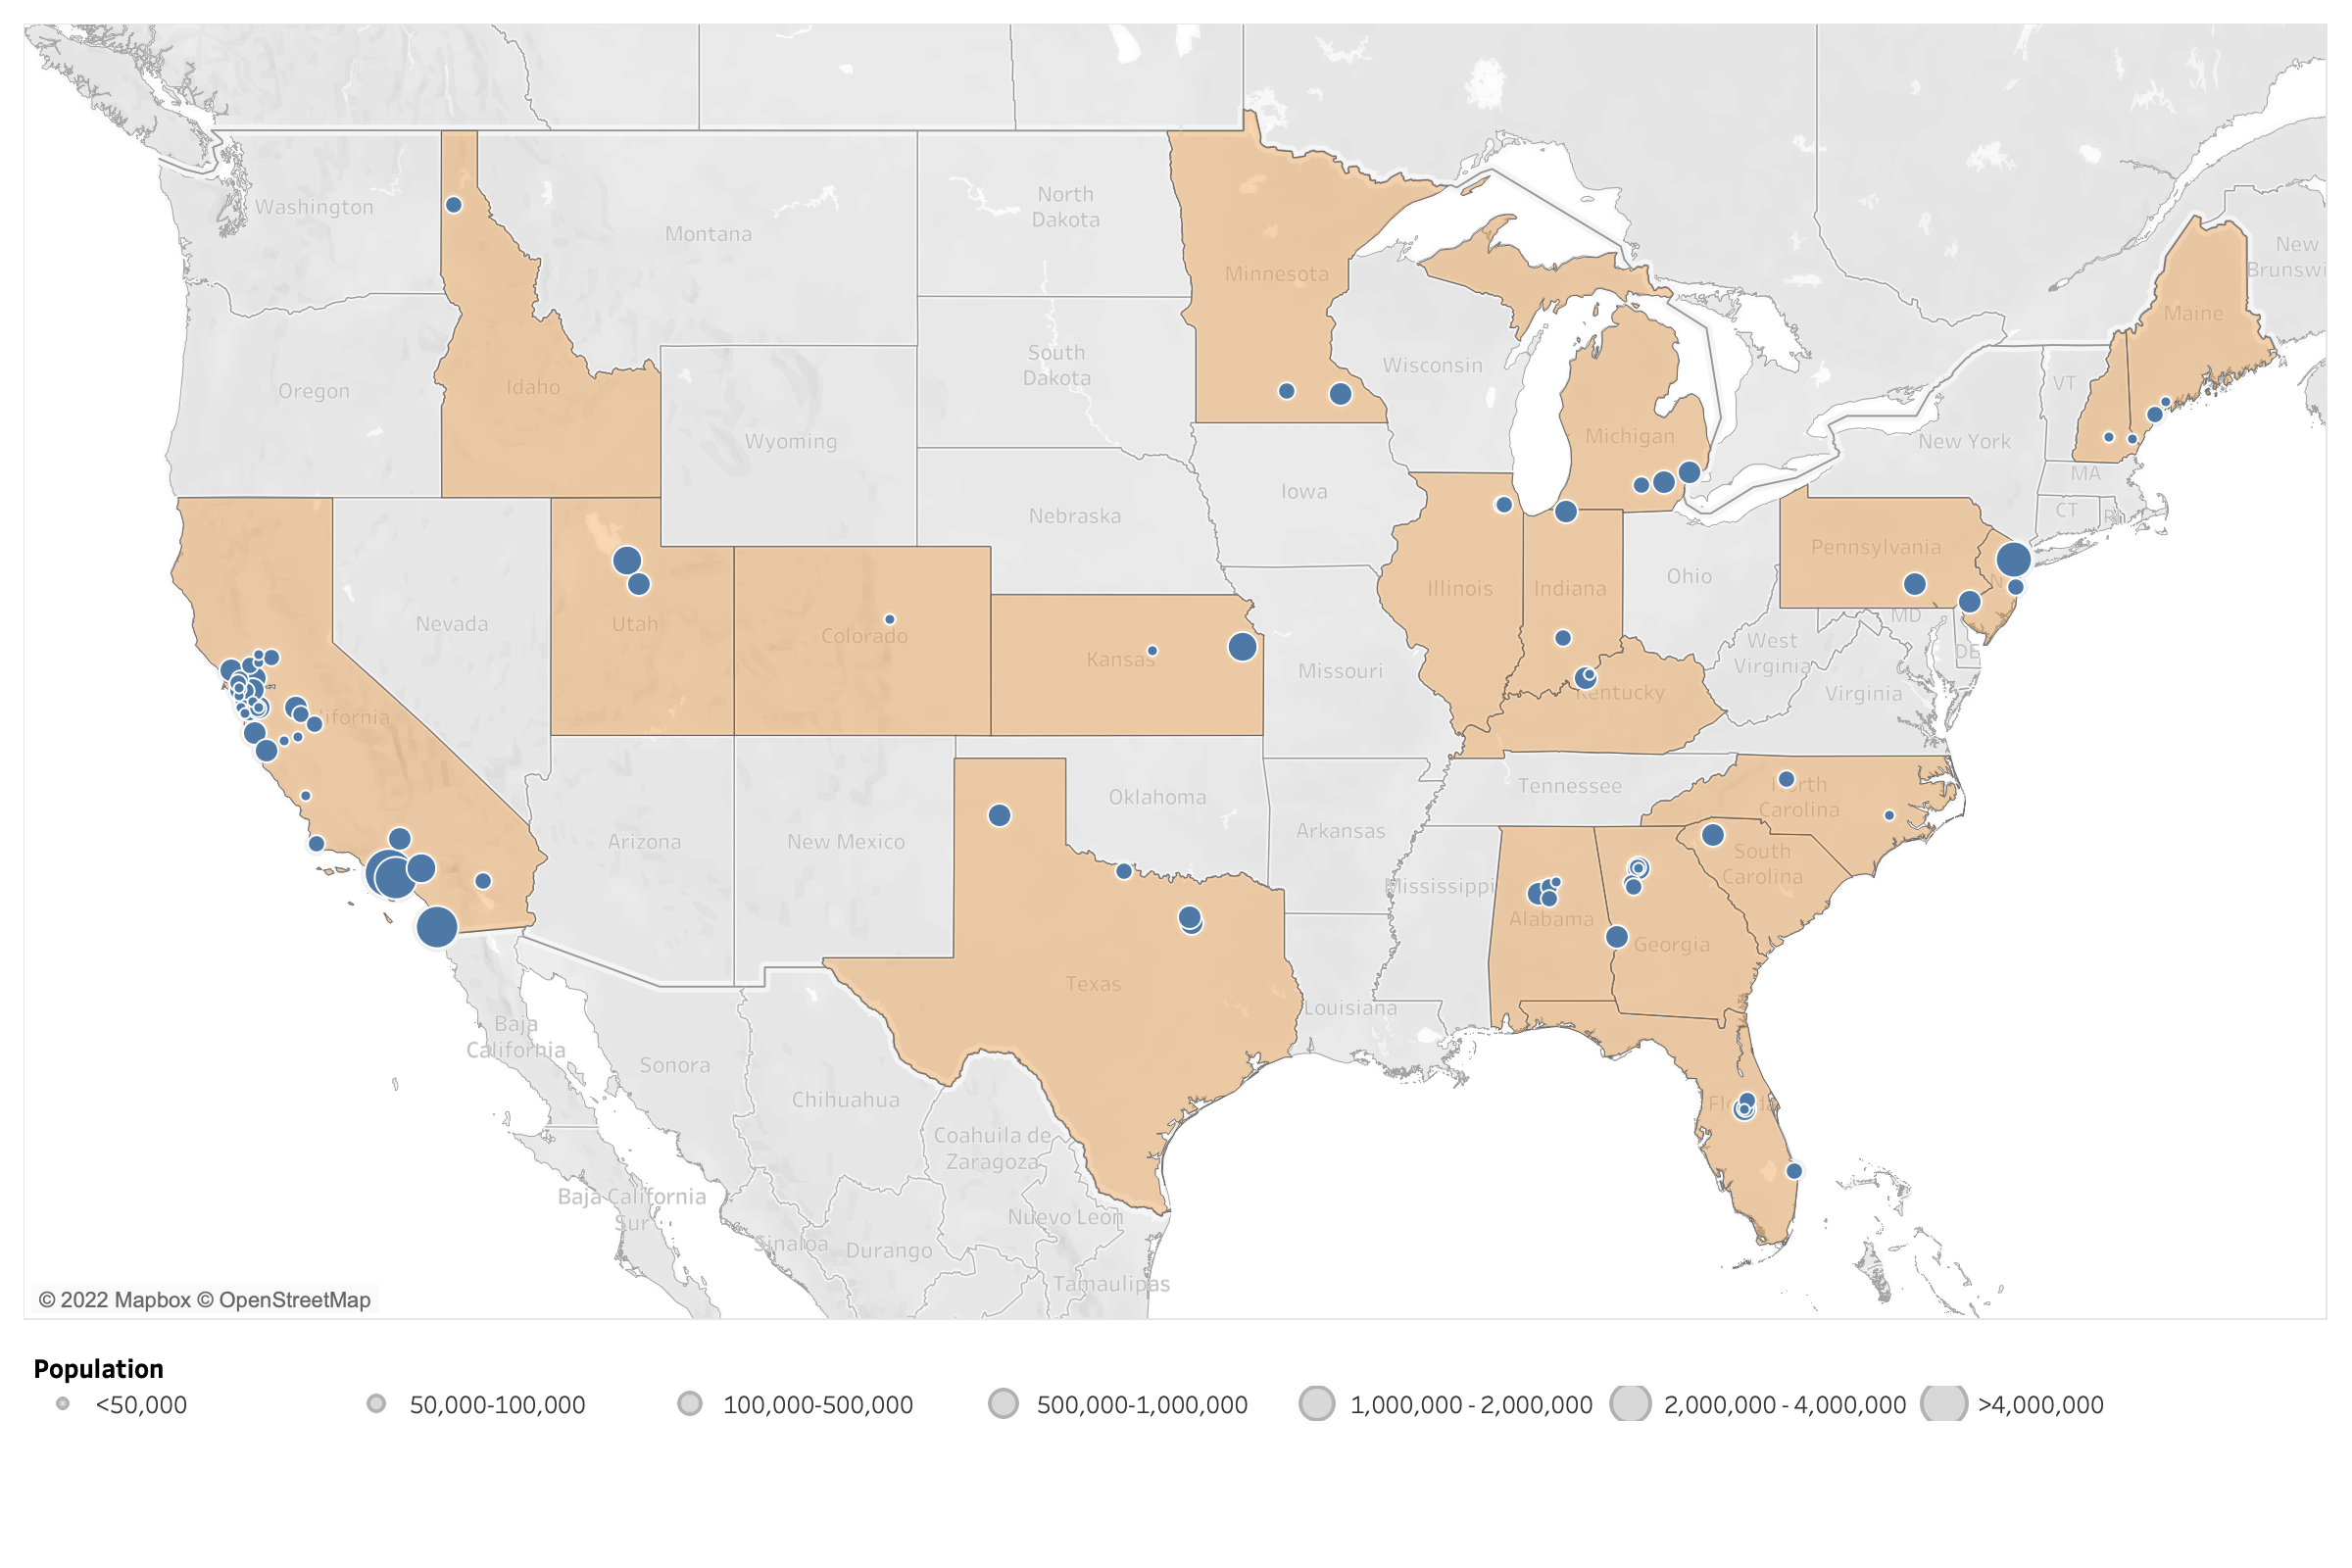
Participating partners
- 97 plants sampling
- 8.64% of the US population represented (28,465,874 people)
- 20 states represented
We are excited to have these locations joining soon:
- Windsor, CA
- Muscatine, IA
- Akron, OH
- Clinton, IA
- Ottumwa, IA
- Hollywood, MD
Infectious Disease Target Review
These are the targets we are currently measuring:
SARS-CoV-2
- N gene and S gene (pan-SARS-CoV-2 targets)
- HV69-70 mutation (BA.4 and BA.5 including B.Q.*)
Influenza A (IAV)
- M1 gene in influenza A genome
Respiratory Syncytial Virus (RSV)
- N gene of RSV genome (detects RSV A and RSV B)
Mpox Virus
- G2R_G marker in the mpox virus genome
Controls
- PMMoV (pepper mild mottle virus) - endogenous control
- BCoV (bovine coronavirus) - exogenous control
New targets starting TODAY - December 15, 2022:
- Human metapneumovirus seasonal respiratory virus
- Influenza B virus seasonal respiratory virus
- Norovirus leading cause of gastrointestinal illness
- G2R_WA is another version of the MPXV assay; results should be the same
21-Day Wastewater Trend Analysis Methods
These are the details of how we conducted trend analysis as shown in maps below
We use the percent change (PC) of measurements of SARS-CoV-2, IAV, RSV, and mpox nucleic acids normalized by PMMoV in wastewater solids from WWSCAN locations to characterize trends. Using all available data from the last 21 days, we calculated the PC using this formula: 𝑃𝐶 = (10^(𝑠𝑙𝑜𝑝𝑒) − 1) × 100. The slope was calculated from a least-squares linear regression of log10-transformed values of the raw N/PMMoV (SARS-CoV-2), IAV/PMMov, RSV/PMMoV, and mpox/PMMoV data. If the slope was significantly greater than 0 at greater than the 90% confidence level, the PC was categorized as increasing. If the slope was significantly less than 0 at greater than the 90% confidence level, the PC was categorized as decreasing. If the slope was not significantly different from 0, the PC was categorized as “no trend”. If there were less than 3 data points available in the last 21 days, the site did not have enough data to classify a trend. For more details on the PC methodology, please refer to the Chan et al. preprint here. The trend analyses conducted below used data through 12/9/22.
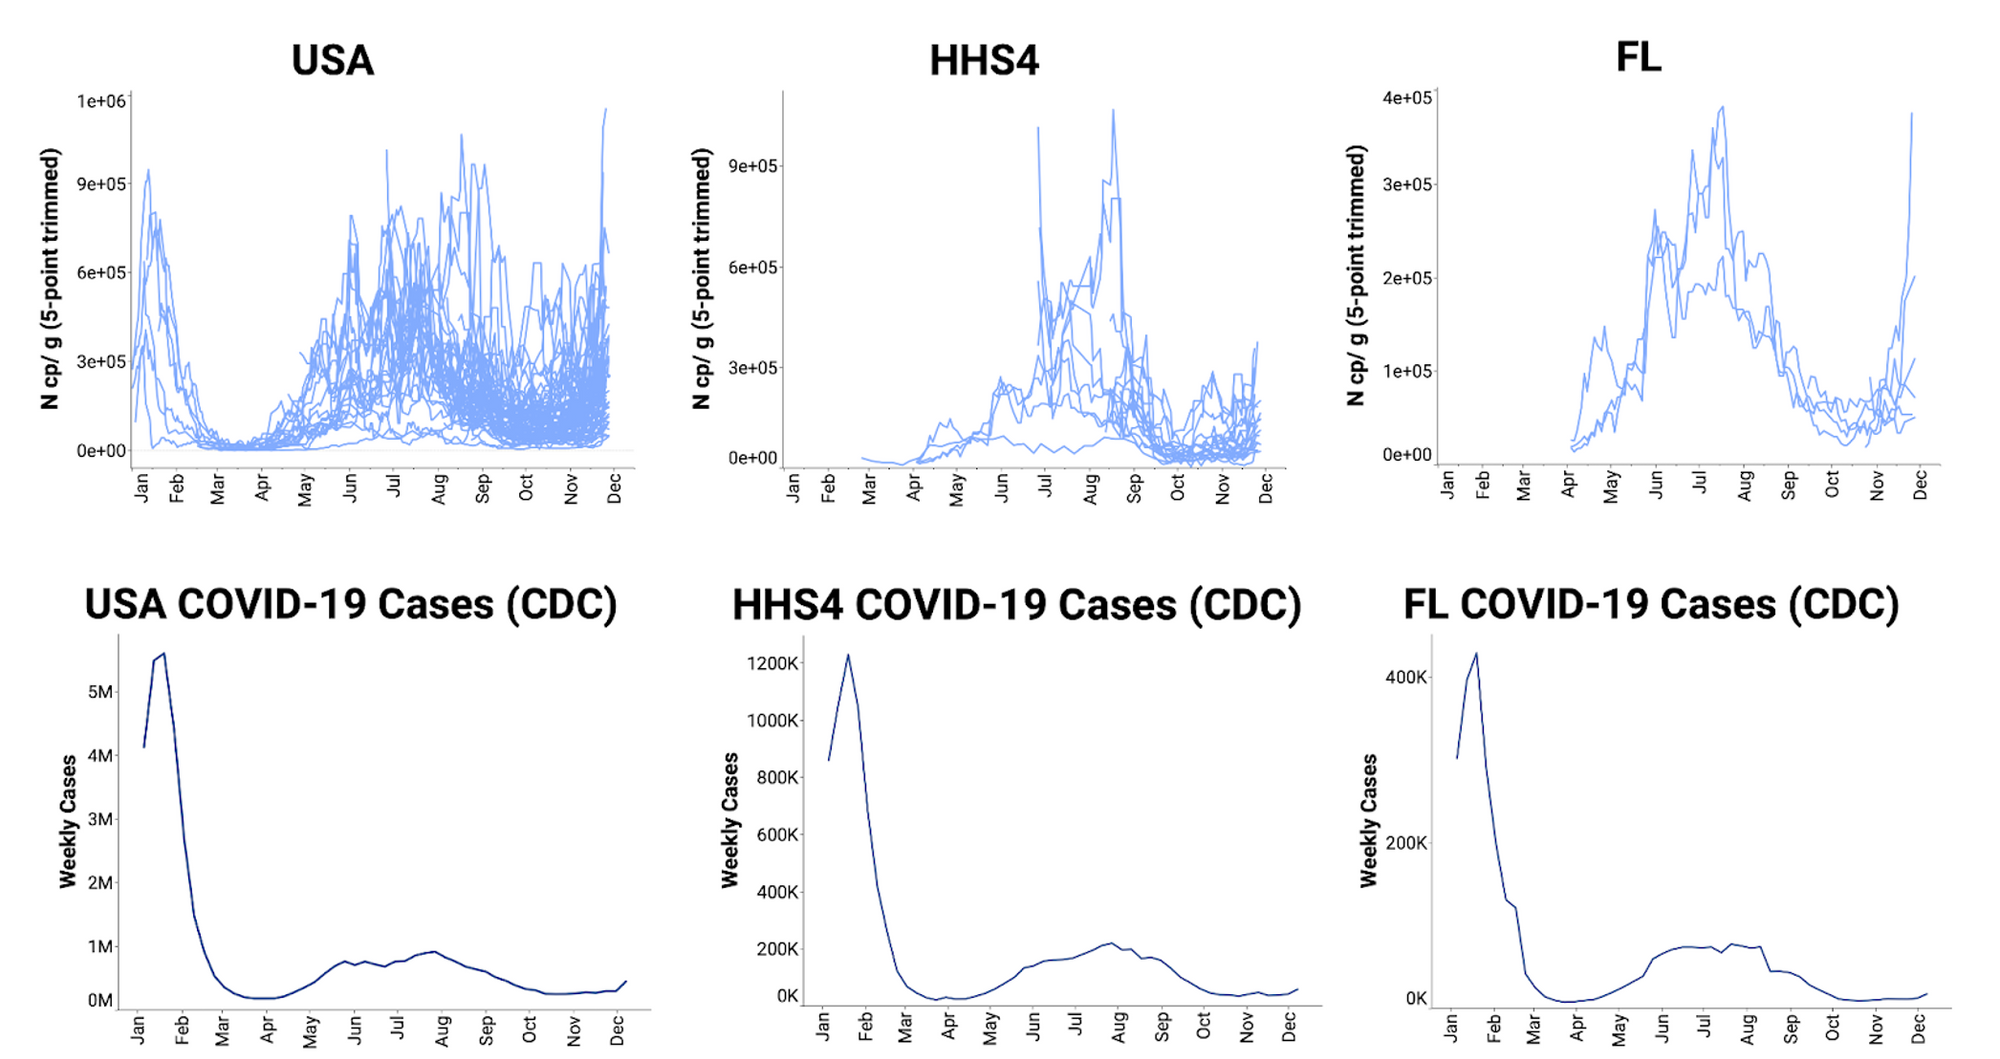
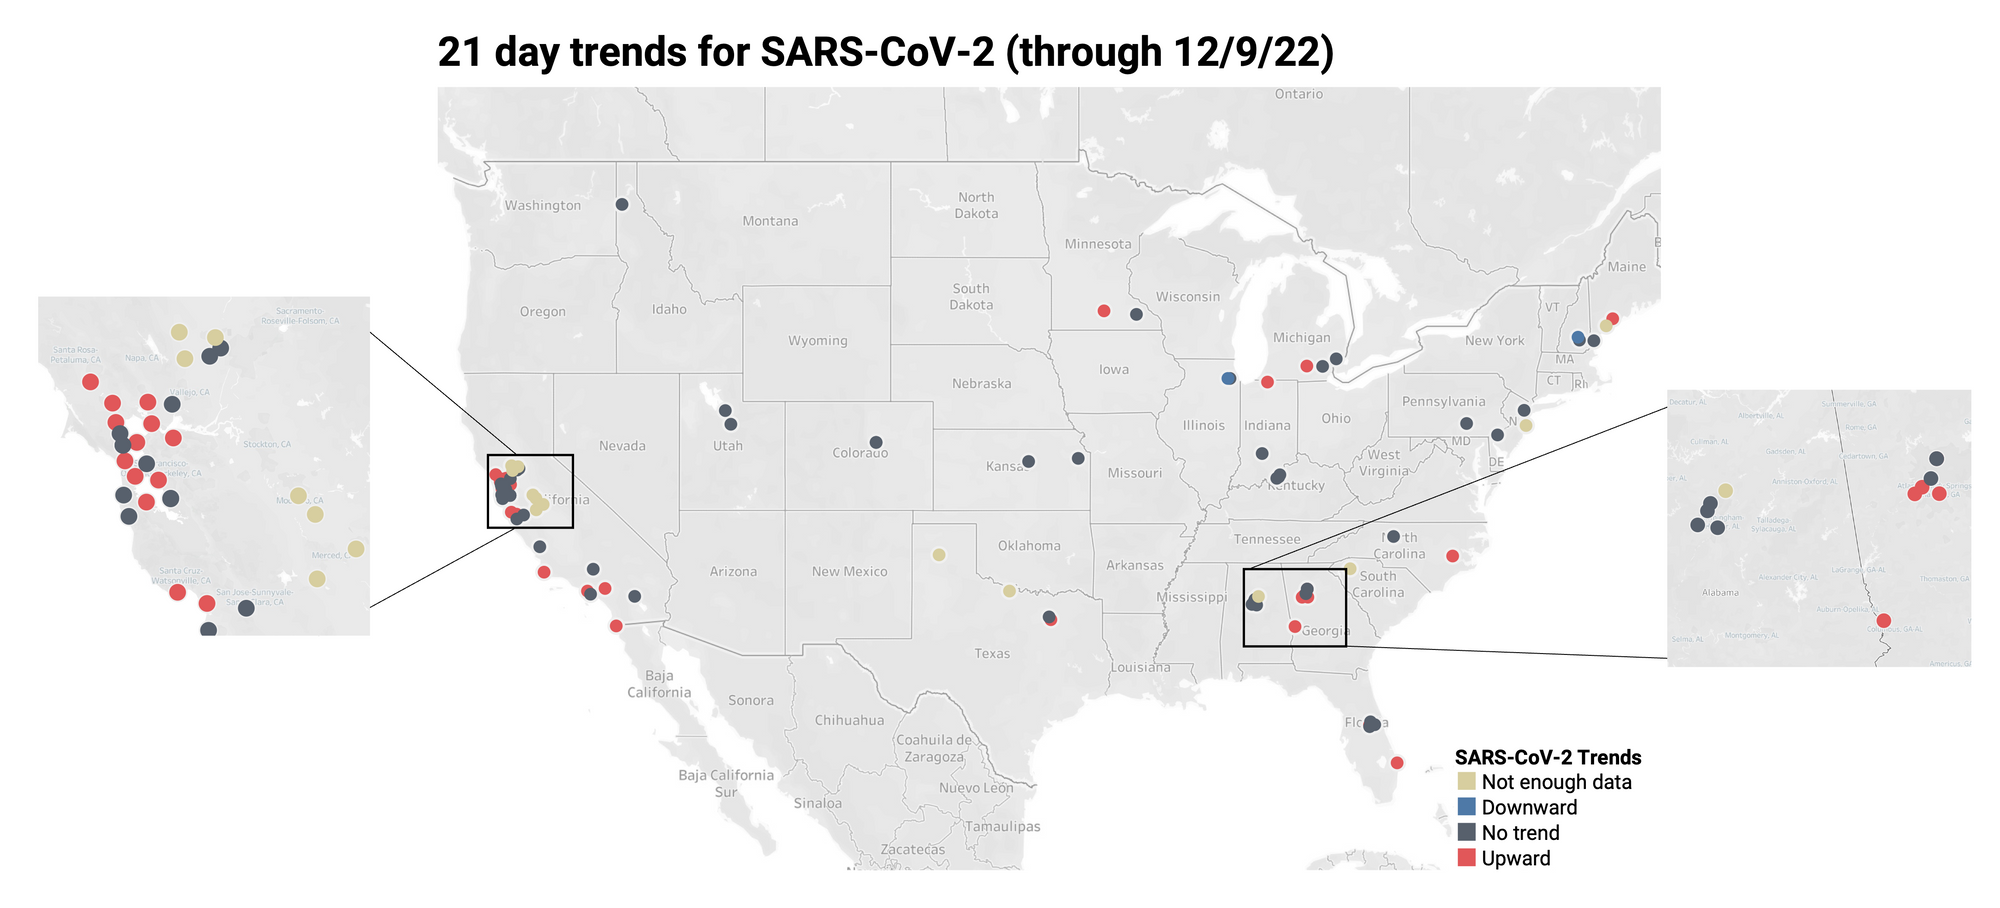
SARS-CoV-2 Trends
We are seeing an increase in SARS-CoV-2 RNA concentrations in wastewater solids in many locations. Below are the concentrations from all the sites across the country in the program, those in HHS region 4, and those in Florida (top row). The bottom row shows the publicly available case data in those same areas. Note that the case data only includes results from reported PCR tests, and not home tests. As many Americans use at home tests, the case data represents under-reporting of actual infections.
Below is the trend analysis for the SARS-CoV-2 RNA concentrations (normalized by PMMoV) in wastewater solids at the plants. Red indicates a significant upward trend, blue is a significant downward trend, and dark grey is no trend. Tan indicates that there were not enough data points to calculate a trend. We will be working to refine these plots in the coming weeks including the choice of colors.
Influenza A Trends
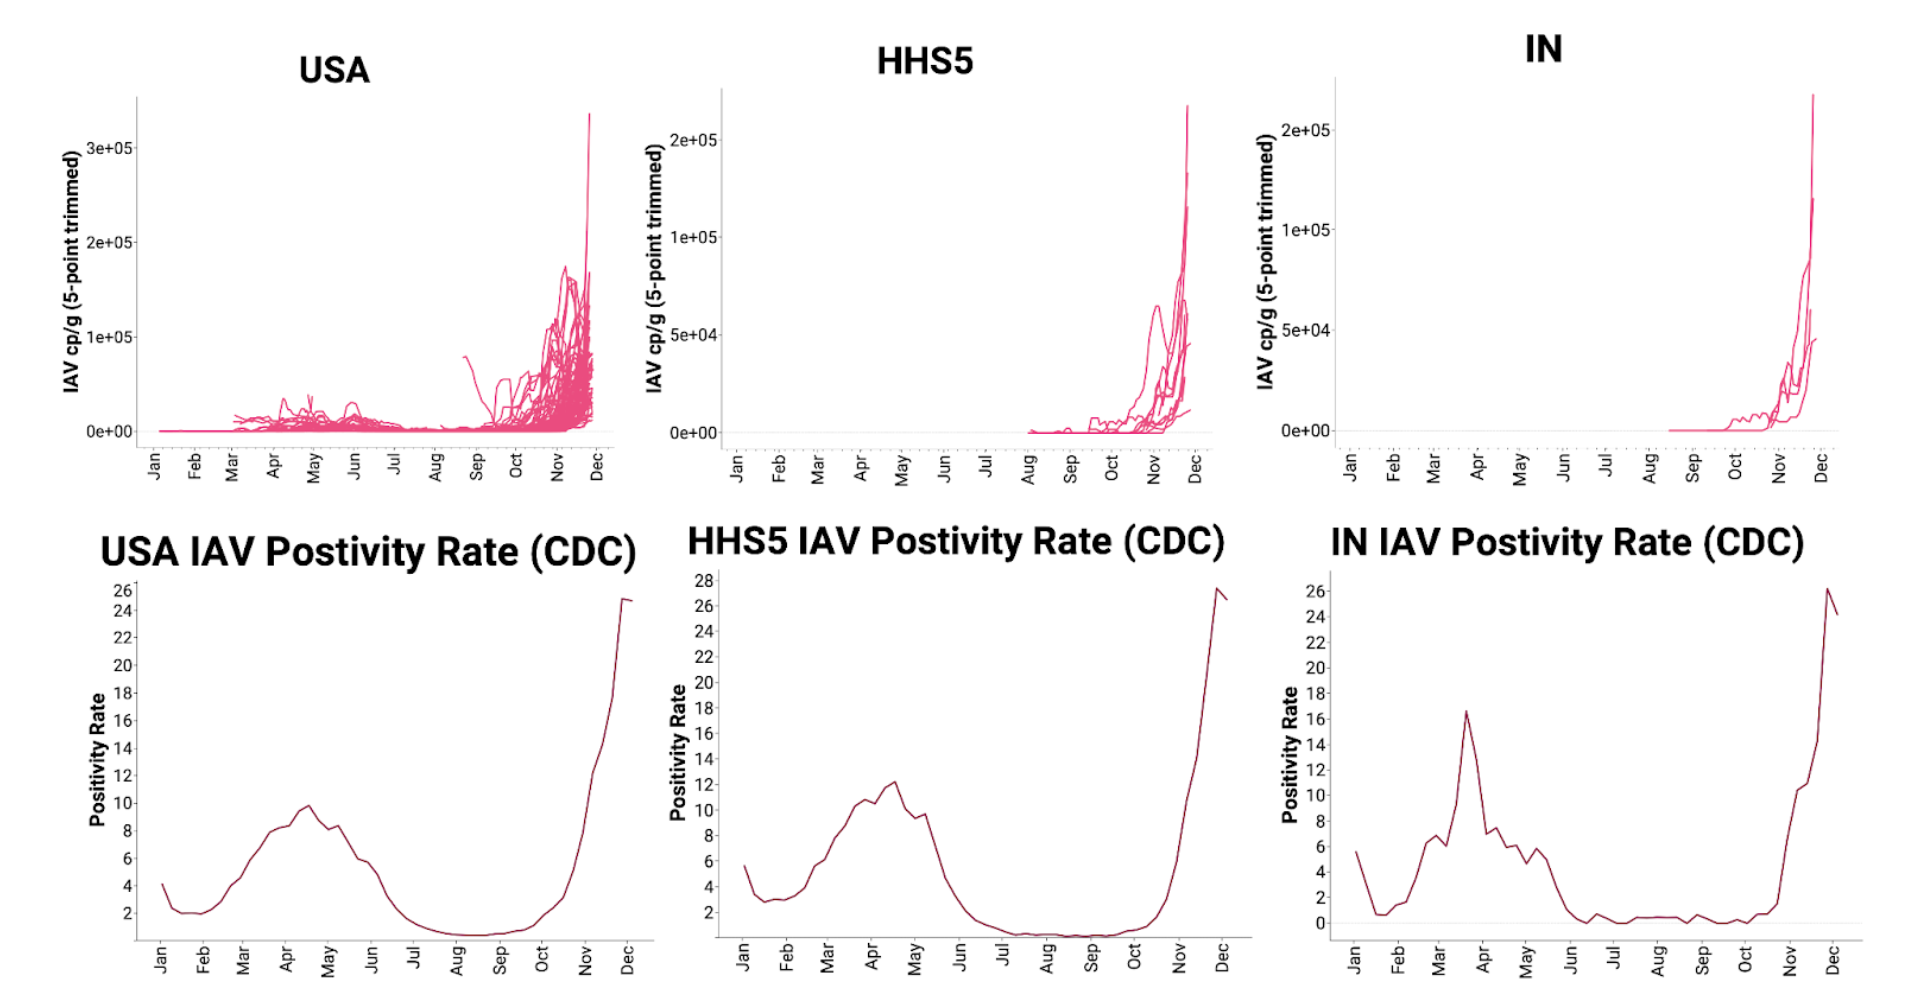
We continue to see relatively elevated concentrations of IAV RNA in wastewater solids across partner plants. Examples below are from all the sites across the country in the program, HHS region 5, and Indiana. The trends in wastewater solids concentrations match the trends in positivity rates across these same areas.
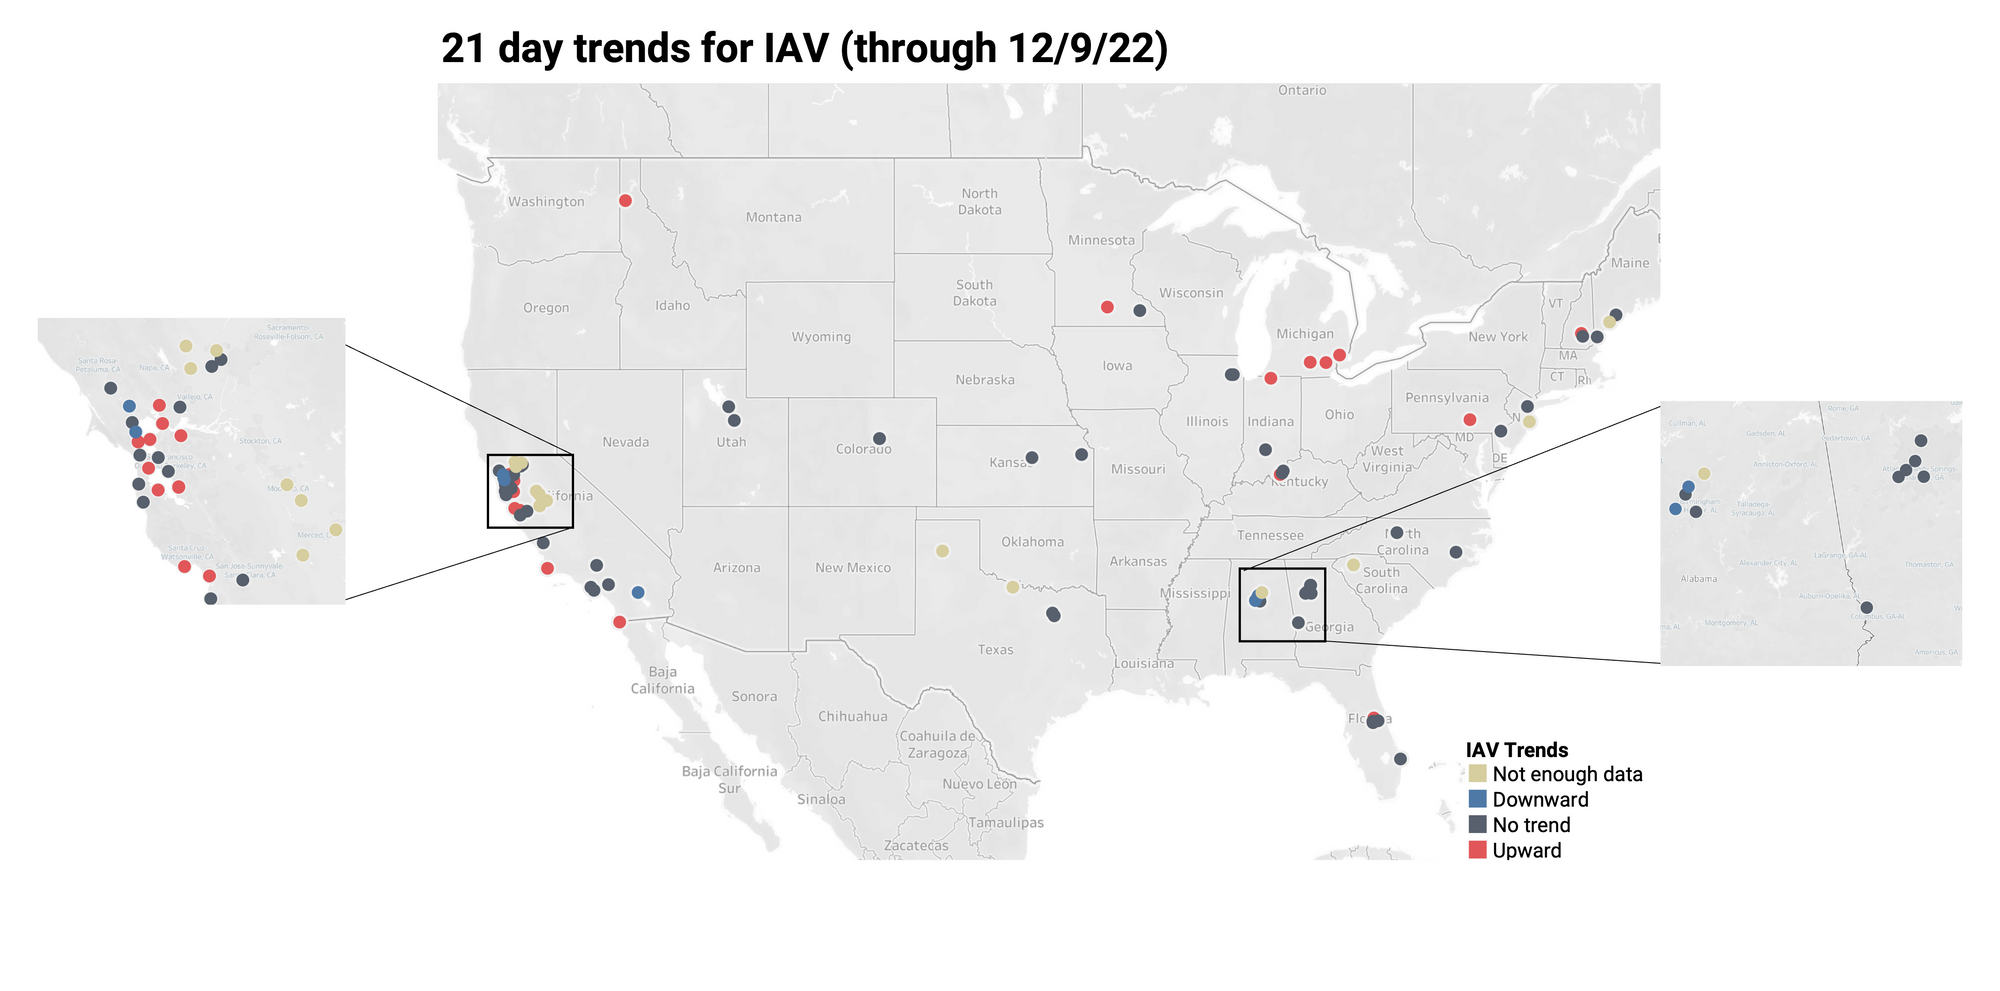
Below is the trend analysis for the IAV RNA concentrations (normalized by PMMoV) in wastewater solids at the plants. Red indicates a significant upward trend, blue is a significant downward trend, and dark grey is no trend. Tan indicates that there were not enough data points to calculate a trend. We will be working to refine these plots in the coming weeks including the choice of colors.
RSV Trends
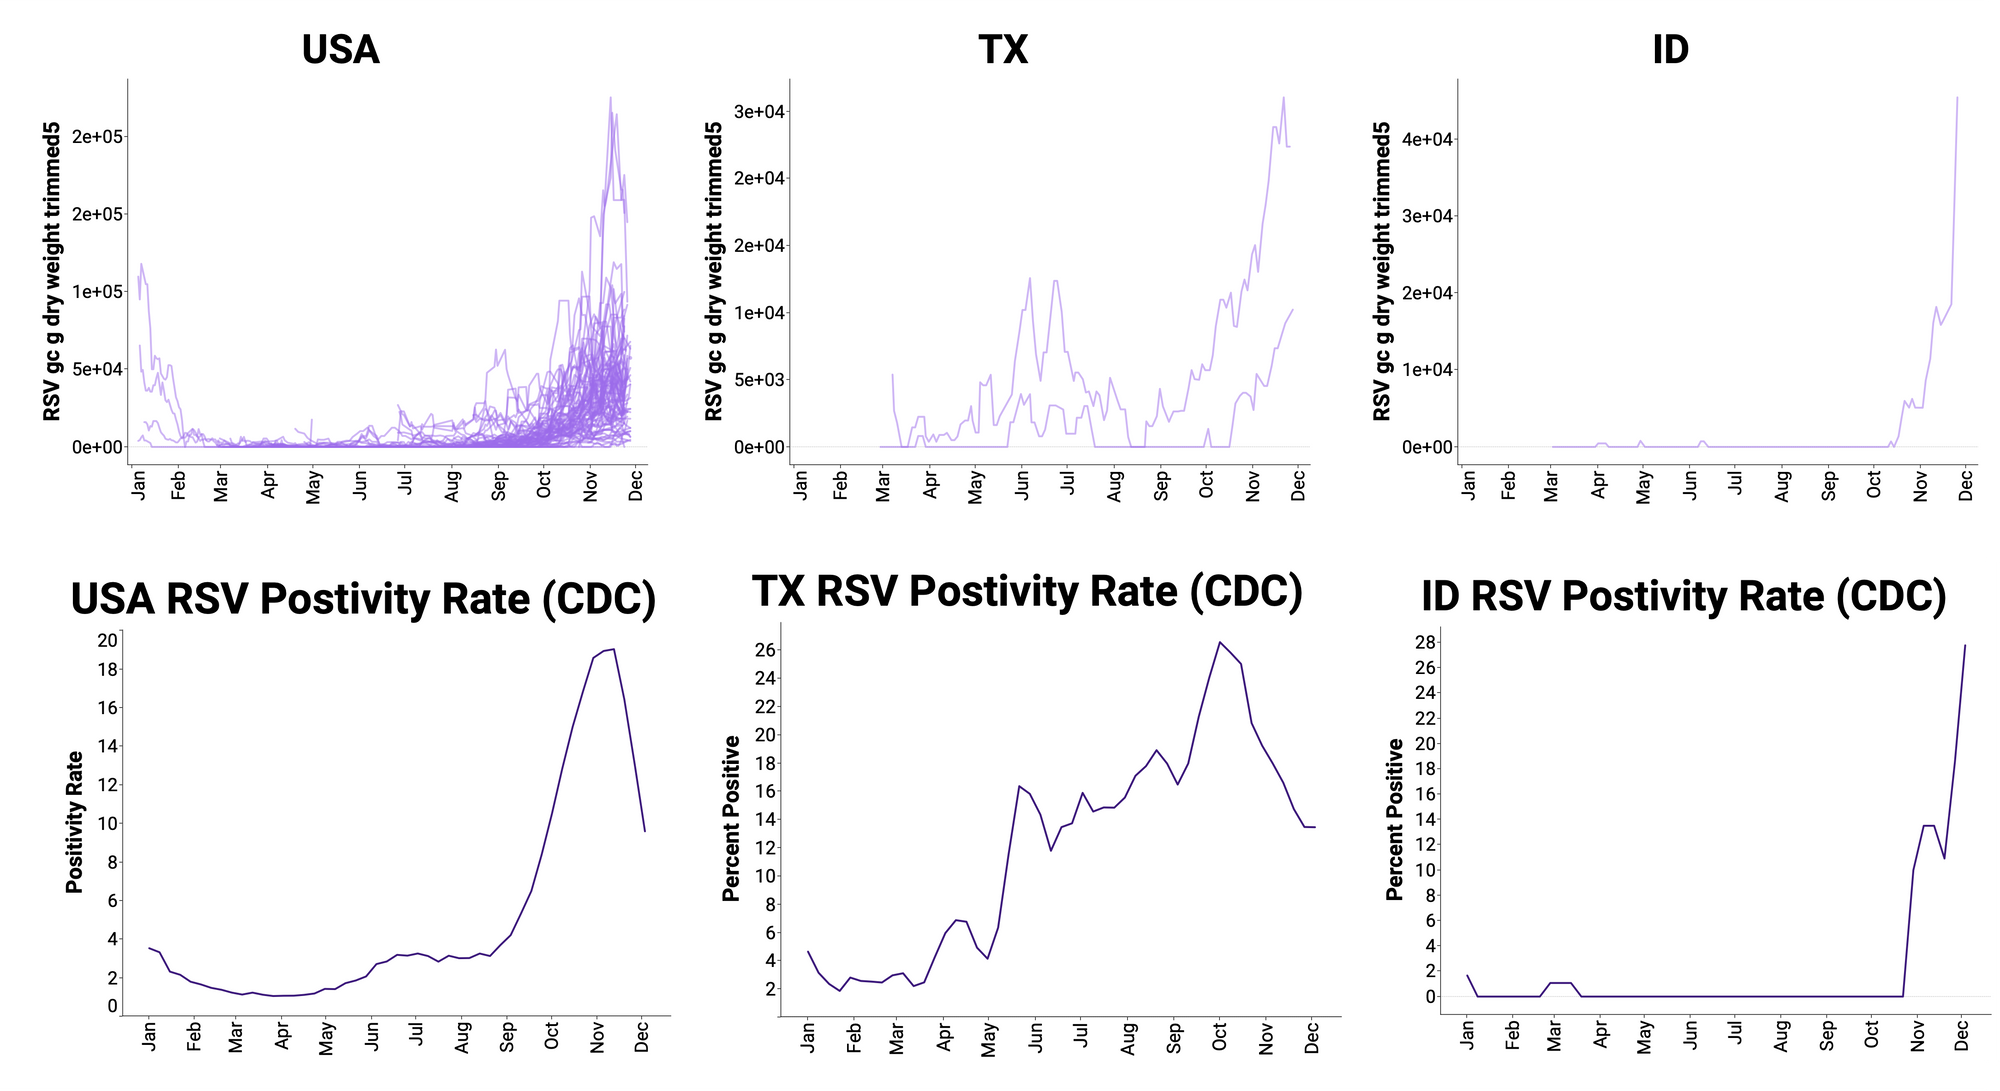
We continue to see relatively elevated concentrations of RSV RNA in wastewater solids at participating sites. Examples below are from all the sites across the country in the program, Texas, and Idaho. The trends in concentrations match the trends in positivity rates across these same areas.
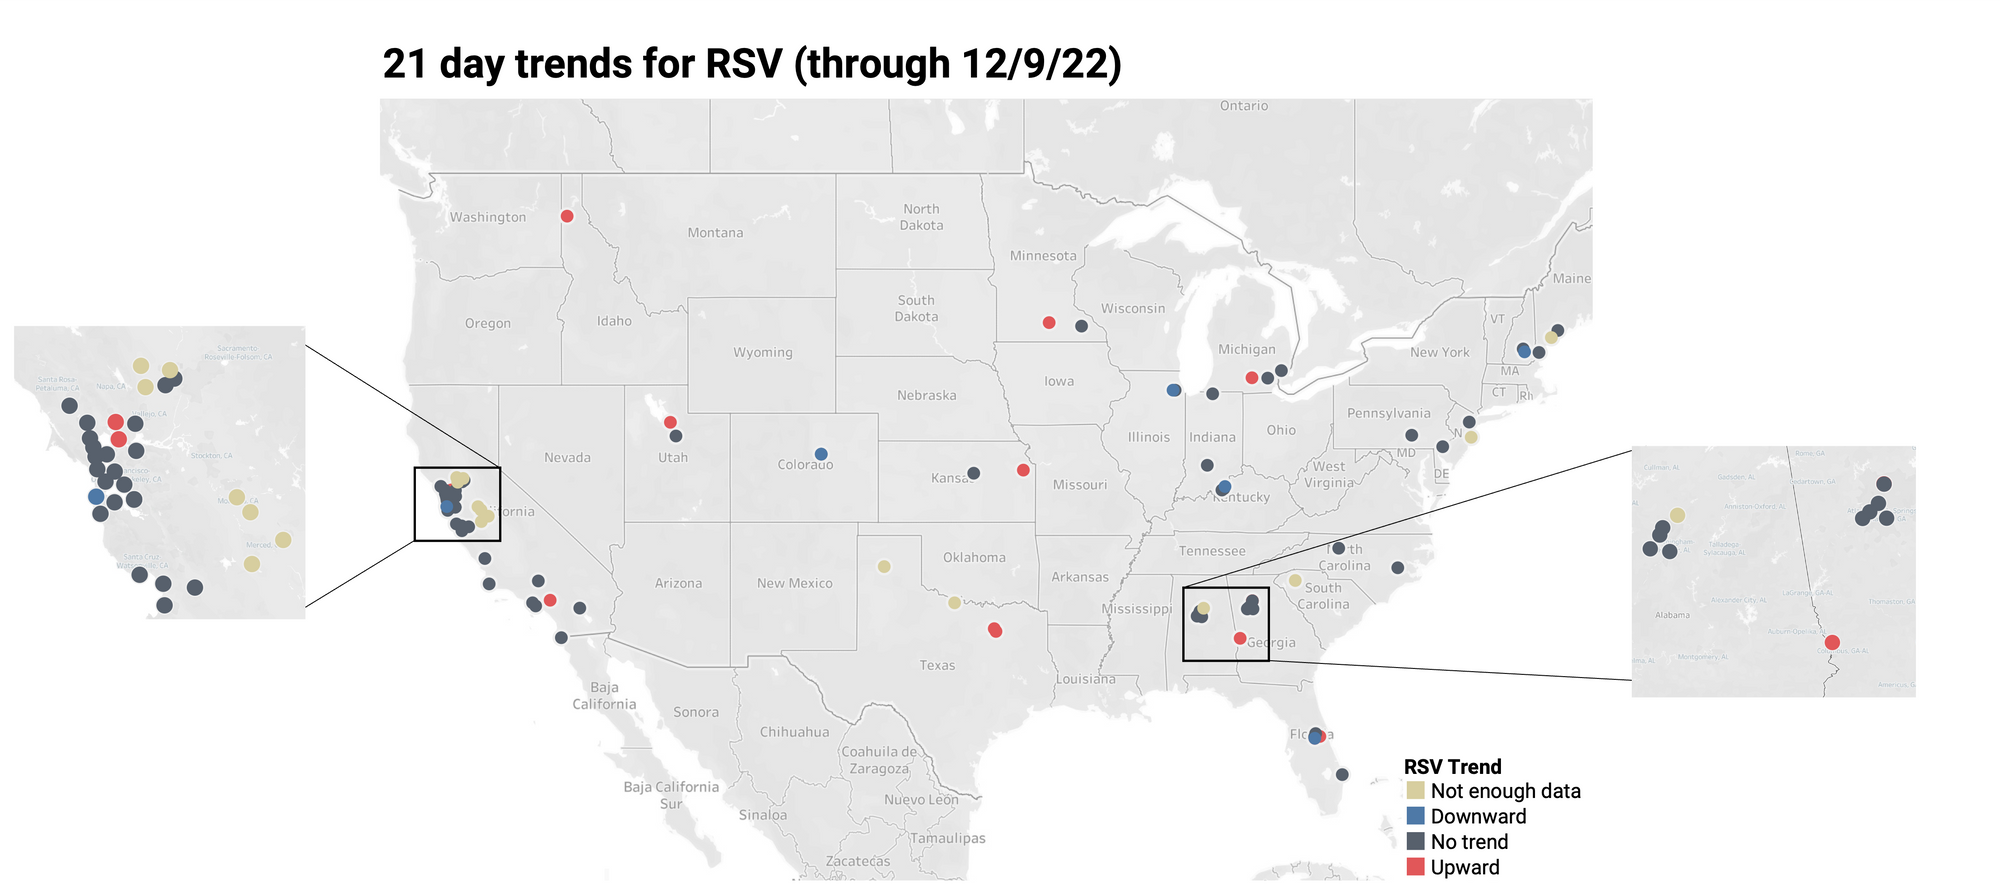
Below is the trend analysis for the RSV RNA concentrations (normalized by PMMoV) in wastewater solids at the plants. Red indicates a significant upward trend, blue is a significant downward trend, and dark grey is no trend. Tan indicates that there were not enough data points to calculate a trend. We will be working to refine these plots in the coming weeks including the choice of colors.
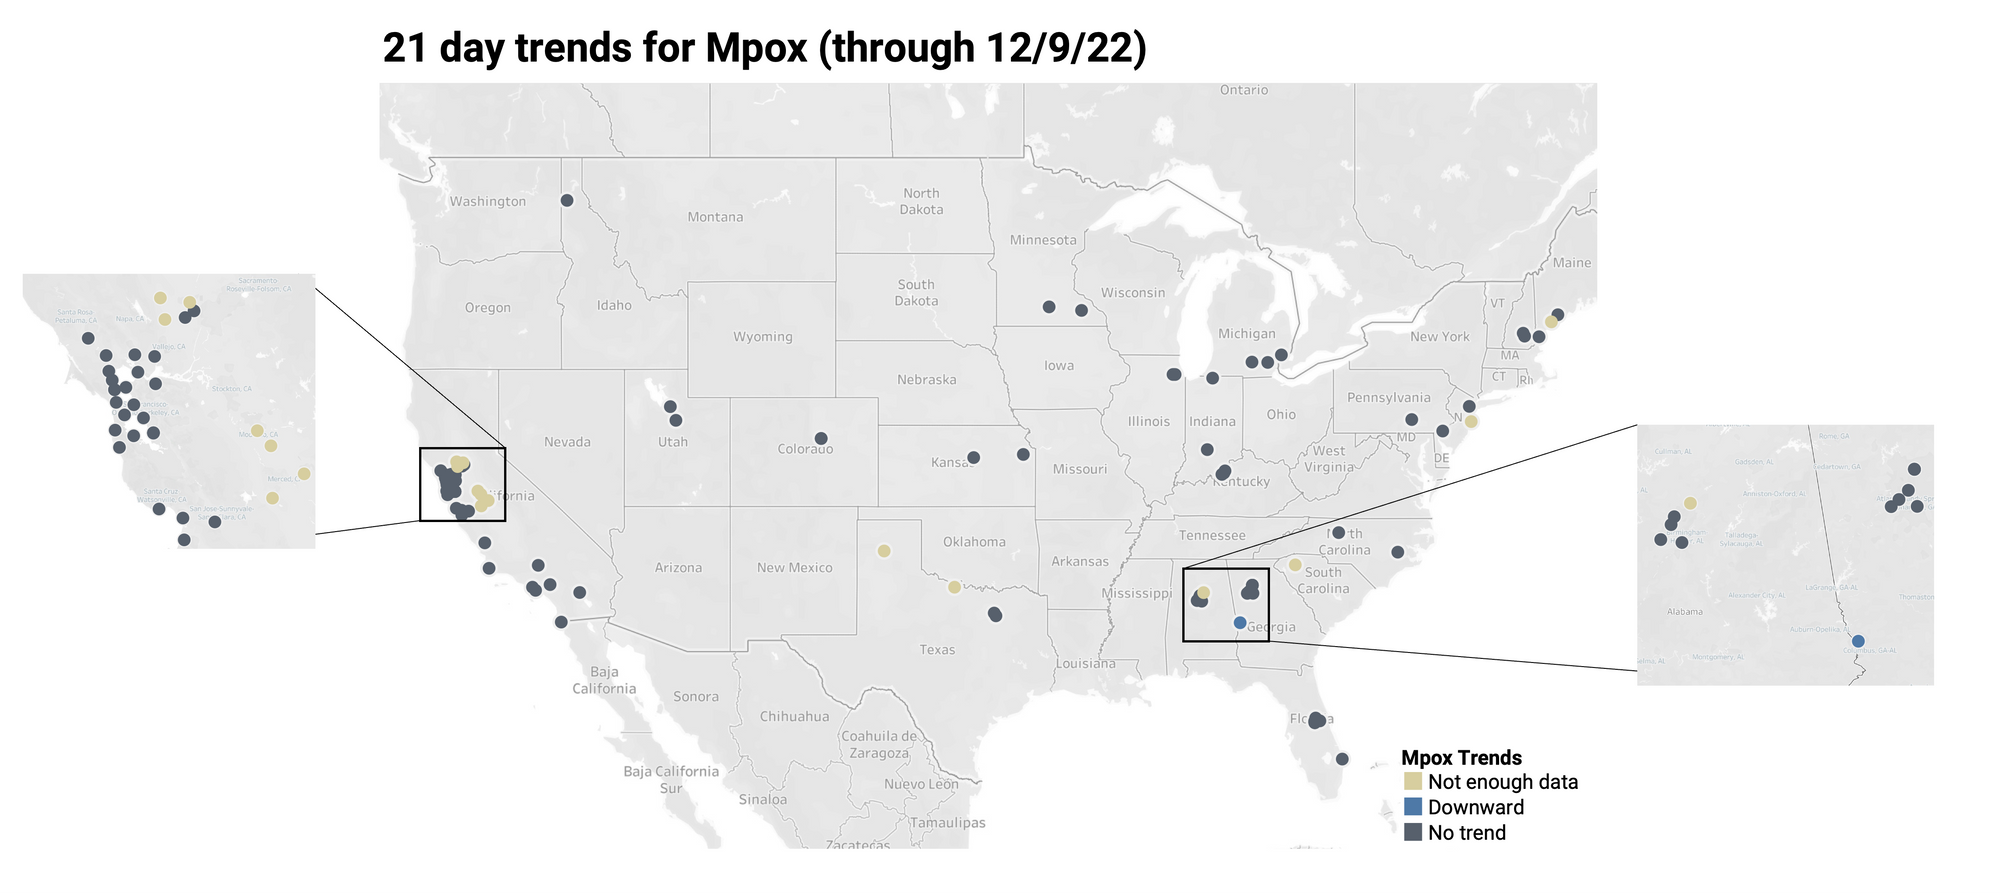
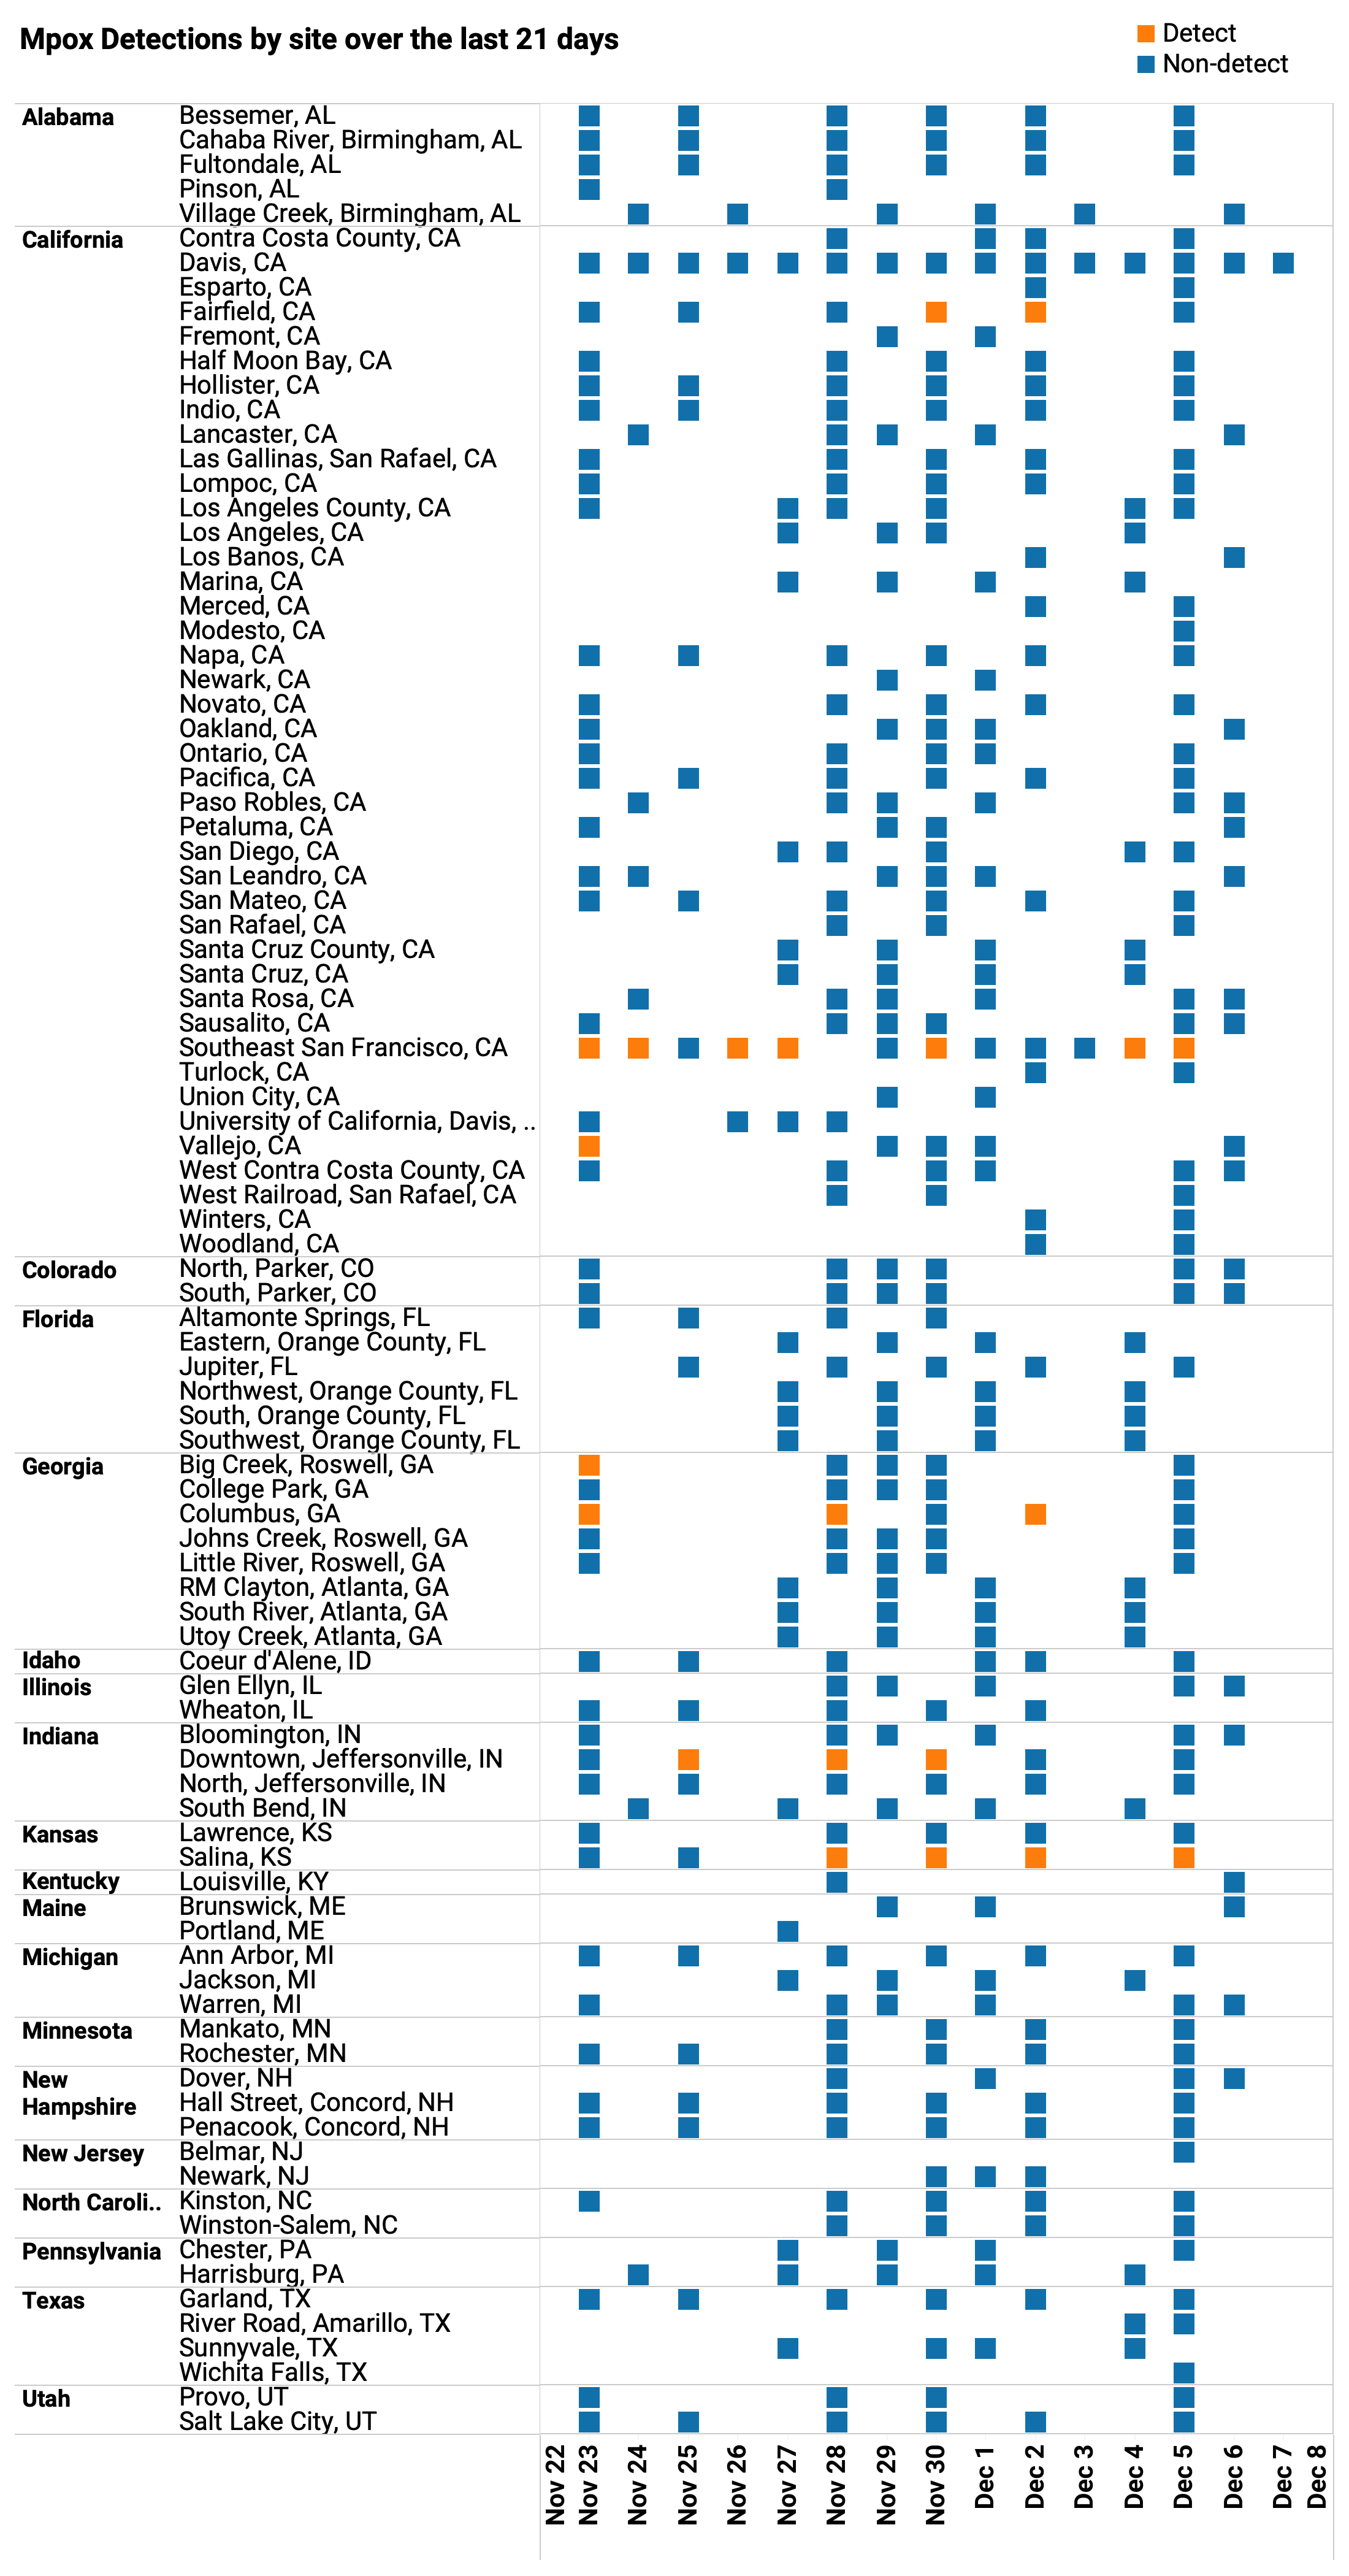
MPOX Virus Trends
Detection of mpox DNA in wastewater solids across partner sites is rare. However, mpox is still circulating, and periodic detections remain likely. Below is a heat table of mpox DNA detections over the last 21 days across all the sites across the country in the program.
Below is the trend analysis for the MPOX virus DNA concentrations (normalized by PMMoV) in wastewater solids at the plants. Red indicates a significant upward trend, blue is a significant downward trend, and dark grey is no trend. Tan indicates that there were not enough data points to calculate a trend. We will be working to refine these plots in the coming weeks including the choice of colors.