
Bay Area SCAN weekly update 12/7/22
Hi Everyone-
All samples picked up by the couriers as of 12/6/22 have been processed and their data are on the site: wbe.stanford.edu. All data can be accessed through the CSV downloads below, including the new data products for influenza B (IAB) and norovirus (HuNoV). IAB and HuNoV data are also on the website now.
Change alert - Due to CDC guidance, we changed the MPXV assay from G2R_G to G2R_WA. We also created a combined variable that concatenates the two G2R data streams. See the read me file for more info.
COVID-19
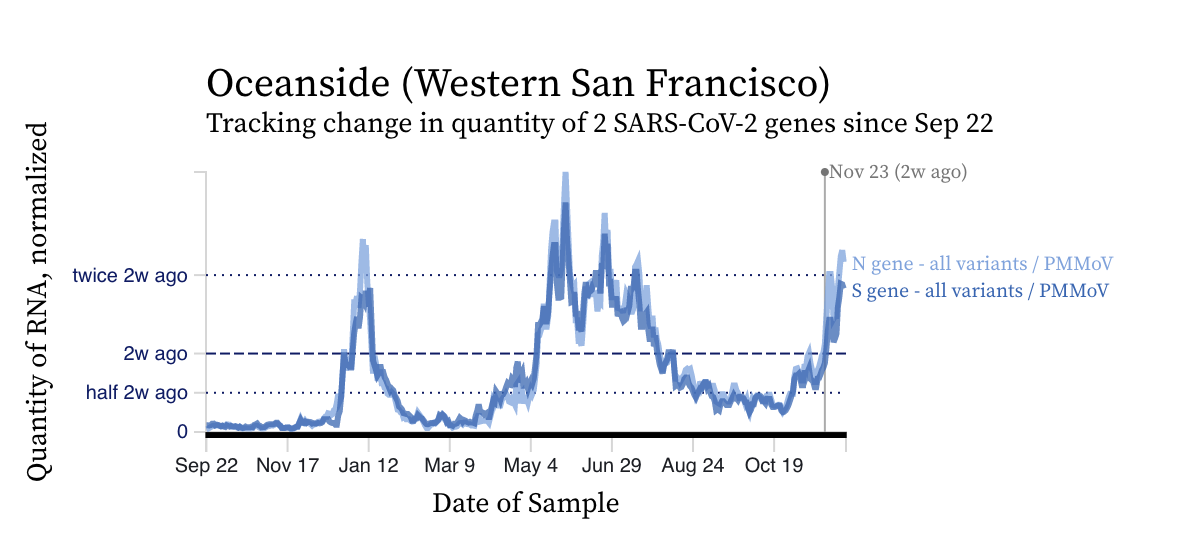
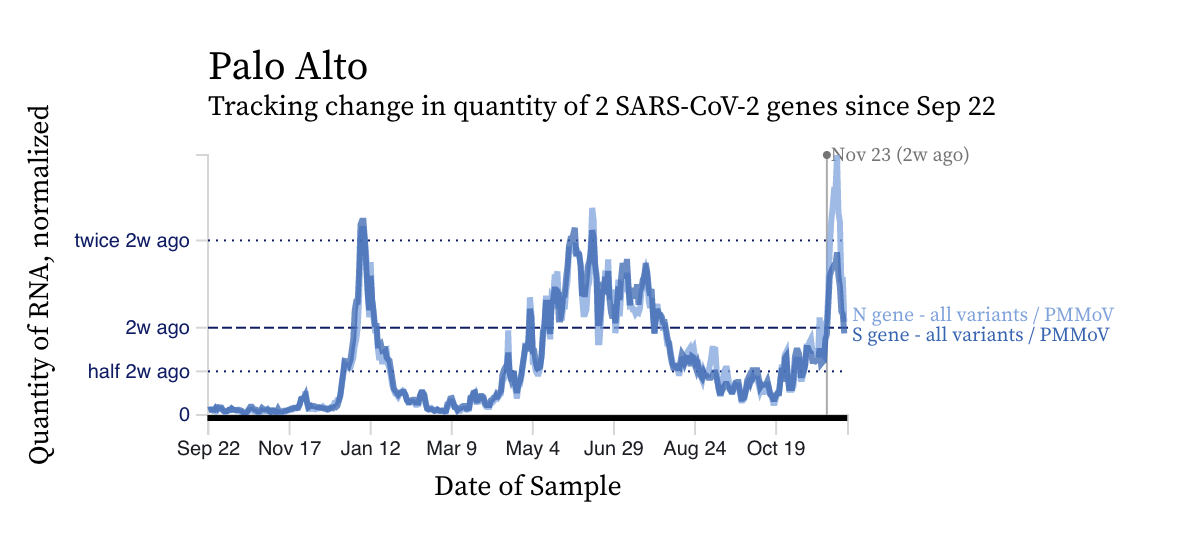
The concentrations of SARS-CoV-2 RNA we are seeing in wastewater are high, approaching or higher than levels observed during the BA.1 and BA.2/BA.5 surge at some plants. Here are examples from Oceanside and Palo Alto. All plants are seeing increasing trends.
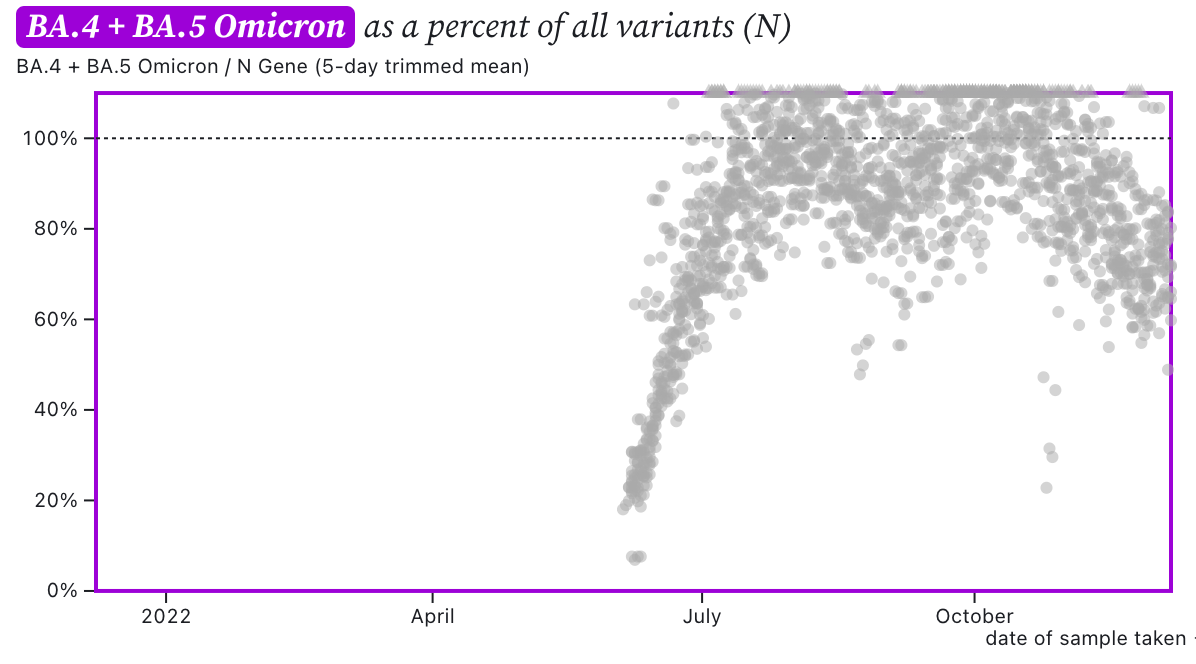
The HV69-70 mutation present in BA.5 and B.Q* sublineages is still present in the majority of circulating SARS-CoV-2, but as we pointed out last week, the ratio of HV69-70/N appears to be starting to decrease. Here is a plot of the HV69-70/N ratio over time at all the plants. The grey symbols are from all the plants in SCAN (you can access the plot and play around with it here). This is a bit of a mystery since HV69-70 is present in nearly all BA.5 and BQ.*. There are some sublineages where HV69-70 deletion is not present at 100% including BQ.1.1.9 and BQ.1.8.90. Otherwise, XBB and BA.2.75 do not have the mutation. The decrease in this ratio is so recent, we do not have sequencing data to really support an explanation (since the most recent sequencing data is from 2 weeks ago), but hopefully in a week or so, we will have that and can better understand why we are seeing this, and if this decrease is real or just variability in the data.
The sequencing data from samples from SAC, Oceanside, and SJ between 11/14 and 11/26 suggest that BQ.1* is dominate in wastewater and we continue to see evidence of BA.2.75, BA.2.3.20, and XBB at all three sites, but none of these other non-BQ variants appear to be increasing in proportion of total SARS-CoV-2.
IAV, IBV, RSV, HMPV
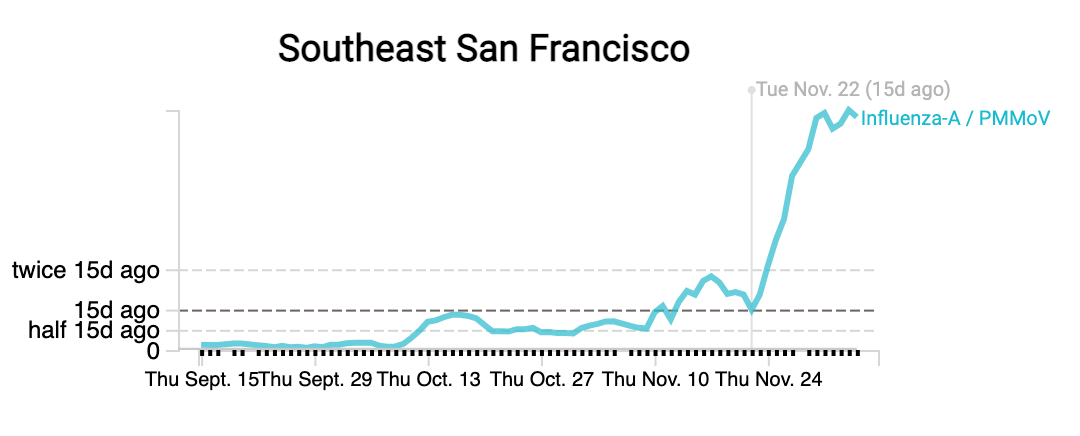
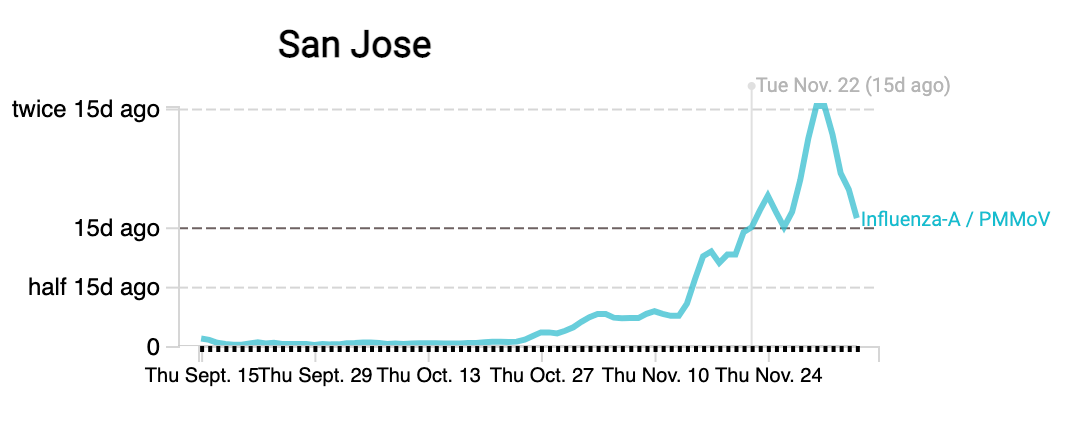
Influenza A (IAV) RNA concentrations are high (on the order of 10^5 copies/gram) across the plants. Whereas Southeast plant in SF has had concentrations more than double over the last two weeks, other plants have seen some flattening off over the last two weeks. As always, we need to see if this is a true downturn or leveling off or if we see levels tick back up with more sampling. Here are examples from Southeast and San Jose:
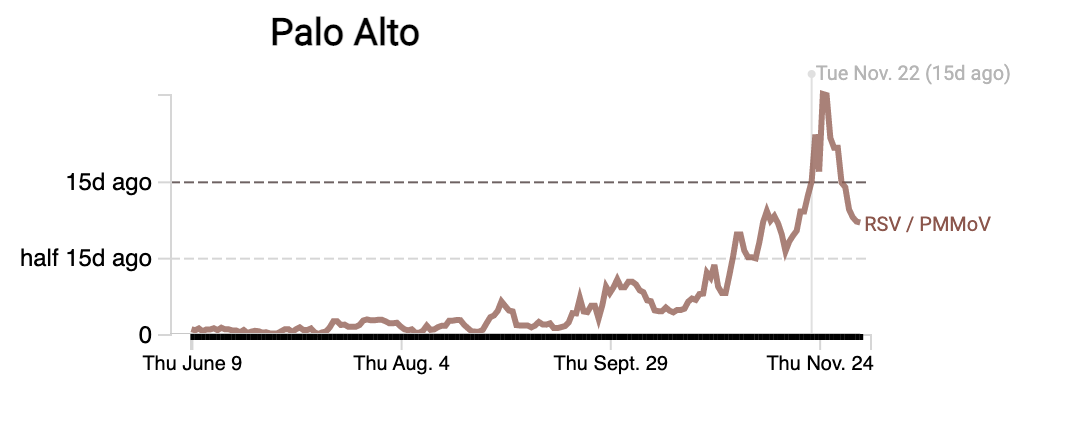
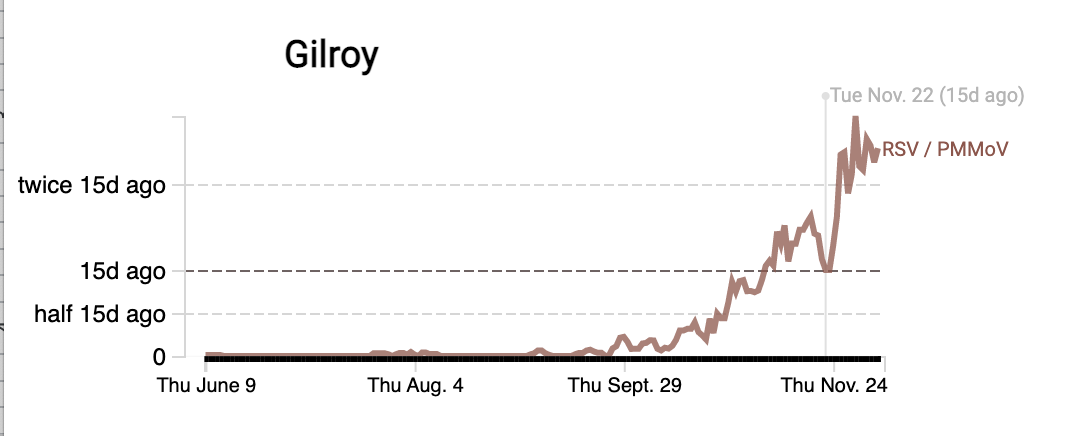
RSV RNA concentrations continue to be high (also on the order of 10^5 copies/g). Some plants have increasing trends over the last two weeks (gilroy), while some actually appear to have had a downturn (PA). Please head to the website to see data from more plants (link).
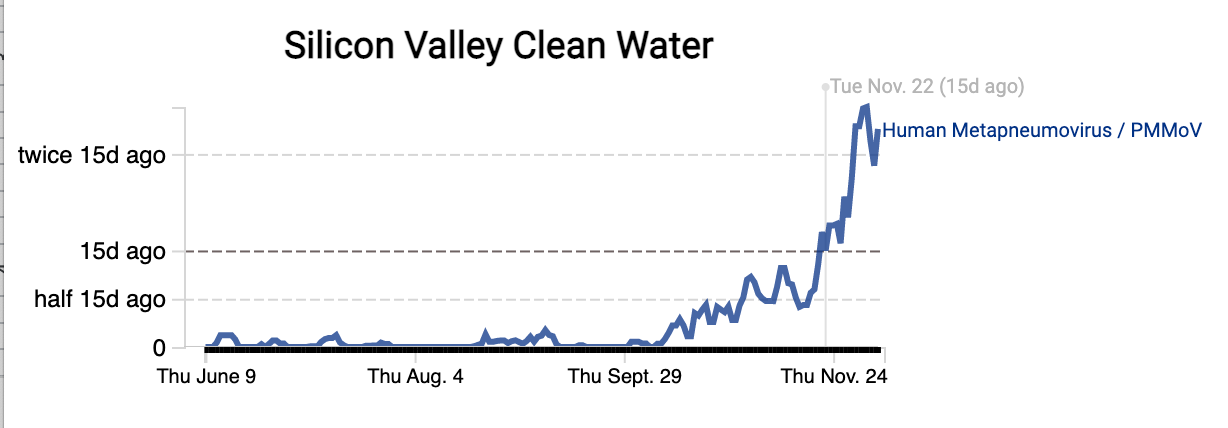
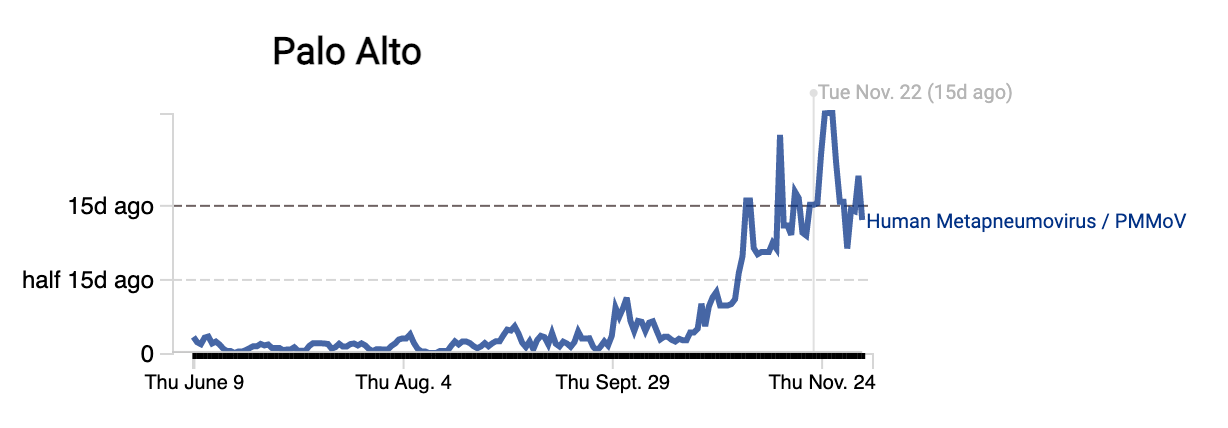
HMPV (human metapneumovirus) RNA concentrations are also high (approaching 10^5 copies /g) at the SCAN plants and are clearly on the rise over the last two weeks at some plants (see Silicon Valley Clean Water in San Mateo county) and have no trend over the last two weeks (see Palo Alto):
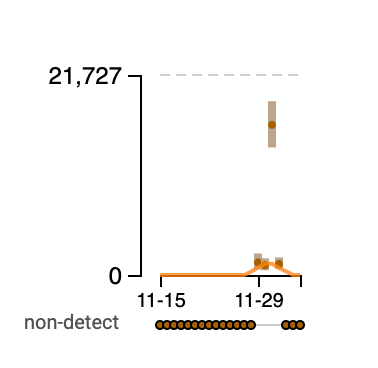
Influenza B (IBV) RNA concentrations are non-detect in most samples. We have detected it 4 times in SJ, 1 time in PA, 5 times in Silicon Valley clean water, and 1 time in SAC. All detections have been at very low concentrations with the exception of one sample from SJ. Here is a screen shot from the drill down page of the IBV data from SJ:
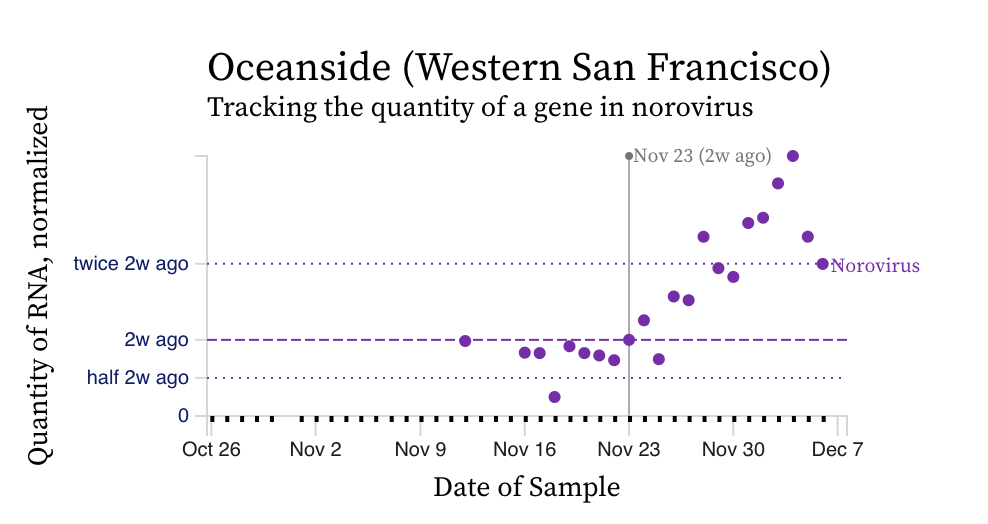
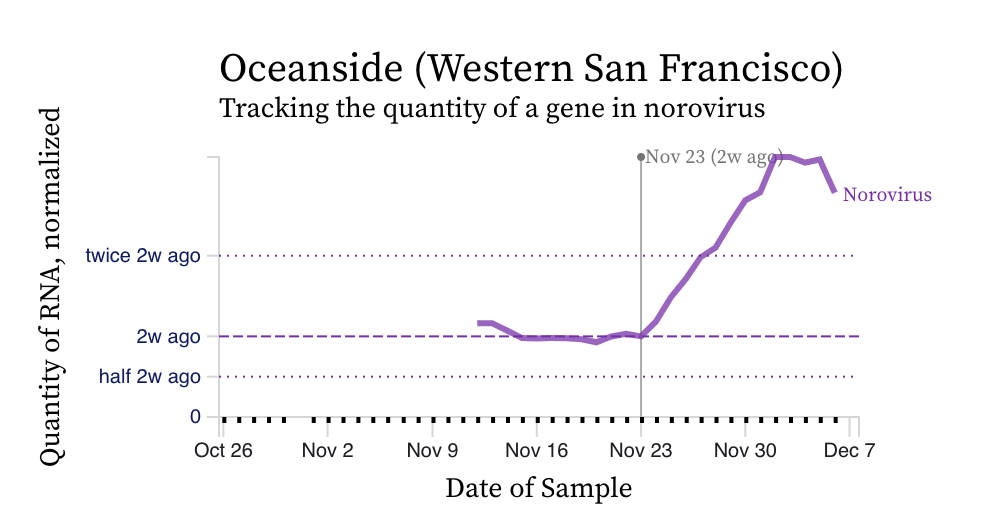
Norovirus RNA concentrations have been measured for about 3 weeks now at all the SCAN plants. We have observed concentrations between 10^4 cp/g and 10^8 cp/g. Concentrations appear to be trending up over the last 2 weeks at some places. Here is an example from oceanside showing the line chart and the raw data (You can access the data in this form at this link):
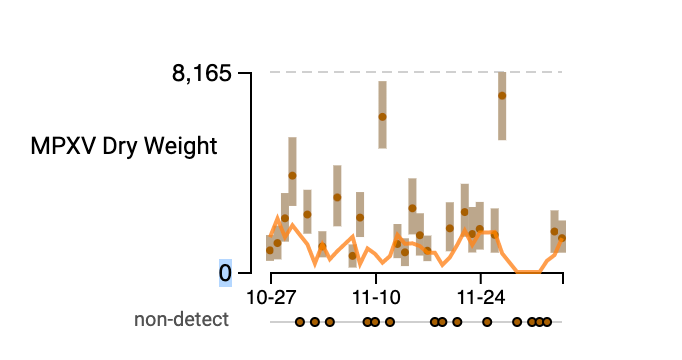
MPXV We are seeing mostly non-detects in the past week for MPXV DNA. Overall, this is good news . The only exception is for Southeast where we still have detections, at low levels. Here is a plot of the data from the drill down page:
Thanks!
Ali
<><><><><><><><><><>
We created a re-direct site for the graphs that is easy to memorize: wbe.stanford.edu.
These redirect sites have heatmaps of monkeypox data: