Bay Area SCAN weekly update 2/17/23
All samples picked up by the couriers as of 2/15/23 have been processed and their data are on the site: wbe.stanford.edu. The data from the SCAN sites are also on the new site designed by Stamen data.wastewaterscan.org. If you notice any bugs on the new site or have any comments about it, please email Amanda Bidwell at albidwel@stanford.edu.
We stopped measuring the SARS-CoV-2 S gene so we could run an assay for 5 uniquely adjacent SNPs in XBB*. The new primers and probe sequences are available at our protocols.io site. The new assay is designed to detect both XBB and XBB1.5.
COVID-19
SARS-CoV-2 and Variants
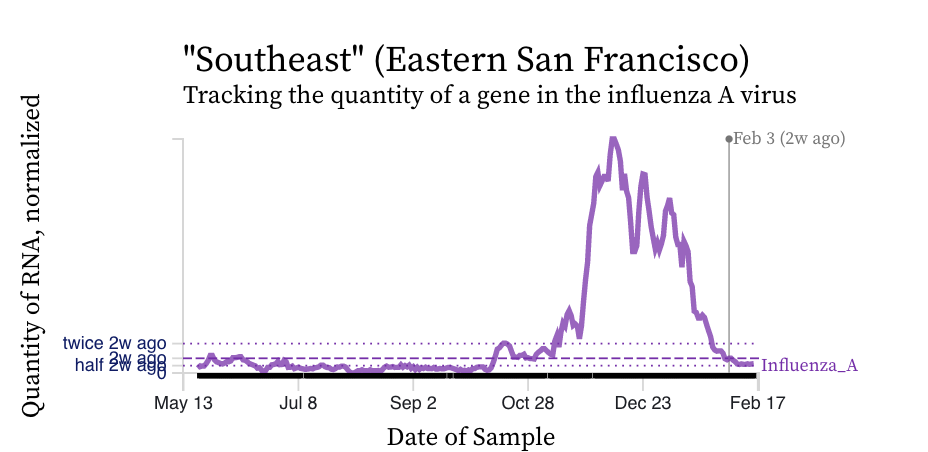
SARS-CoV-2 RNA concentrations show a range of trends over the last week. Some plants are showing an increasing trends, while others less so. Here are example charts from Southeast in SF showing an increasing trend and Palo Alto showing a relatively flat trend.
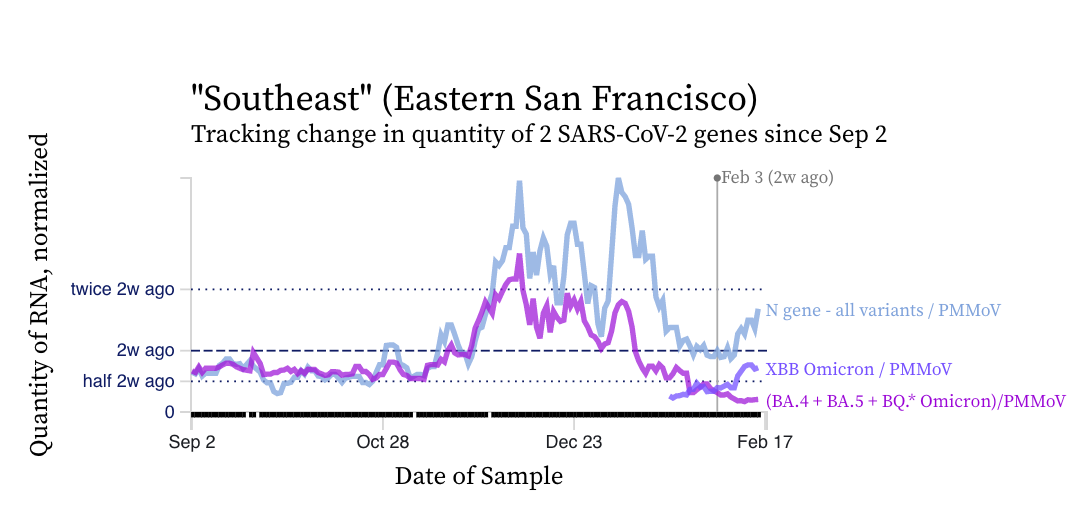
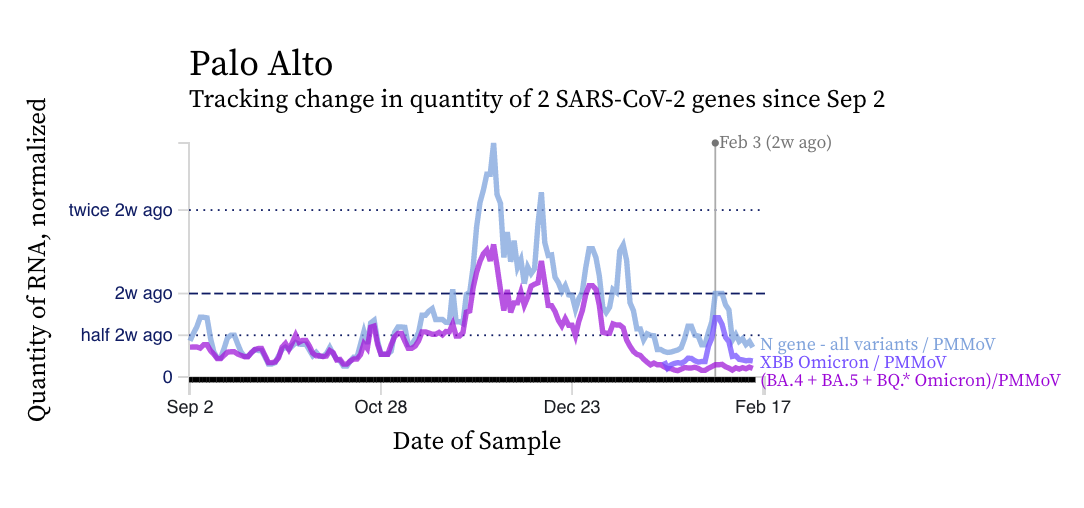
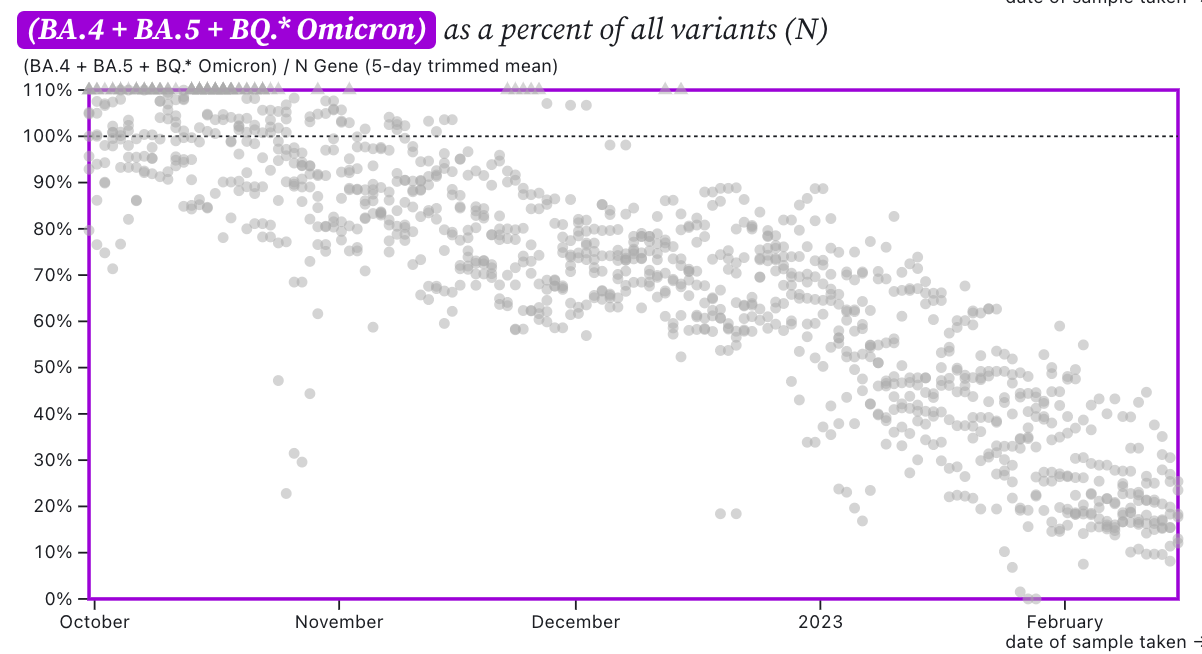
The two charts above show that the mutation in XBB* (shown in violet) is closer to the blue line (showing the N gene, present in all variants) than the bright purple line (showing the mutation present in the BQ* and BA.5 sublineages). This indicates that most of the shedders in the sewersheds are likely infected and shedding XBB* rather than the other variants.
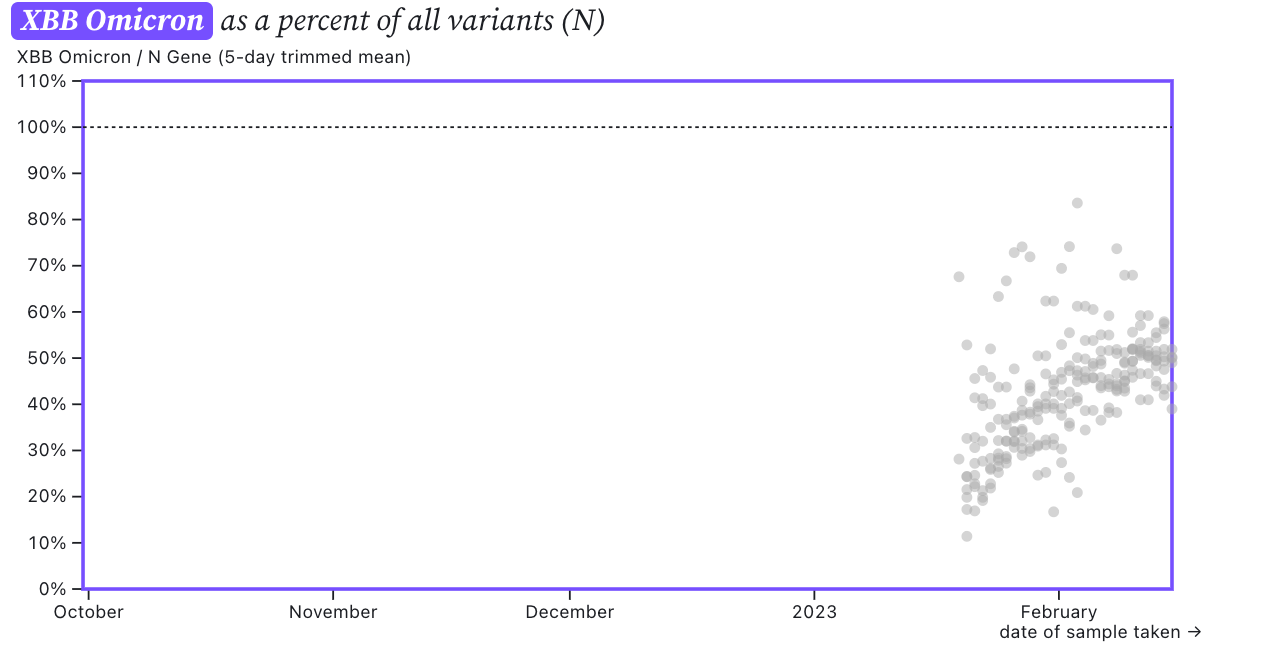
The ratio of the XBB* mutations/N across SCAN plants is shown in the chart below. As the ratio reaches 100%, it suggests that all the SARS-CoV-2 genomes in wastewater have the XBB* mutations. These data indicate that the regional average ratio XBB* mutations/N is ~50%, and there is an increasing trend. This suggests ~50% of infections across the communities are caused by XBB or XBB1.5 and the percentage is increasing.
The chart below shows the ratio of the BA.5, BA.4, and BQ* mutation/N across SCAN plants. It can be read the same way as the above chart. The regional average ratio is about 20-30% and has a decreasing trend.
Other Respiratory Viruses
IAV, IBV, RSV, and HMPV
Influenza A (IAV) RNA concentrations have dropped across the plants, even at Sunnyvale where concentrations seemed to have had an uptick last week. Concentrations are generally on the order of 1,000 copies per gram dry weight of wastewater solids, and we even have some non-detects at some plants.
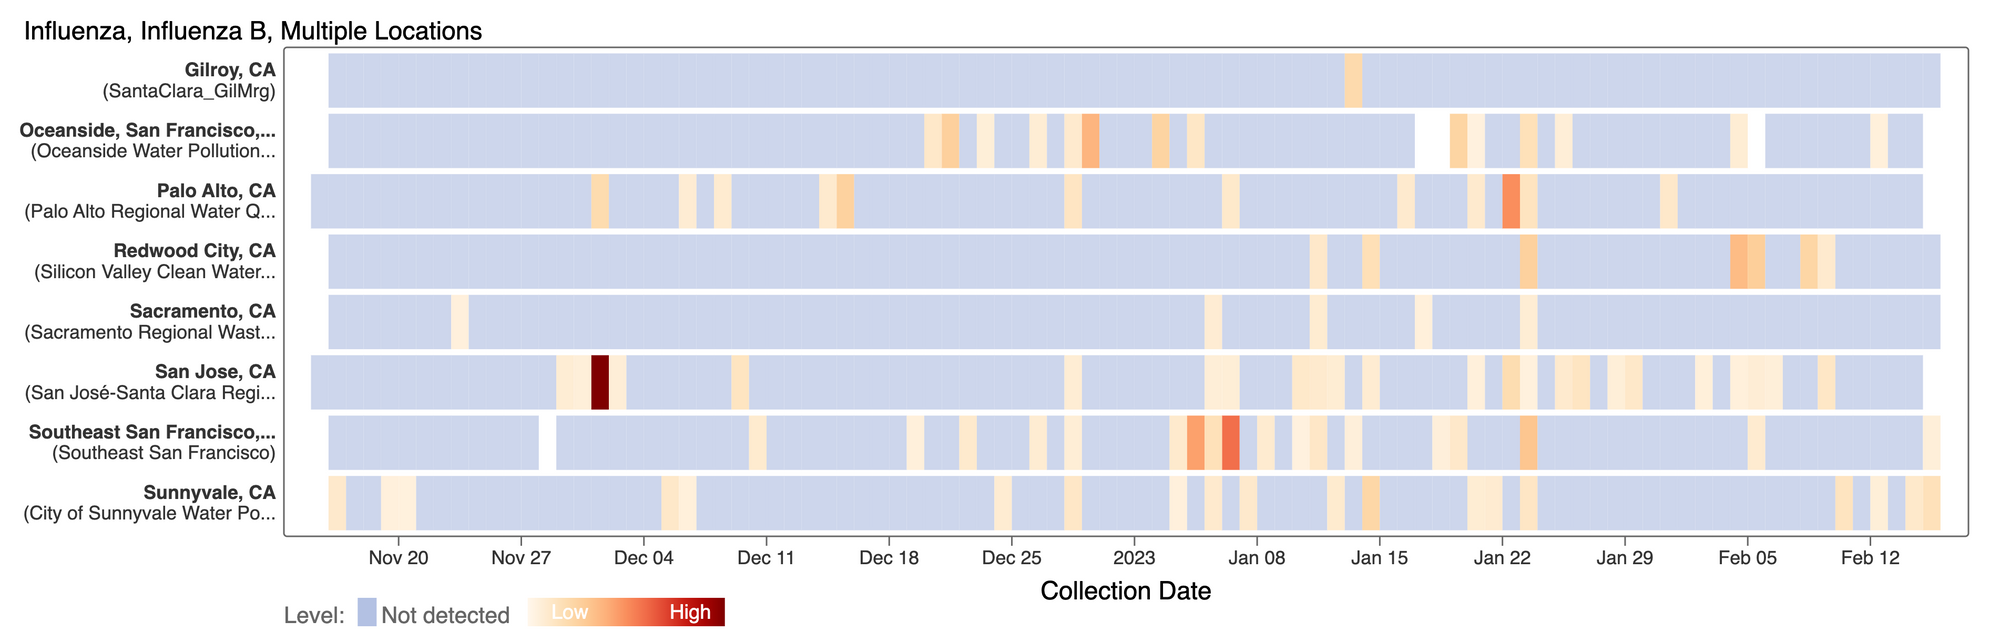
Influenza B (IBV) RNA concentrations continue to be sporadically detected at low concentrations at the SCAN plants. A heat map is shown below of the IBV concentrations at the SCAN plants. Each plant is represented by a row (y-axis), and dates are shown along the x-axis. Blue indicates a non-detect, and darker orange/red is proportional to concentration with the highest values being darkest. Detections over the month of January 2023 have been in greater proportion across the plants than the month of December 2022. Here is the link to the chart - the linked chart will update automatically as more data are added to the site.
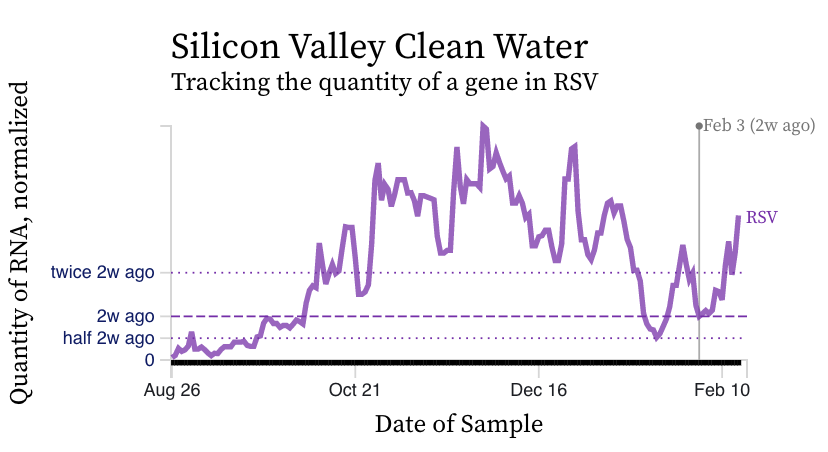
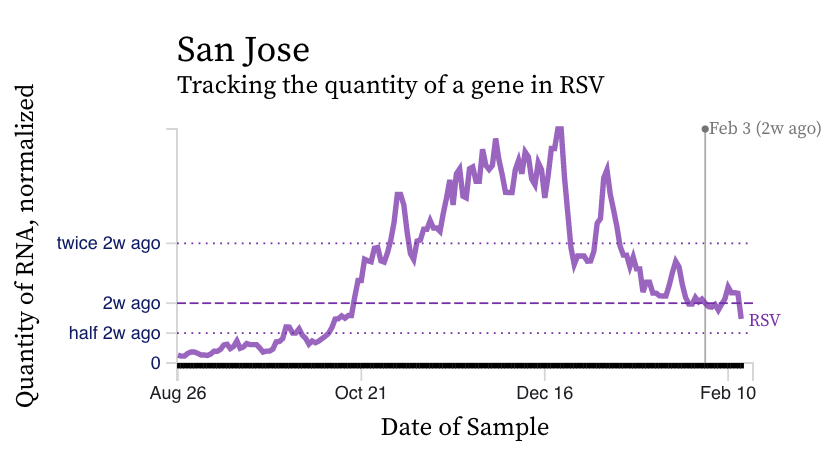
RSV RNA concentrations have decreased from their highest levels but concentrations remain elevated at ~ 10,000 copies/g, ten times our lower detection limit. Most plants have an "open curve" meaning that although levels are decreasing, they have not bottomed out (like IAV appears to have). At Silicon Valley Clean Water, RSV concentrations have increased over the last 2 weeks. Example charts from Silicon Valley Clean Water and San Jose are below to illustrate the trends.
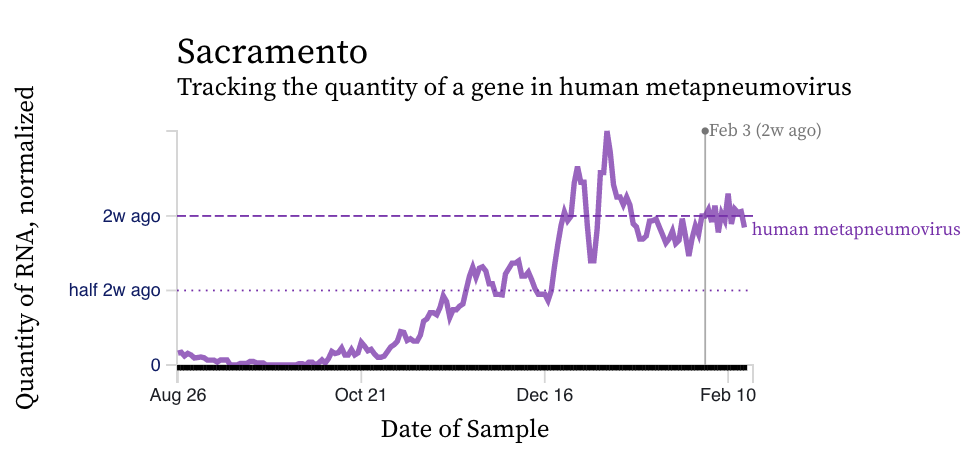
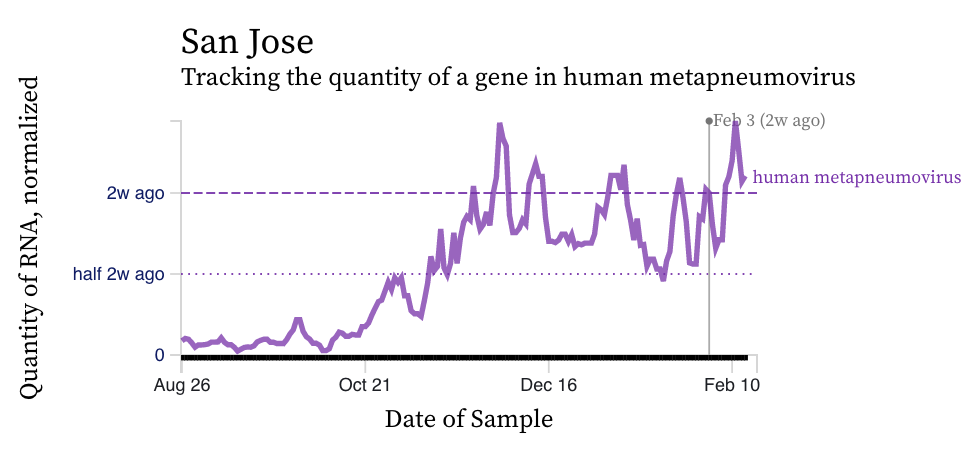
HMPV (human metapneumovirus) RNA concentration trends are more similar to RSV than IAV. There is a diversity of trends, but all data suggest the virus is still circulating, and being shed into wastewater in the communities. Below are charts showing data from Sacramento showing relatively high concentrations and a flat trend, and San Jose with a similar trend. It does not appear that concentrations of this viral RNA is decreasing.
Norovirus
Assay detects human norovirus GII
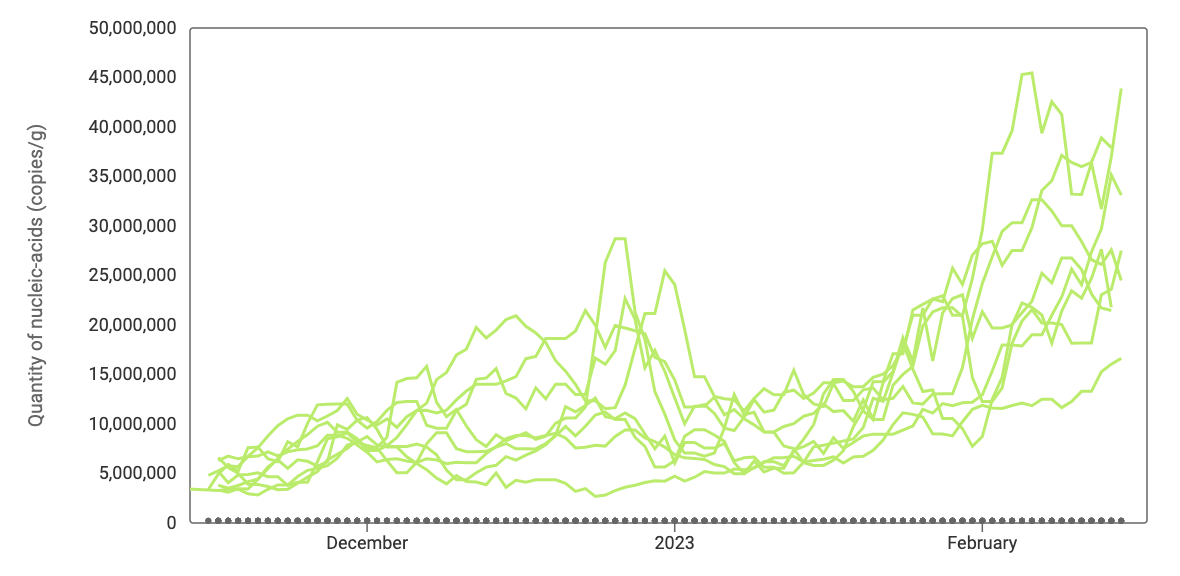
Norovirus GII RNA concentrations are high relative to concentrations of SARS-CoV-2. The median is 10^7 copies per gram dry weight (the highest we measure SARS-CoV-2 at is about 10^6 copies per gram). Norovirus GII can be shed in feces of newly infected individuals at concentrations as high as 10^11 copies per gram stool, so the high concentrations we are observing are not unrealistic. We do not measure Norovirus GI, which can also be present in wastewater. Here is a chart how Norovirus GII across all the SCAN plants with all the data we have collected over the last ~13 weeks. The link to the chart is here if you want to have a look and play with it. You can see that at most of the SCAN plants, the concentrations are tending upwards, which is consistent with some anecdotal evidence that there are increasing cases of norovirus in our communities. There were several news pieces on this last weekend, including one in the NY Times and one on ABC News.
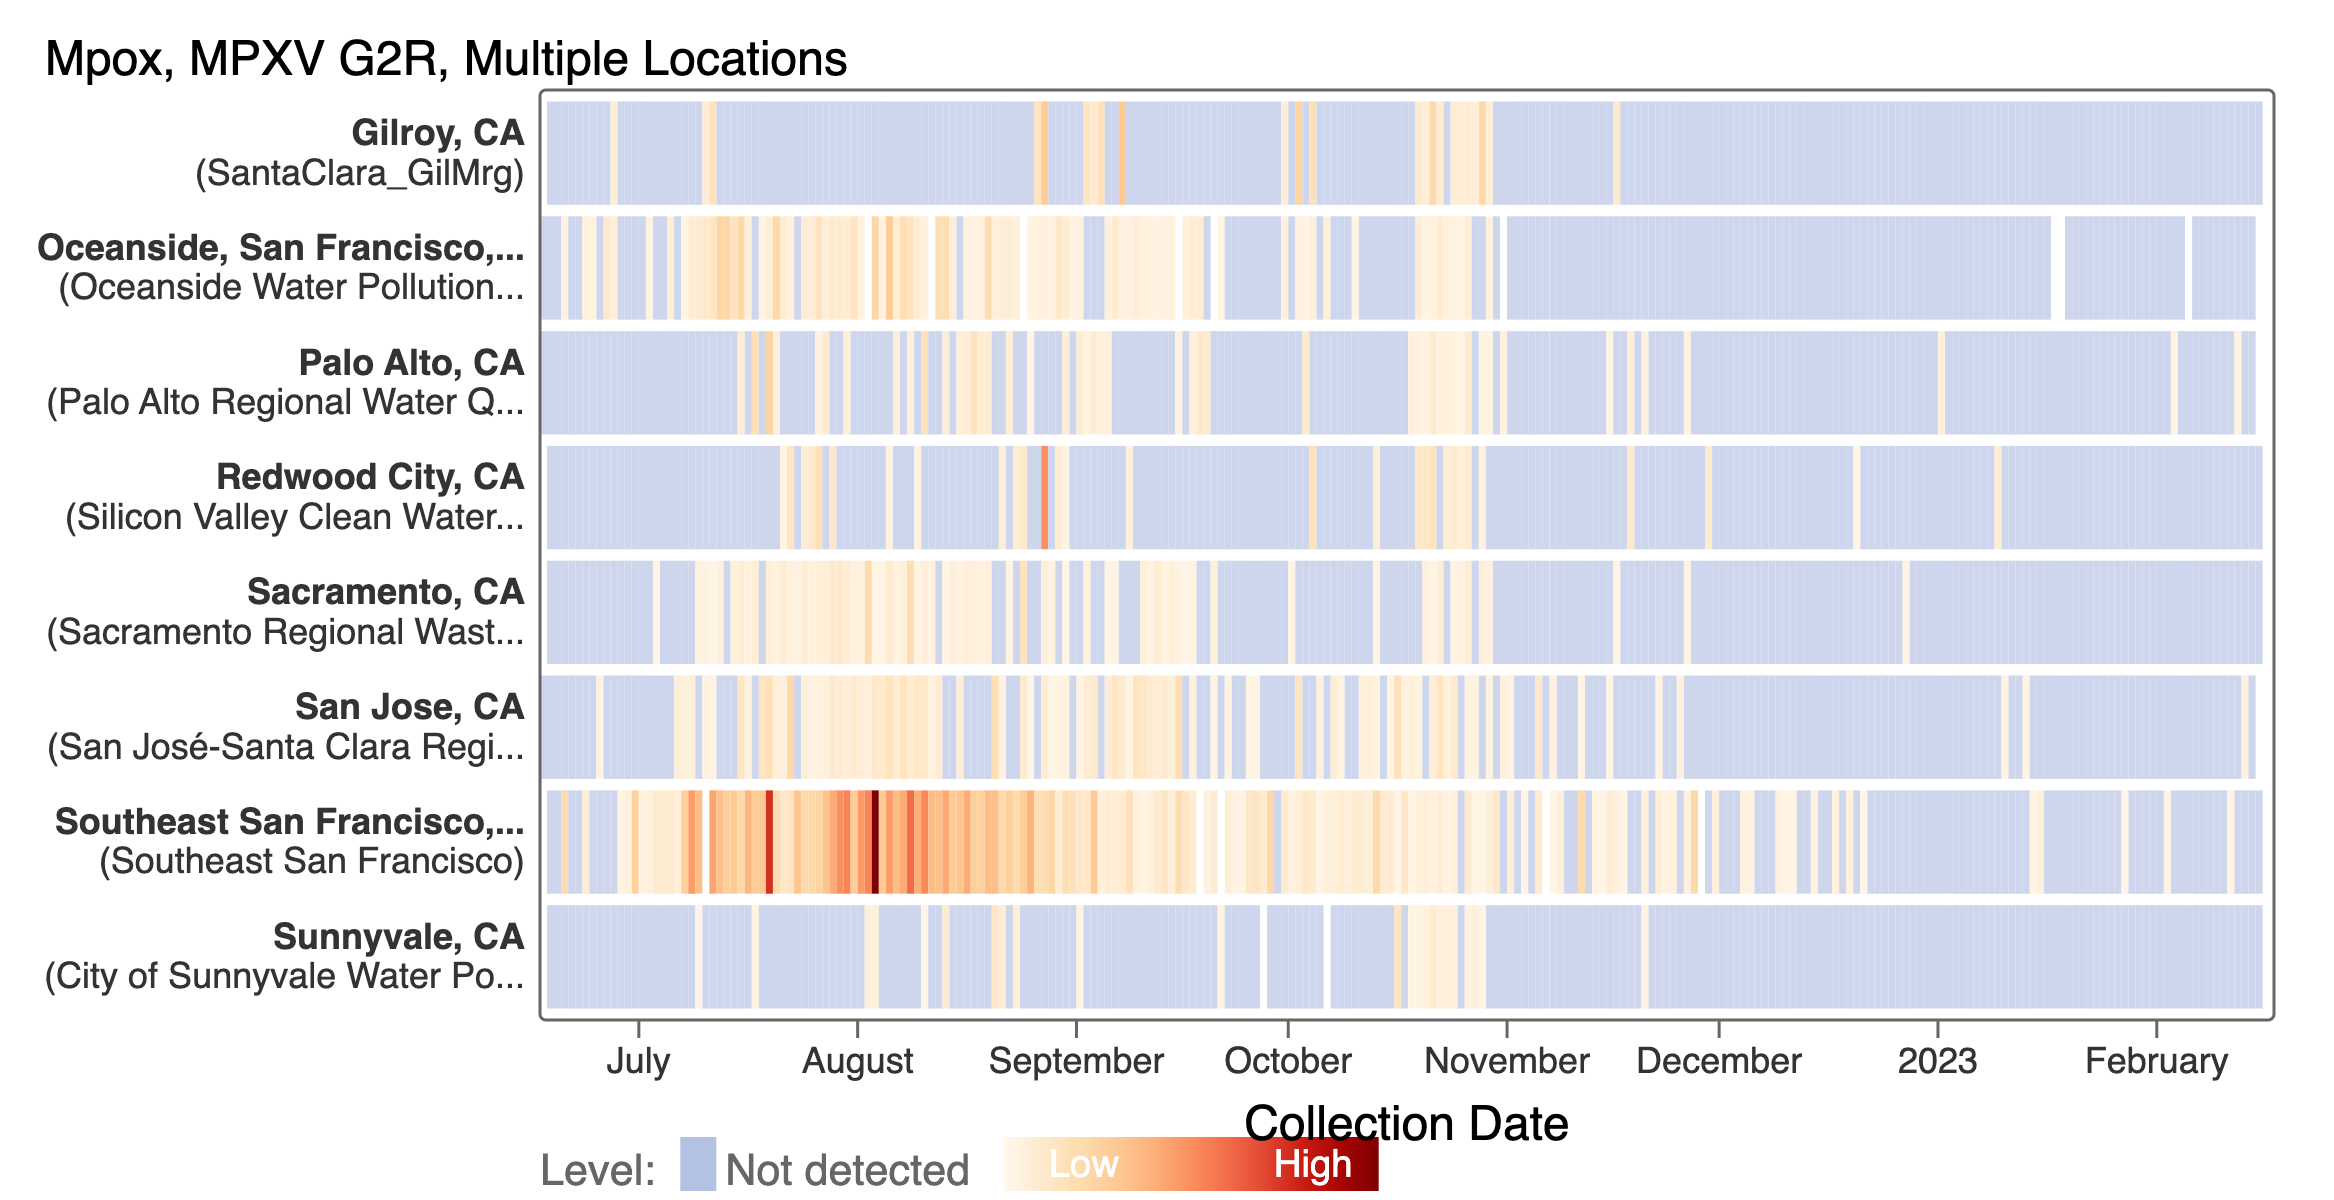
Mpox
We've seen mostly non-detects in the past week for MPXV DNA at most SCAN plants. This heat map shows all the SCAN sites as a row, and each date as a column. The color blue means the sample was non-detect for MPXV DNA and the colors get darker with higher concentrations. This chart highlights that we rarely have detections of MPXV DNA at these SCAN plants recently, but we can see how we had much more in the past. The state of CA just ended the public health emergency for MPOX this past week. You can access this plot here.