Nationwide WWSCAN Update 2/10/23
Hi everyone,
This newsletter contains updates on the WastewaterSCAN program. Below you will find information on the program in terms of participating partners, review of targets being measured, as well as trends in concentrations of infectious disease targets. We officially swapped the assay measuring the S gene out for one to track a mutation that identifies the XBB* lineage as of Monday, February 6, 2023. You can now see those results on data.wastewaterscan.org.
Enjoy your weekend,
Ali & Marlene
Participating Plants
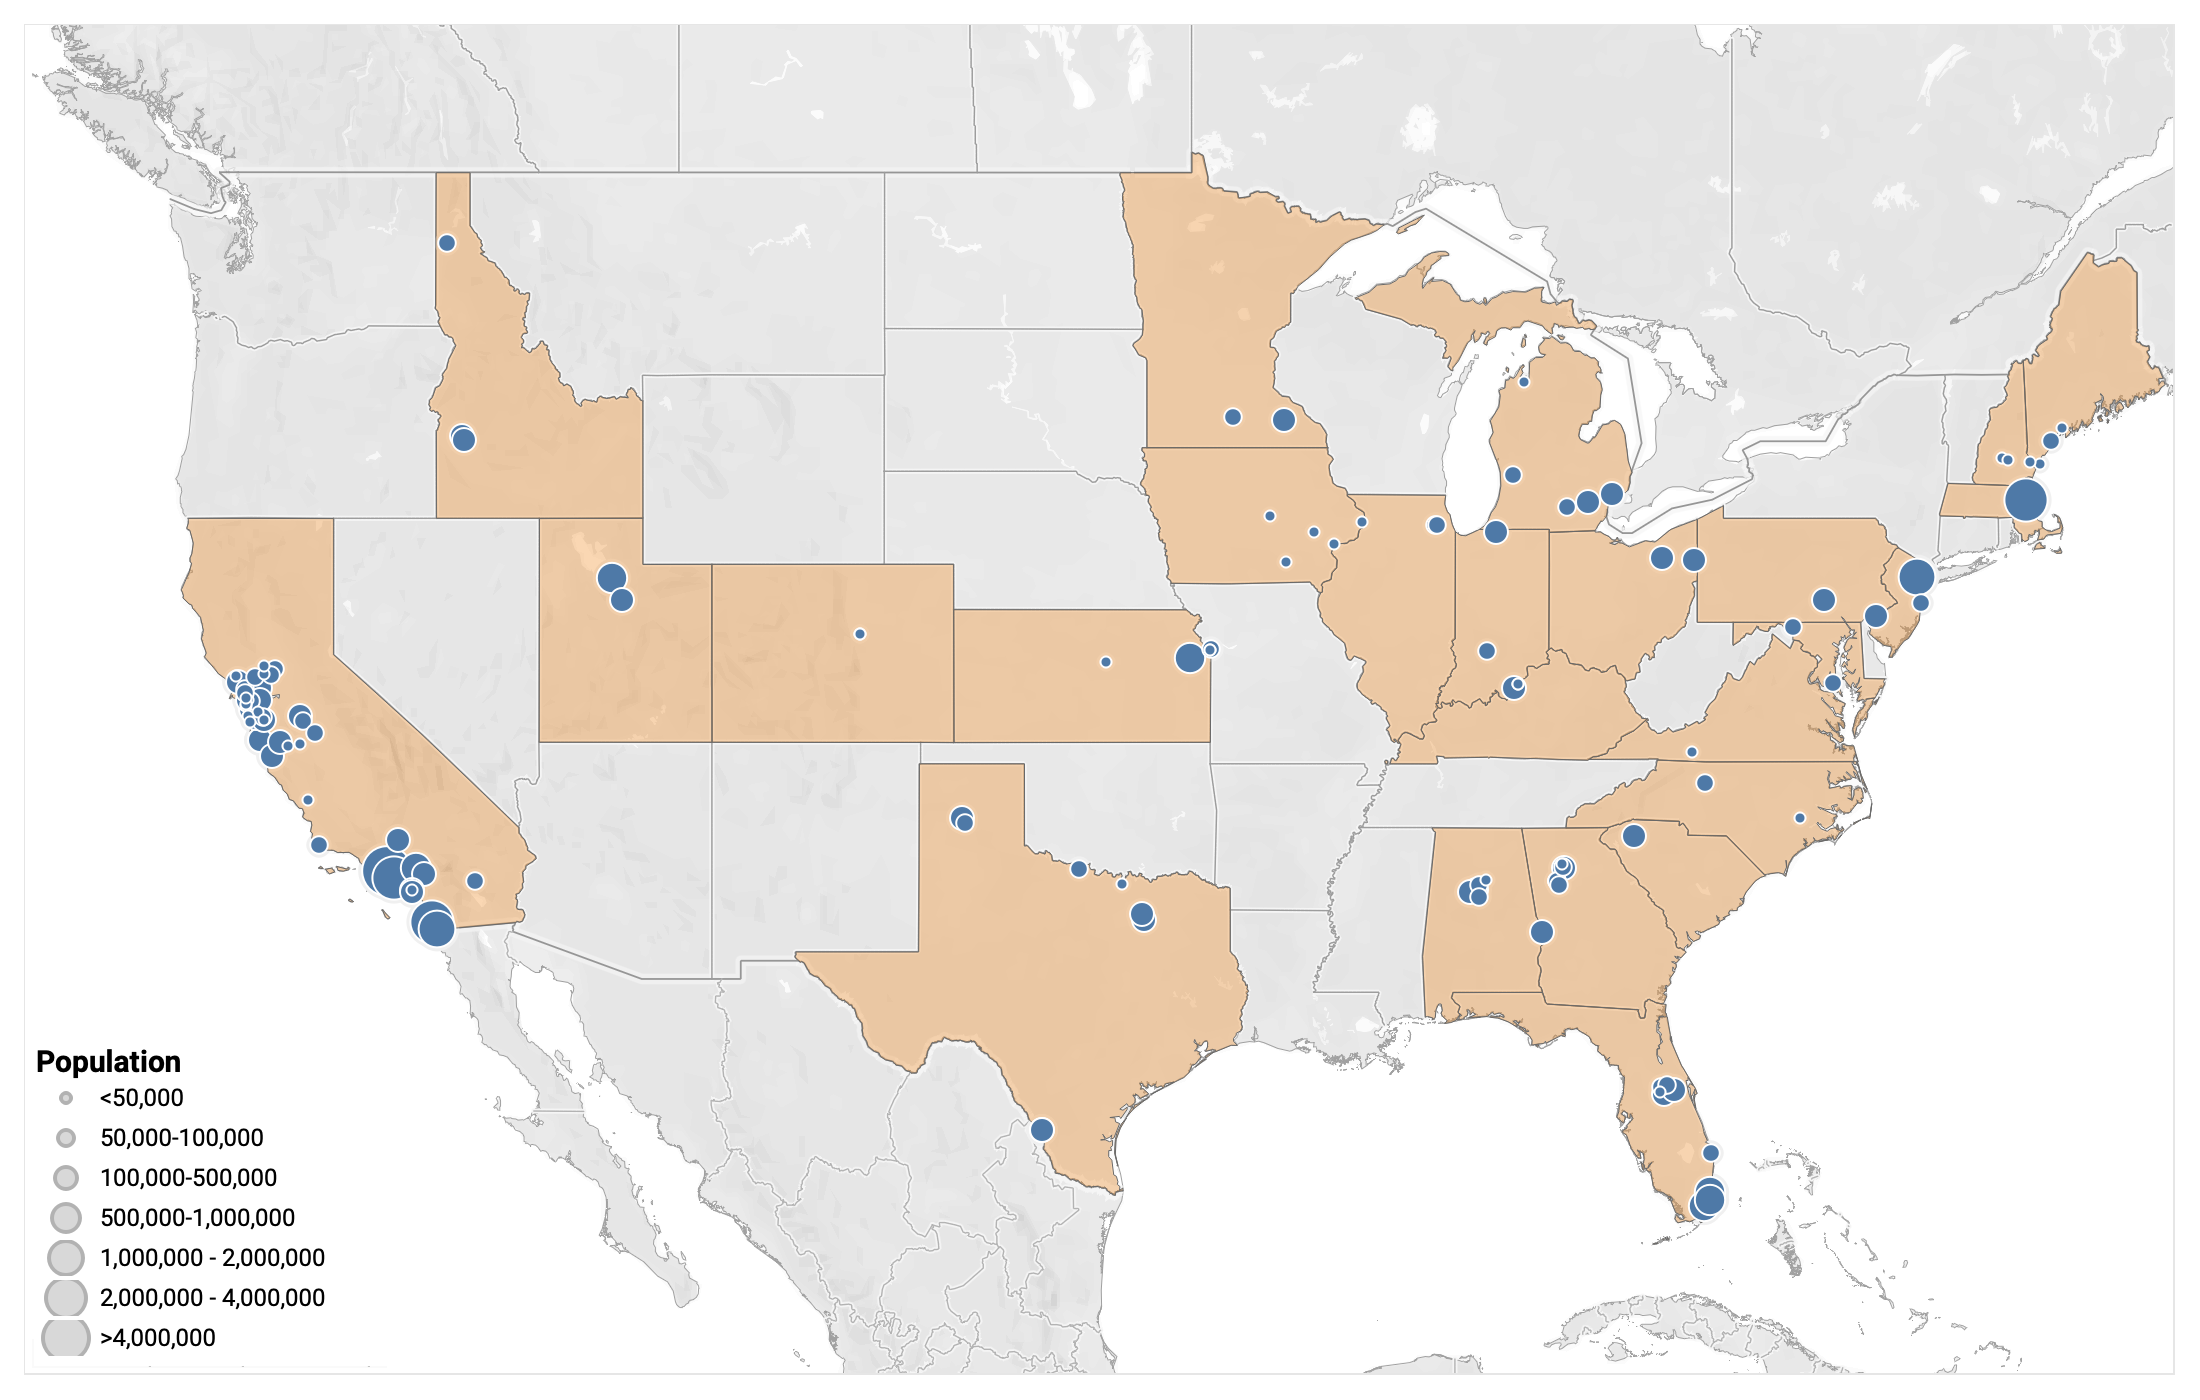
137 plants from 25 states are sampling, which represents >10% of the US population
Participants:
- 137 plants sampling
- 138 plants onboarded
- 10.16% US population represented (33,480,825 people)
- 25 states represented
Welcome, New Plants!
- Riverside, CA
- Millbury, MA
- Seaford, DE
- Stafford, VA
- Montpelier, VT
Infectious Disease Target Review
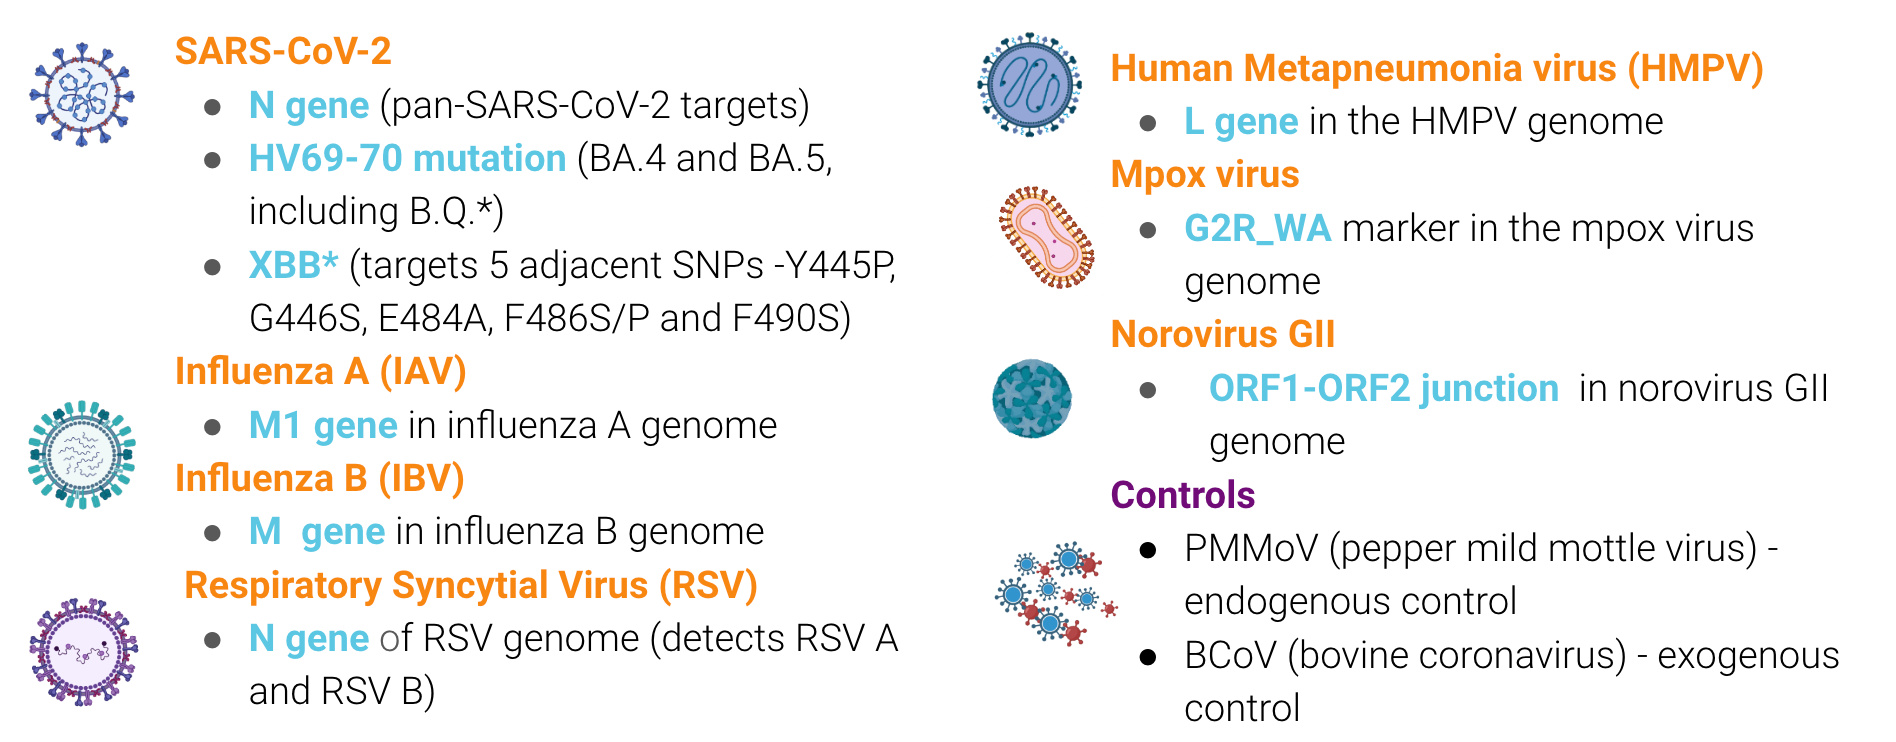
We are currently measuring seven pathogens and mutations characteristic of two groups of SARS-CoV-2 variants
The methods for our assays are in the public domain. You can access them using these QR codes:
WastewaterSCAN Dashboard
Visit data.wastewaterscan.org to learn more
Our new data platform went live on January 13, 2023. We hope you have been enjoying the new site. For a quick tutorial click the "start here" button on the chart view page.
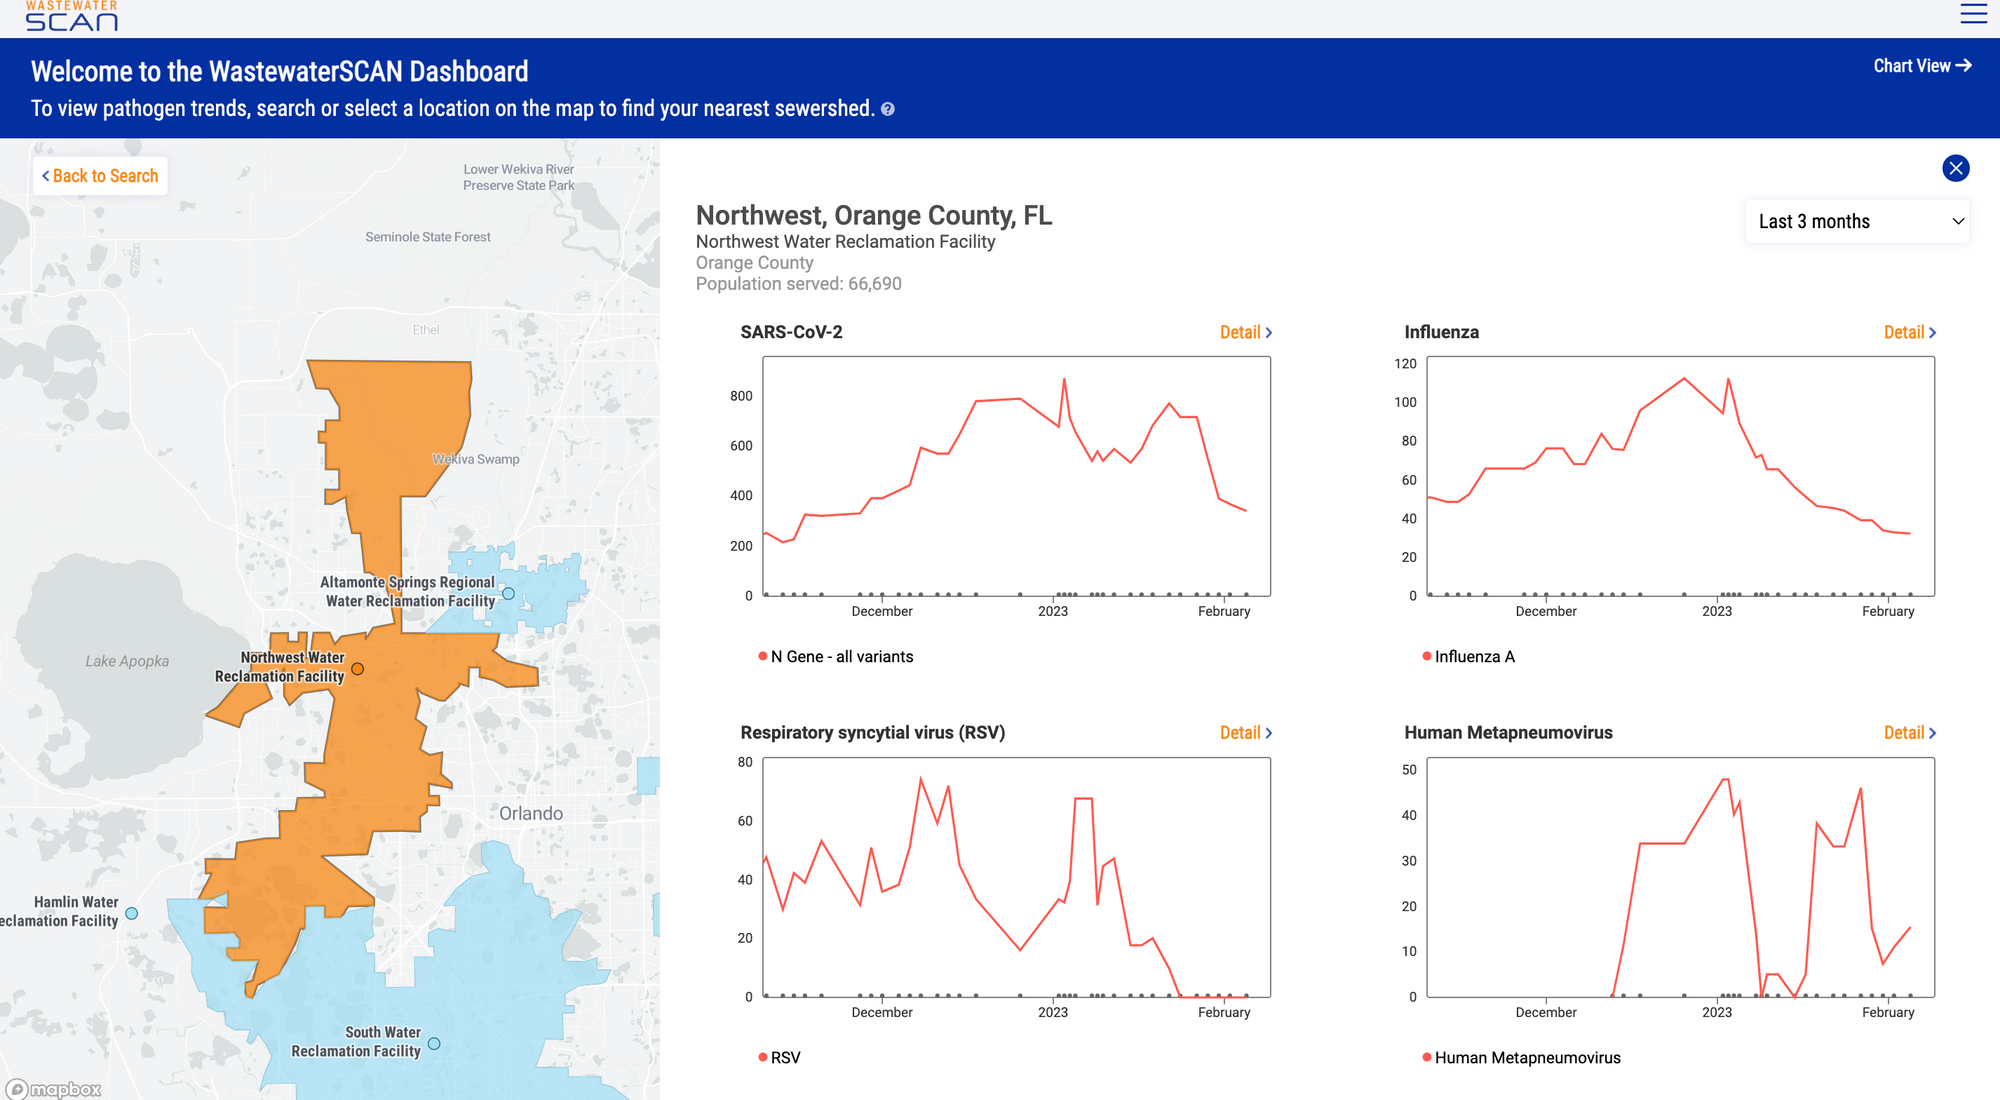
Below is an example view of results for a sewershed obtained by clicking on the location of the wastewater treatment plant in the map view. If you haven't already, please send in a shapefile or an image of your plant's sewershed coverage to be added to the map function. Please email files to Amanda Bidwell (albidwel@stanford.edu).
SARS-CoV-2 & Variants Trends
21-day nationwide wastewater trends
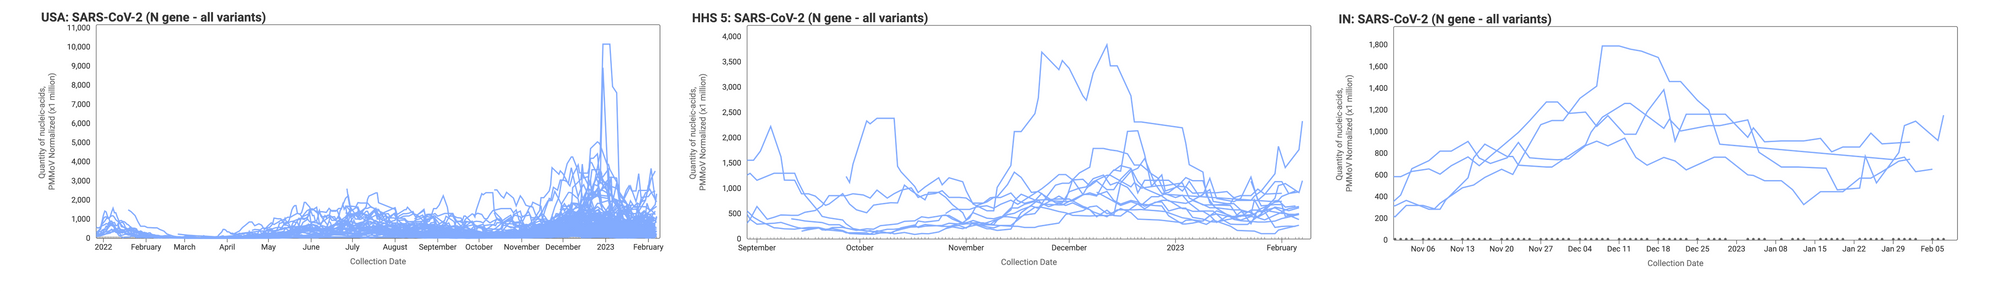
Concentrations of SARS-CoV-2 RNA in wastewater solids are holding steady at a relatively low level (compared to the last surge) for most sites, with several showing downward trends. On Monday, February 6, we started testing for XBB* and these results are now available to view by selecting 'SARS-CoV-2 View by Variant' on data.wastewaterscan.org.
Below are the concentrations (normalized by PMMoV) from all participating sites across the country (left panel), those in HHS region 5 (middle panel), and those in Indiana (right panel). The trend lines you see represent 5-point trimmed averages.
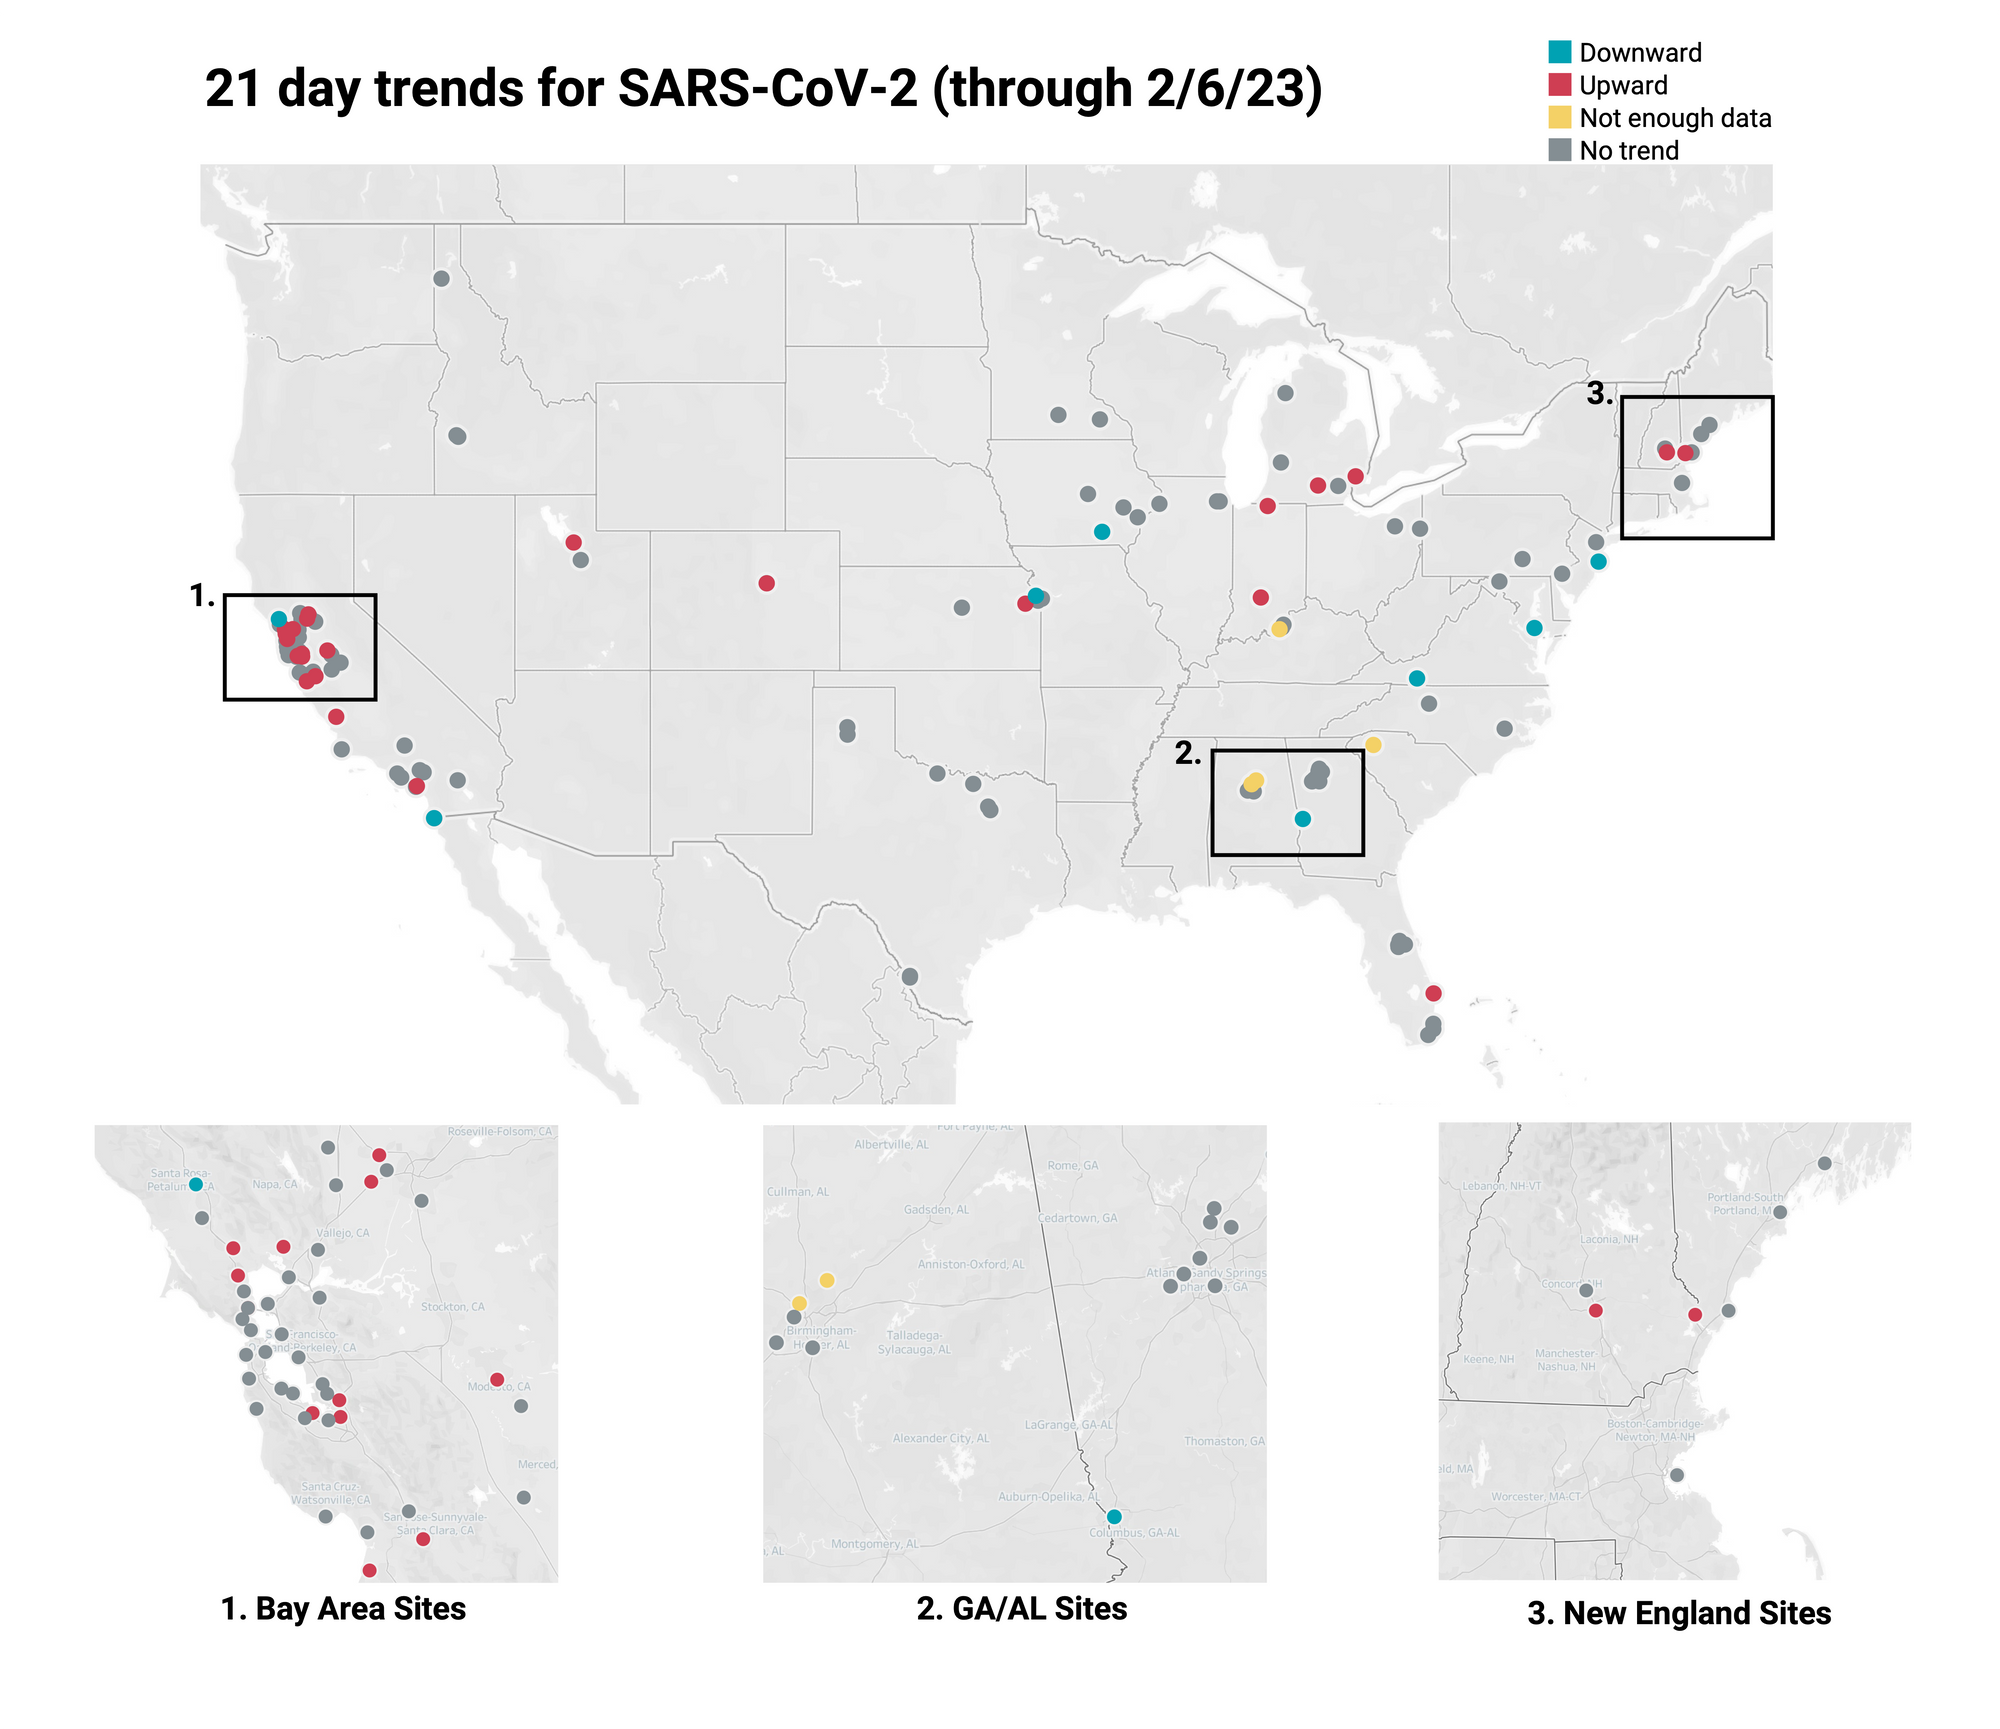
Below is the trend analysis for the SARS-CoV-2 RNA concentrations (N gene concentrations normalized by PMMoV) in wastewater solids at all participating plants. Red indicates a significant upward trend, blue is a significant downward trend, and dark grey is no trend. Yellow indicates that there were not enough data points to calculate a trend. You can read about our methods for trend analysis here. In short, we test for trends analyzing the significant (p<0.1) linear relationship between log10-transformed concentration (target/PMMoV) and time. Of the 137 sites, 24 show an upward trend, 102 show no trend, and 8 show a decreasing trend. The remaining 3 do not have enough data to calculate a trend.
IAV Trends
21-day nationwide wastewater trends
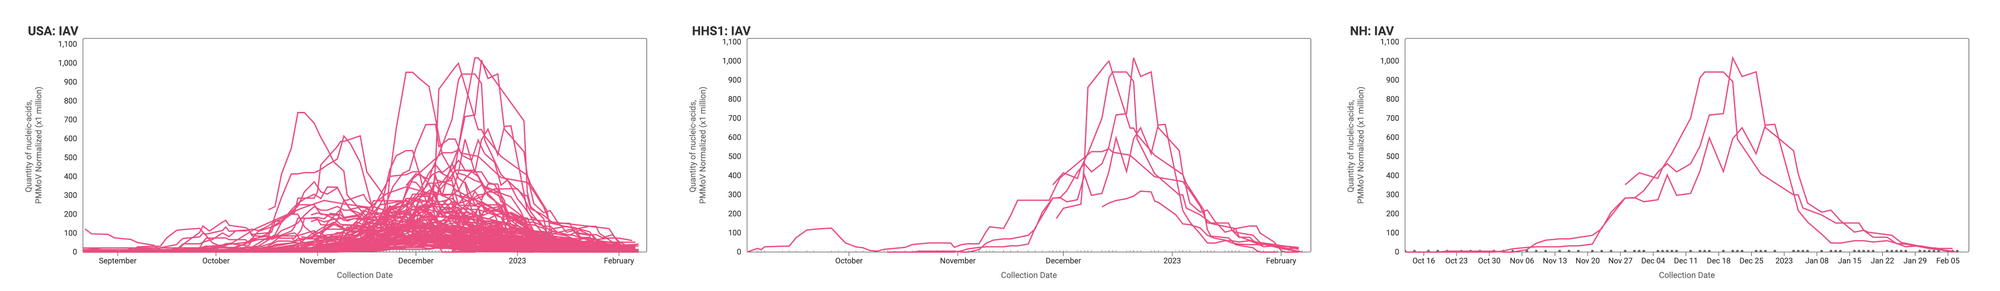
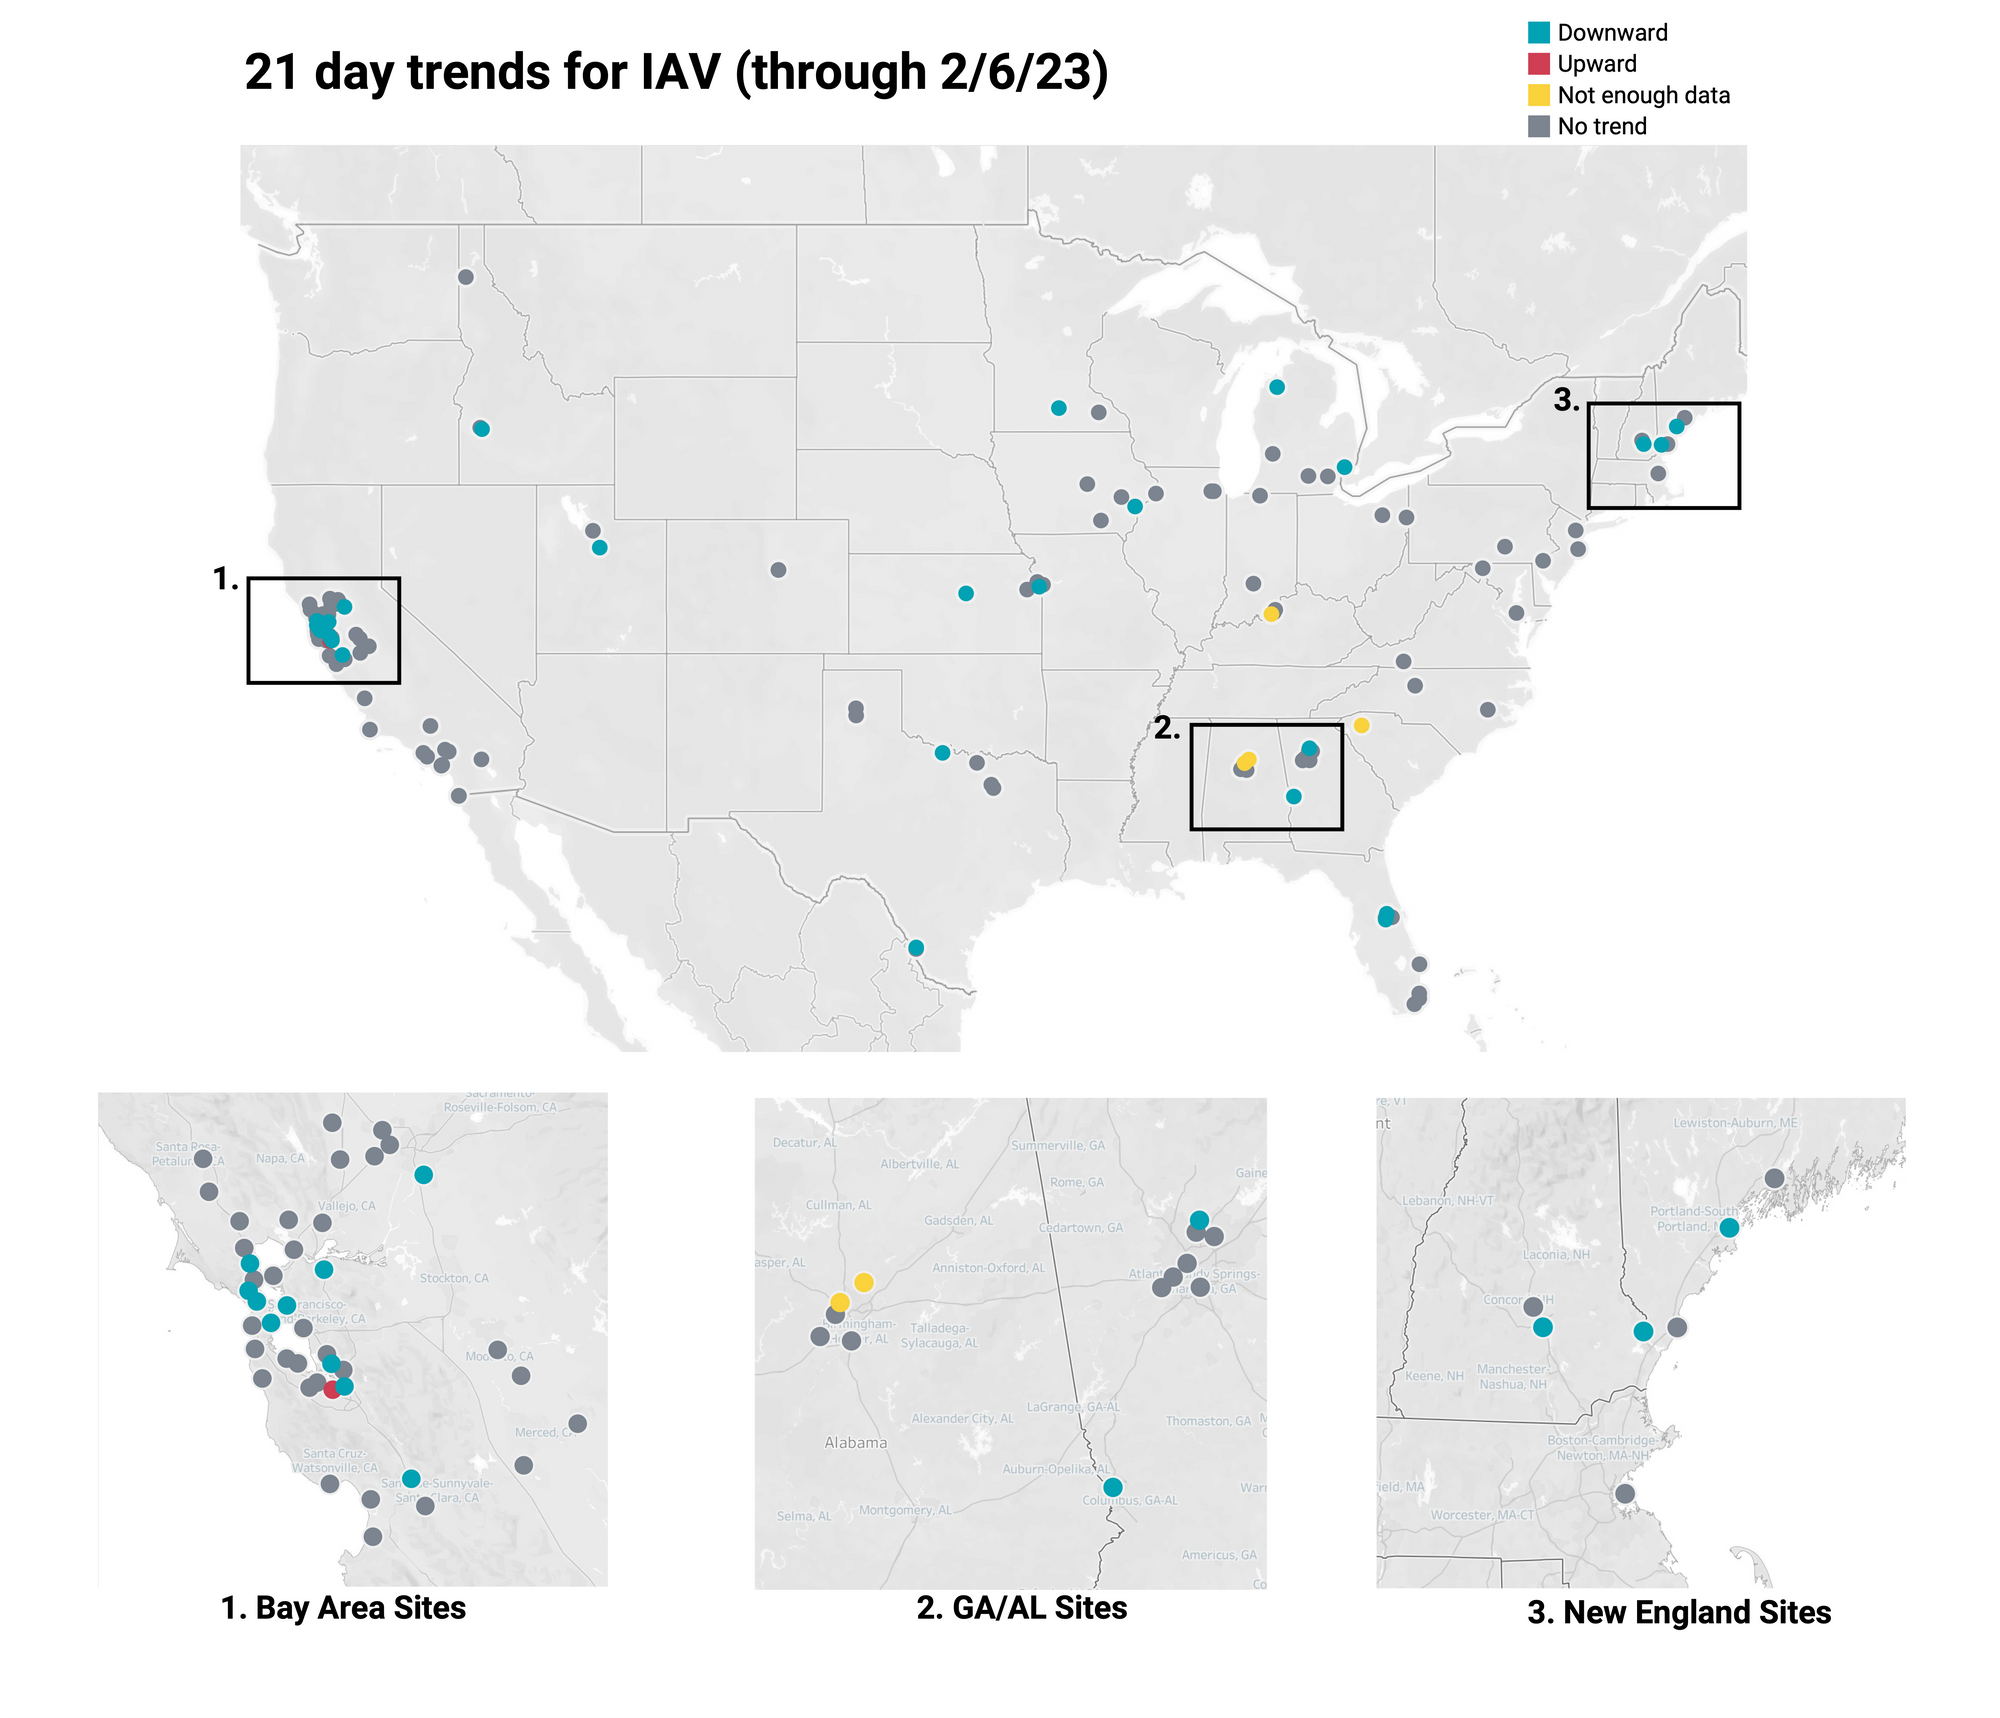
IAV RNA concentrations (normalized by PMMoV) are generally lower now than they were at the height of influenza A cases earlier this winter at most sites. Examples below are from all participating sites across the country (left panel), HHS region 1 (middle panel), and New Hampshire (right panel).
Below is the trend analysis for the IAV RNA concentrations (normalized by PMMoV) in wastewater solids at all participating plants. Red indicates a significant upward trend, blue is a significant downward trend, and dark grey is no trend. Yellow indicates that there were not enough data points to calculate a trend. Of the 137 sites, 1 shows an upward trend, 106 show no trend, and 27 show a decreasing trend. The remaining 3 do not have enough data to calculate a trend.
RSV Trends
21-day nationwide wastewater trends
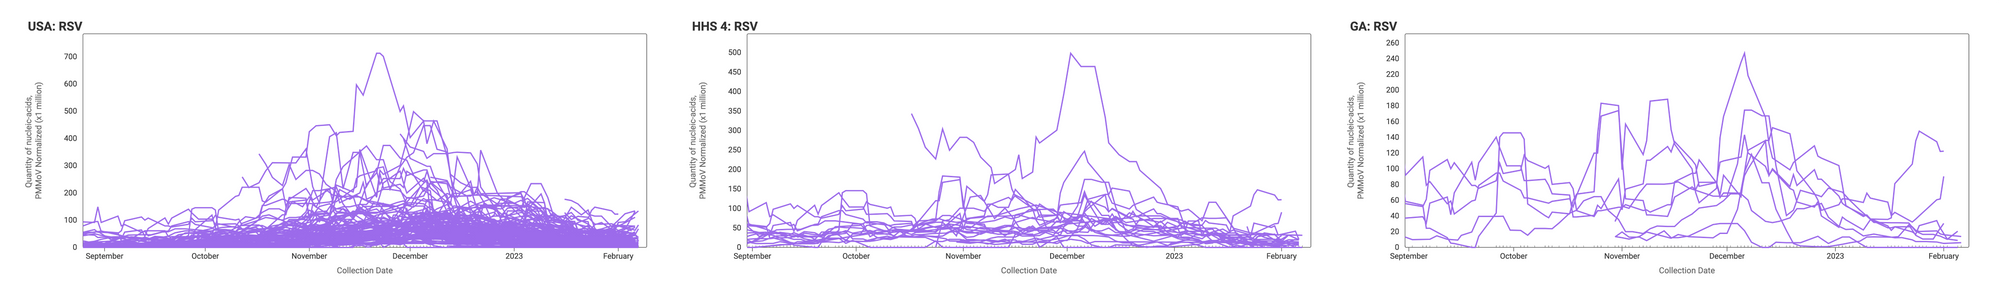
RSV RNA is still detectable in wastewater solids at participating sites, suggesting continued inputs into the wastewater system by RSV shedders. Examples below are from all participating sites across the country (left panel), HHS region 4 (middle panel), and Georgia (right panel).
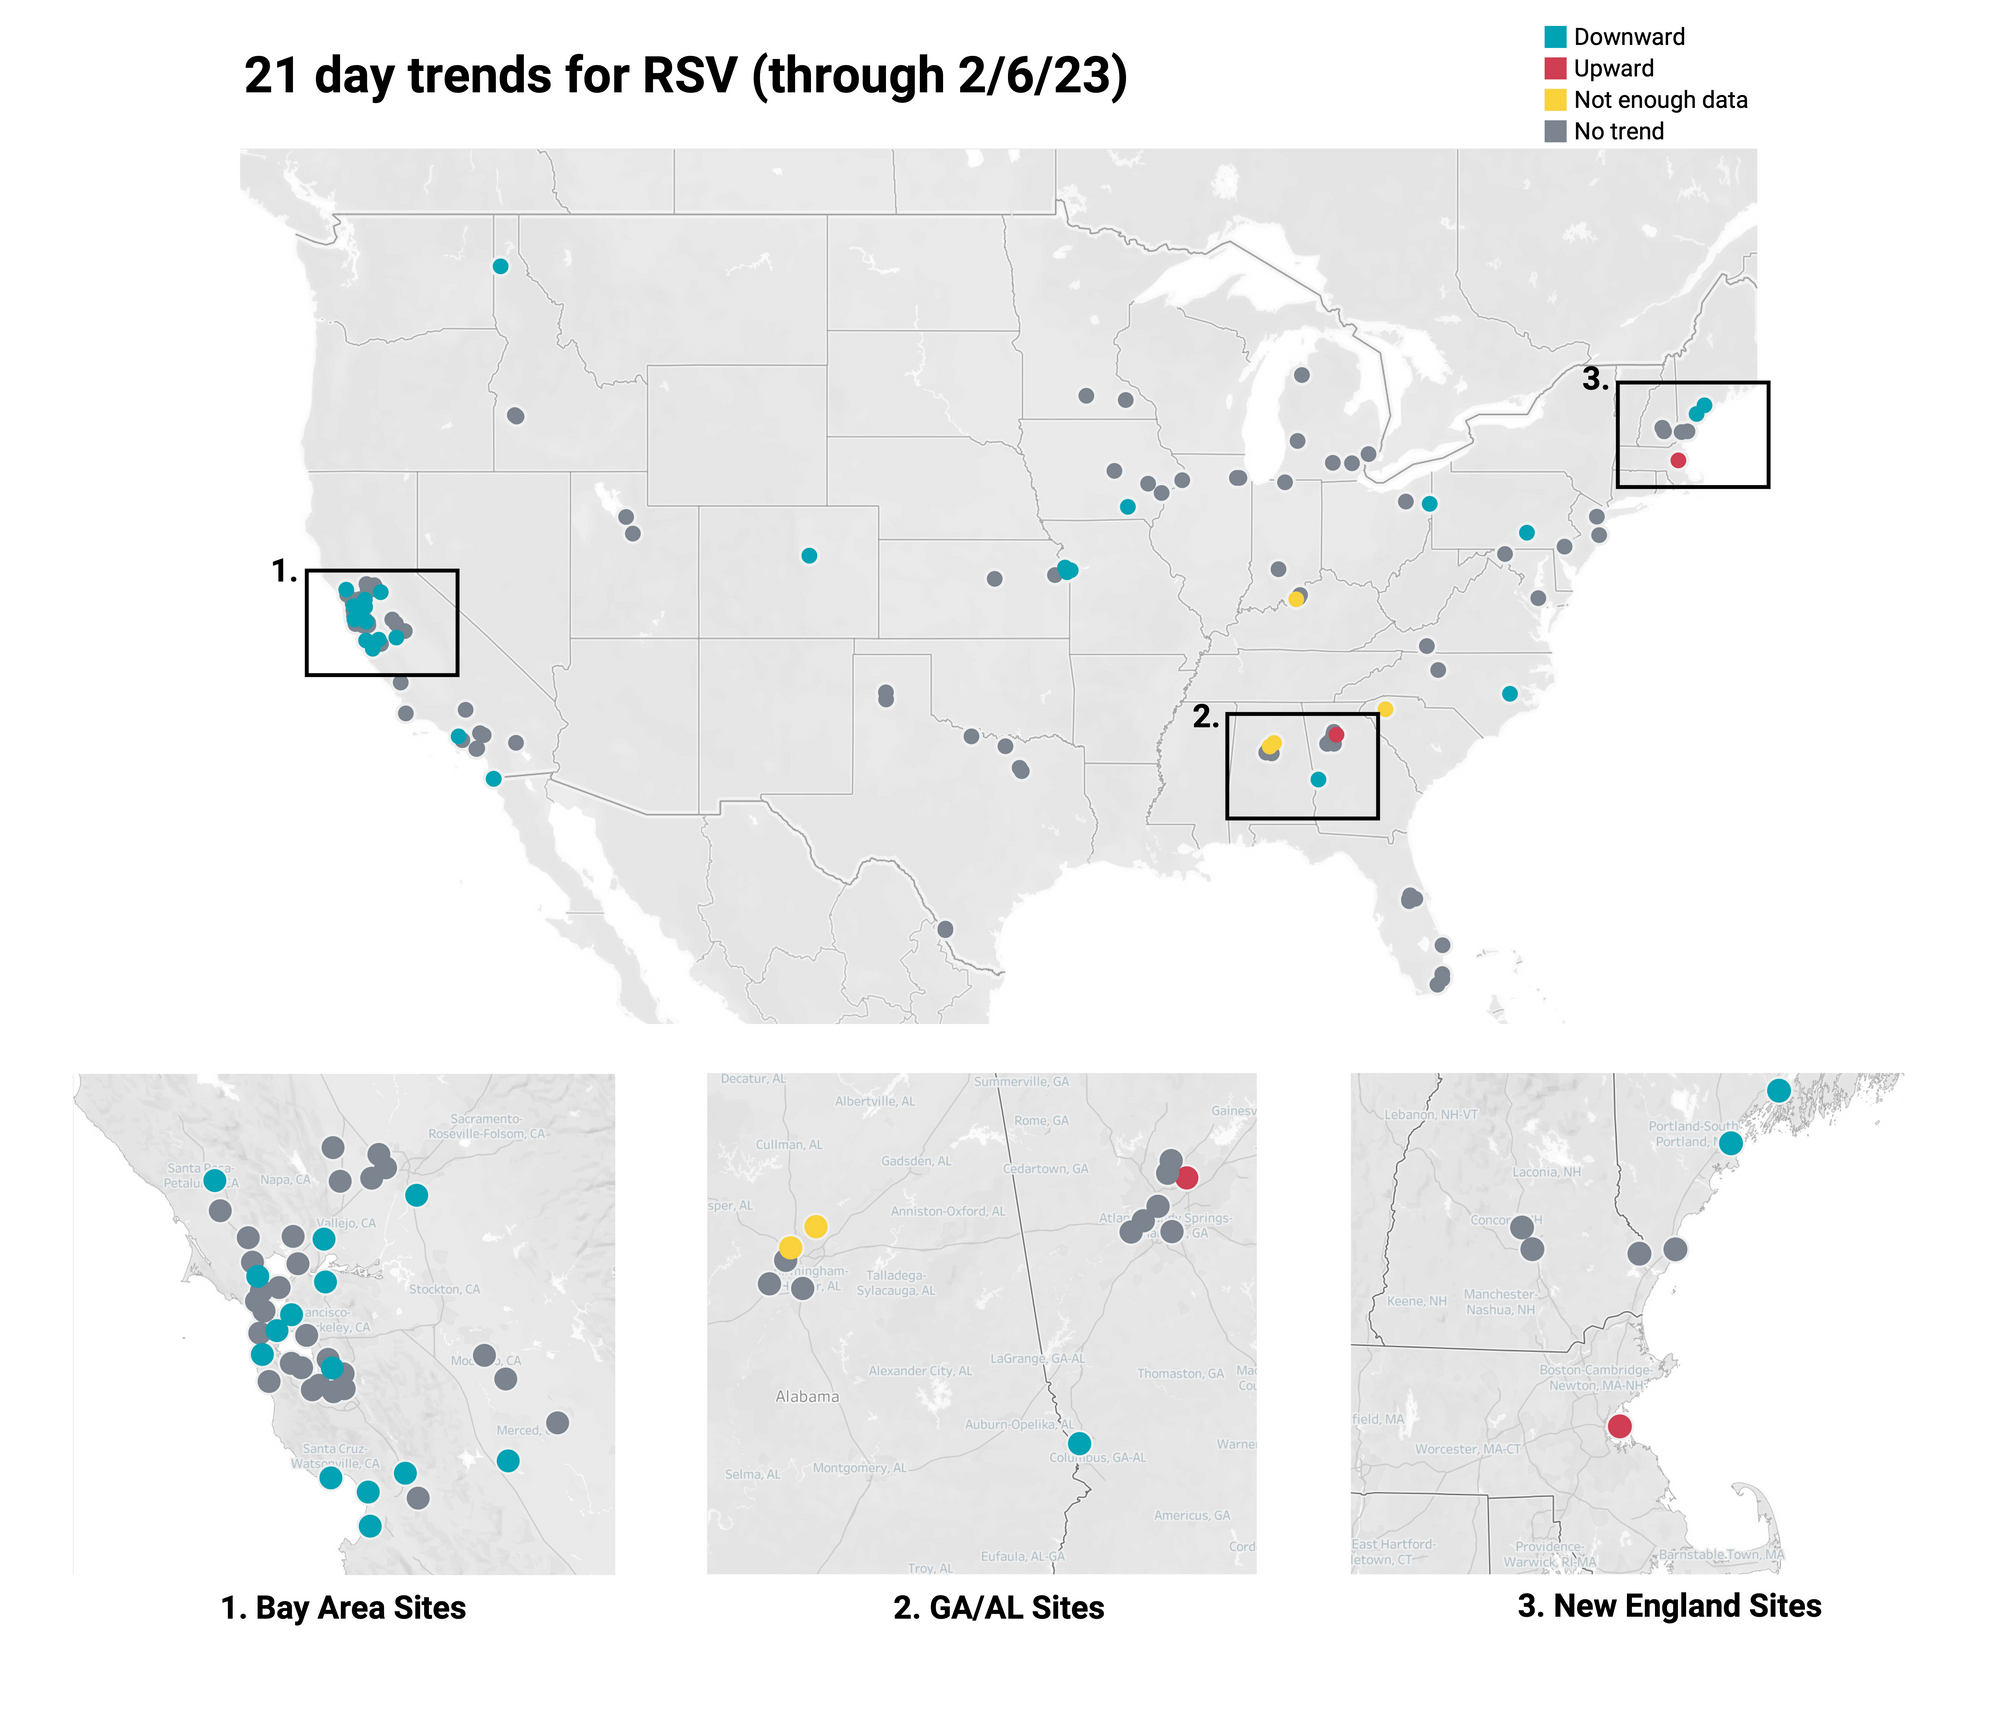
Below is the trend analysis for the RSV RNA concentrations (normalized by PMMoV) in wastewater solids at all participating plants. Red indicates a significant upward trend, blue is a significant downward trend, and dark grey is no trend. Yellow indicates that there were not enough data points to calculate a trend. Of the 137 sites, 2 show an upward trend, 103 show no trend, and 29 show a decreasing trend. The remaining 3 do not have enough data to calculate a trend.
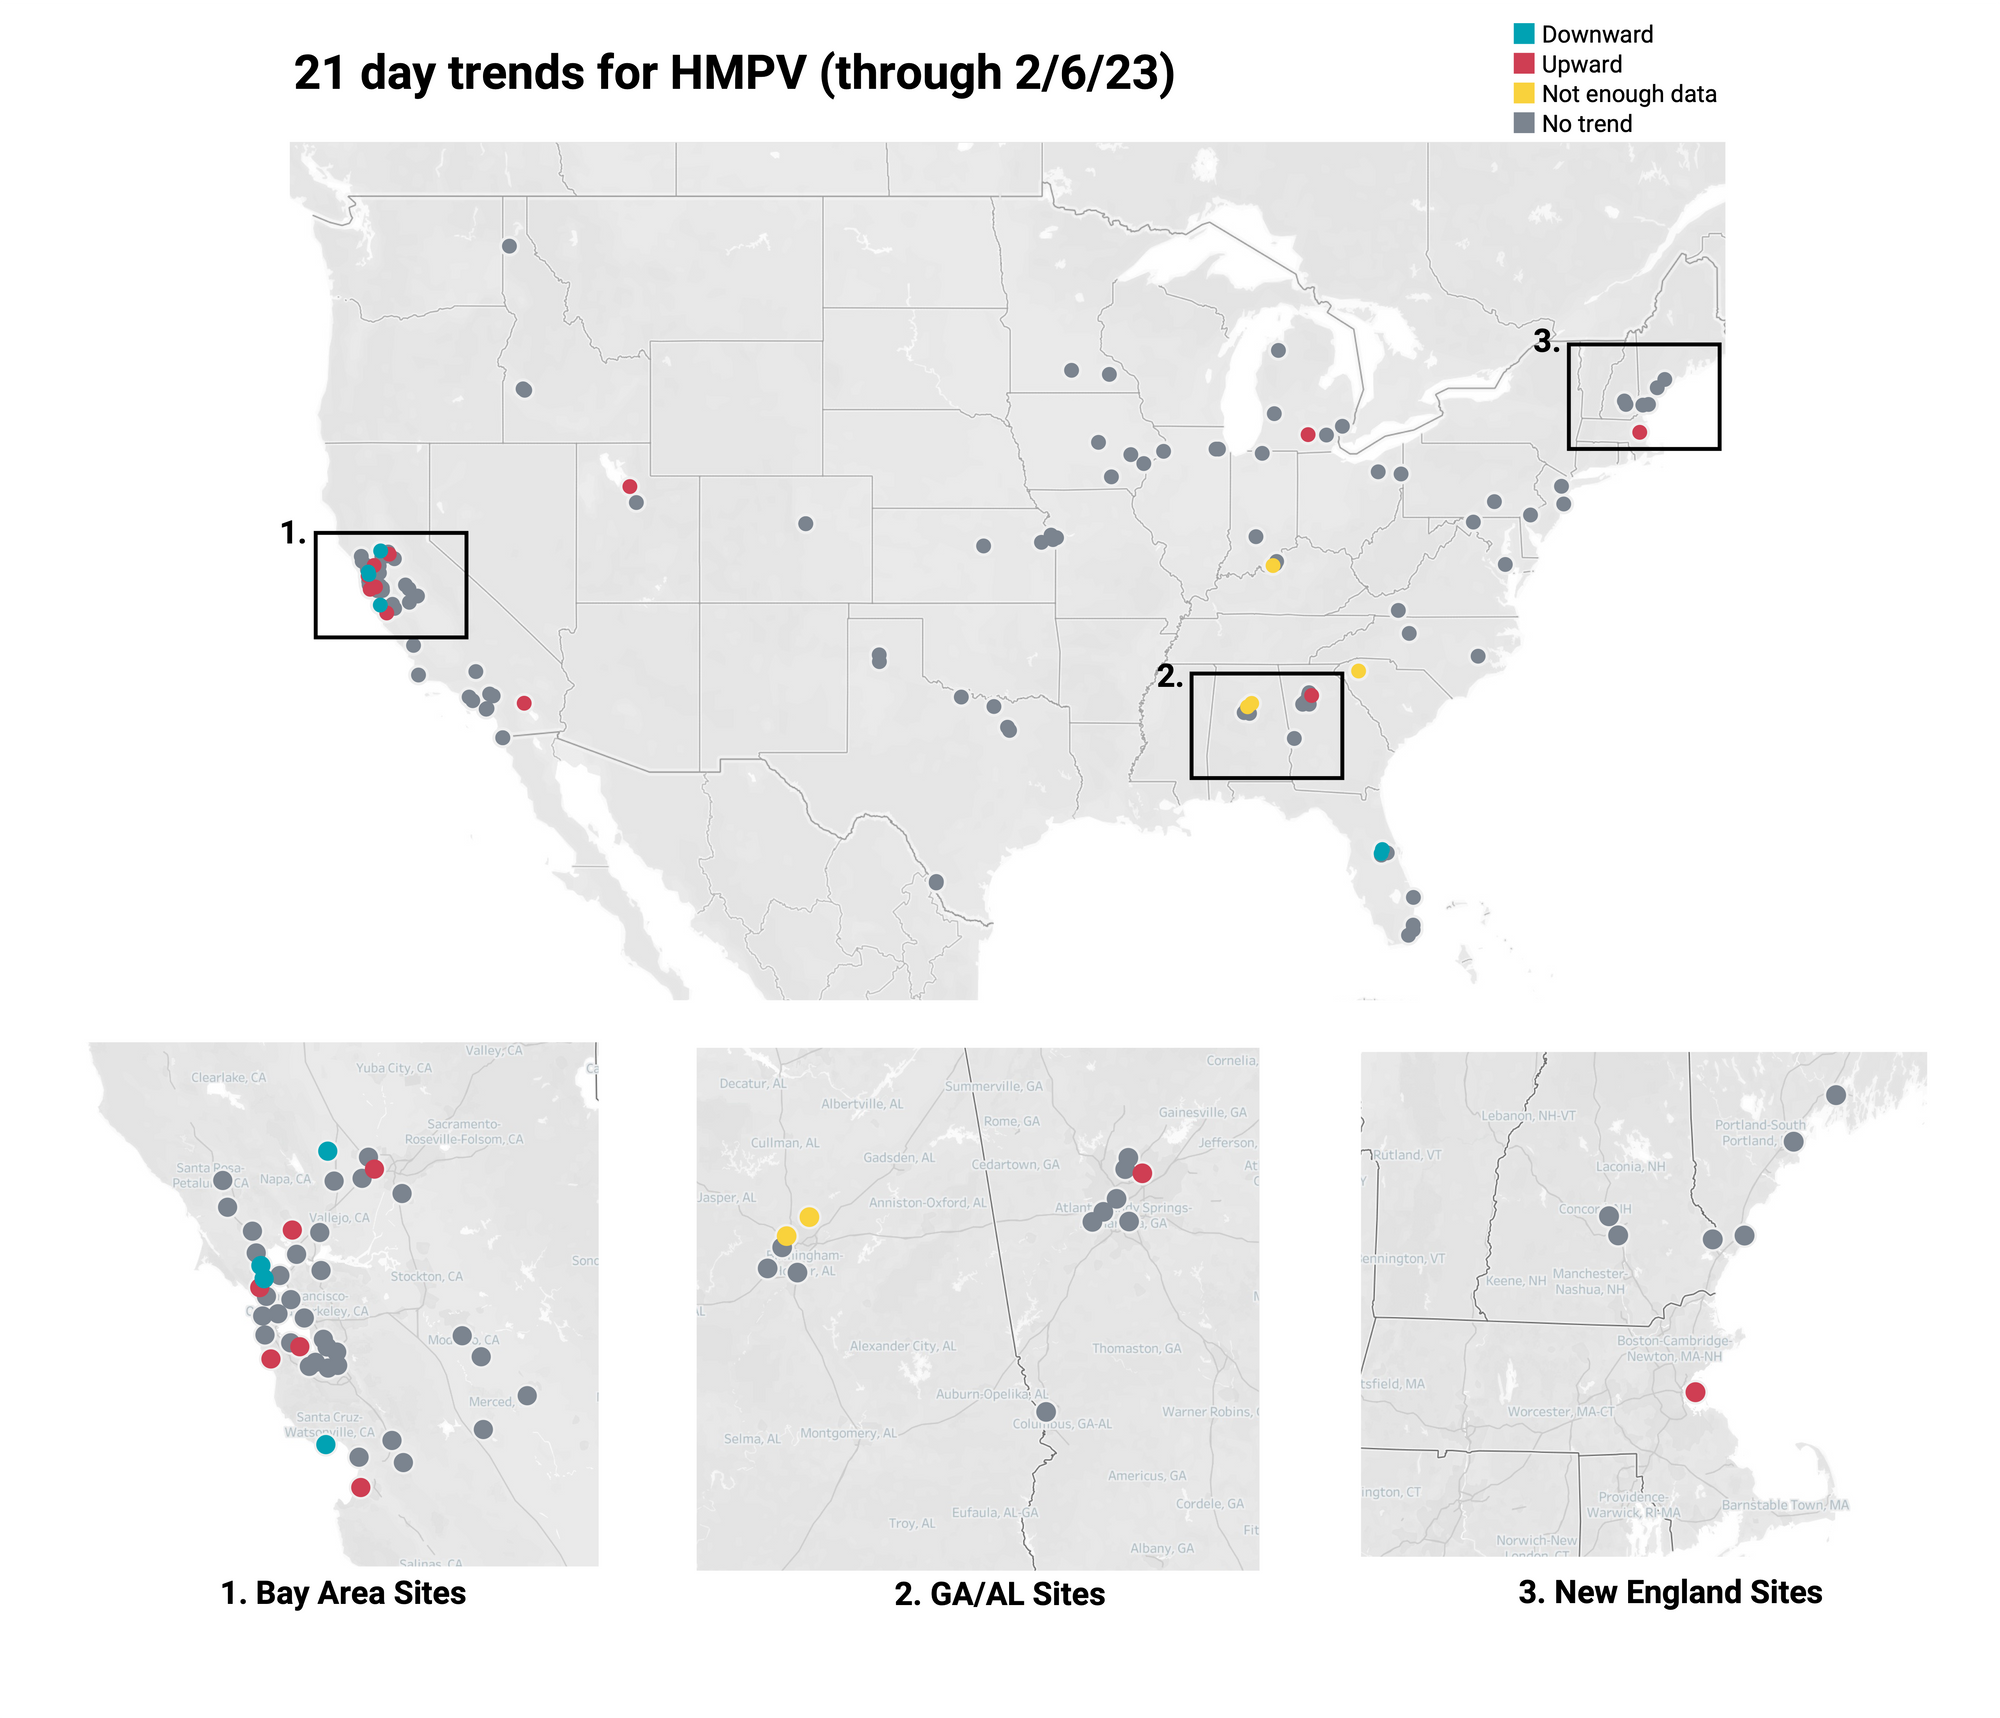
HMPV Trends
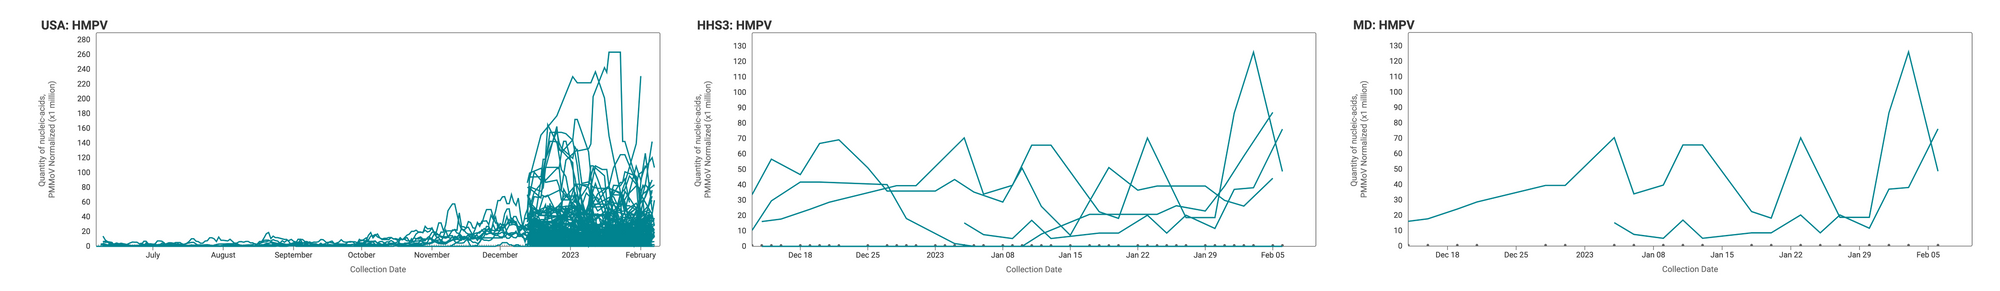
HMPV RNA is consistently detected at the sites. Examples below show HMPV RNA (normalized by PMMoV) at participating sites across the country (left panel), HHS region 3 (middle panel), and Maryland (right panel).
Below is the trend analysis for the HMPV RNA concentrations (normalized by PMMoV) in wastewater solids at all participating plants. Red indicates a significant upward trend, blue is a significant downward trend, and dark grey is no trend. Yellow indicates that there were not enough data points to calculate a trend. Of the 137 sites, 11 show an upward trend, 117 show no trend, and 6 show a decreasing trend. The remaining 3 do not have enough data to calculate a trend.
Mpox virus Trends
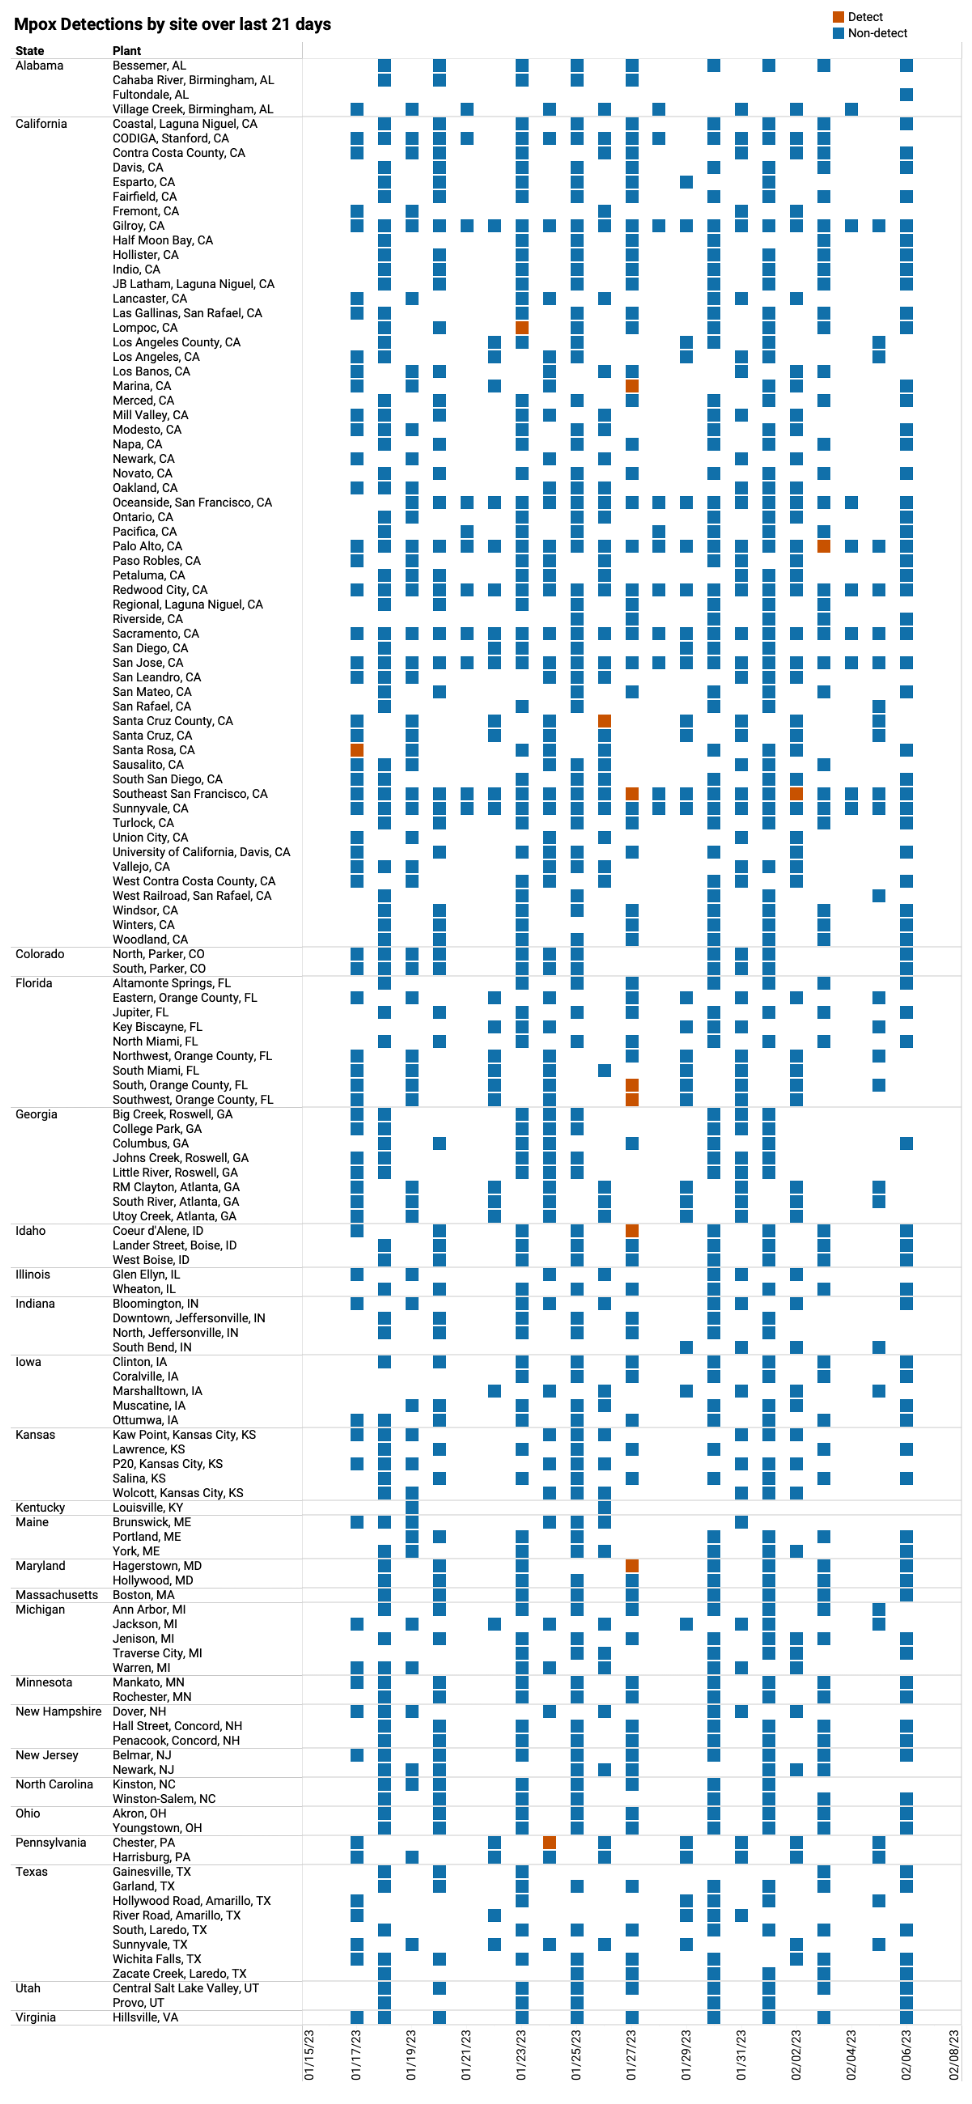
Detection of Mpox DNA in wastewater solids over past 21-days is rare
We have rarely detected mpox in any site over the past three-weeks. Below you can see, in red, there have only been 12 positive samples out of 1,210 samples during the past 21 days. Only one site has had more than one positive sample in this time period. Outbreaks seem to be under control, but we will continue to monitor so that public health departments can take action if we see consistent detections and increases in concentrations in any sites.
One note: given the infrequency of detections, we suggest when reviewing mpox data on data.wastewaterscan.org that you use the heat map, rather than line chart view. The line chart displays smoothed data that drops the highest and lowest points and then averages the middle three values (a 5-point trimmed average). When there is only one detect out of 5 samples, this point will be dropped and the line chart will display a concentration of zero. If you prefer to use the line chart, you can chose to show raw data in the chart display settings menu (click on the gear icon) and the single detection will be visible.
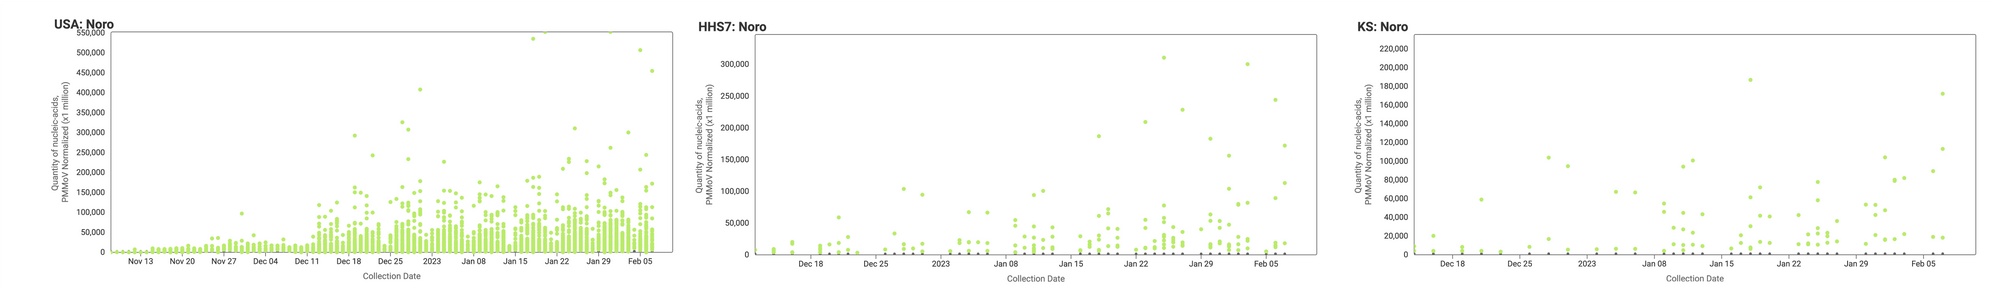
HuNoV Trends
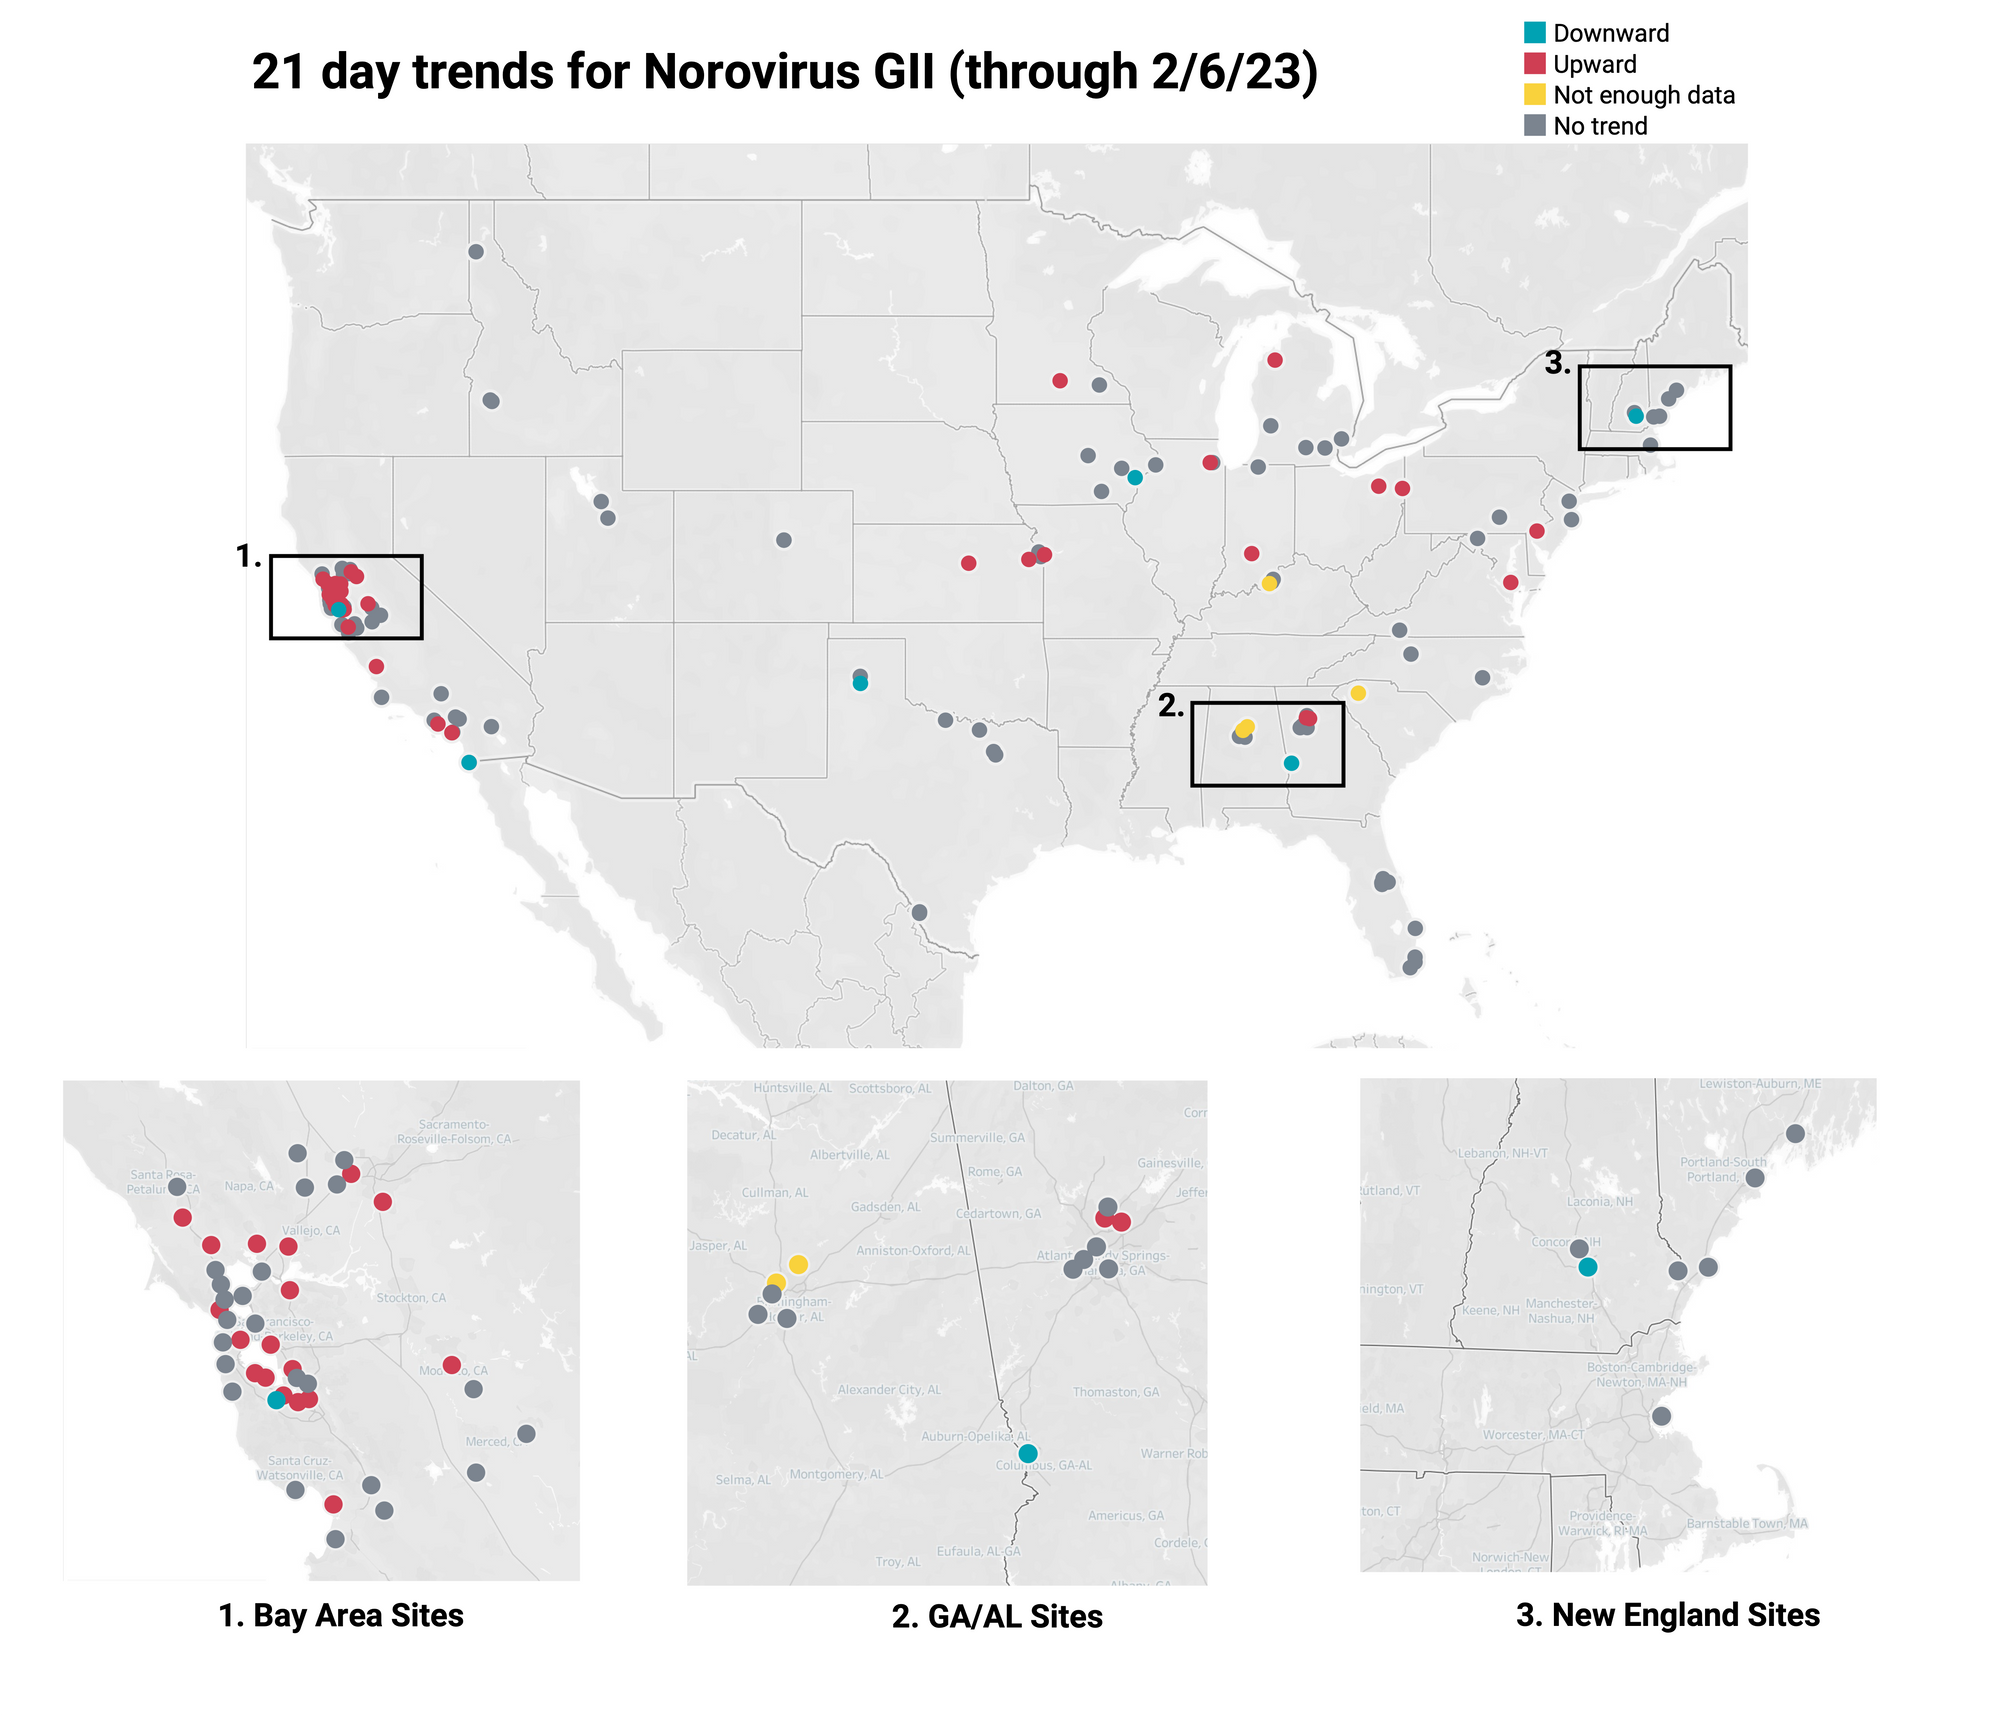
Norovirus GII RNA has been consistently detected at the sites. Example charts showing concentrations (normalized by PMMoV) in wastewater solids below are from all participating sites across the country (left panel), HHS region 7 (middle panel), and Kansas (right panel). In these charts, we show the raw data (HuNoV RNA / PMMoV) rather than the trend lines.
Below is the trend analysis for the Norovirus GII RNA concentrations (normalized by PMMoV) in wastewater solids at the plants. Red indicates a significant upward trend, blue is a significant downward trend, and dark grey is no trend. Yellow indicates that there were not enough data points to calculate a trend. Of the 137 sites, 35 show an upward trend, 93 show no trend, and 6 show a decreasing trend. The remaining 3 do not have enough data to calculate a trend.