
Georgia WWSCAN biweekly update
Welcome to our new Georgia-specific WWSCAN update! We will be sending these updates every other week as a focused summary of recent results from WWSCAN sites in Georgia and any other program announcements. As one of the project directors for WWSCAN and a faculty member at Emory University, I'm committed to ensuring this data is accessible and useful here in Georgia and creating more opportunities to discuss with all our partners here in Georgia. I am always happy to answer questions and take feedback. Thank you all for your interest in this program and for the participation and support of our utility and public health partners!
Cheers,
Marlene Wolfe (marlene.wolfe@emory.edu)
All samples provided up through 3/27/23 have been processed and their data are on the site: data.wastewaterscan.org. If you notice any bugs on the new site or have any comments about it, please email Amanda Bidwell at albidwel@stanford.edu.
COVID-19
SARS-CoV-2 and Variants
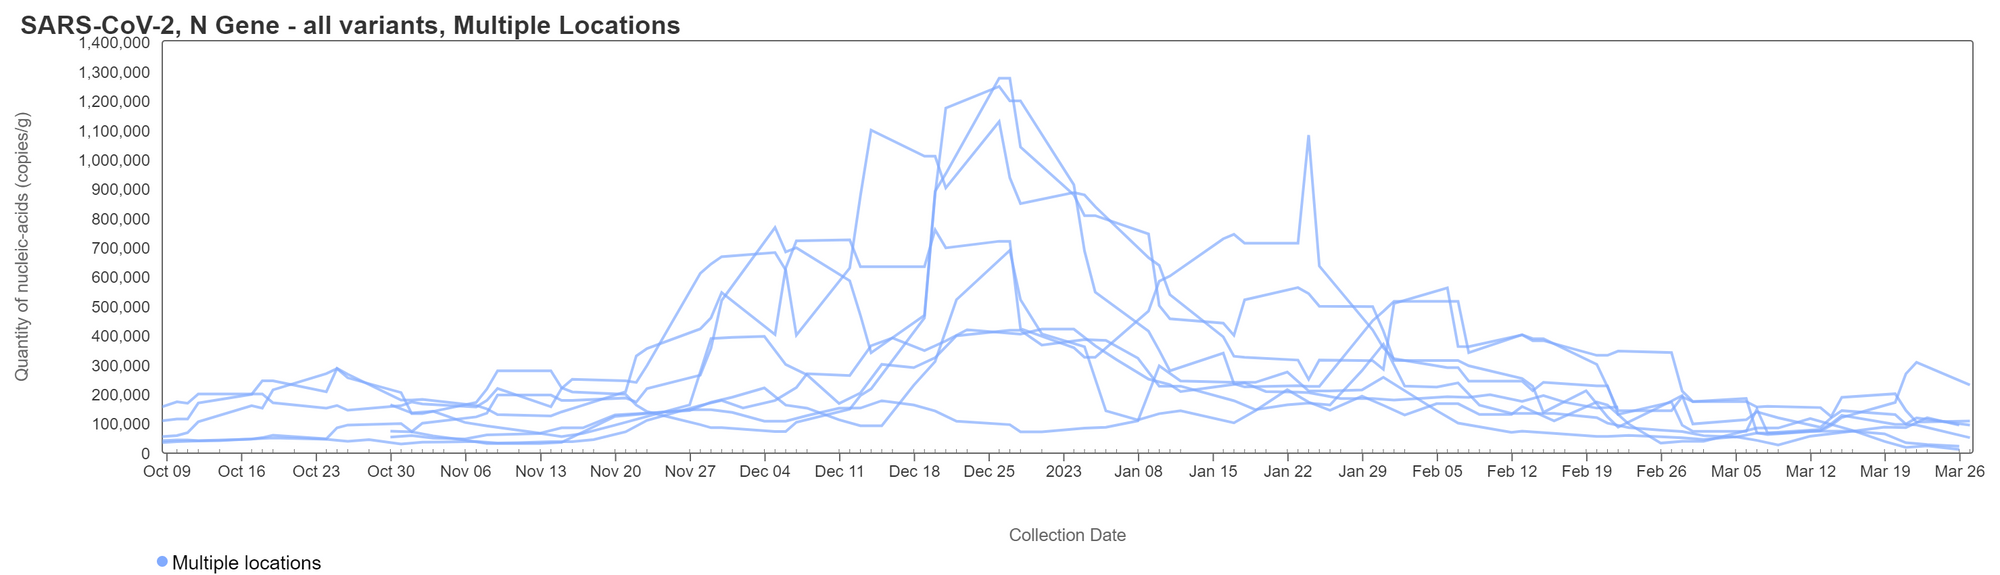
SARS-CoV-2 N gene RNA concentrations at Georgia sites are similar to what they were two weeks ago and at relatively low levels similar to those seen last fall. Recent concentrations range from approximately 12,000 copies per gram and 300,000 copies/g, which is still well above our lower detection limit of approximately 1,000 copies/g. Remember that when we look at this data we focus on recent trends and a comparison to past peaks and troughs, rather than estimating an exact number of cases. Nonetheless, you can view the chart below similarly to one depicting trends in cases over time because the two values are so closely related. This chart shows data from all Georgia plants, and you can see that concentrations have remained constant within the last two weeks. Here is the link to view and interact with the chart.
Other Respiratory Viruses
IAV, IBV, RSV, and HMPV
Influenza A (IAV) RNA concentrations have dropped significantly across all sites since peaking in November and December of 2022. Over the past two weeks, IAV was not detected in the majority of samples - this indicates that there are very few if any people shedding IAV RNA in wastewater in Georgia plants. When a sample is non-detect, it is possible that there is some RNA present but it is at levels below what our methods can detect. We've previously shown through our research that. The link to the chart is here if you would like to interact with it.
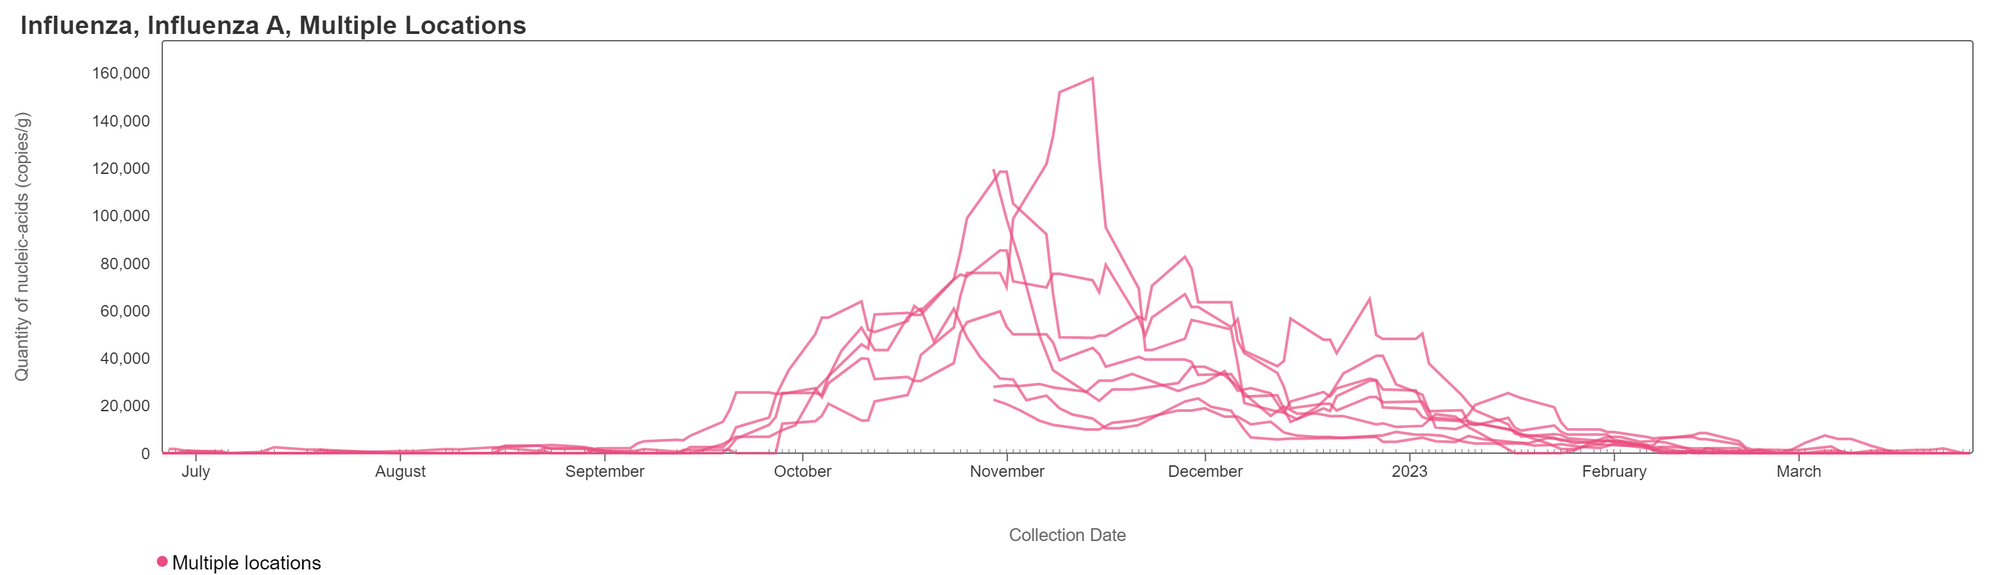
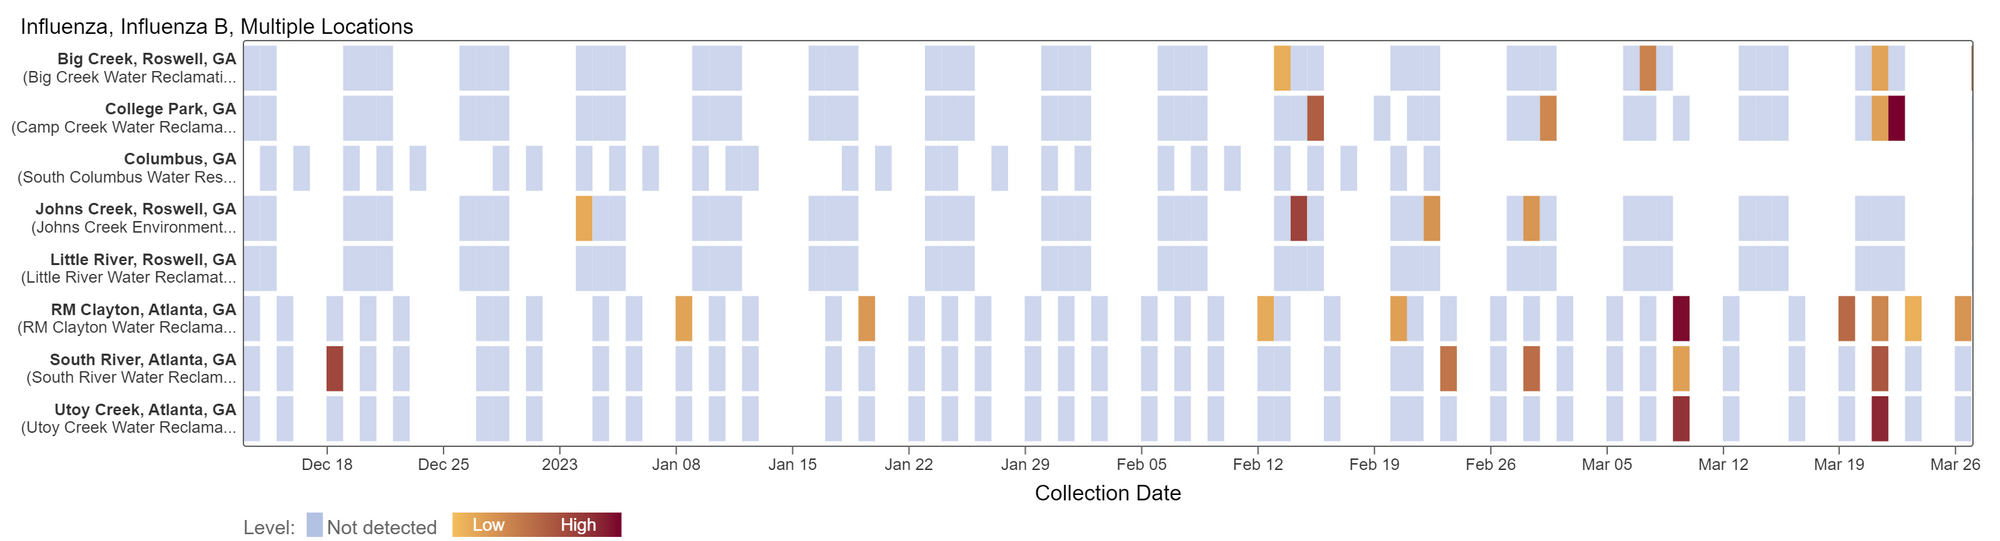
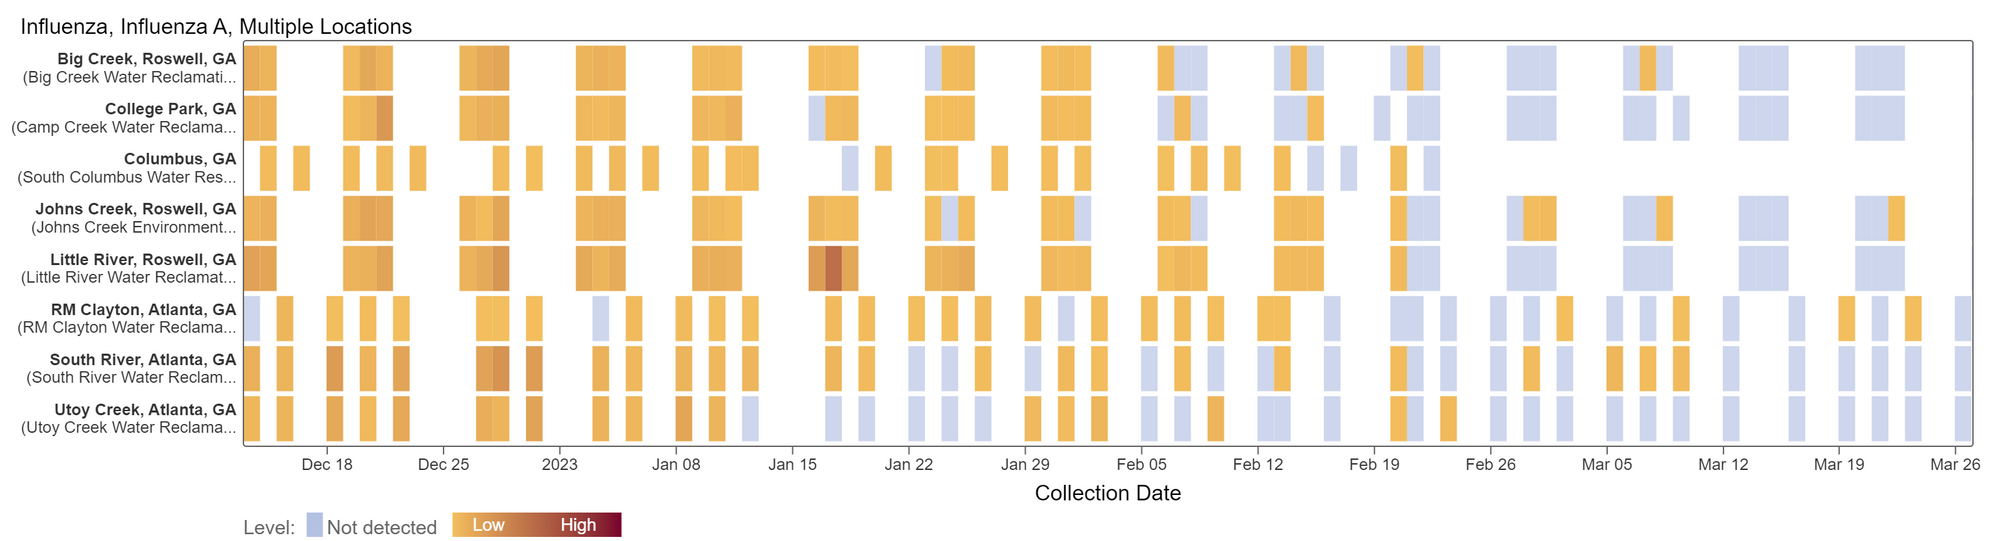
Influenza B (IBV) RNA continues to be sporadically detected at Georgia plants. Concentrations are still low (less than 5500 copies/g), however, the only sites at which IBV was not detected are Little River and Columbus. A heat map is shown below of the IBV RNA concentrations at the Georgia plants. This is a useful format to view results when there are low levels and sporadic detection (which is also becoming the case for IAV!). Each plant is represented by a row (y-axis), and dates are shown along the x-axis. Blue indicates a non-detect and darker orange/red is proportional to concentration with the highest values being the darkest. A white means no sample was collected. Here is the link to the heat map chart - the linked chart will update automatically as more data are added to the site. There is a similar chart for IAV below it for comparison.
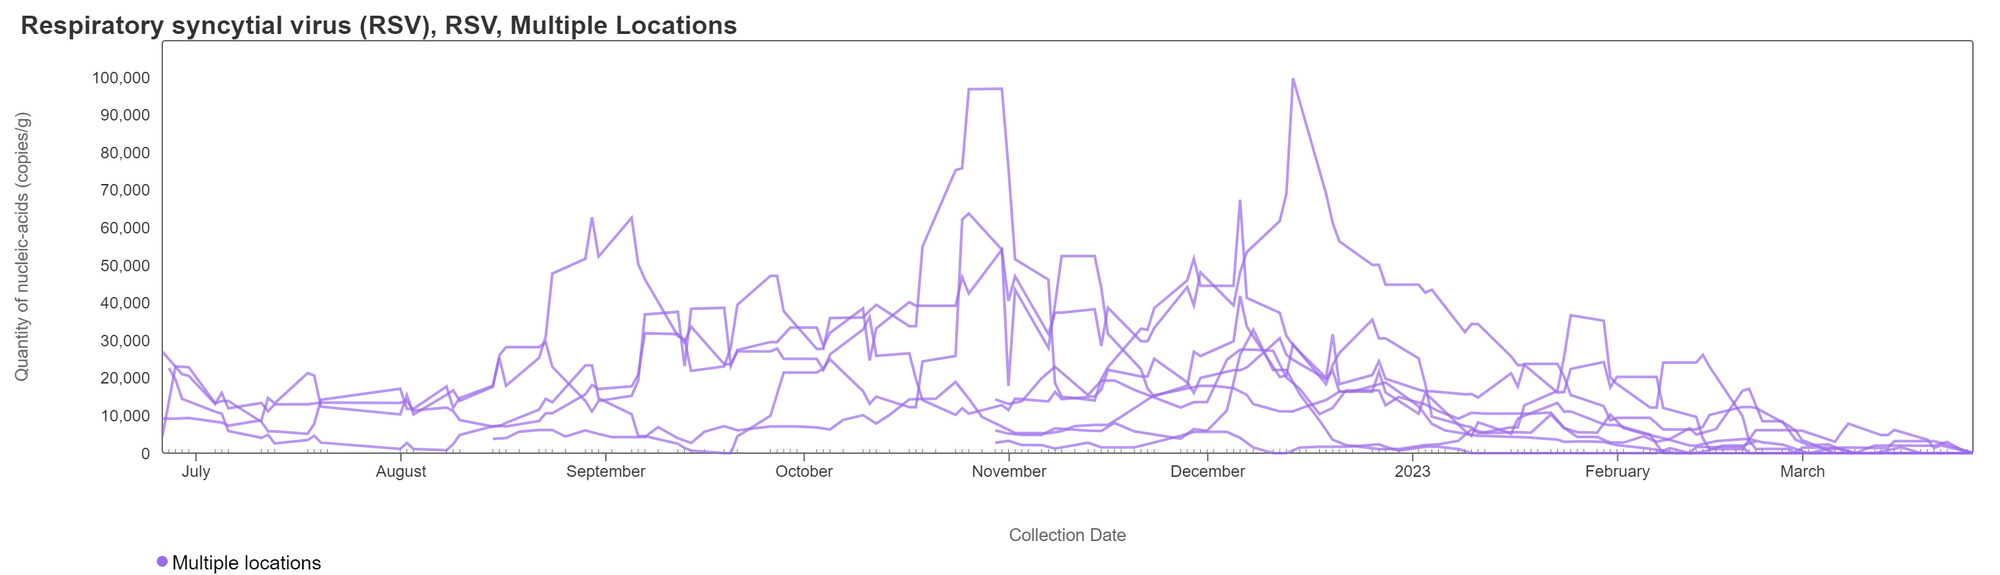
RSV RNA concentrations have begun to decrease over time with concentrations of less than 20,000 copies/gram at all sites for the last month. This plot shows data from all the Georgia sites together and can be accessed here. Similar to IAV, RSV has regularly not been detected in samples over the past two weeks.
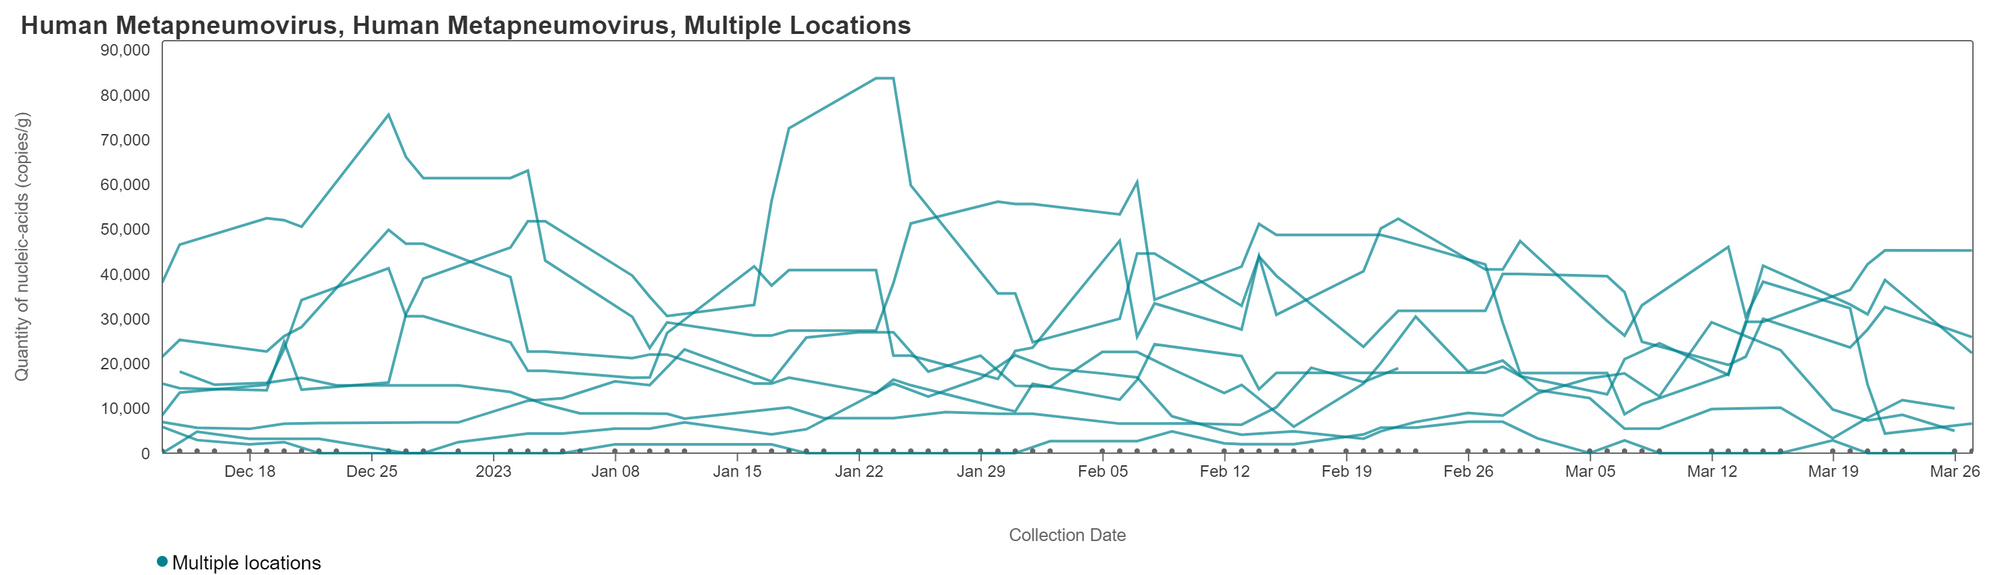
HMPV (human metapneumovirus) RNA concentrations have remained constant at a number of plants over the last 2 weeks. Overall, concentrations are less than 60,000 copies/g. Below are charts showing data from all the Georgia plants together (click the link here to this chart if you want to interact with it). Recent samples at the South River plant have concentrations that are not detectable.
Norovirus
Assay detects human norovirus GII
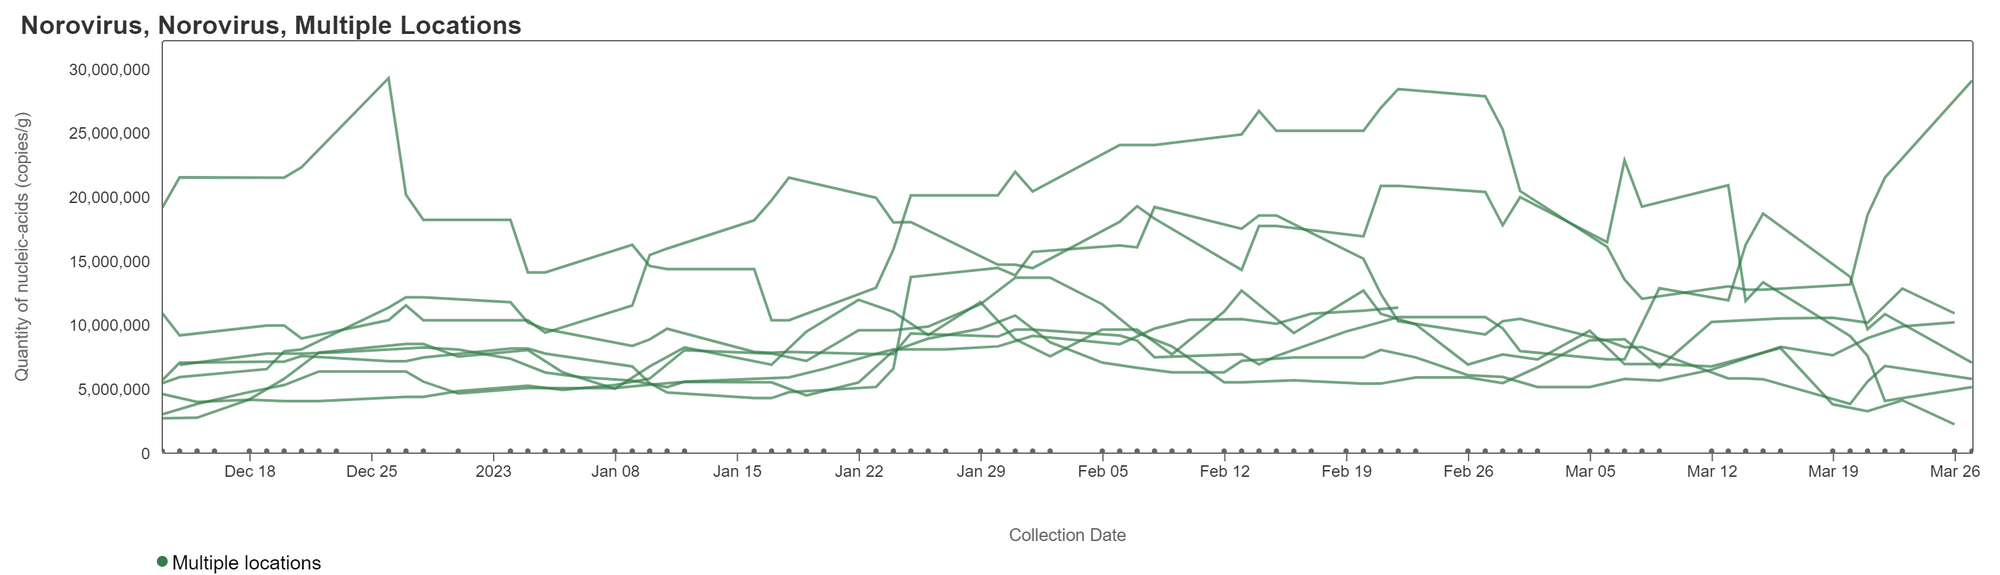
Norovirus GII RNA concentrations have been relatively flat across sites for the past several weeks. Concentrations for Georgia plants are between 1,000,000 - 30,000,000 copies/gram. A chart of all the Georgia sites together is shown below. You can interact with the chart of all the plants at this link.
Mpox
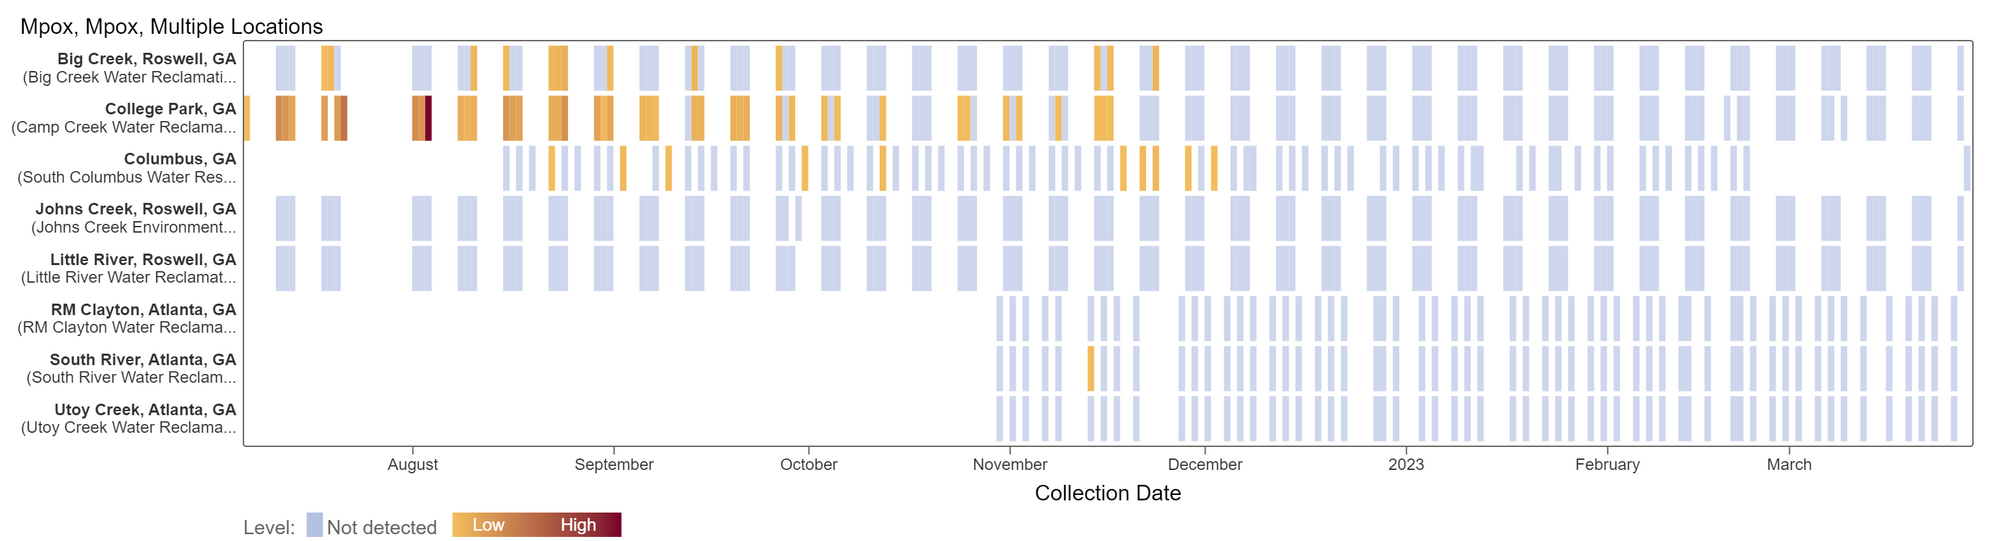
Results have been non-detect for mpox in all Georgia plants since Dec 2022. This heat map shows all the data we have collected for all Georgia sites as a row and each date as a column. Again, the color blue means the sample was non-detect for mpox DNA and the colors get darker with higher concentrations. Levels of mpox DNA in wastewater were high at a number of plants during the time period where there were also many cases identified in Georgia last year. You can access this plot here.
Related News
Marlene had the opportunity to present on WWSCAN at the Georgia Water Resources Conference (GWRC) this week in Athens. It was great to see many of you there!
Thank you for checking out the first edition of our Georgia-focused WWSCAN newsletter and expect to receive these every two weeks moving forward.