
Georgia WWSCAN biweekly update 4/28/23
Welcome to the bi-weekly update for WWSCAN partners in Georgia! All samples provided up through 4/24/23 have been processed and data are on the site at data.wastewaterscan.org.
If you notice any bugs on the new site or have any comments about it, please continue to send your feedback via email Amanda Bidwell at albidwel@stanford.edu. Thank you as always for your partnership!
COVID-19
SARS-CoV-2 and Variants
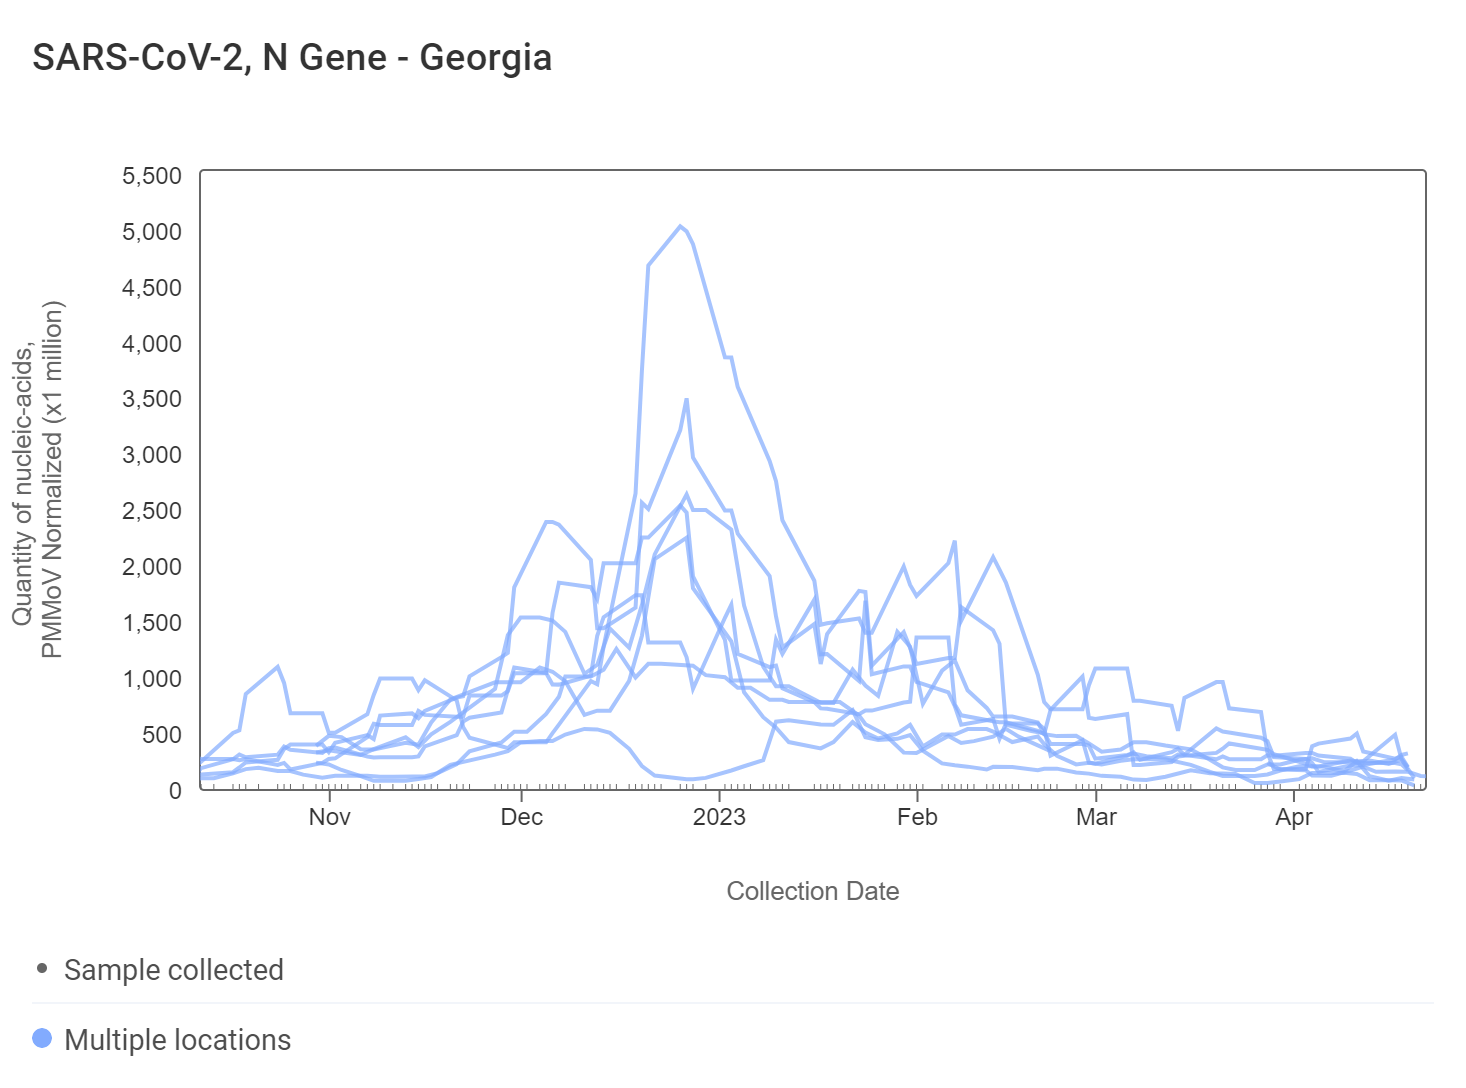
SARS-CoV-2 N gene RNA concentrations continue to remain at low levels and have slightly decreased in comparison to two weeks ago. Concentrations approximately range from 20,000 copies per gram to 120,000 copies per gram. Click each chart to visit the WWSCAN website and interact with the charts directly.
We are also including trend analysis for concentrations of most targets (normalized by PMMoV) in wastewater solids. We required 3 points over the last 21 days to calculate a trend. You can read about our methods for trend analysis here. In short, we test for linear trends between log10-transformed concentration (target/PMMoV) and time; the trend must be classified as statistically significant (p<0.1).
For SARS-CoV-2, of the 8 Georgia sites, 1 shows an upward trend, 6 show no trend, and 1 shows a decreasing trend. This can be interpreted to mean that over the last 21 days, concentrations of SARS-CoV-2 RNA have generally not changed at most sites.
Other Respiratory Viruses
IAV, IBV, RSV, and HMPV
Influenza A (IAV) RNA was only detected at one site in Georgia (College Park) in the last two weeks. Therefore, IAV concentrations continue to remain low and decrease at Georgia sites. When samples are non-detect, this means that the amount of viral RNA in the wastewater is below the limit of detection of our methods. This means that there are likely very few people shedding IAV into wastewater in these communities.
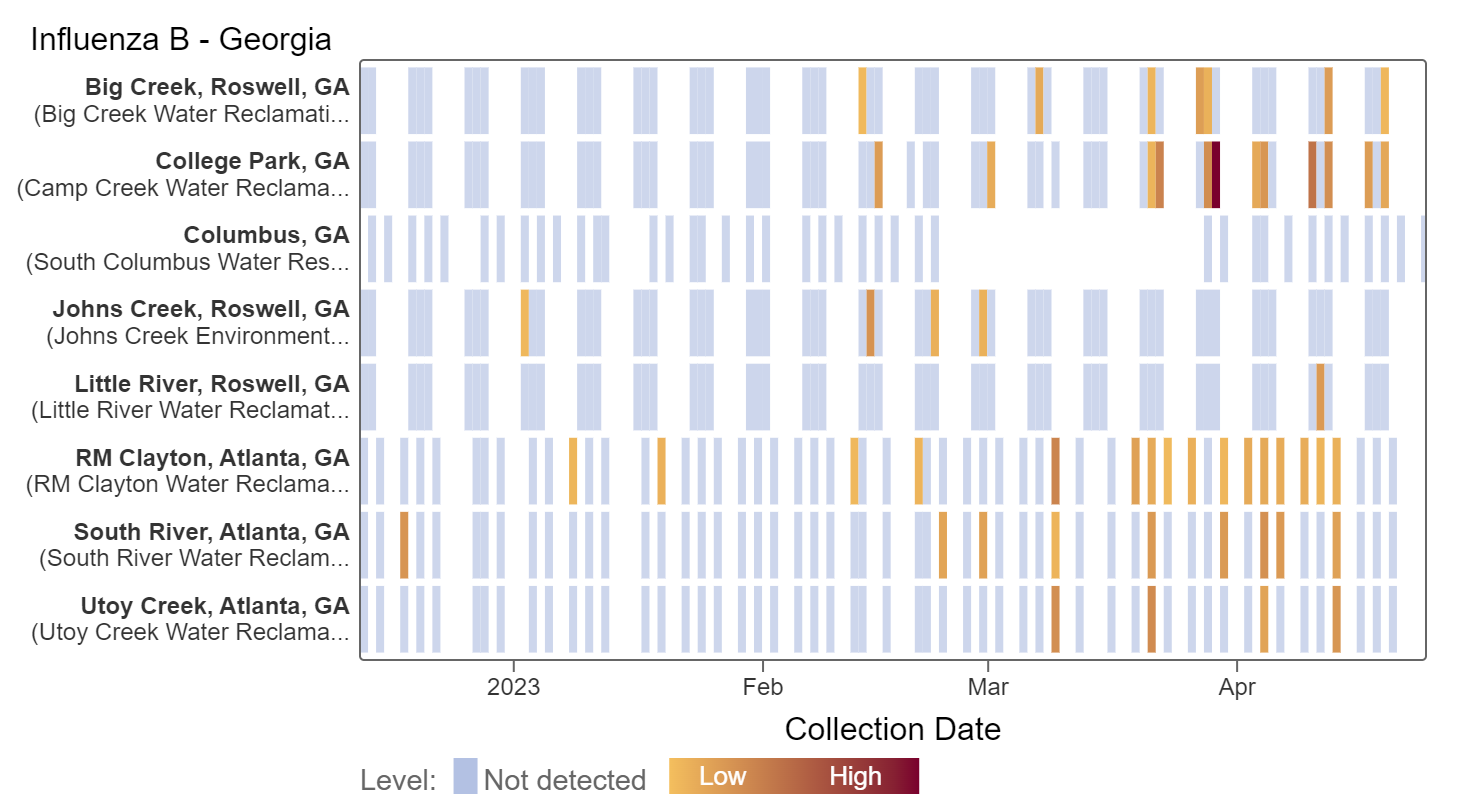
A heat map is shown below of the IBV RNA concentrations at the Georgia plants. Each plant is represented by a row (y-axis), and dates are shown along the x-axis. Blue indicates a non-detect and darker orange/red is proportional to concentration with the highest values being the darkest. A white means no sample was collected.
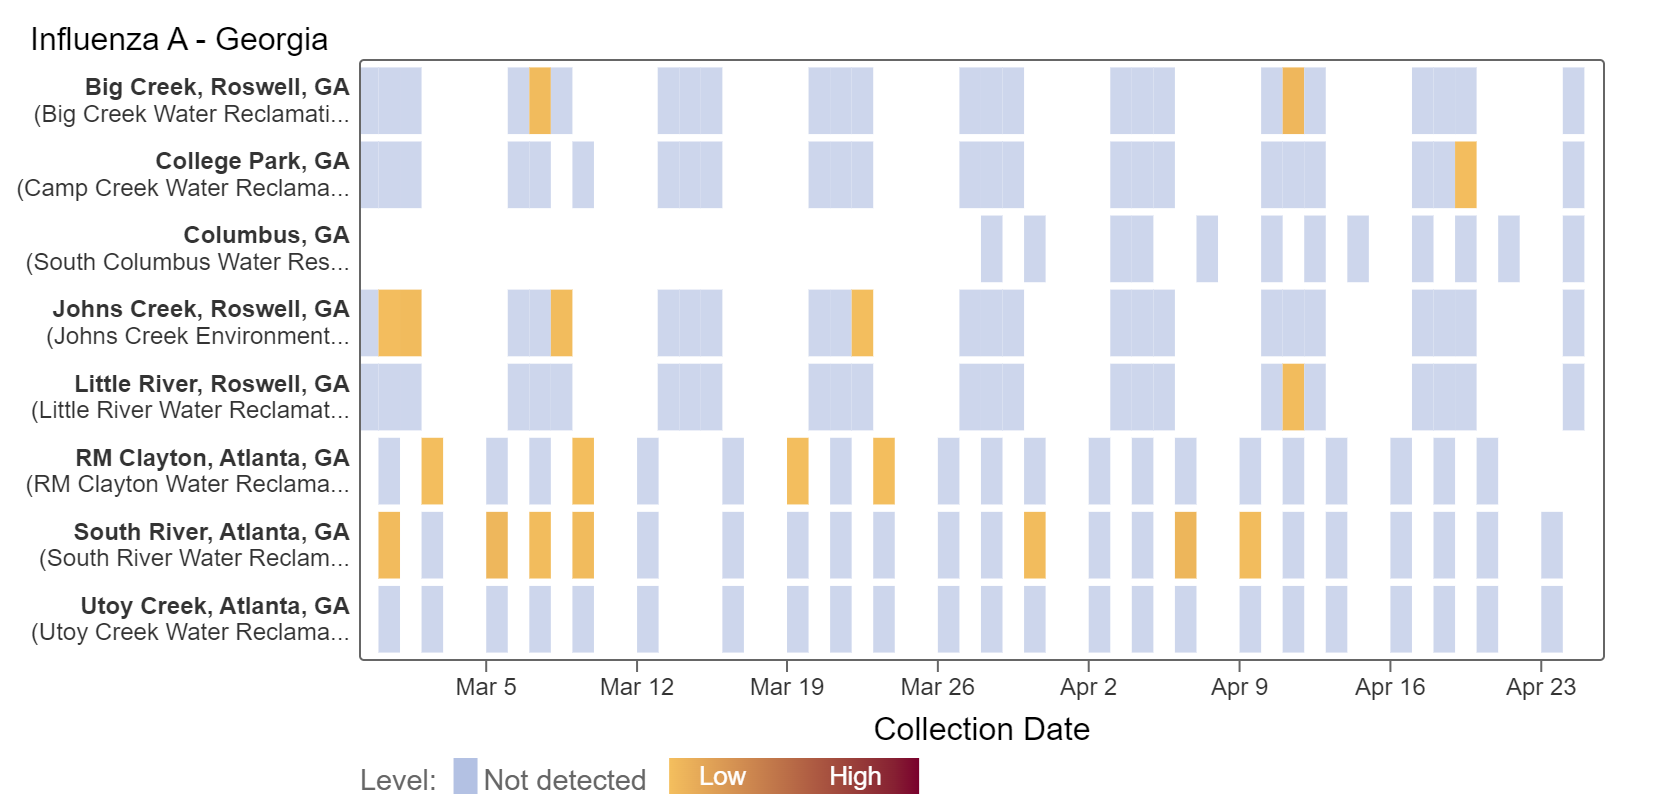
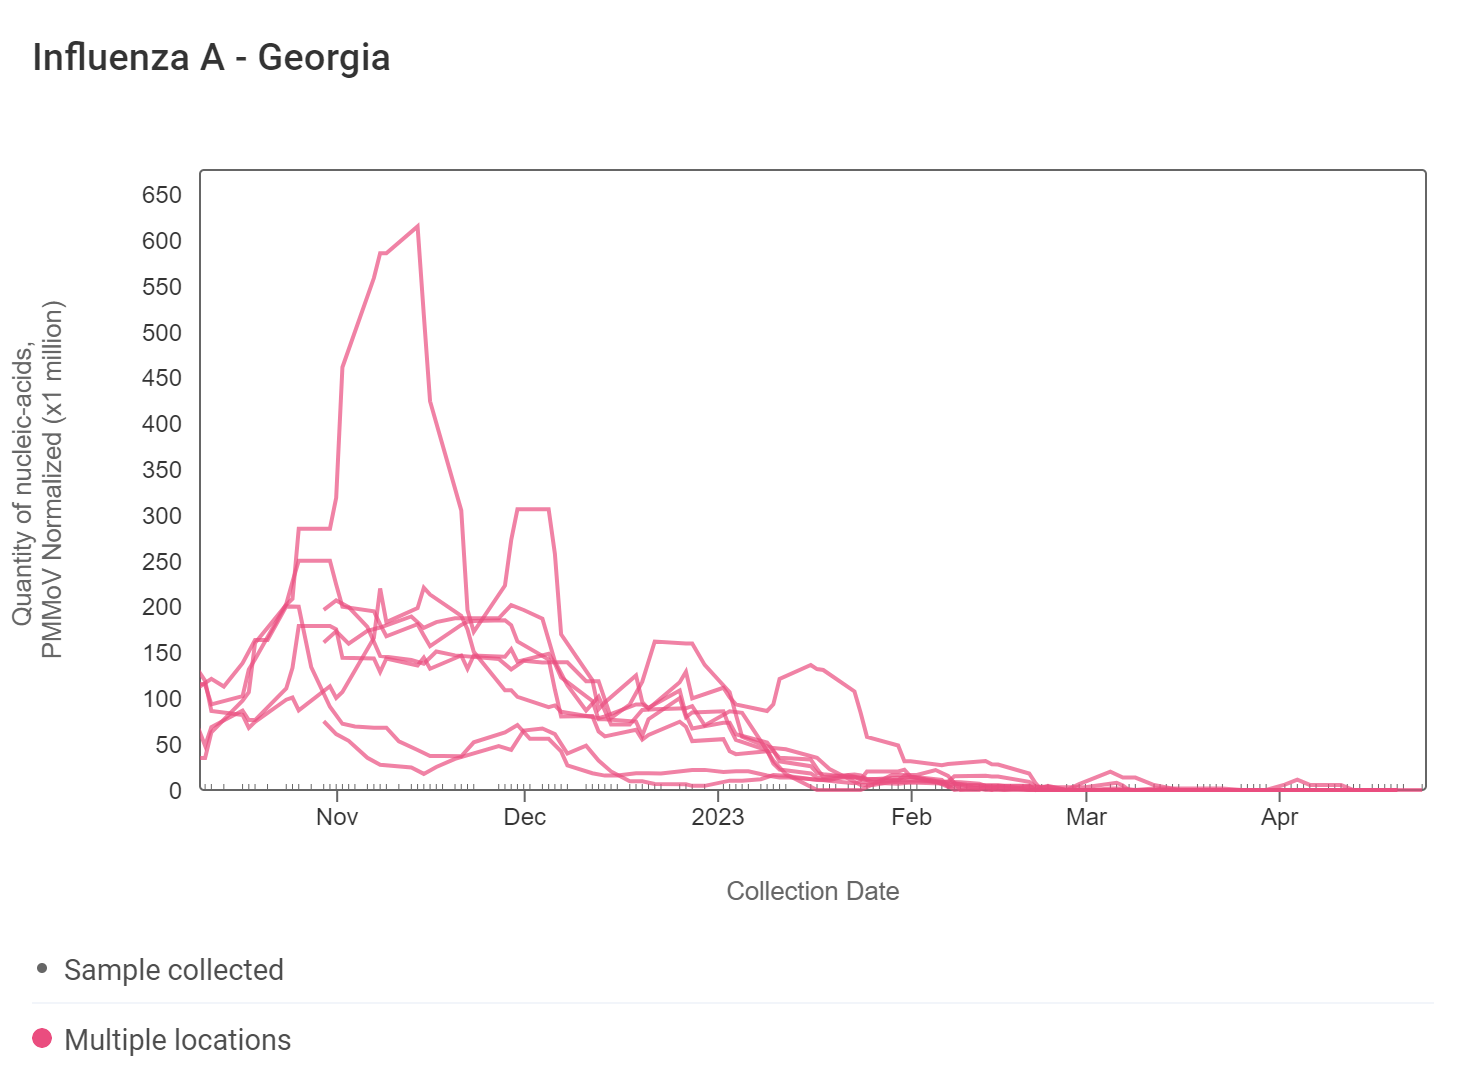
Of the 8 sites, 0 show an upward trend, 8 show no trend, and 0 show a decreasing trend. This can be interpreted to mean that over the last 21 days, concentrations of IAV RNA have generally not changed at Georgia sites.
Influenza B (IBV) RNA Even though concentrations are low, more Georgia sites have detected IBV in the last two weeks. Values are similar and continue to be less than 11,000 copies/g. IBV has not been detected over the past two weeks at Little River, Johns Creek, and Columbus. Because we still have sporadic detection, we have not calculated trends for IBV.
RSV RNA concentrations have significantly decreased since the fall and winter months. RSV has not been detected in samples collected within the last two weeks at a number of Georgia sites. As seen in the heat map below, these sites include College Park, Johns Creek, Little River, South River, and Utoy Creek.
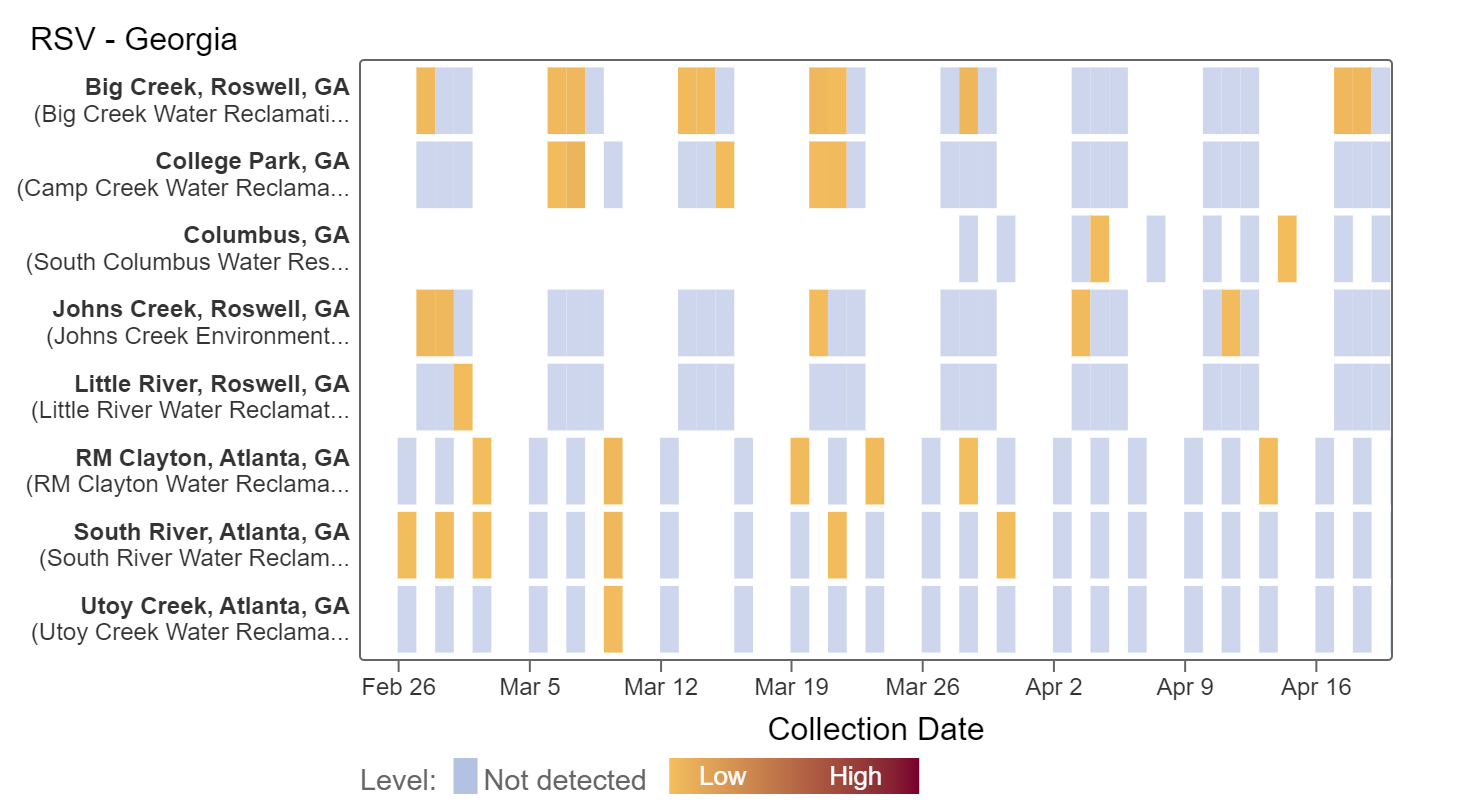
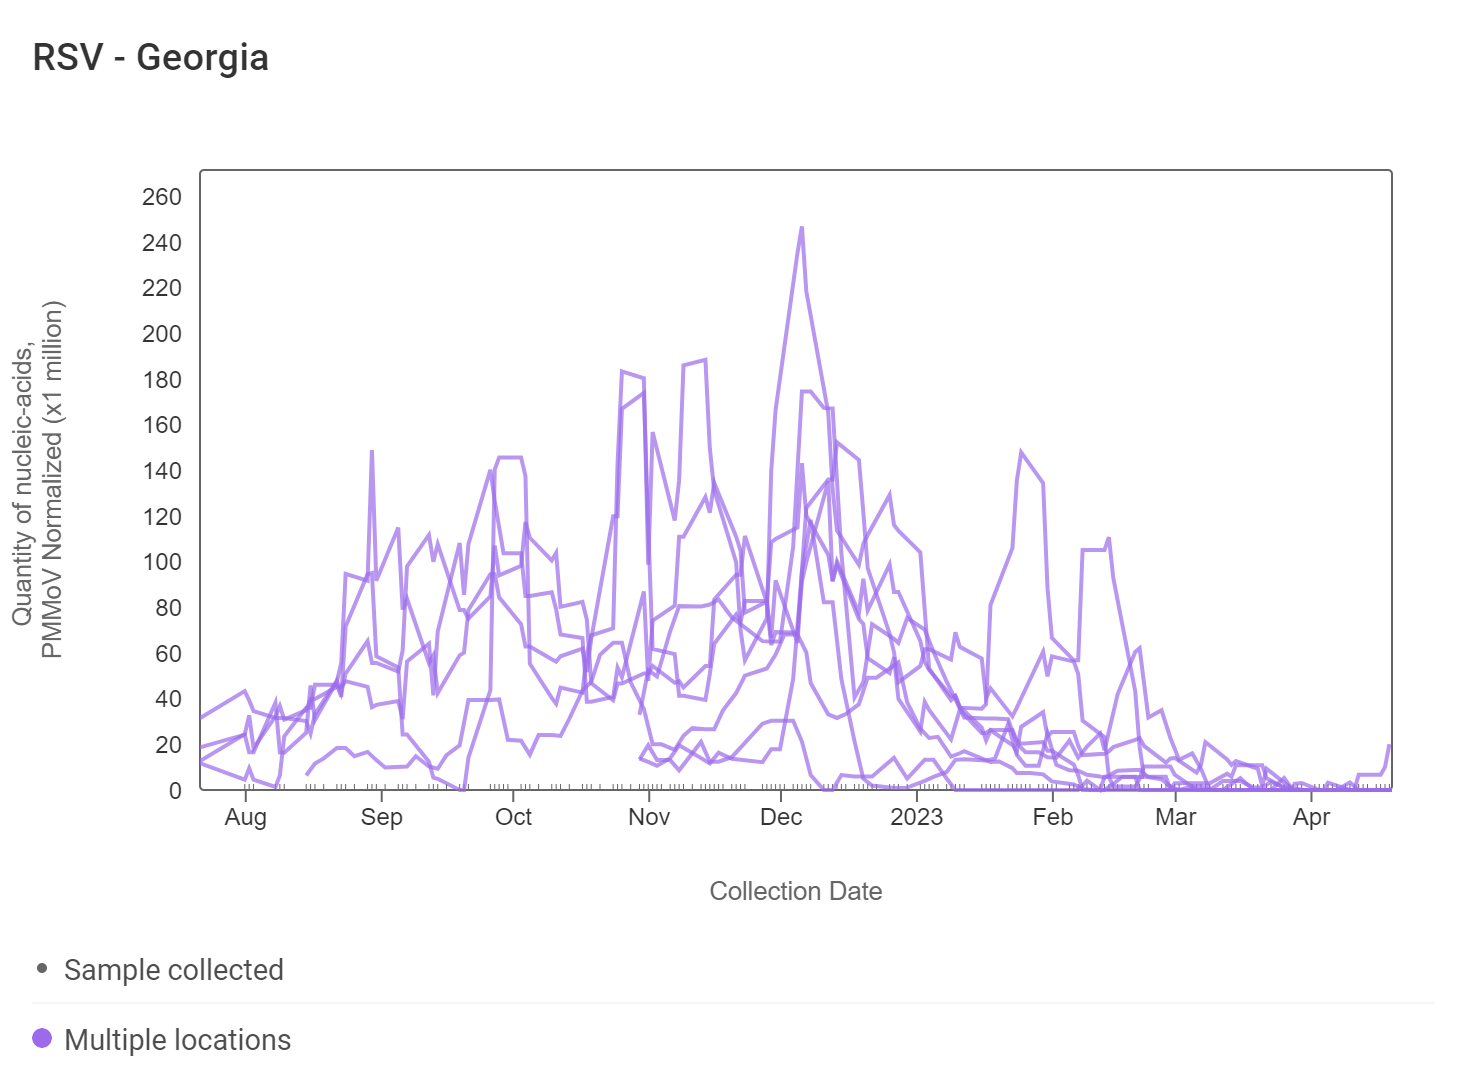
Of the 8 sites, 0 show an upward trend, 8 show no trend, and 0 show a decreasing trend. This can be interpreted to mean that over the last 21 days, concentrations of RSV RNA have generally not changed at Georgia sites.
HMPV (human metapneumovirus) RNA concentrations are less than 50,000 copies/g. At Georgia sites, HMPV continues to remain constant comparable to over two weeks ago. However, Utoy Creek has seen sporadic detection and the site did not detect HMPV in any of their samples collected in the last two weeks.
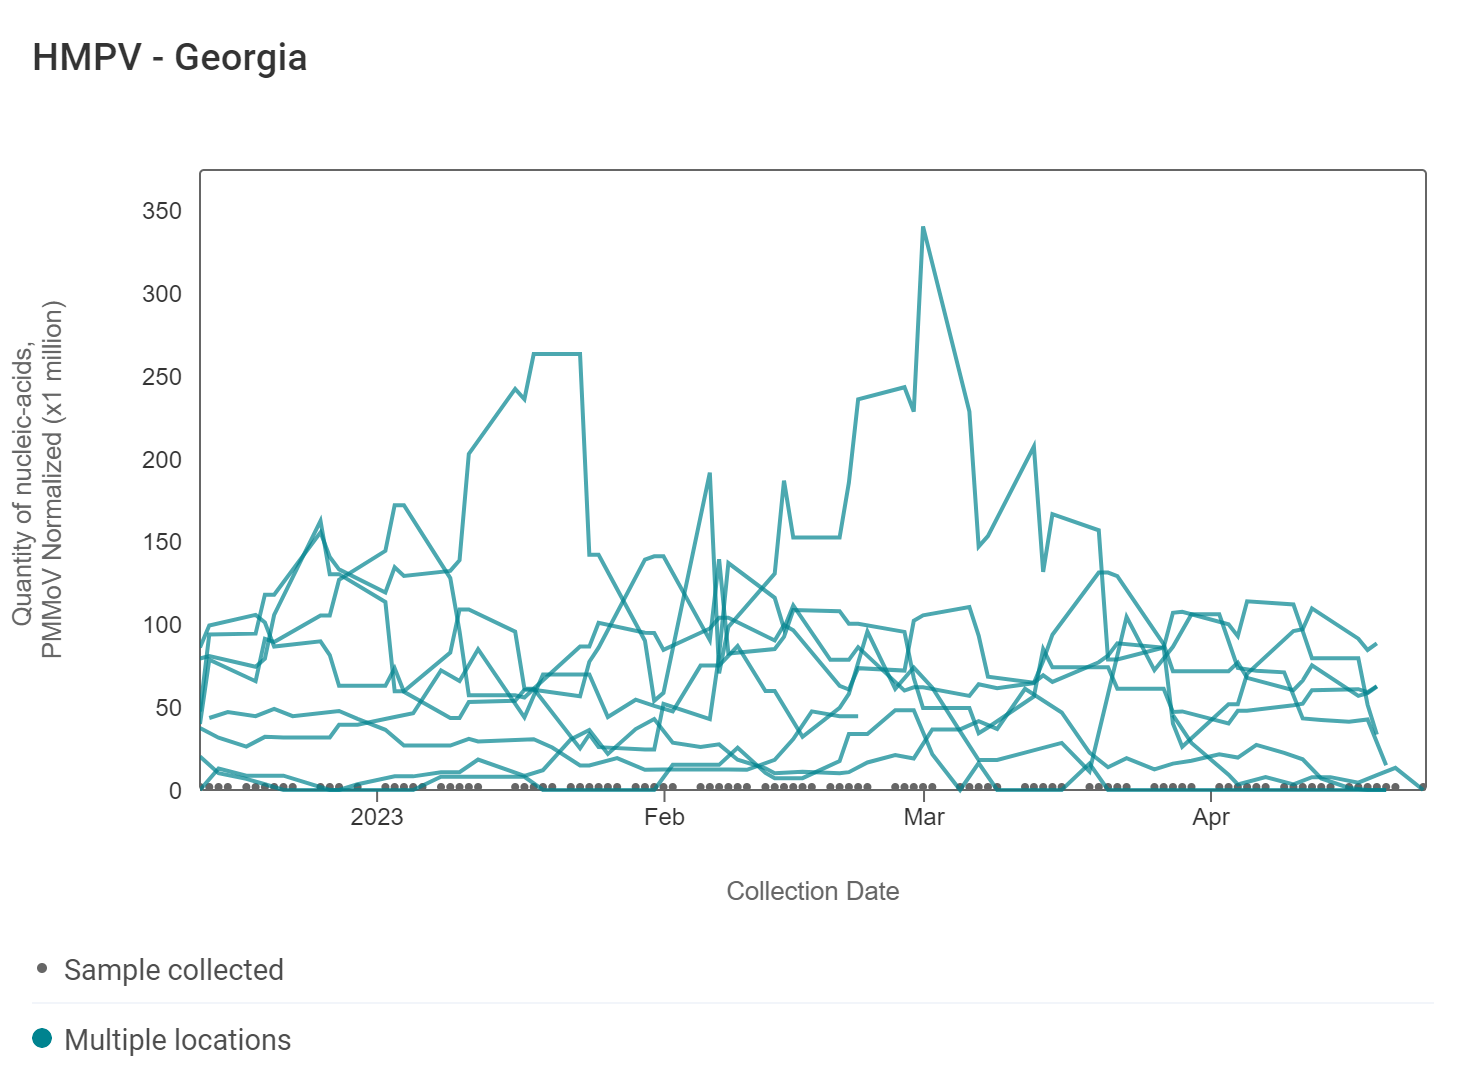
Of the 8 sites, 1 shows an upward trend, 6 show no trend, and 1 shows a decreasing trend. This can be interpreted to mean that over the last 21 days, concentrations of HMPV RNA have generally not changed at most sites.
Norovirus
Assay detects human norovirus GII
Norovirus GII (HuNoV GII) RNA concentrations across Georgia plants have been similar over the last two weeks ranging between 2,000,000 - 24,000,000 copies/gram.
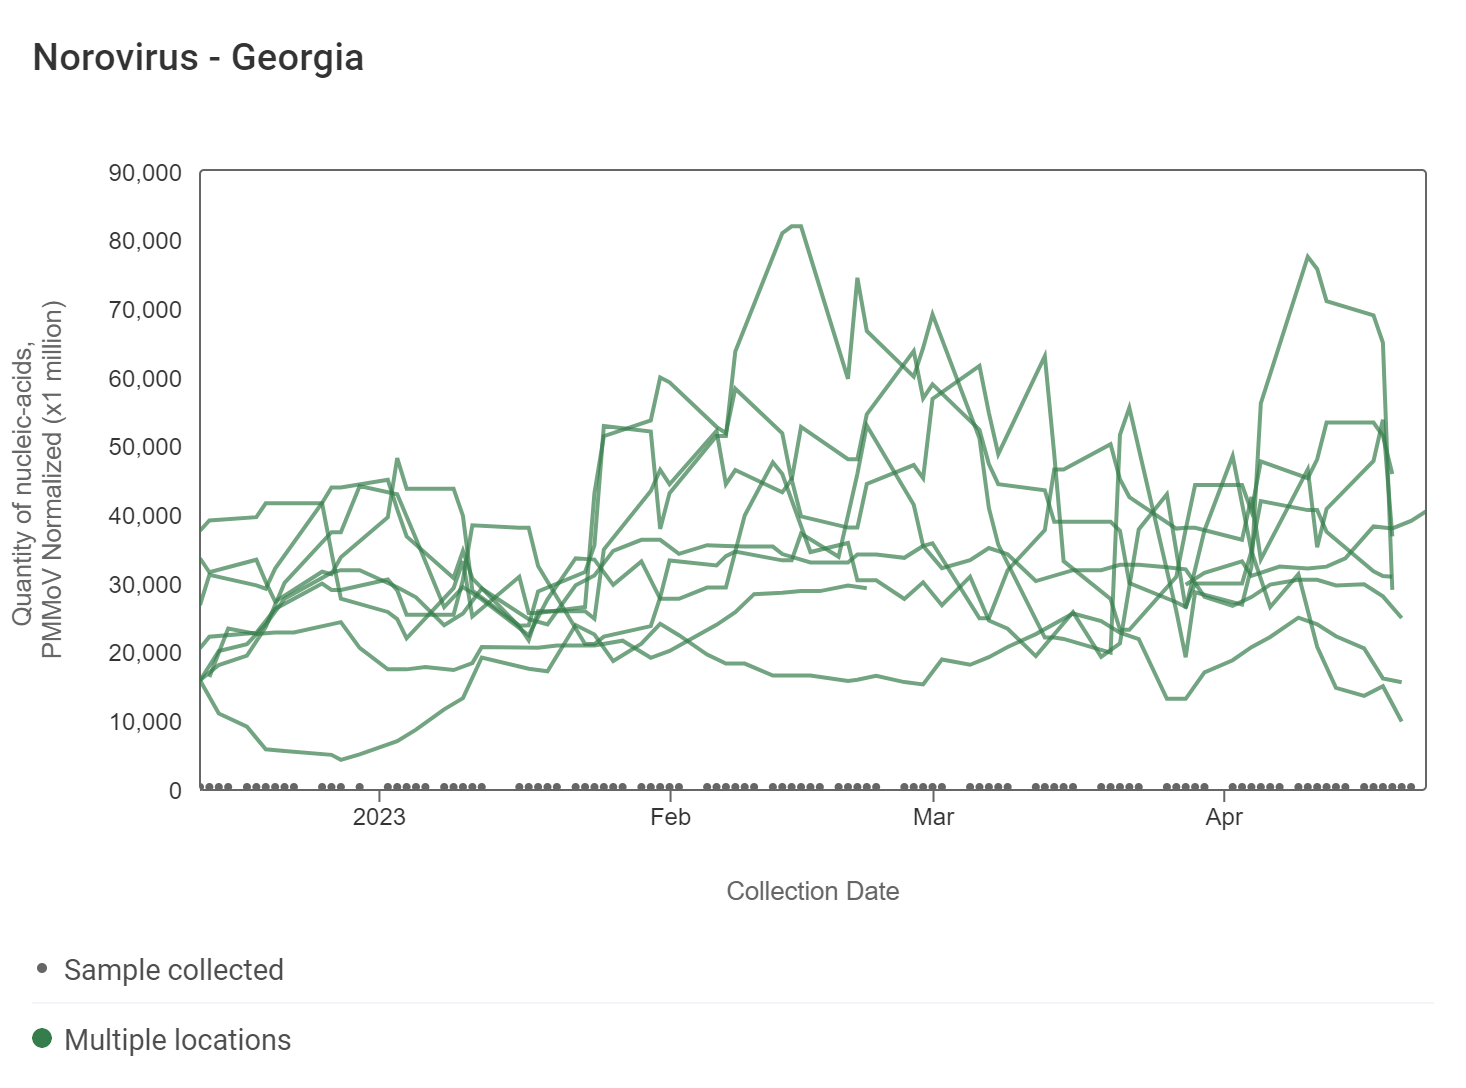
Of the 8 sites, 1 shows an upward trend, 6 show no trend, and 1 shows a decreasing trend. This can be interpreted to mean that over the last 21 days, concentrations of HuNoV GII RNA have generally not changed at most sites.
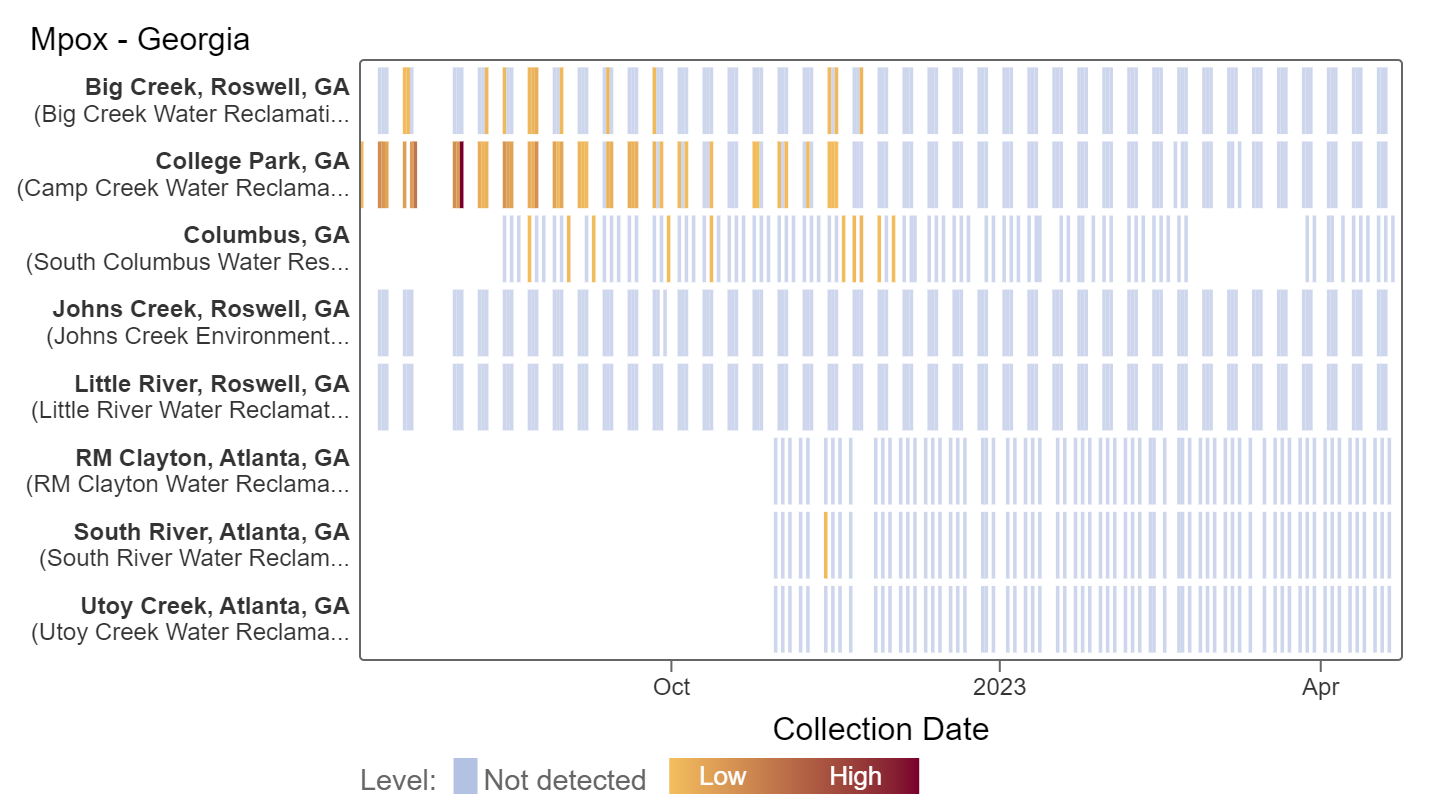
Mpox
Results have been non-detect for mpox in all Georgia plants this month. This heat map shows all the data we have collected for all Georgia sites as a row and each date as a column. Again, the color blue means the sample was non-detect for mpox DNA and the colors get darker with higher concentrations.
Related News
Marlene had the opportunity to talk be interviewed on the Wall Street Journal's "Future of Everything" podcast. It's a fun 20 minutes on wastewater, if you're interested in listening!