
Georgia WWSCAN biweekly update 6/23/2023
Welcome to the bi-weekly update for WWSCAN partners in Georgia! All samples provided up through 6/19/23 have been processed in the lab and data are on the site at data.wastewaterscan.org.
We have a new website feature! "National levels" can be added to charts to visually benchmark where concentrations fall compared to previously recorded measurements for each pathogen. The national levels are shown as groups (bottom, middle and upper) that are based on looking back at all data from the last 365 days across all WWSCAN sites. To enable in 'Chart View', click the eye icon next to "National Levels" in the legend on the left. More details can be found under the "How are national levels determined?" section here.
Historic reference levels can also now be turned on for an individual site. The two reference lines that appear for an individual site plot when the feature is turned on are ‘3 Weeks Back’ and ‘Highest Detected.’ These values are based on the smoothed, trimmed average values and are used to provide context as to how the most recent sample compares to where wastewater levels were 3 weeks ago and the highest levels detected as an individual sites. To enable in 'Chart View', click the eye icon next to "Historic Site Levels" in the legend on the left.
If you notice any bugs on the site or have any comments about it, please continue to send your feedback via email Amanda Bidwell at albidwel@stanford.edu. We appreciate your partnership!
COVID-19
SARS-CoV-2 and Variants
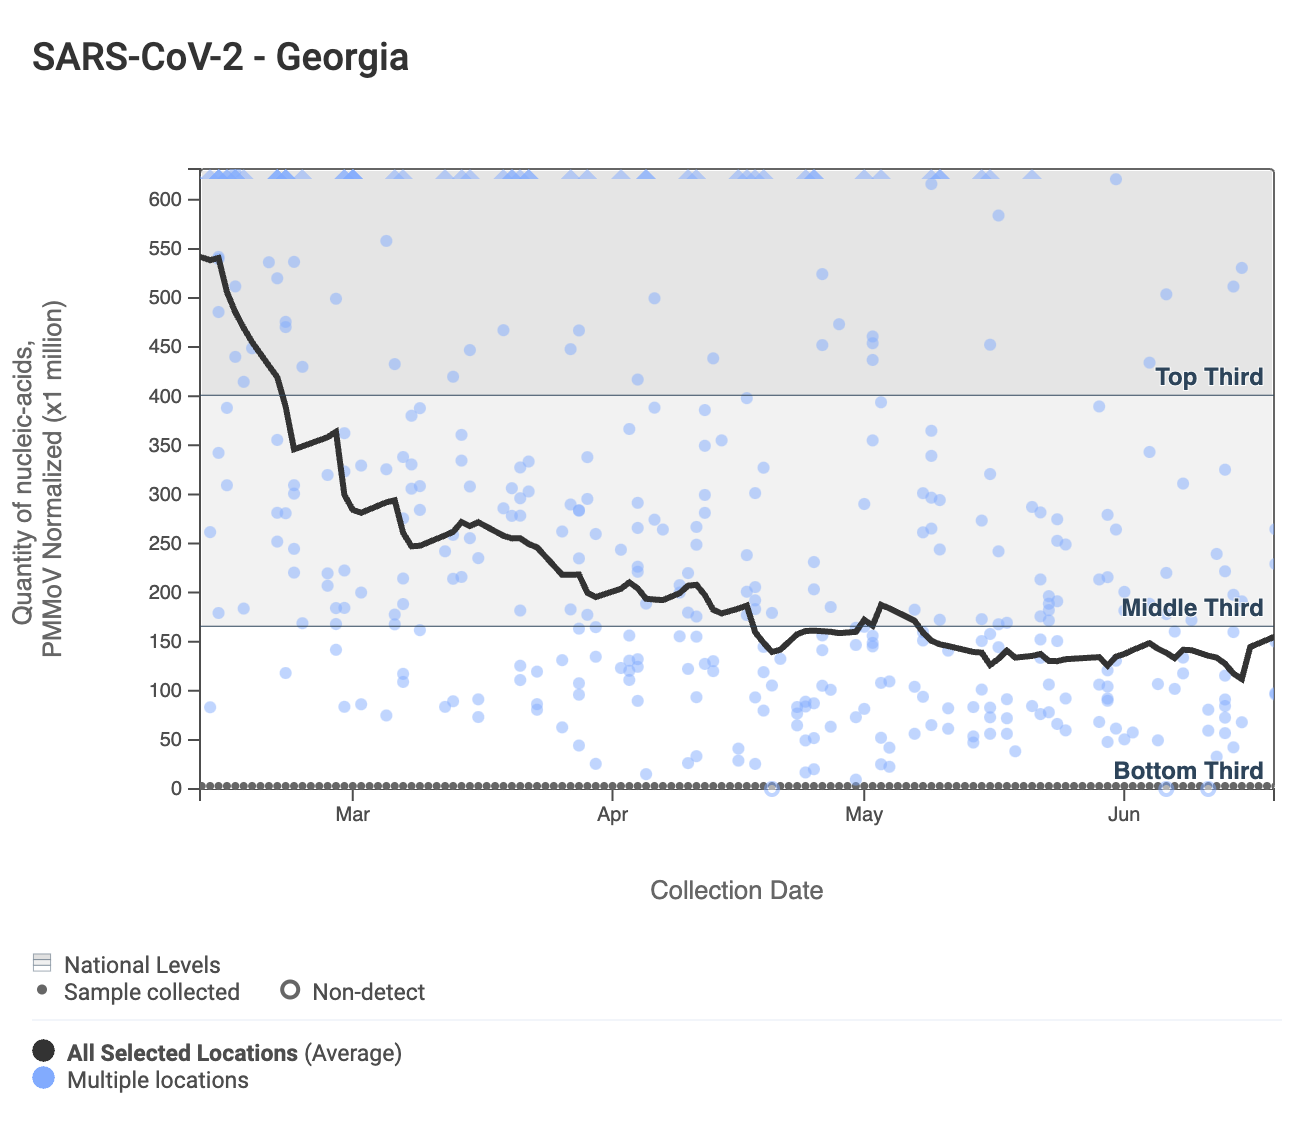
SARS-CoV-2 N gene RNA concentrations are less than 80,000 copies per gram. Detection has become more sporadic at some Georgia sites. Click on each chart to further interact with a chart on data.wastewaterscan.org. The dark gray line in the chart below is a population-weighted aggregated trend line for all 8 Georgia sites when the data is normalized by PMMoV. There is additional information on the methodology behind this trend line available here. This chart shows the national levels, and you can see that the average levels are right at the boundary between the bottom third and middle third of data (33rd percentile).
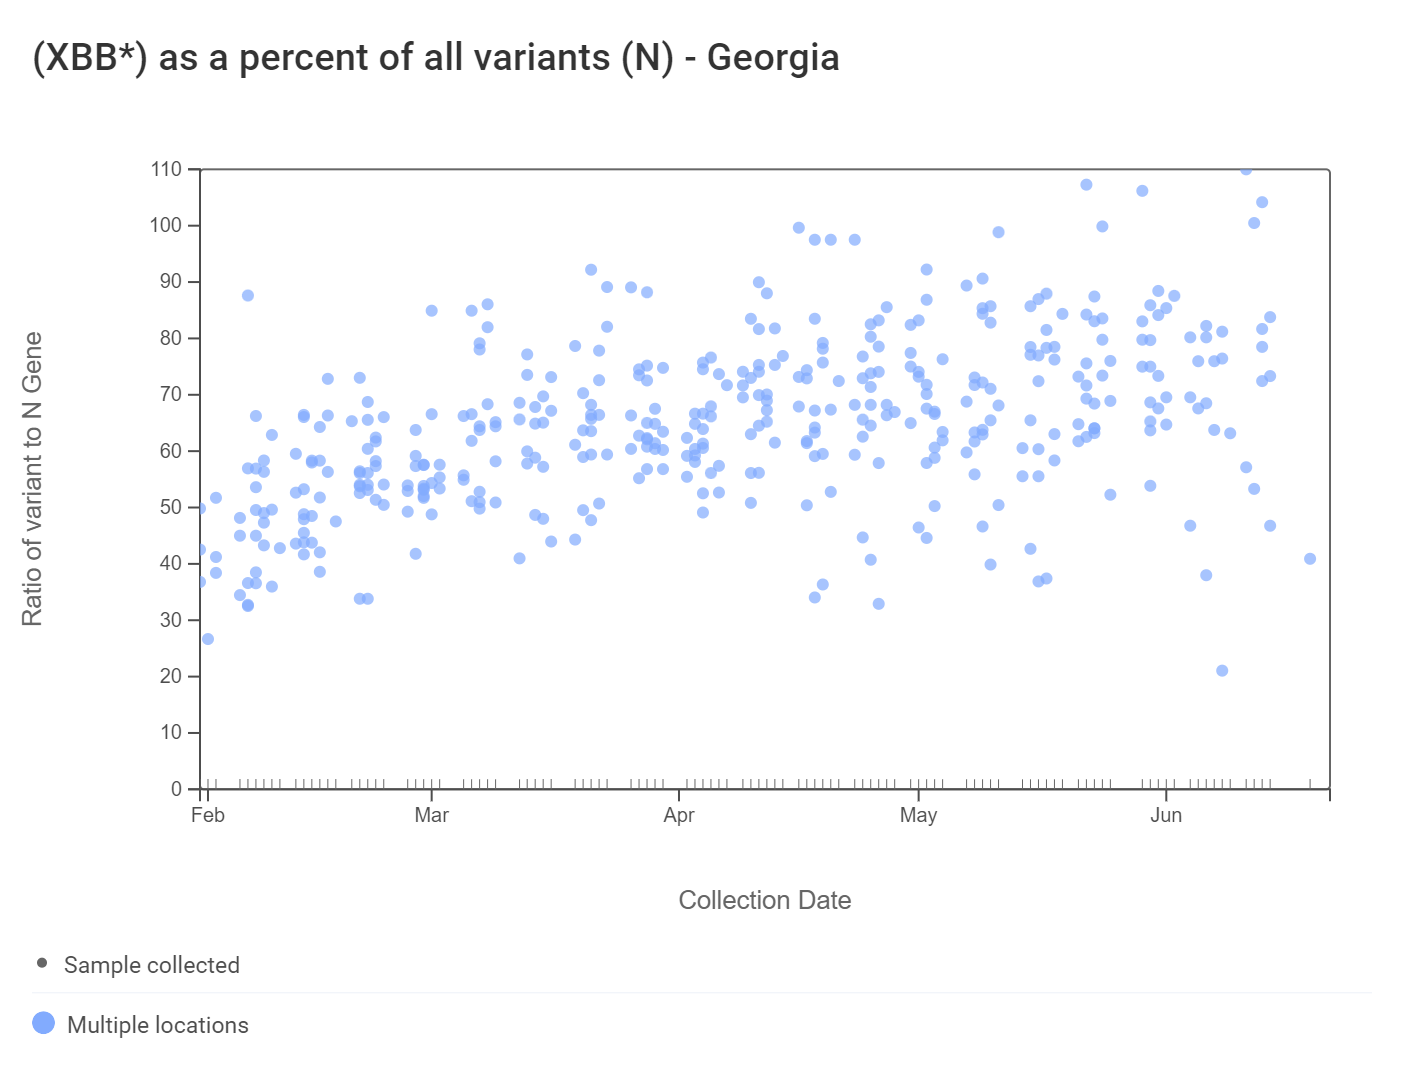
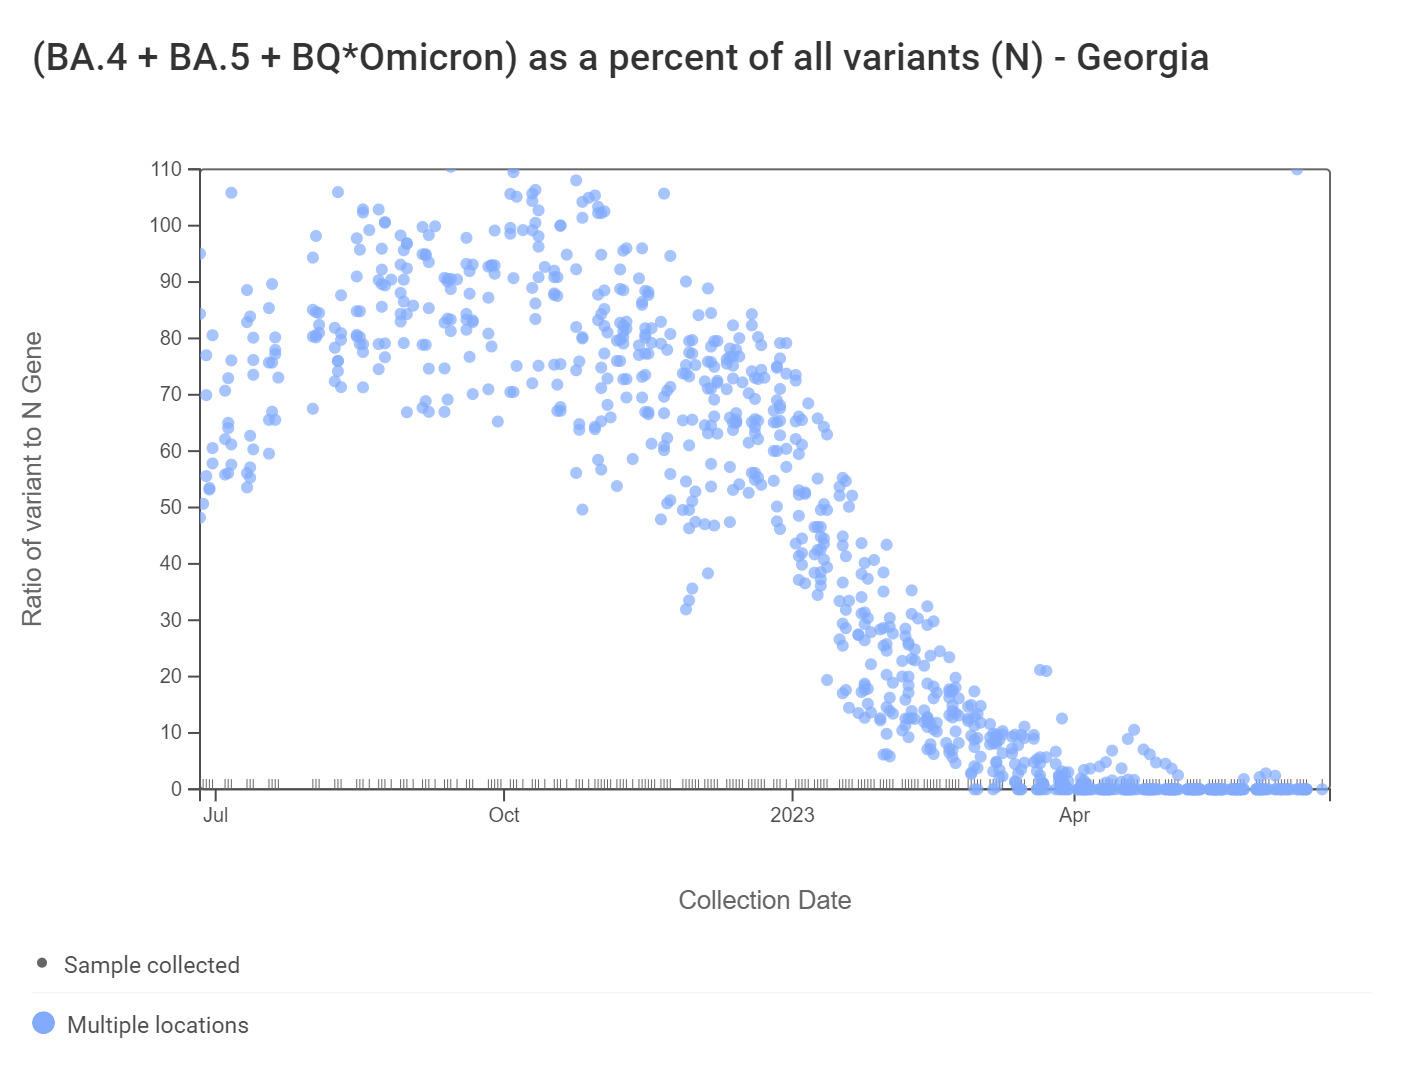
Early in 2023, WWSCAN started testing for XBB* and these results are available to view by selecting 'SARS-CoV-2 View by Variant' on data.wastewaterscan.org. For Georgia sites, data dates back to early February 2023. The ratio of the XBB* mutations/N across all Georgia plants is shown in the chart below. As the ratio reaches 100%, it suggests that all the SARS-CoV-2 genomes in wastewater have the XBB* mutations. These estimates have not changed much since our last update, and data indicate that the average ratio XBB* mutations/N is ~75% but has ranged from 40-100% recently. This suggests the majority of infections across the communities are caused by XBB*. The next chart below shows the ratio of the BA.5, BA.4, and BQ* mutation/N across all Georgia plants. It can be read the same way as the XBB* chart. The average ratio is close to 0%. Note that our XBB* assay will also detect XBB.1.16, XBB.1.9, and FD.2 (XBB.1.5.15.2*).
For most targets, we are also including a trend analysis of their concentrations in wastewater solids (normalized by PMMoV) based on the most recent estimates compared to the recent past. In order to calculate a trend, we require 3 points over the last 21 days. We test for linear trends between log10-transformed concentration (target/PMMoV) and time; the trend must be classified as statistically significant (p<0.1). To read more about our methods for trend analysis click the link here.
Analysis of SARS-CoV-2 concentrations, across the 8 Georgia sites, shows no trend at all sites except College Park, which has a significant downward trend. This can be interpreted to mean that over the last 21 days, concentrations of SARS-CoV-2 RNA have generally not changed at most sites.
Other Respiratory Viruses
IAV, IBV, RSV, and HMPV
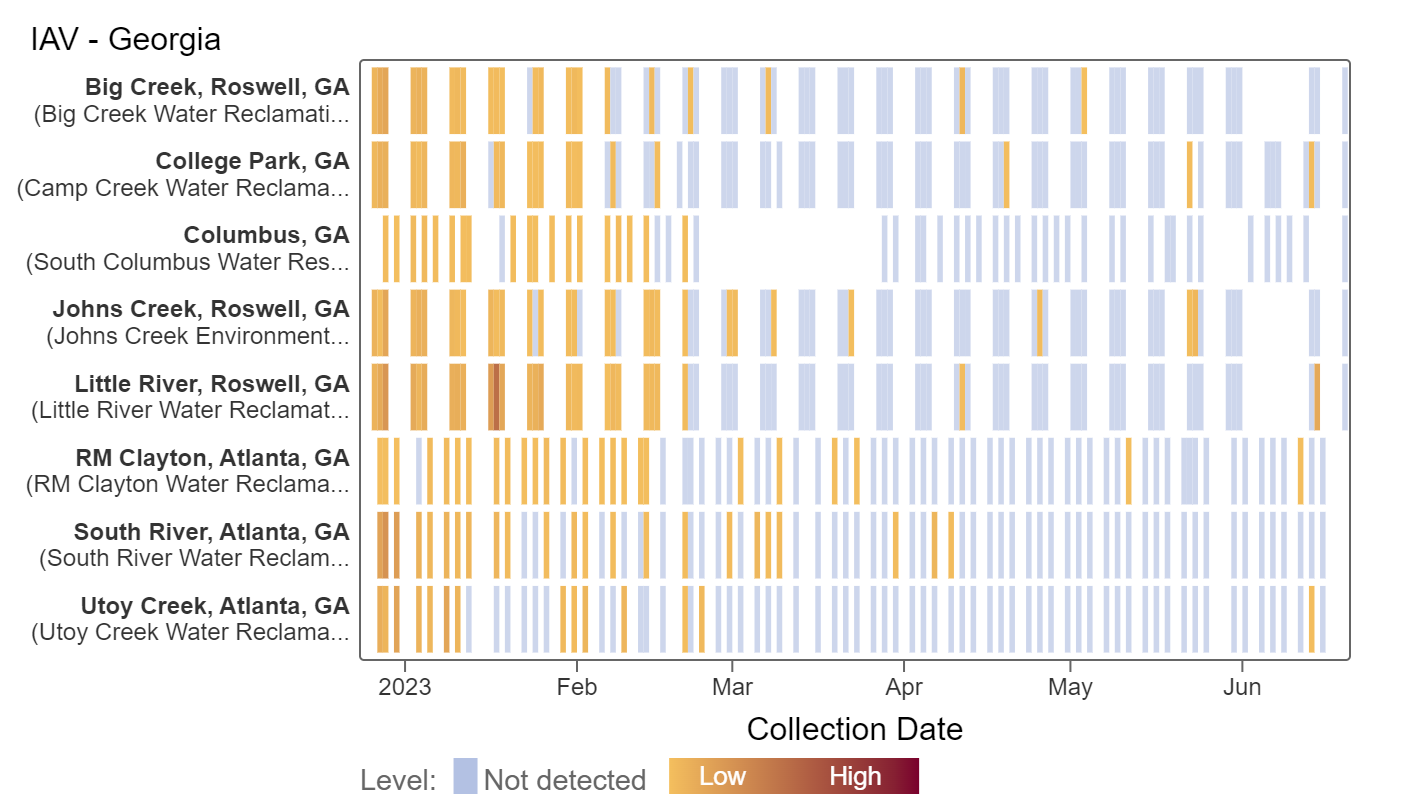
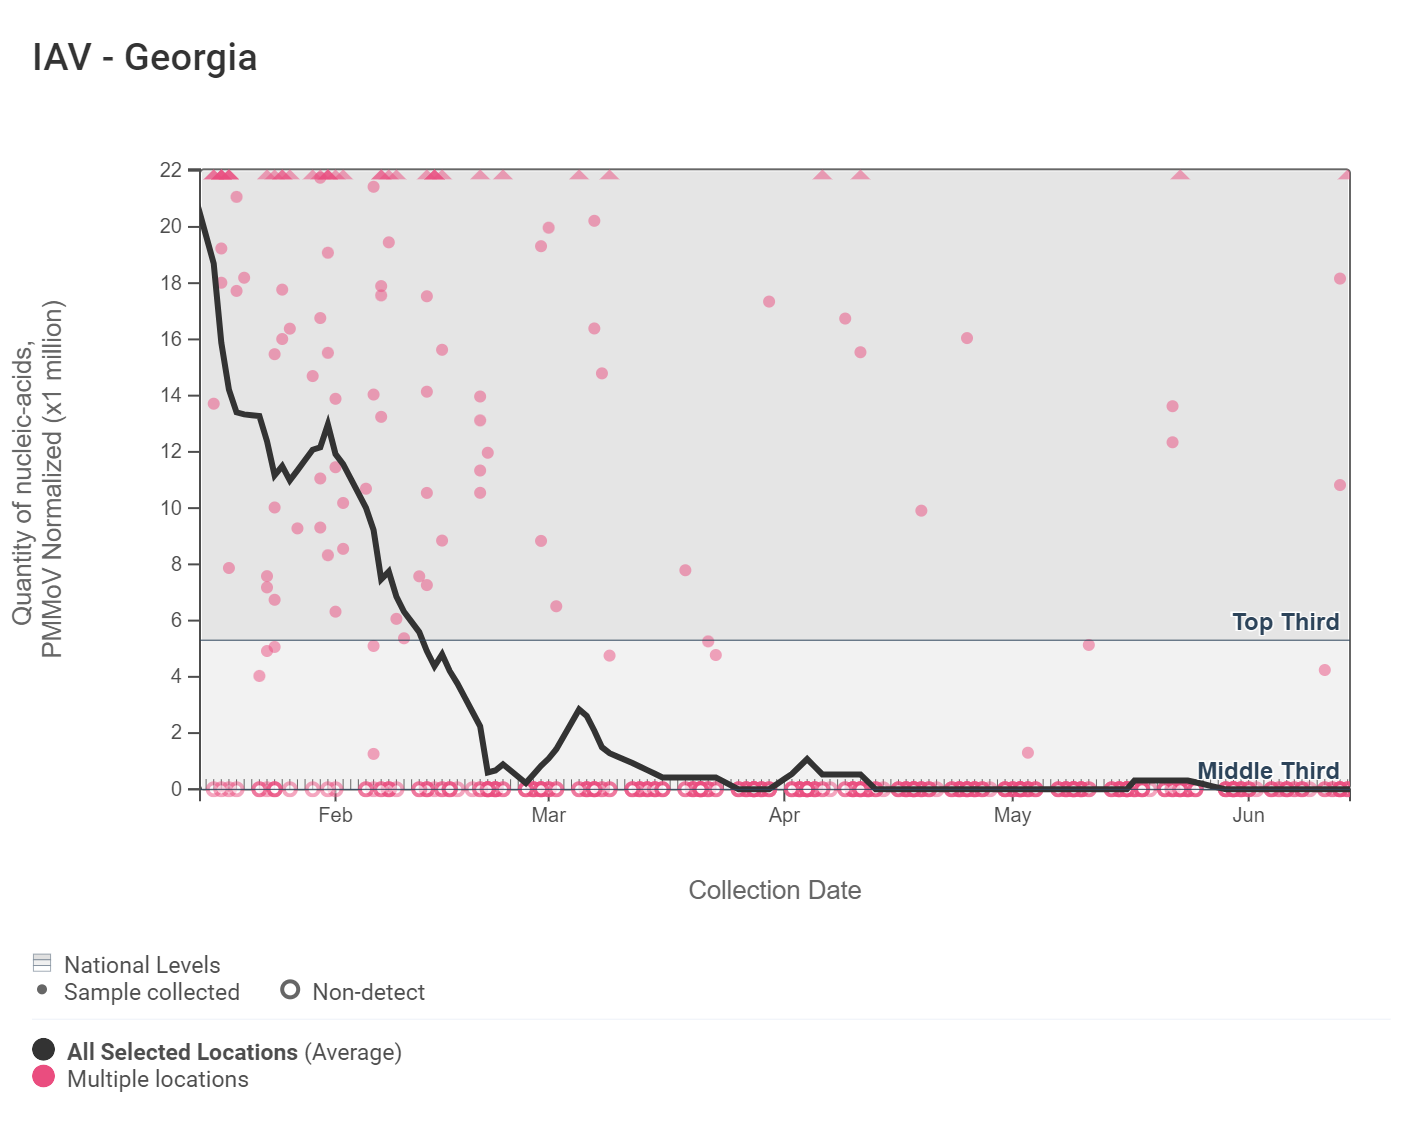
Influenza A (IAV) RNA has sporadically been detected at various Georgia sites in samples collected over the last few months, according to the heat map below and there is no significant trend over the last 21 days at all sites.
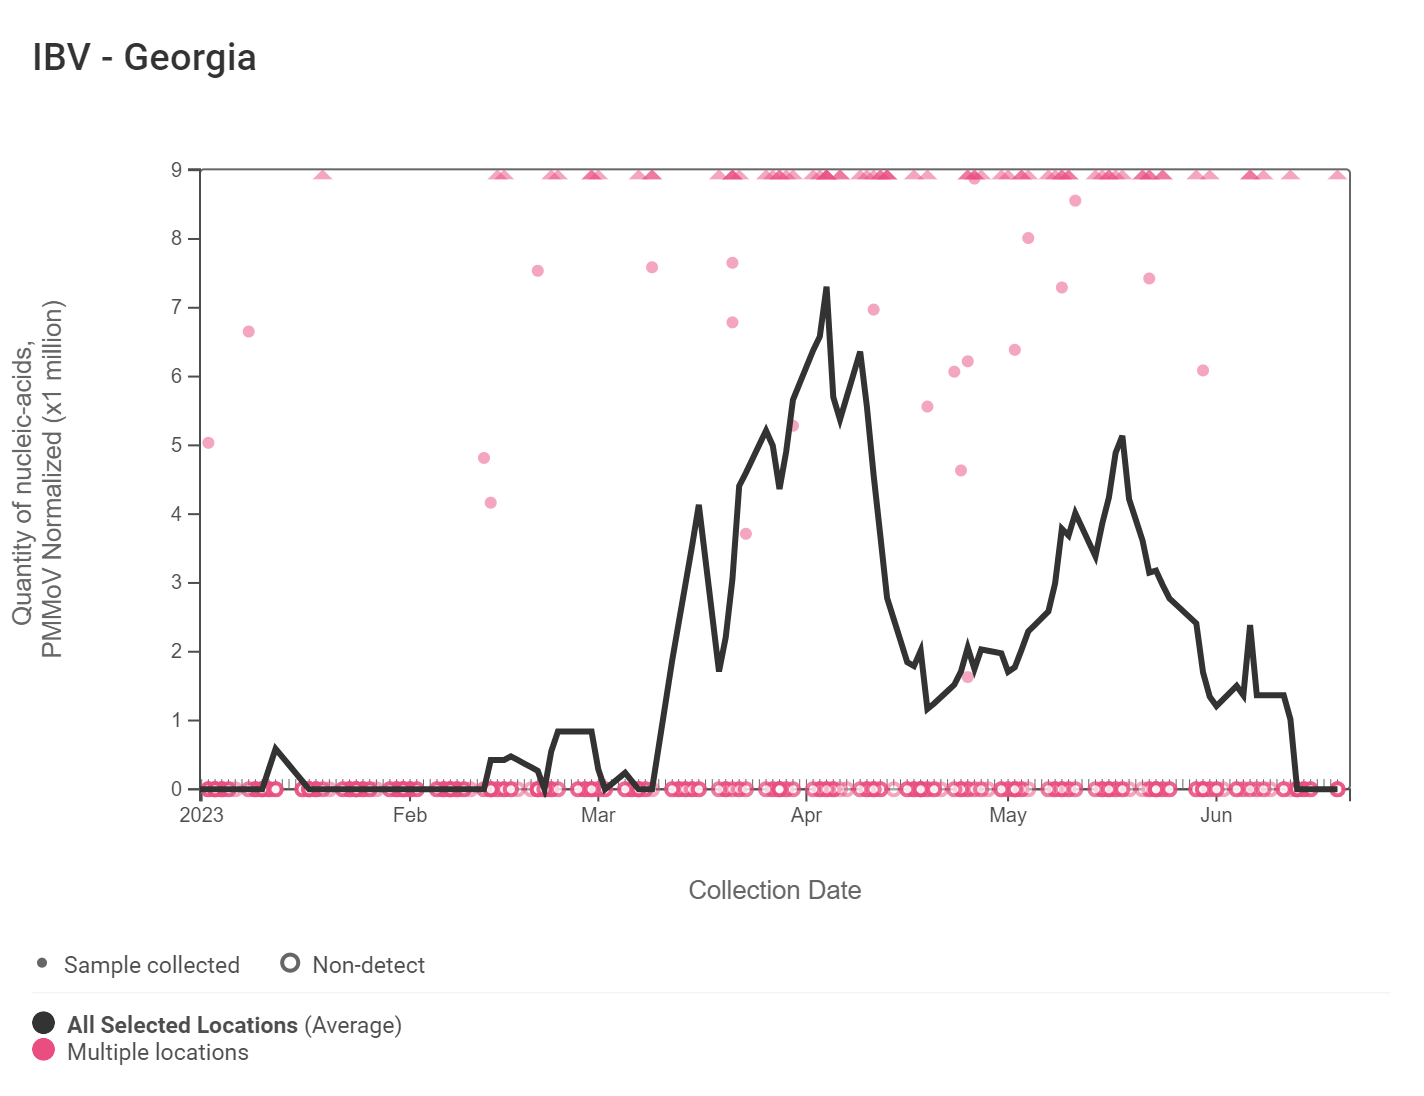
Influenza B (IBV) RNA concentrations are low and below 4,000 copies/g. Samples collected in the last two weeks detected IBV at the Big Creek, College Park, and South River sites. Based on the trend analysis of IBV concentrations normalized by PMMoV at all sites, there is no significant trend over the last 21 days at all sites.
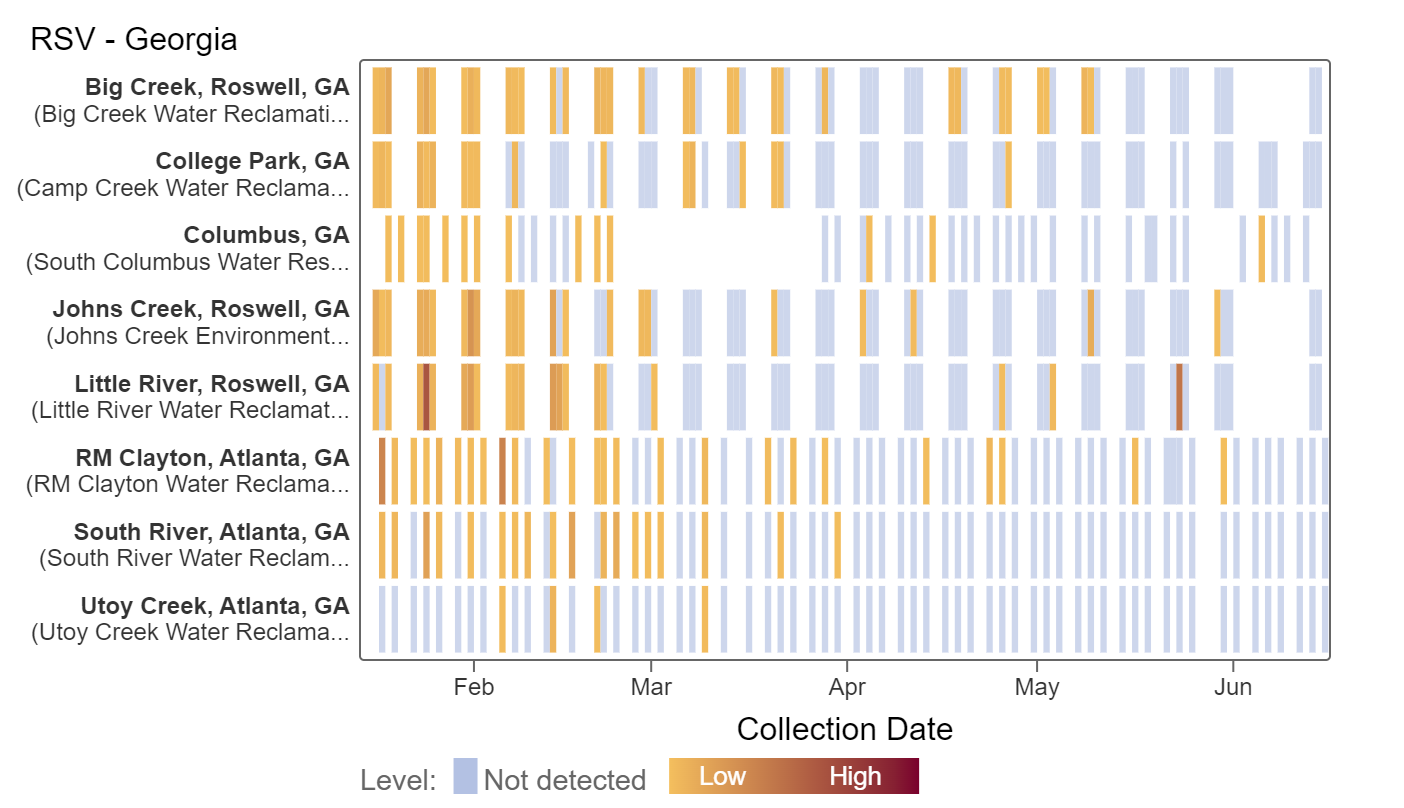
RSV RNA has not been detected in samples collected from Georgia sites over the last two weeks. Additionally, the analysis of RSV concentrations across the 8 Georgia sites shows no trend at all sites over the last 21 days.
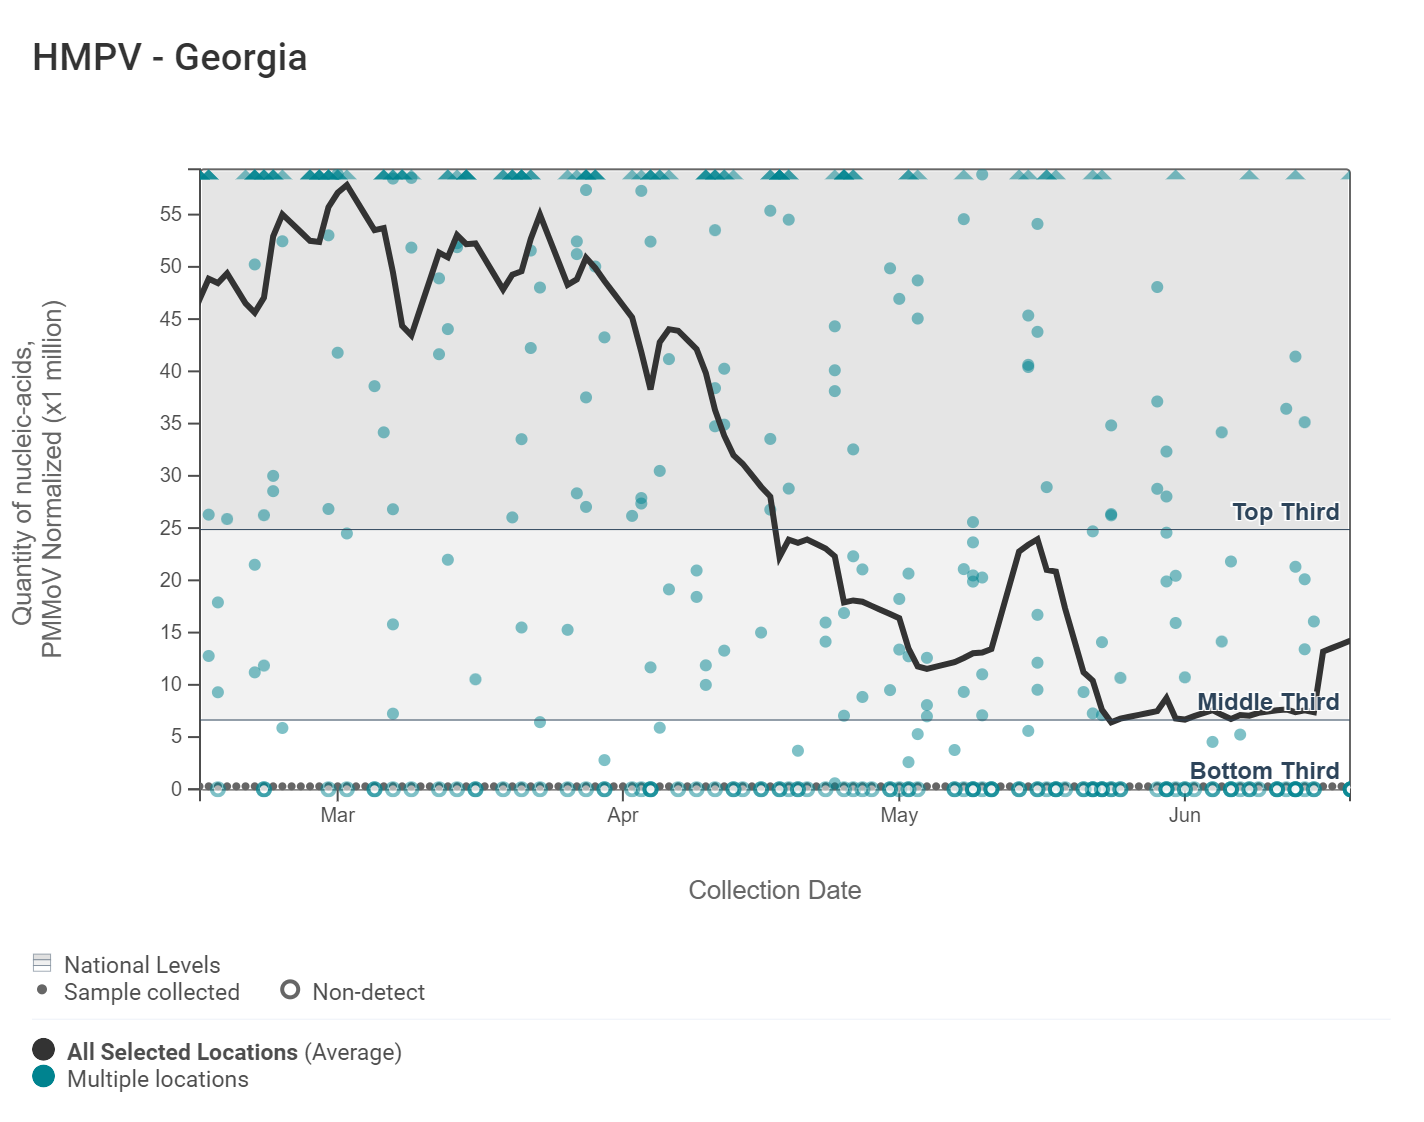
HMPV (human metapneumovirus) RNA concentrations have slightly decreased over the last two weeks and are less than 10,000 copies/g. Analysis of HMPV concentrations, across the 8 Georgia sites, shows no trend at all sites except Little River, which has a significant downward trend. This can be interpreted to mean that over the last 21 days, concentrations of SARS-CoV-2 RNA have generally not changed at most sites.
Norovirus
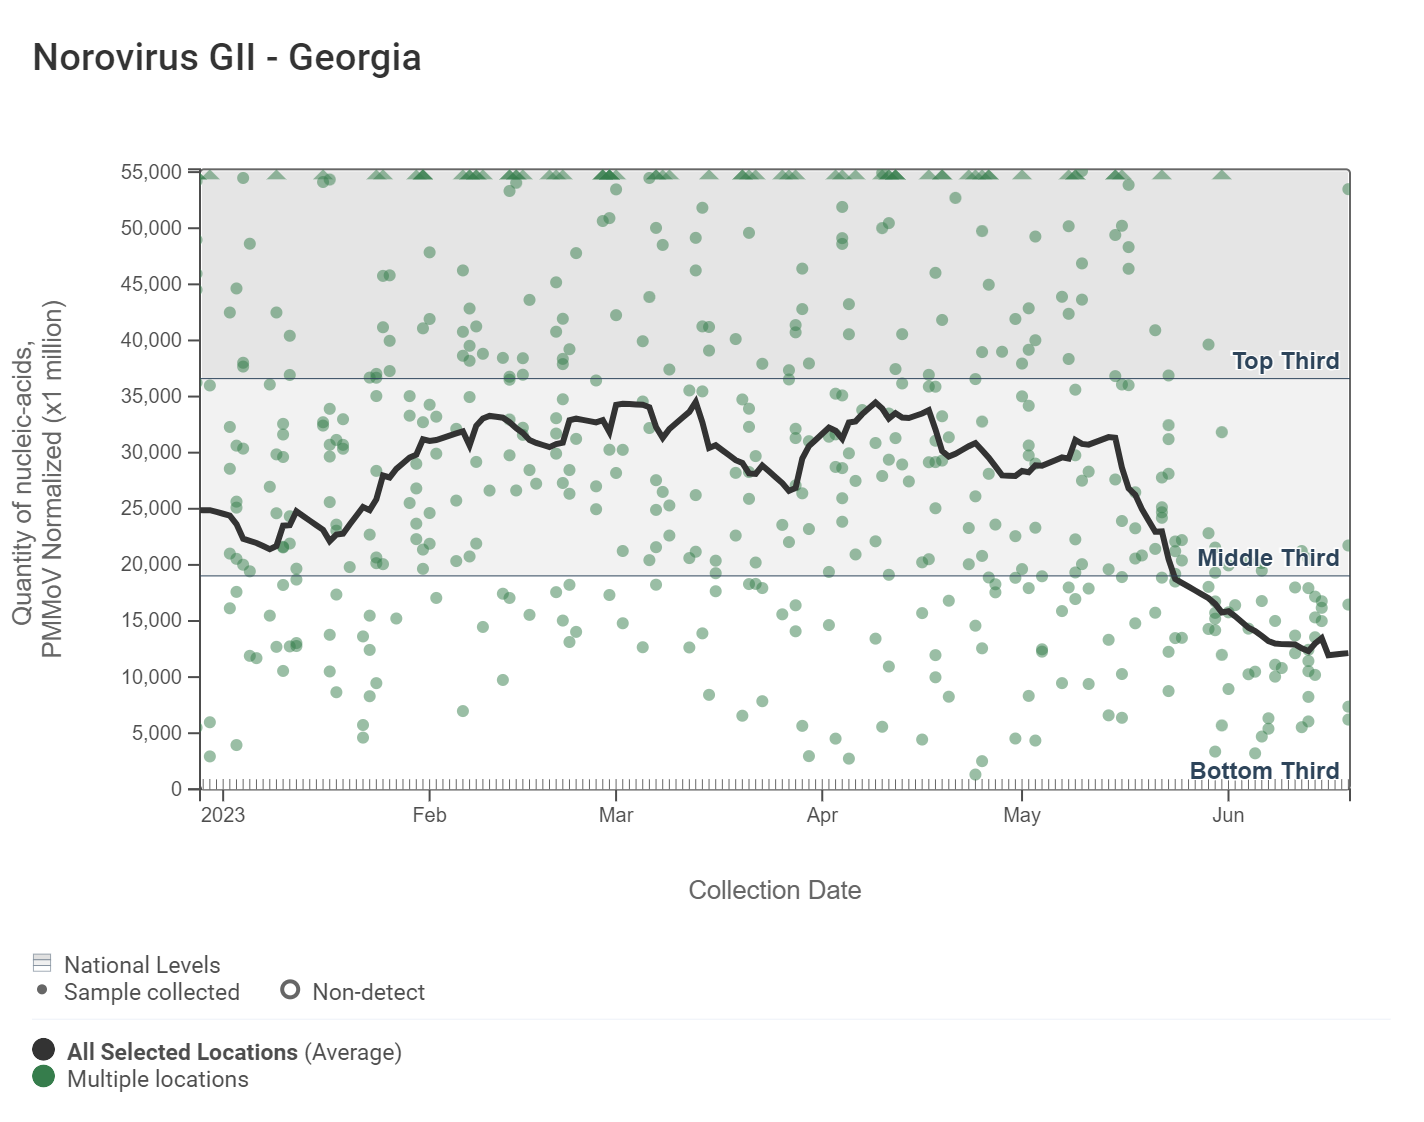
Assay detects human norovirus GII
Norovirus GII (HuNoV GII) RNA concentrations have slightly decreased ranging from 2,000,000 - 8,000,000 copies per gram. The analysis of HuNoV GII concentrations across the 8 Georgia sites shows no trend at all sites over the last 21 days.
Mpox
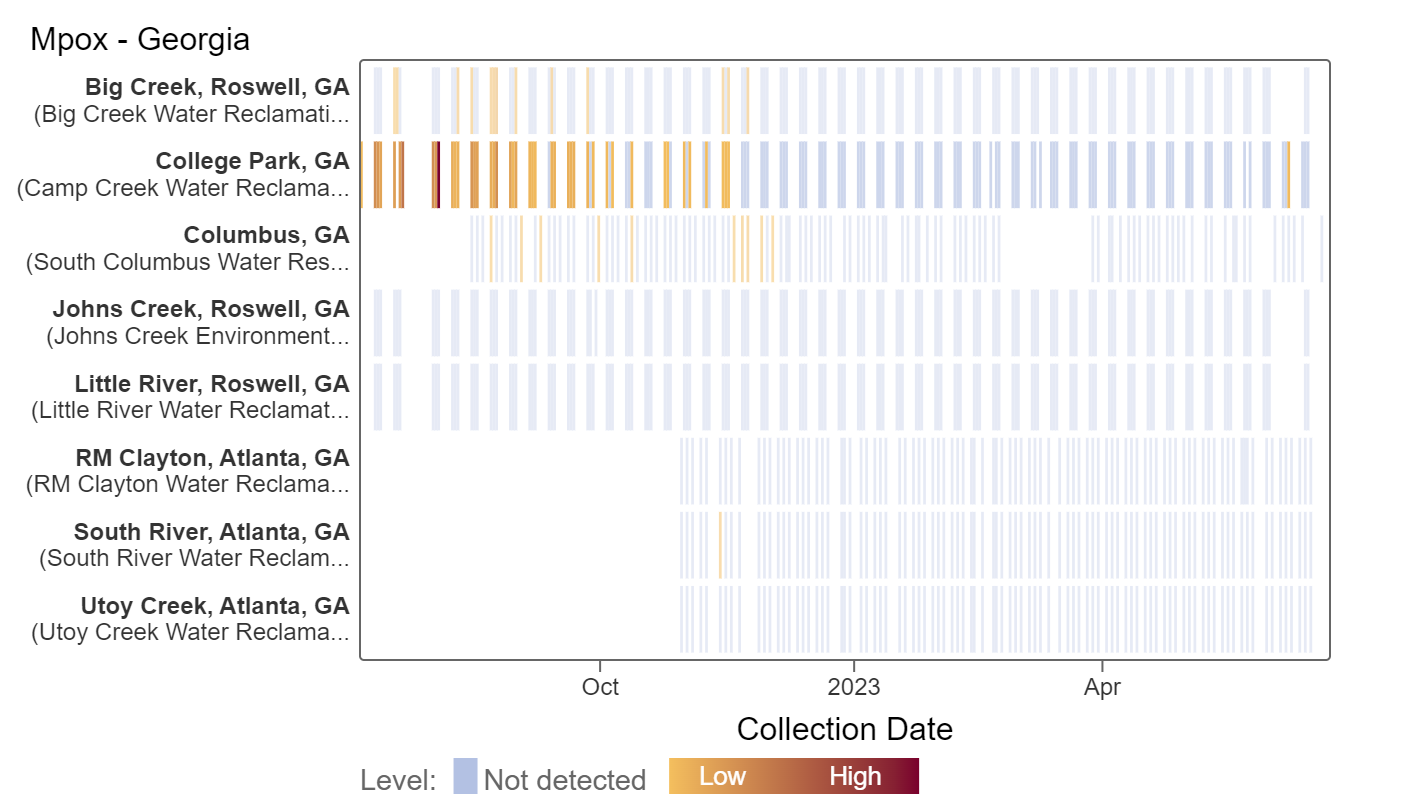
Results continue to remain non-detect for mpox at most Georgia plants. Earlier this month, there was a recent single detection in College Park at the Camp Creek Water Reclamation Facility. This heat map shows data since July 2022. Sites are labeled in the rows and each date a sample was collected as a column. The color blue means the sample was non-detect for mpox DNA and the colors get darker with higher concentrations.
Related News
The next stakeholder meeting will take place Friday, June 30th @ 12 PM EST. Hope to see you there!