
Nationwide WWSCAN Update 6/23/23
Hi everyone,
This newsletter contains updates on the WastewaterSCAN program with wastewater data processed by the lab through June 20, 2023. Below you will find information on the program in terms of participating partners, review of targets being measured, as well as trends in concentrations of infectious disease targets.
Enjoy your weekend,
Ali & Marlene
Participating Plants
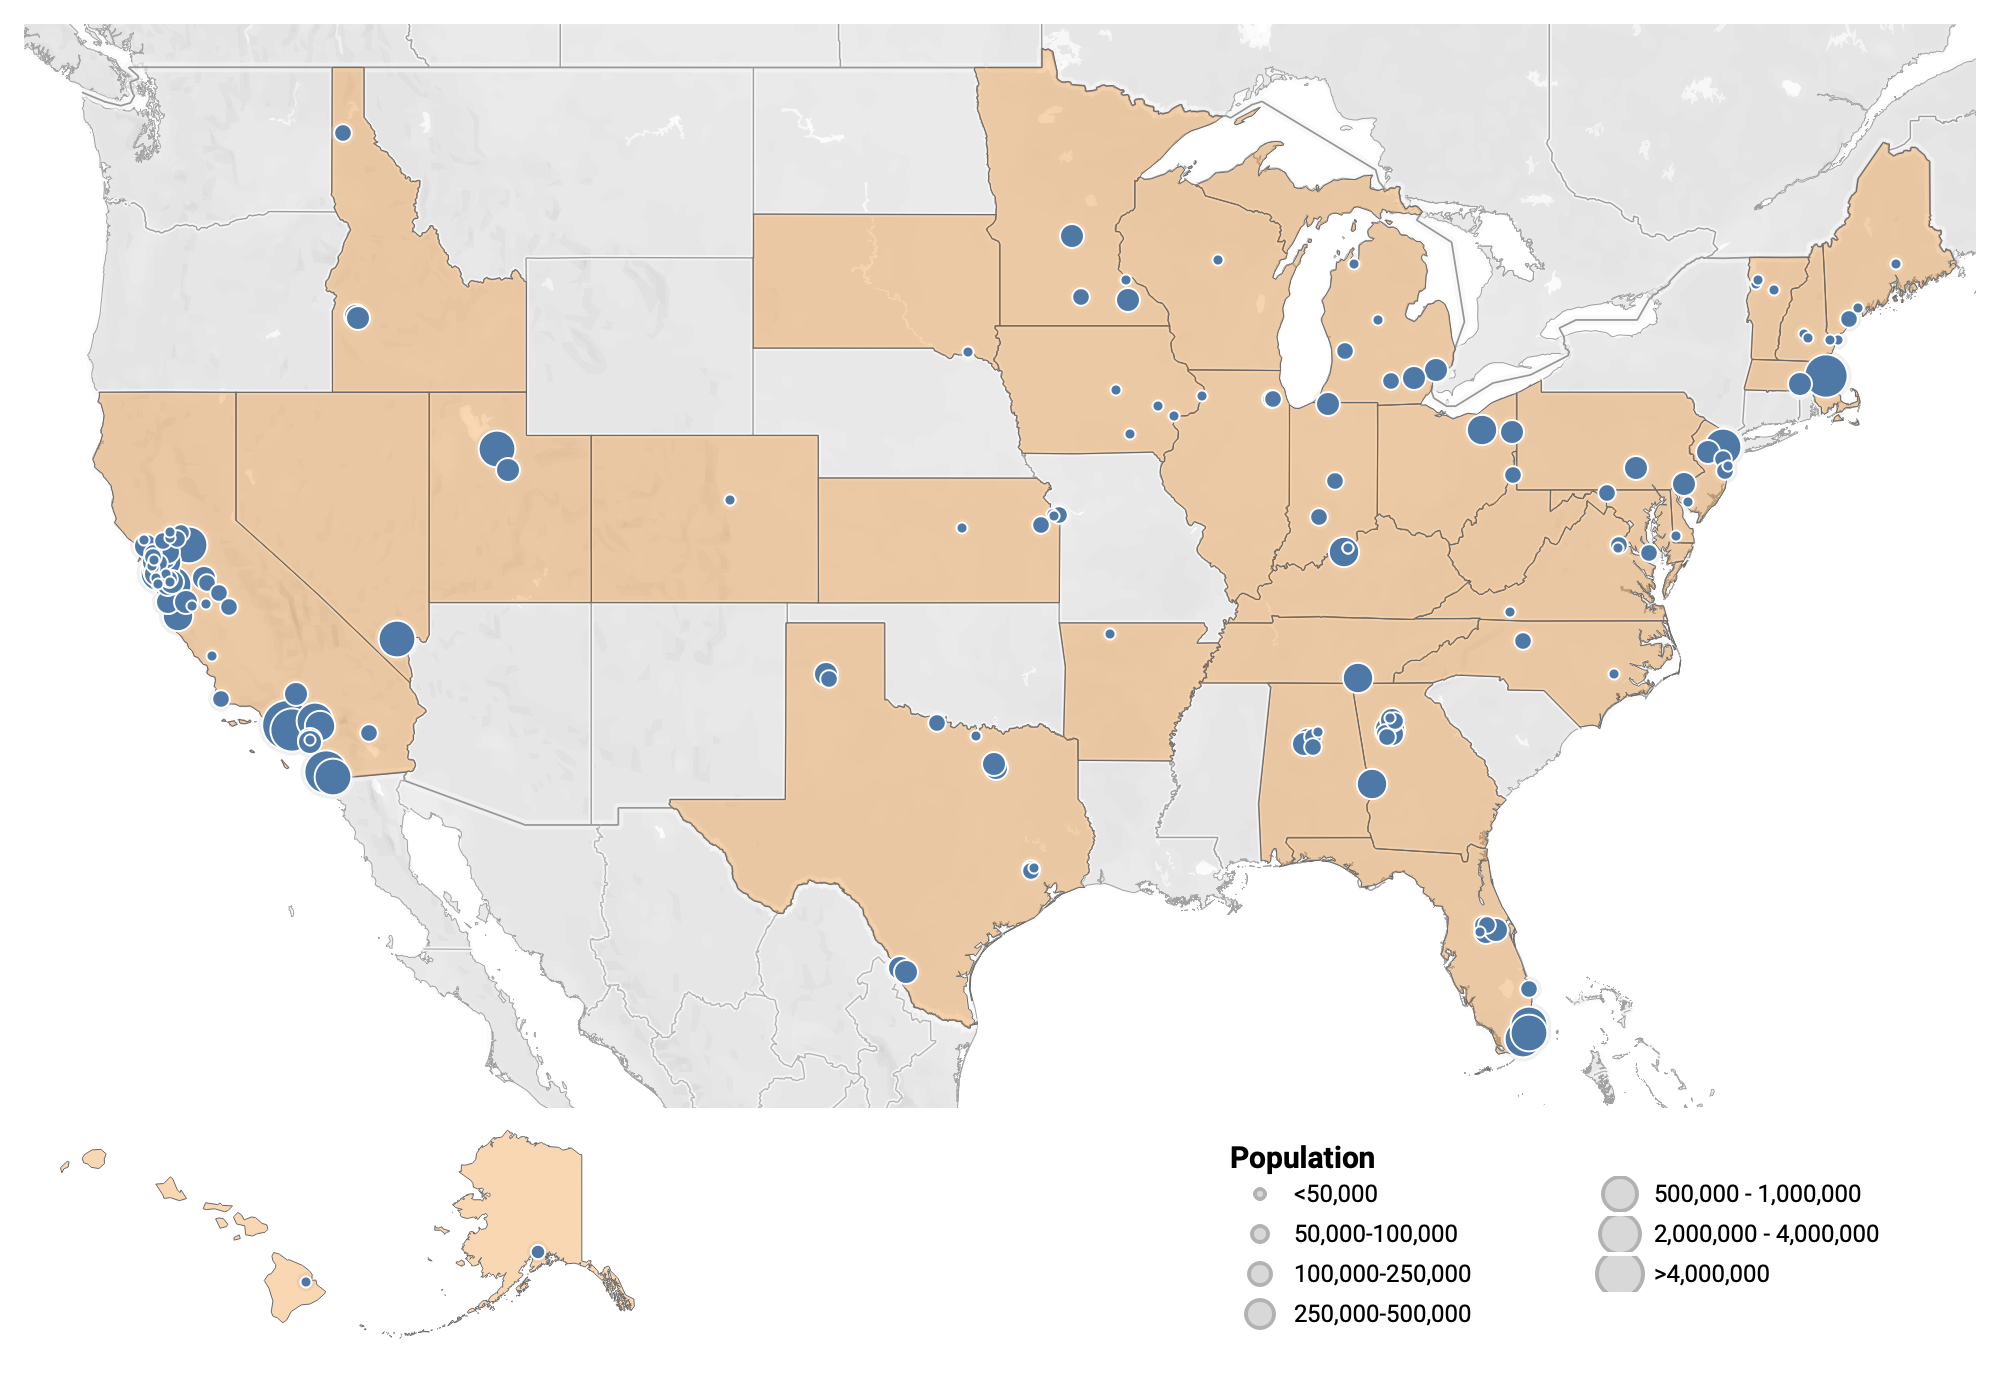
162 plants from 34 states are sampling, which represents ~12% of the US population
Participants:
- 162 plants sampling
- 39,254,140 people covered through sampling efforts
- 34 states represented
- 99 counties represented
New Site Features
We've added National levels & Historic site levels to help better provide context for where current wastewater levels are compared to the past
National Levels
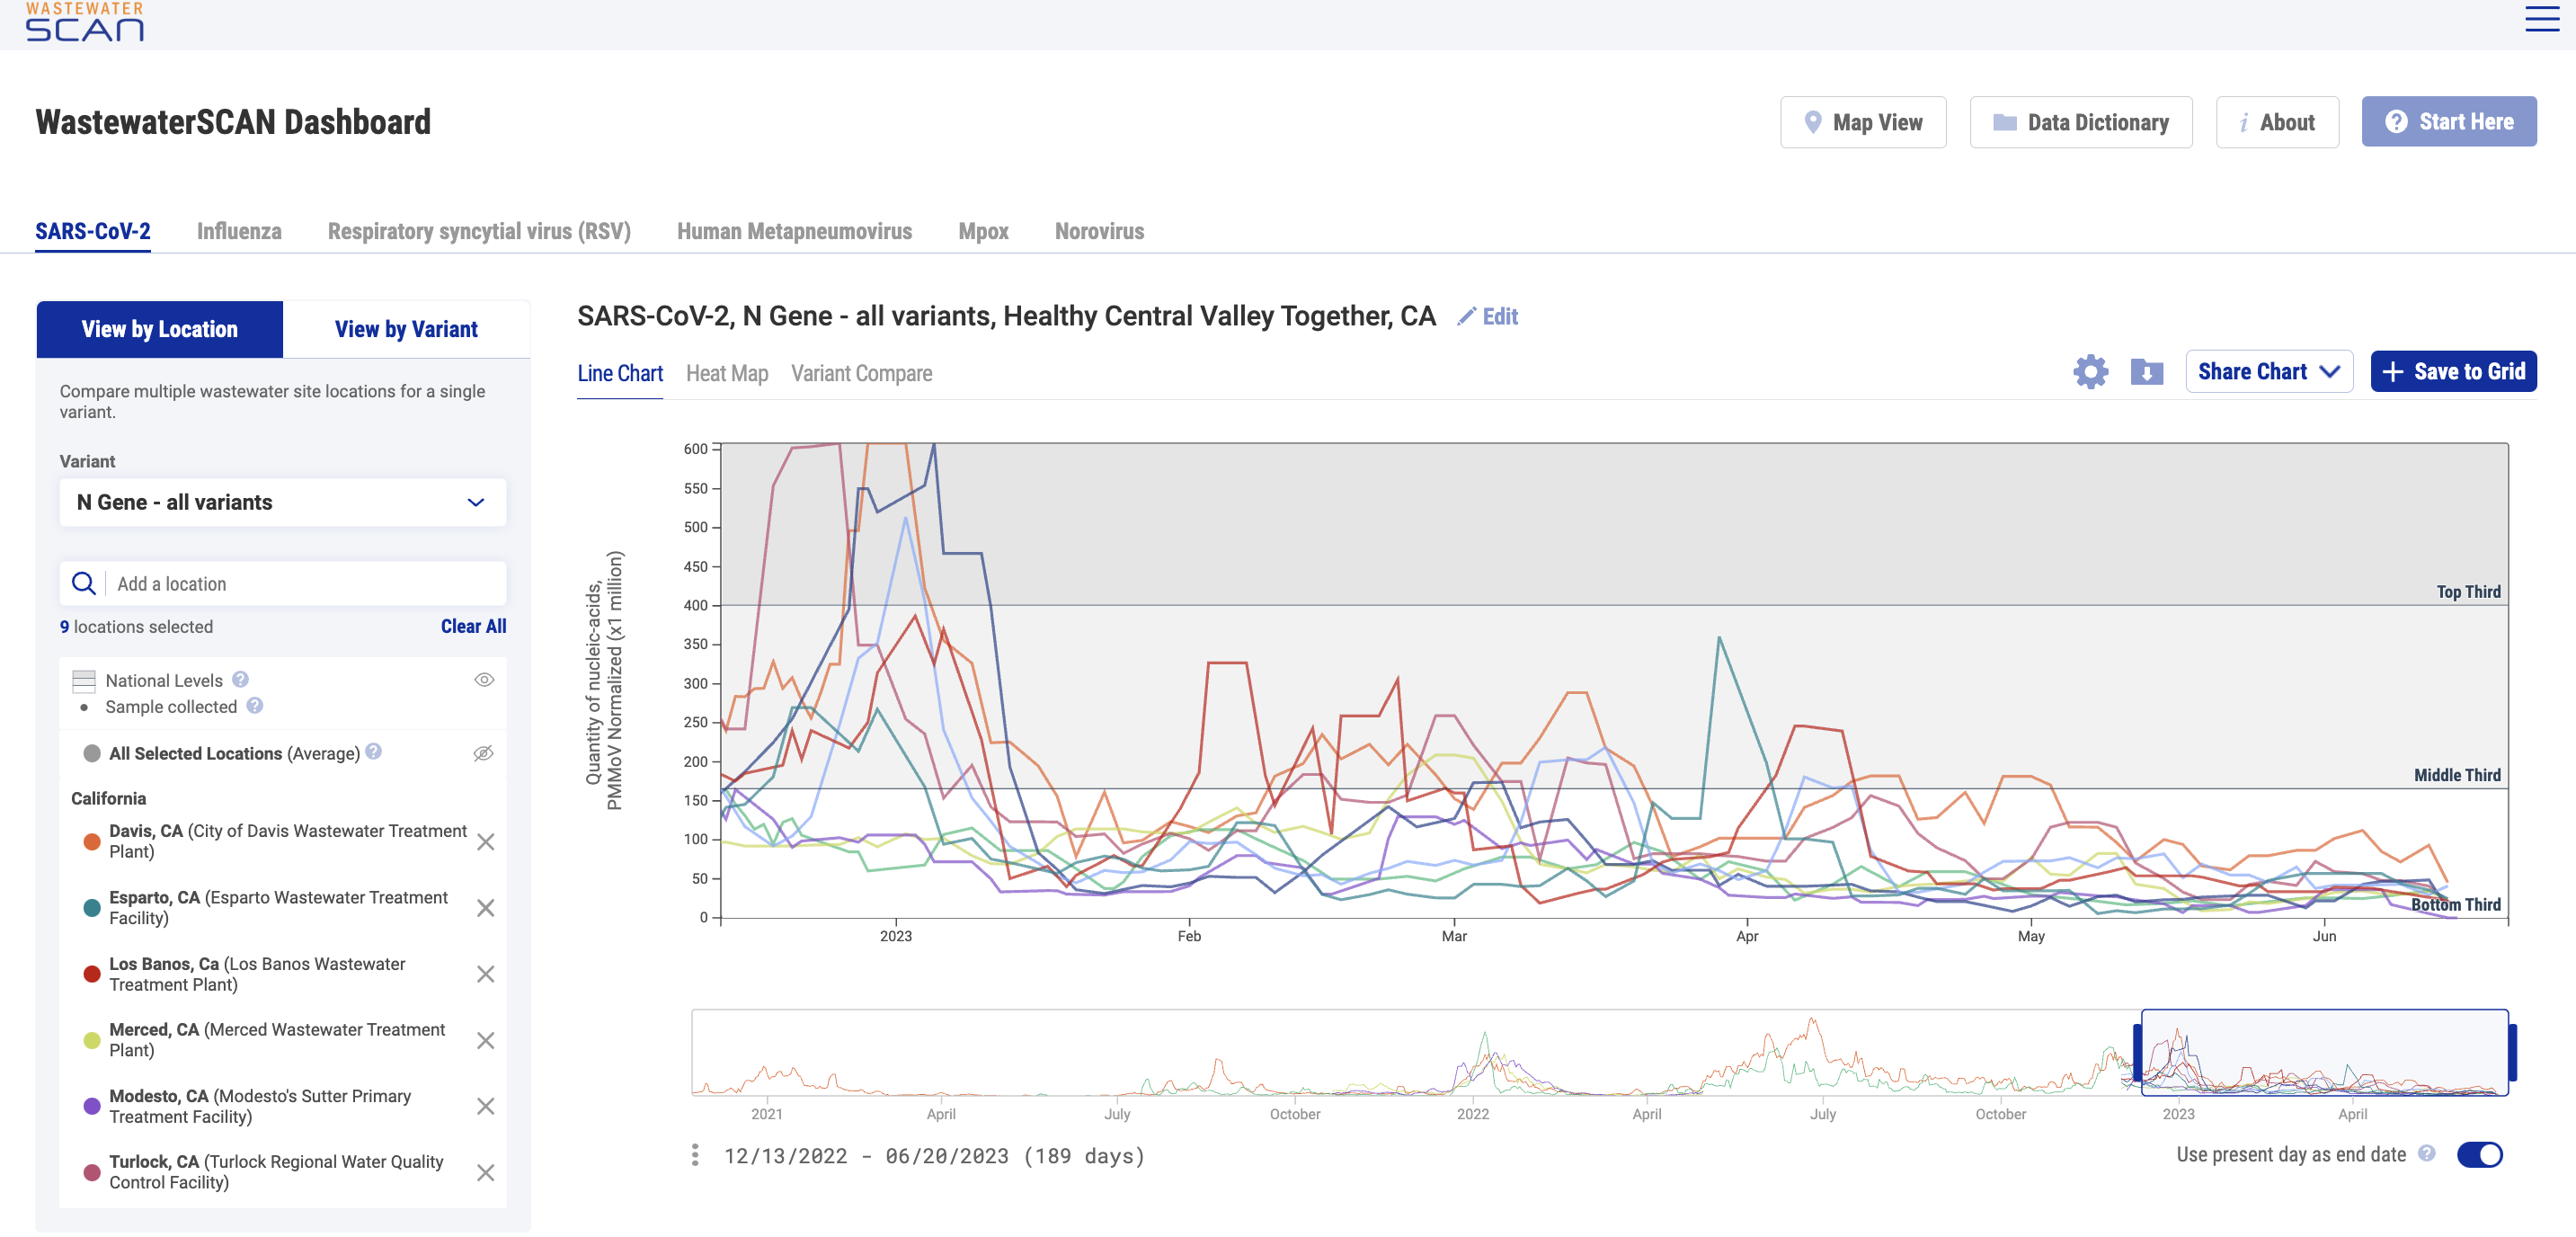
"National levels" can be added to charts to visually benchmark where concentrations fall compared to previously recorded measurements for each pathogen. The national levels are shown as groups (bottom, middle and upper) that are based on looking back at all data from the last 365 days across all WWSCAN sites. This feature can be applied across all current targets in 'Chart View'. Click the eye icon next to "National Levels" to show this feature.
- Bottom third area: represents the area where the lower third (<33rd percentile) of data points for all WWSCAN sites falls.
- Middle third area: represents the area where the middle third (33rd - 66th percentile) of data points for all WWSCAN sites falls.
- Top third area: represents the area where the upper third (>66th percentile) of data points for all WWSCAN sites falls.
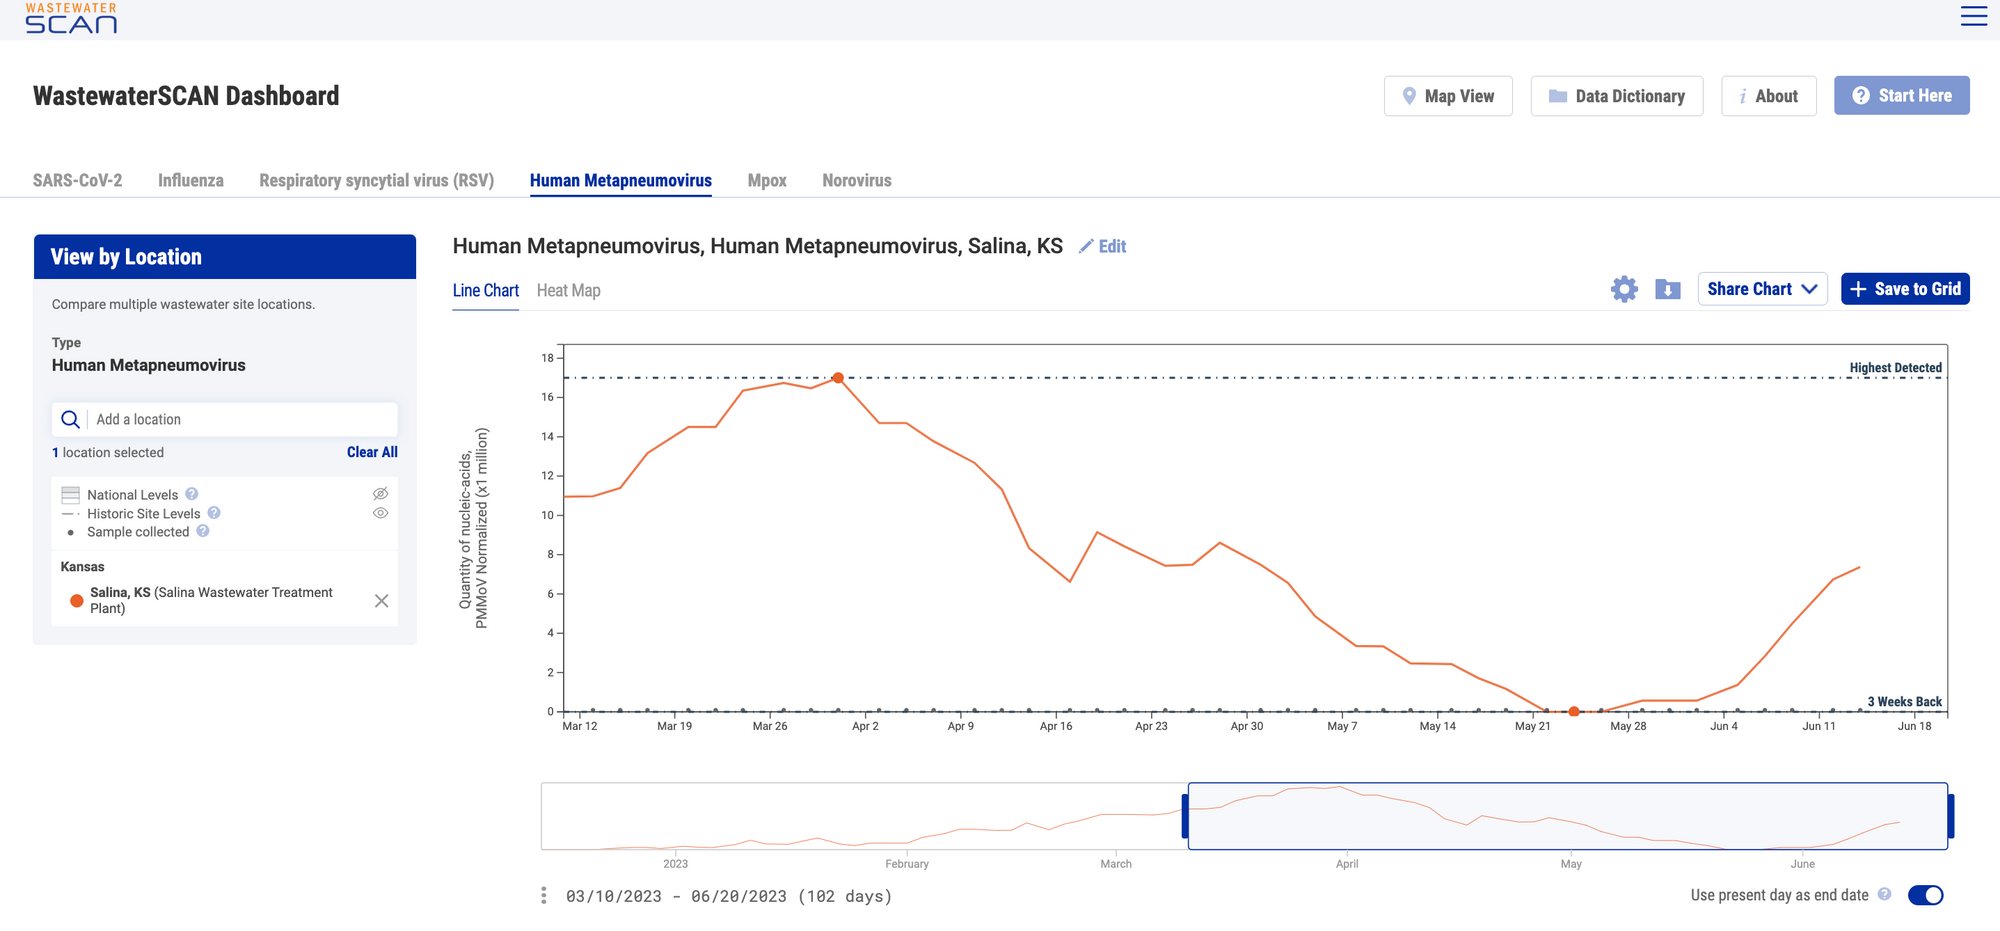
Historic Site Levels
Historic reference levels can be turned on for an individual site. The two reference lines that appear for an individual site plot when the feature is turned on are ‘3 Weeks Back’ and ‘Highest Detected,’ and the points these are based on will be highlighted. These values are based on the smoothed, trimmed average values. These lines are used to provide context as to how the most recent sample compares to where wastewater levels were 3 weeks ago and the highest levels detected as an individual sites. Click the eye icon next to "Historic Site Levels" to show this feature.
This feature can be applied for all current targets in 'Chart View'.
At this month's Stakeholder meeting we reviewed these two new site features in addition to some tips and tricks for navigating the site both in mobile and desktop. If you weren't able to attend the meeting or want a refresher, you can view the recording here.
Infectious Disease Target Review
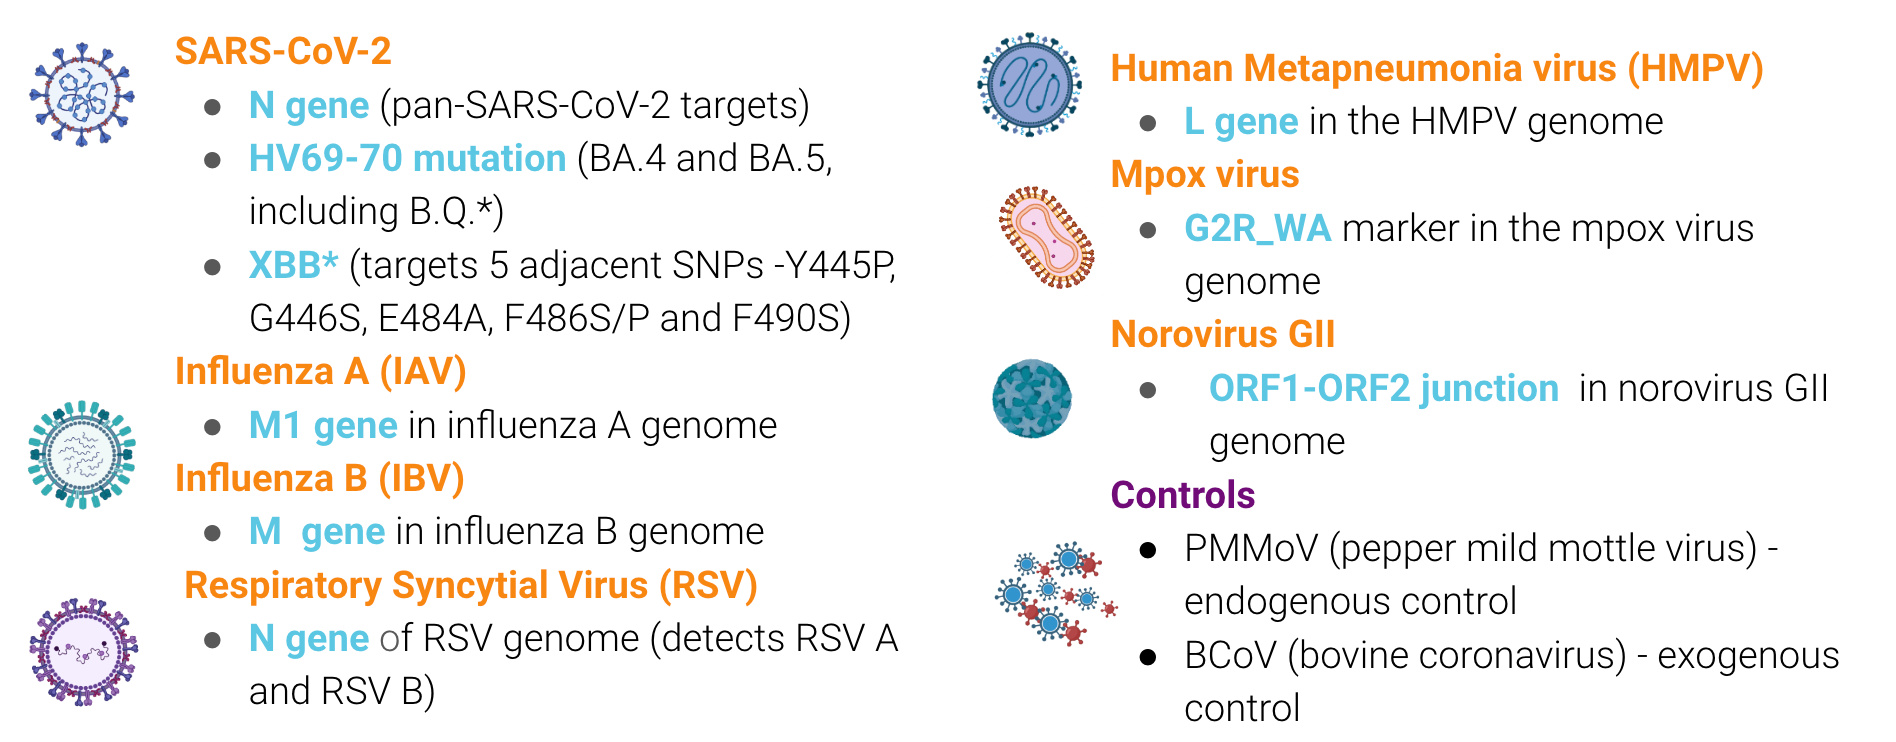
Currently monitoring SARS-CoV-2, IAV, IBV, RSV, HMPV, Norovirus GII, & Mpox
The methods for our assays are in the public domain. You can access them using these QR codes:

Respiratory Targets
SARS-CoV-2, Influenza A & B, Respiratory Syncytial Virus, & Human metapneumovirus
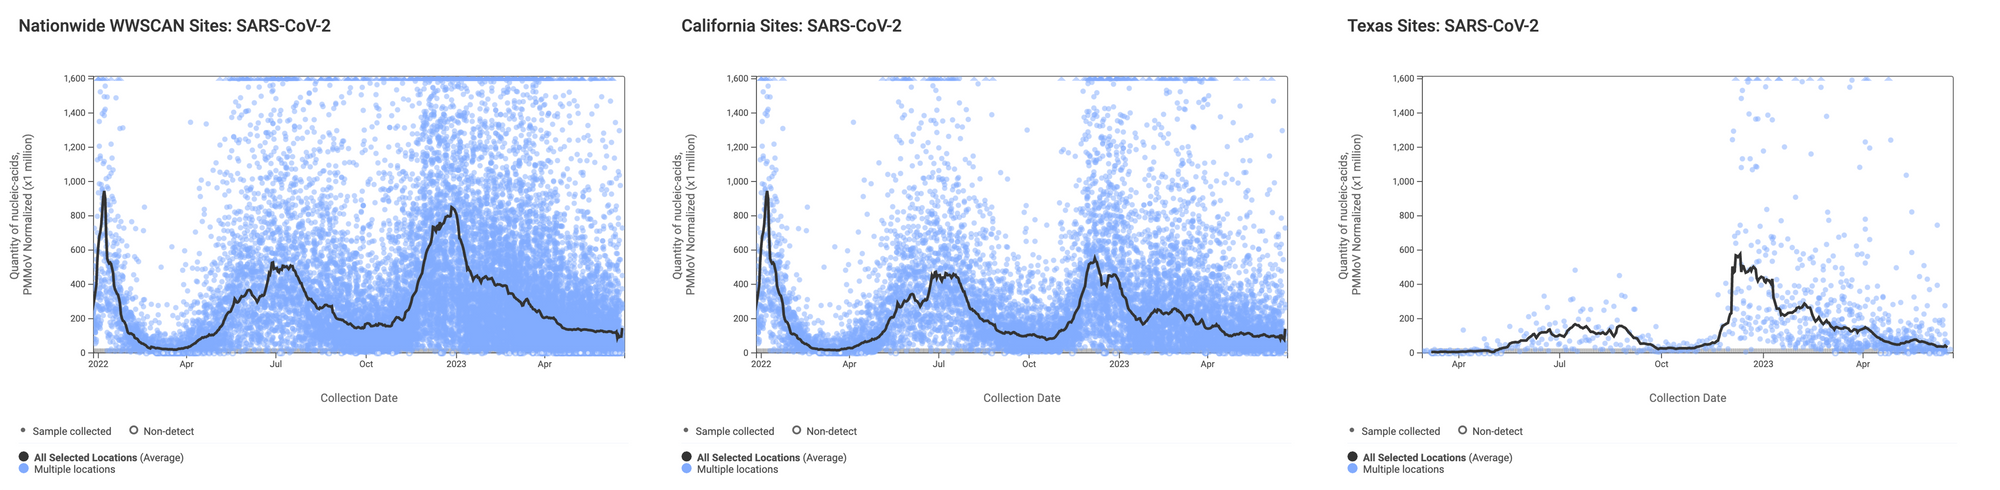
SARS-CoV-2 N gene RNA concentrations (normalized by PMMoV) are continuing to decrease overall. The median concentration across all sites over the last 21 days is 36,607 copies/gram. Below are the SARS-CoV-2 N gene concentrations (normalized by PMMoV) from all participating WWSCAN sites across the country (left panel), those in California (middle panel), and those in Texas (right panel). Evident in the data are relatively high concentrations around the start of the year with lower levels presently observed.
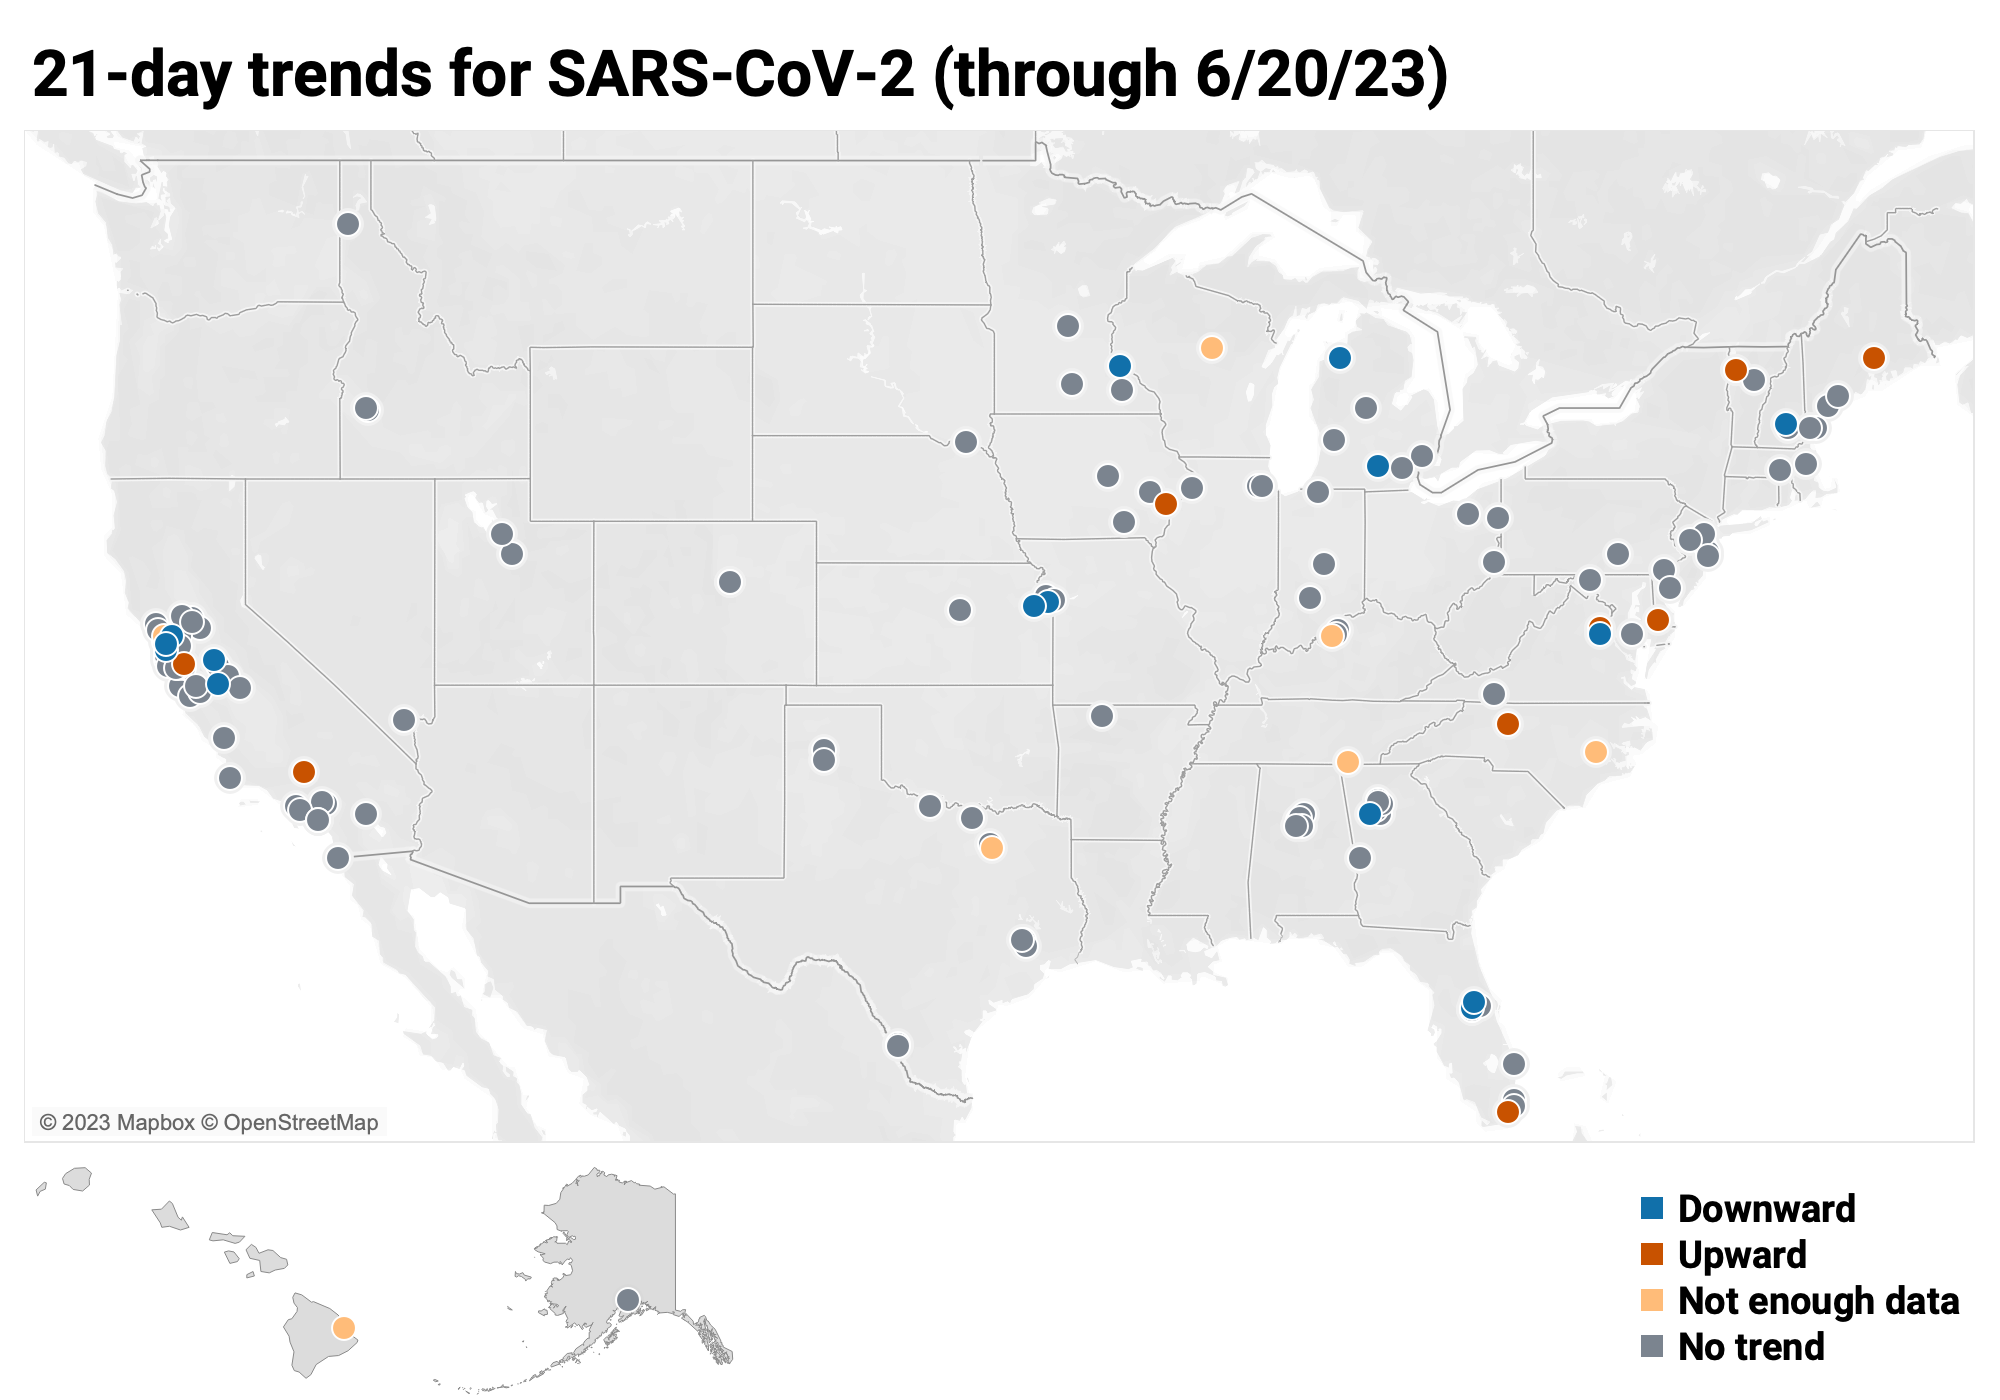
Below is the trend analysis for the SARS-CoV-2 RNA concentrations (N gene concentrations normalized by PMMoV) in wastewater solids at all participating plants. Red indicates a significant upward trend, blue is a significant downward trend, and dark grey is no trend. Yellow indicates that there were not enough data points to calculate a trend (we required 3 points over the last 21 days). You can read about our methods for trend analysis here. In short, we test for linear trends between log10-transformed concentration (target/PMMoV) and time; the trend must be classified as statistically significant (p<0.1). Of the 162 sites, 9 show an upward trend, 131 show no trend, and 15 show a decreasing trend. The remaining 7 sites (Chattanooga TN, Hilo HI, Kinston NC, Louisville KY, Petaluma CA, Sunnyvale TX, and Wausau WI) do not have enough data to calculate a trend.
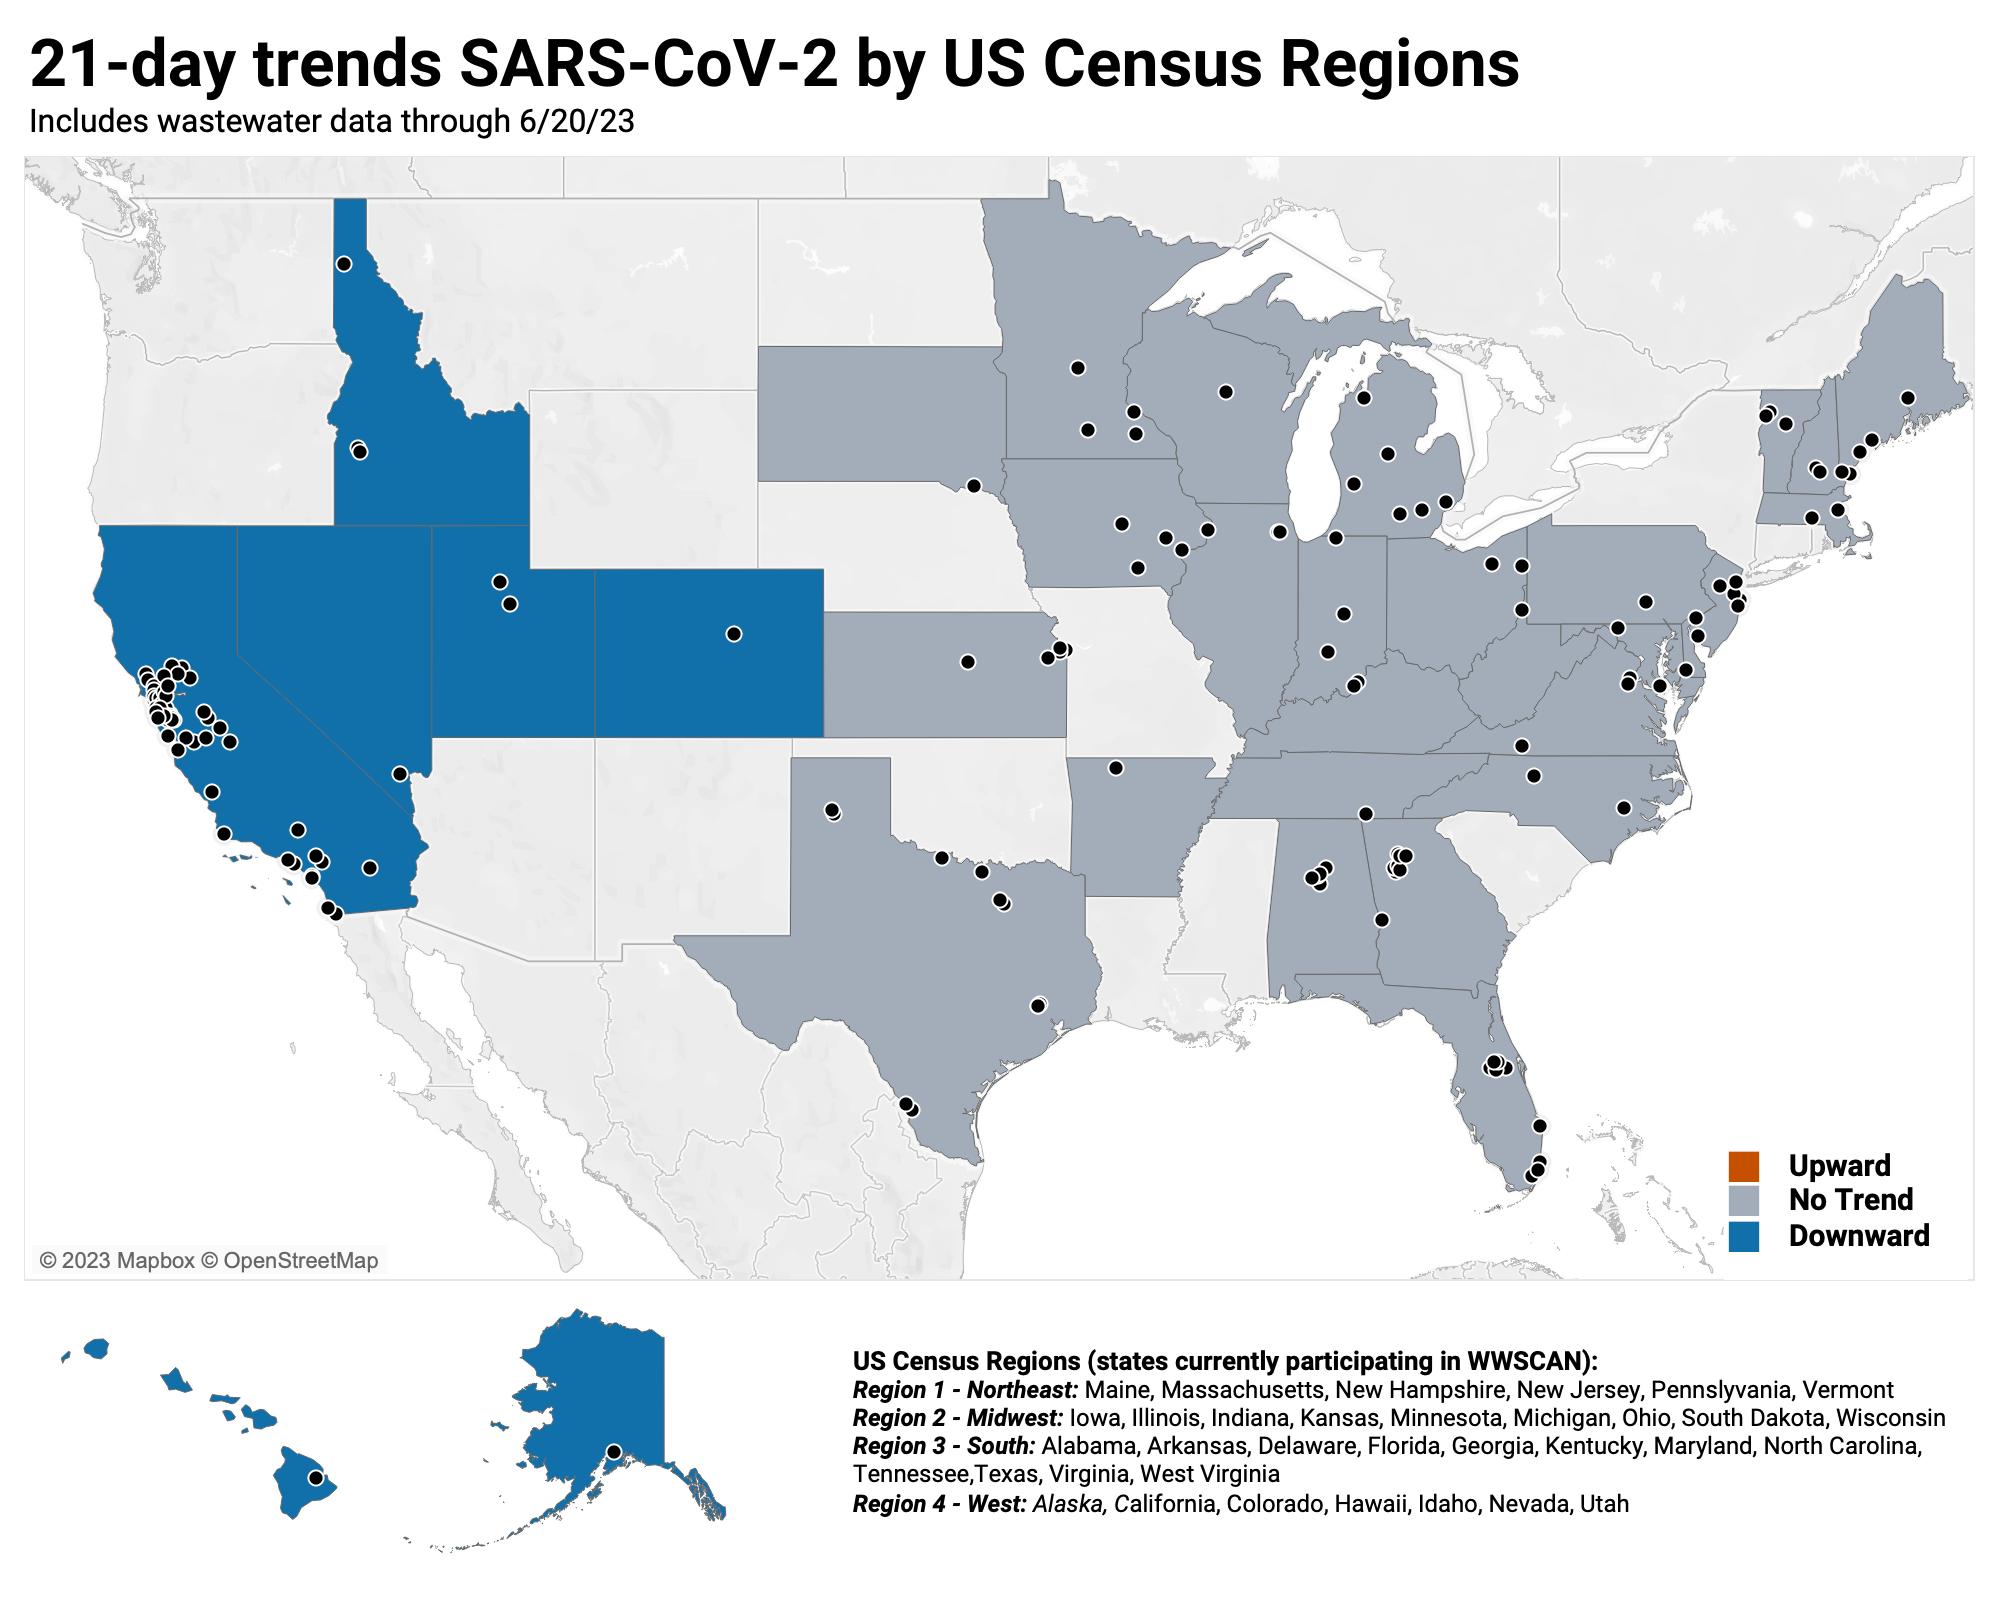
When we look at the 21-day trends at the US Census Region level, no regions show an upward trend, the Midwest, Northeast and South regions show no trend, and the West show decreasing trends.
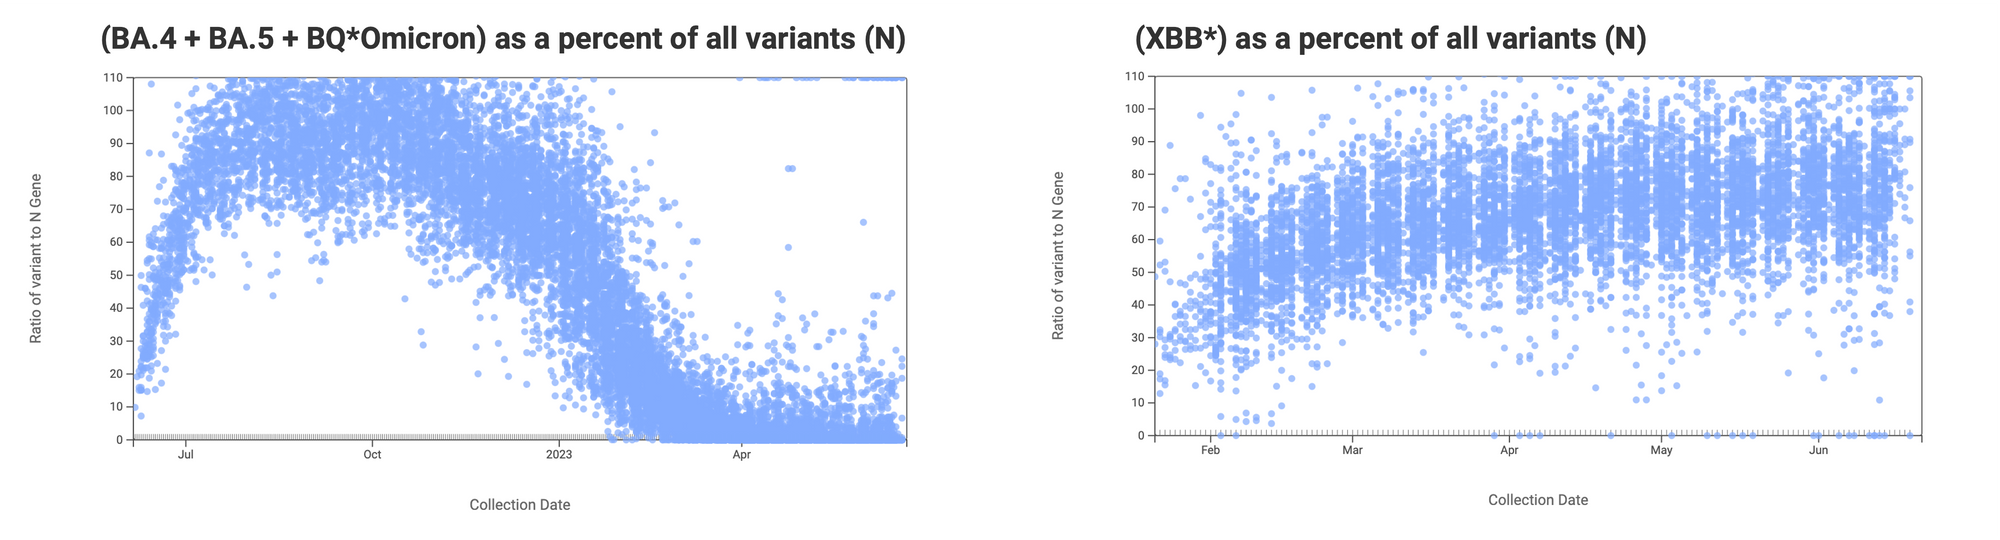
The ratio of the XBB* mutations/N across all WWSCAN plants is shown in the chart below on the right. As the ratio reaches 100%, it suggests that all the SARS-CoV-2 genomes in wastewater have the XBB* mutations. These data indicate that the average ratio XBB* mutations/N is ~75% but some places show levels as high as 80-100%. This suggests the majority of infections across the communities are caused by XBB*. The chart on the left shows the ratio of the BA.5, BA.4, and BQ* mutation/N across all WWSCAN plants. It can be read the same way as the XBB* chart. The average ratio is about <10%. Note that our XBB* assay will also detect XBB.1.16, XBB.1.9, and FD.2 (XBB.1.5.15.2*).
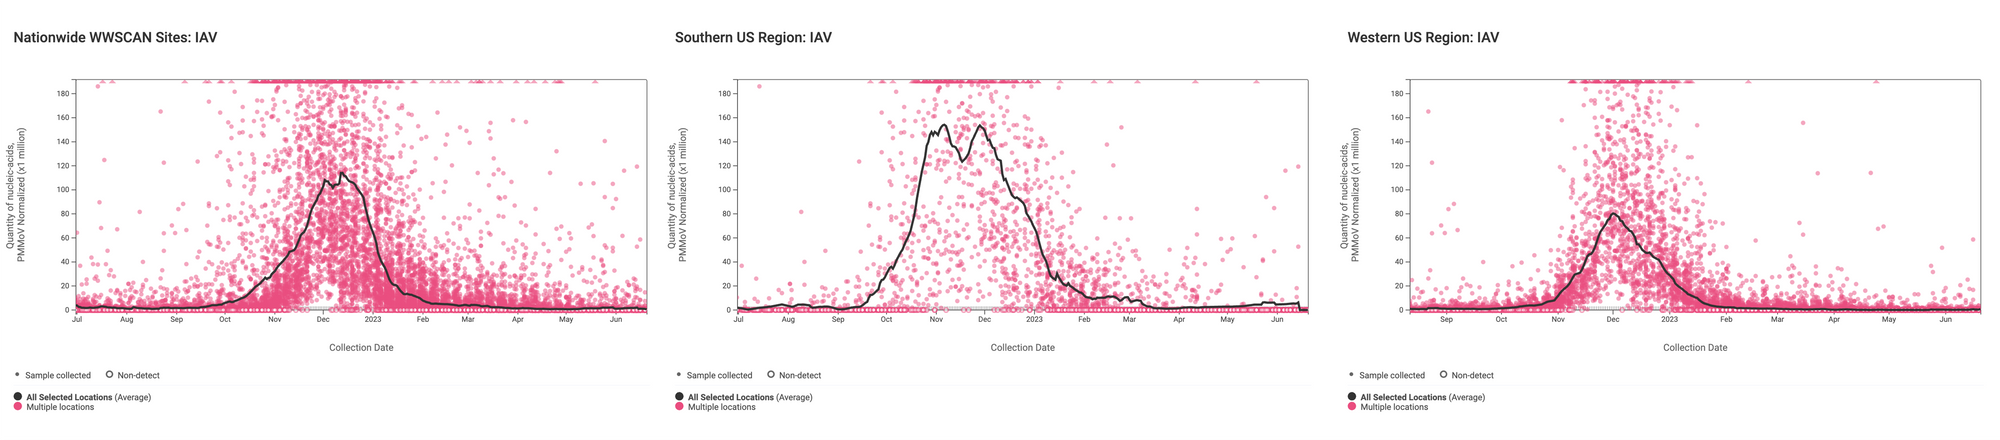
Influenza A (IAV) RNA concentrations (normalized by PMMoV) are very low signaling the end of influenza season. The median concentration across all sites over the last 21 days is 0 copies/gram (non-detect). Examples below are from all participating sites across the nation (left panel), Southern US Census Region, and Western US Censure Region (right panel).
Below is the trend analysis for the IAV RNA concentrations (normalized by PMMoV) in wastewater solids at all participating plants. Red indicates a significant upward trend, blue is a significant downward trend, and dark grey is no trend. Yellow indicates that there were not enough data points to calculate a trend. Of the 162 sites, 0 shows an upward trend, 155 show no trend, and 0 show a decreasing trend. The remaining 7 sites (Chattanooga TN, Hilo HI, Kinston NC, Louisville KY, Petaluma CA, Sunnyvale TX, and Wausau WI) do not have enough data to calculate a trend.

When we look at the 21-day trends at the US Census Region level, the Midwest, Northeast, South and West show no trend.

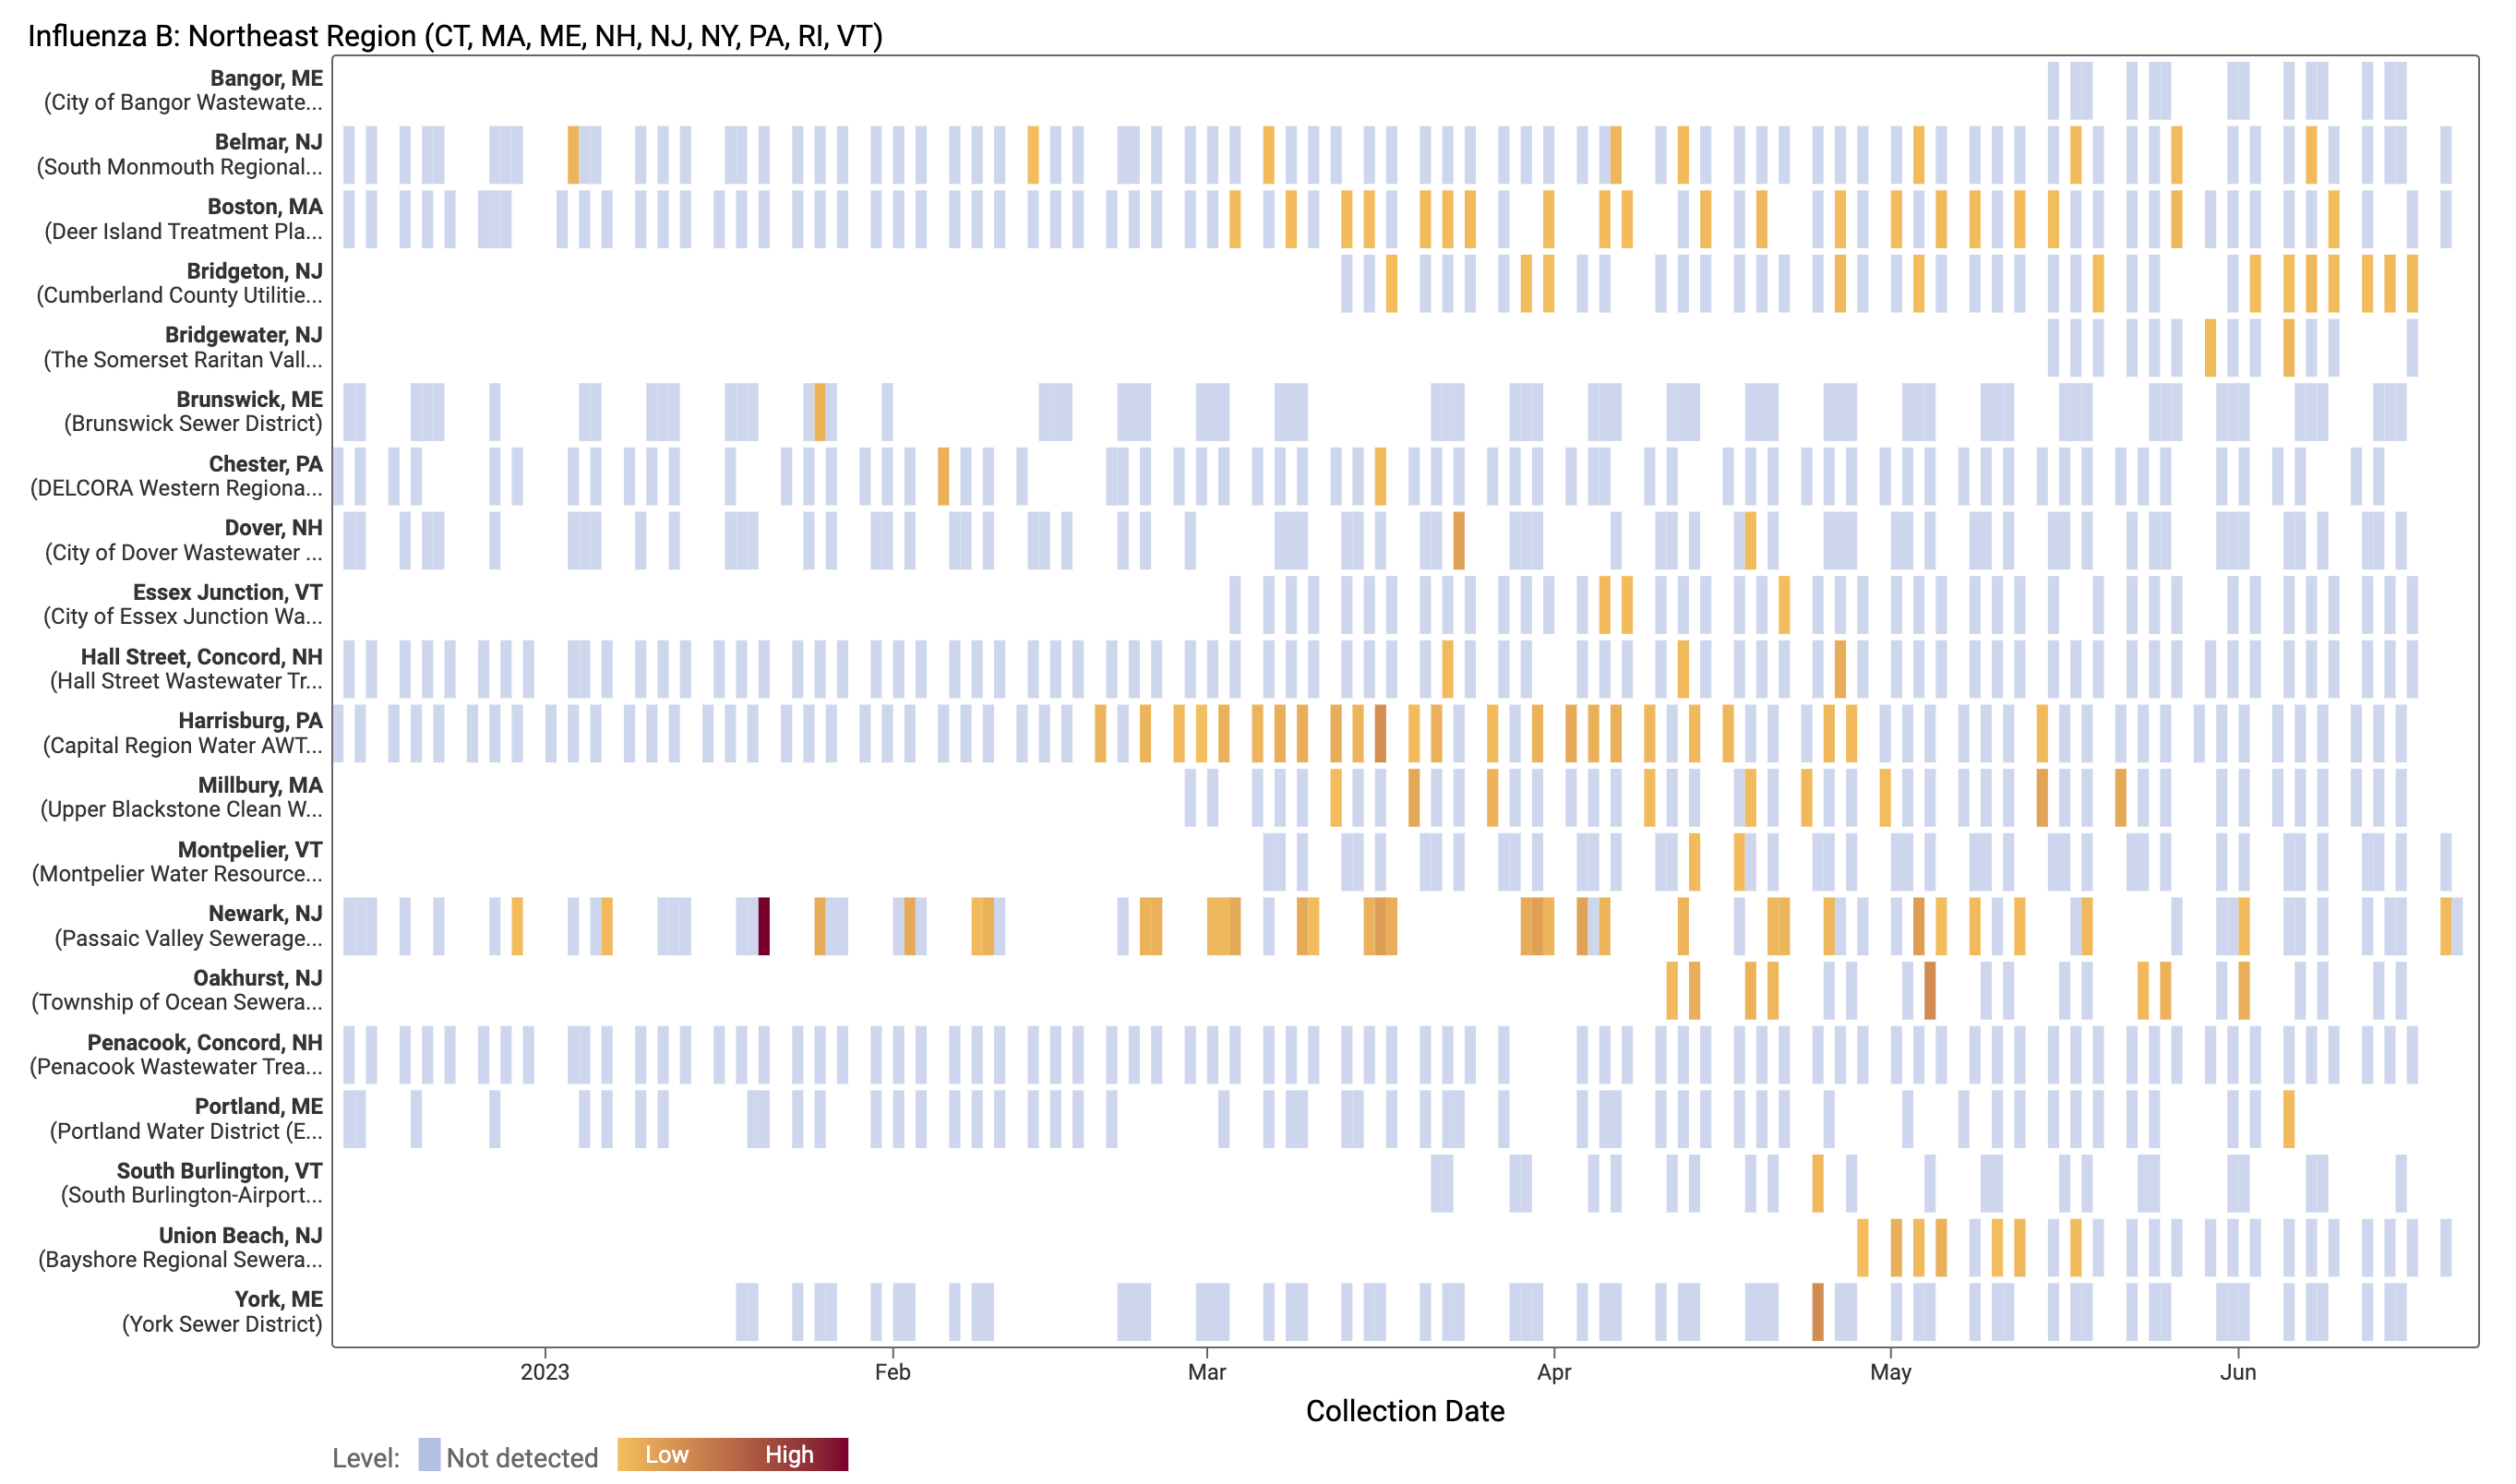
Influenza B (IBV) RNA concentrations are mostly non-detect at WWSCAN sites. There have only been 178 positive samples out of 1,316 samples during the past 21 days (~14% detection rate), all at low concentrations. Below is a heat map showing IBV detections at all the plants in WWSCAN in the Northeast USA. Each location is a row, and the date is a column. White indicates no sample, blue indicates non-detect, and the orange to red show variable concentrations if IBV. You can see how IBV RNA is occasionally detected since we began measuring it in mid December 2022 at these sites.
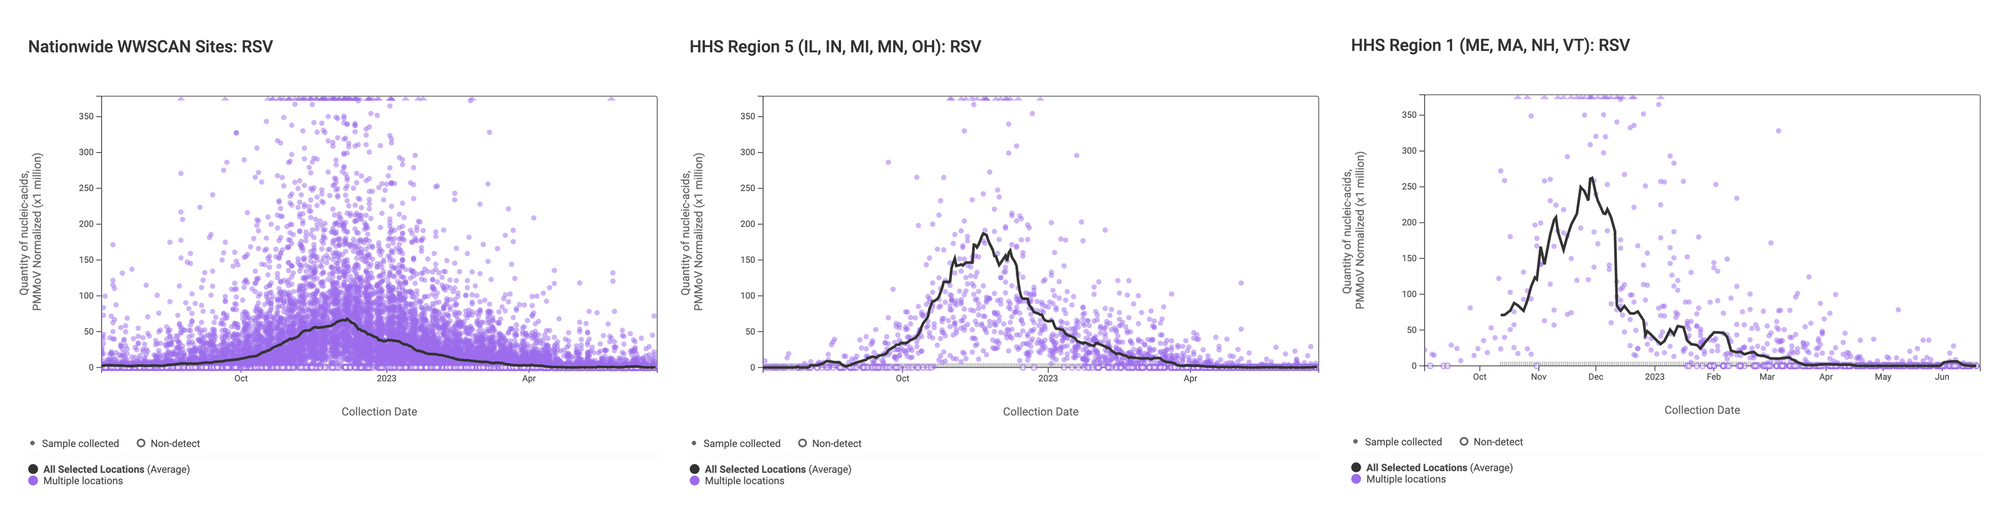
RSV RNA concentrations are low signaling the end of RSV season. The median concentration across all sites over the last 21 days is 0 copies/gram. Example charts below are from all participating sites across the country (left panel), sites in HHS Region 5 - IL, IN, MI, MN, OH, WI (middle panel), and sites in HHS Region 1 -ME, MA, NH, VT (right panel).
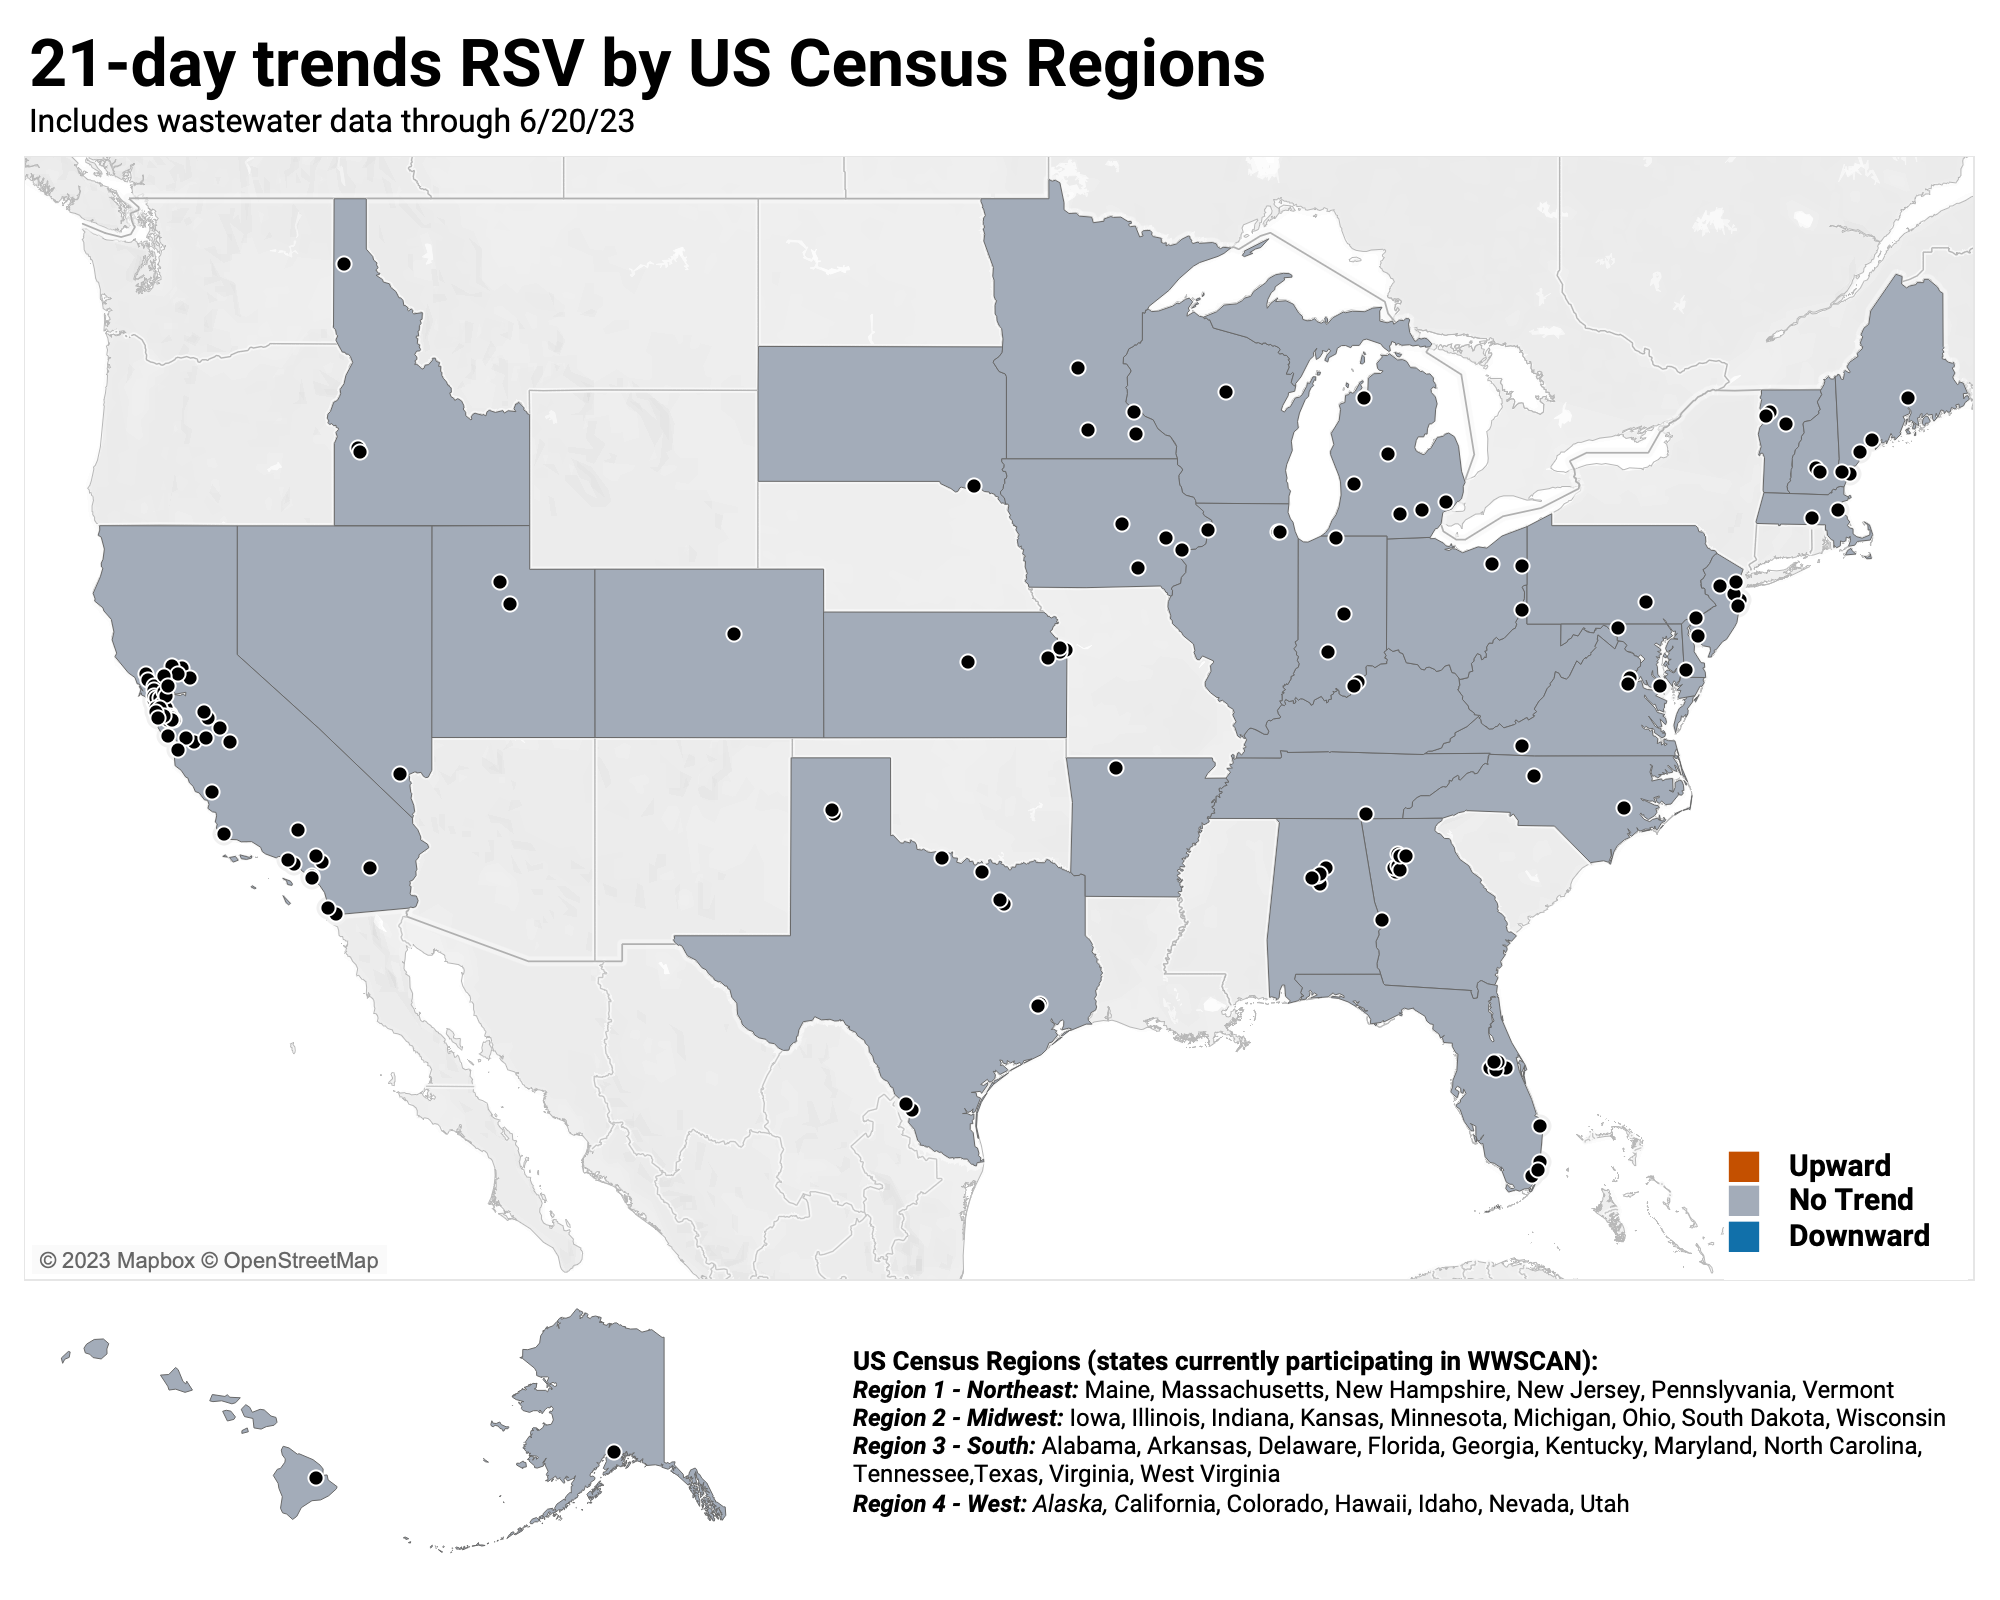
Below is the trend analysis for the RSV RNA concentrations (normalized by PMMoV) in wastewater solids at all participating plants. Red indicates a significant upward trend, blue is a significant downward trend, and dark grey is no trend. Yellow indicates that there were not enough data points to calculate a trend. Of the 162 sites, 0 shows an upward trend, 155 show no trend, and 0 show a decreasing trend. The remaining 7 sites (Chattanooga TN, Hilo HI, Kinston NC, Louisville KY, Petaluma CA, Sunnyvale TX, and Wausau WI) do not have enough data to calculate a trend.
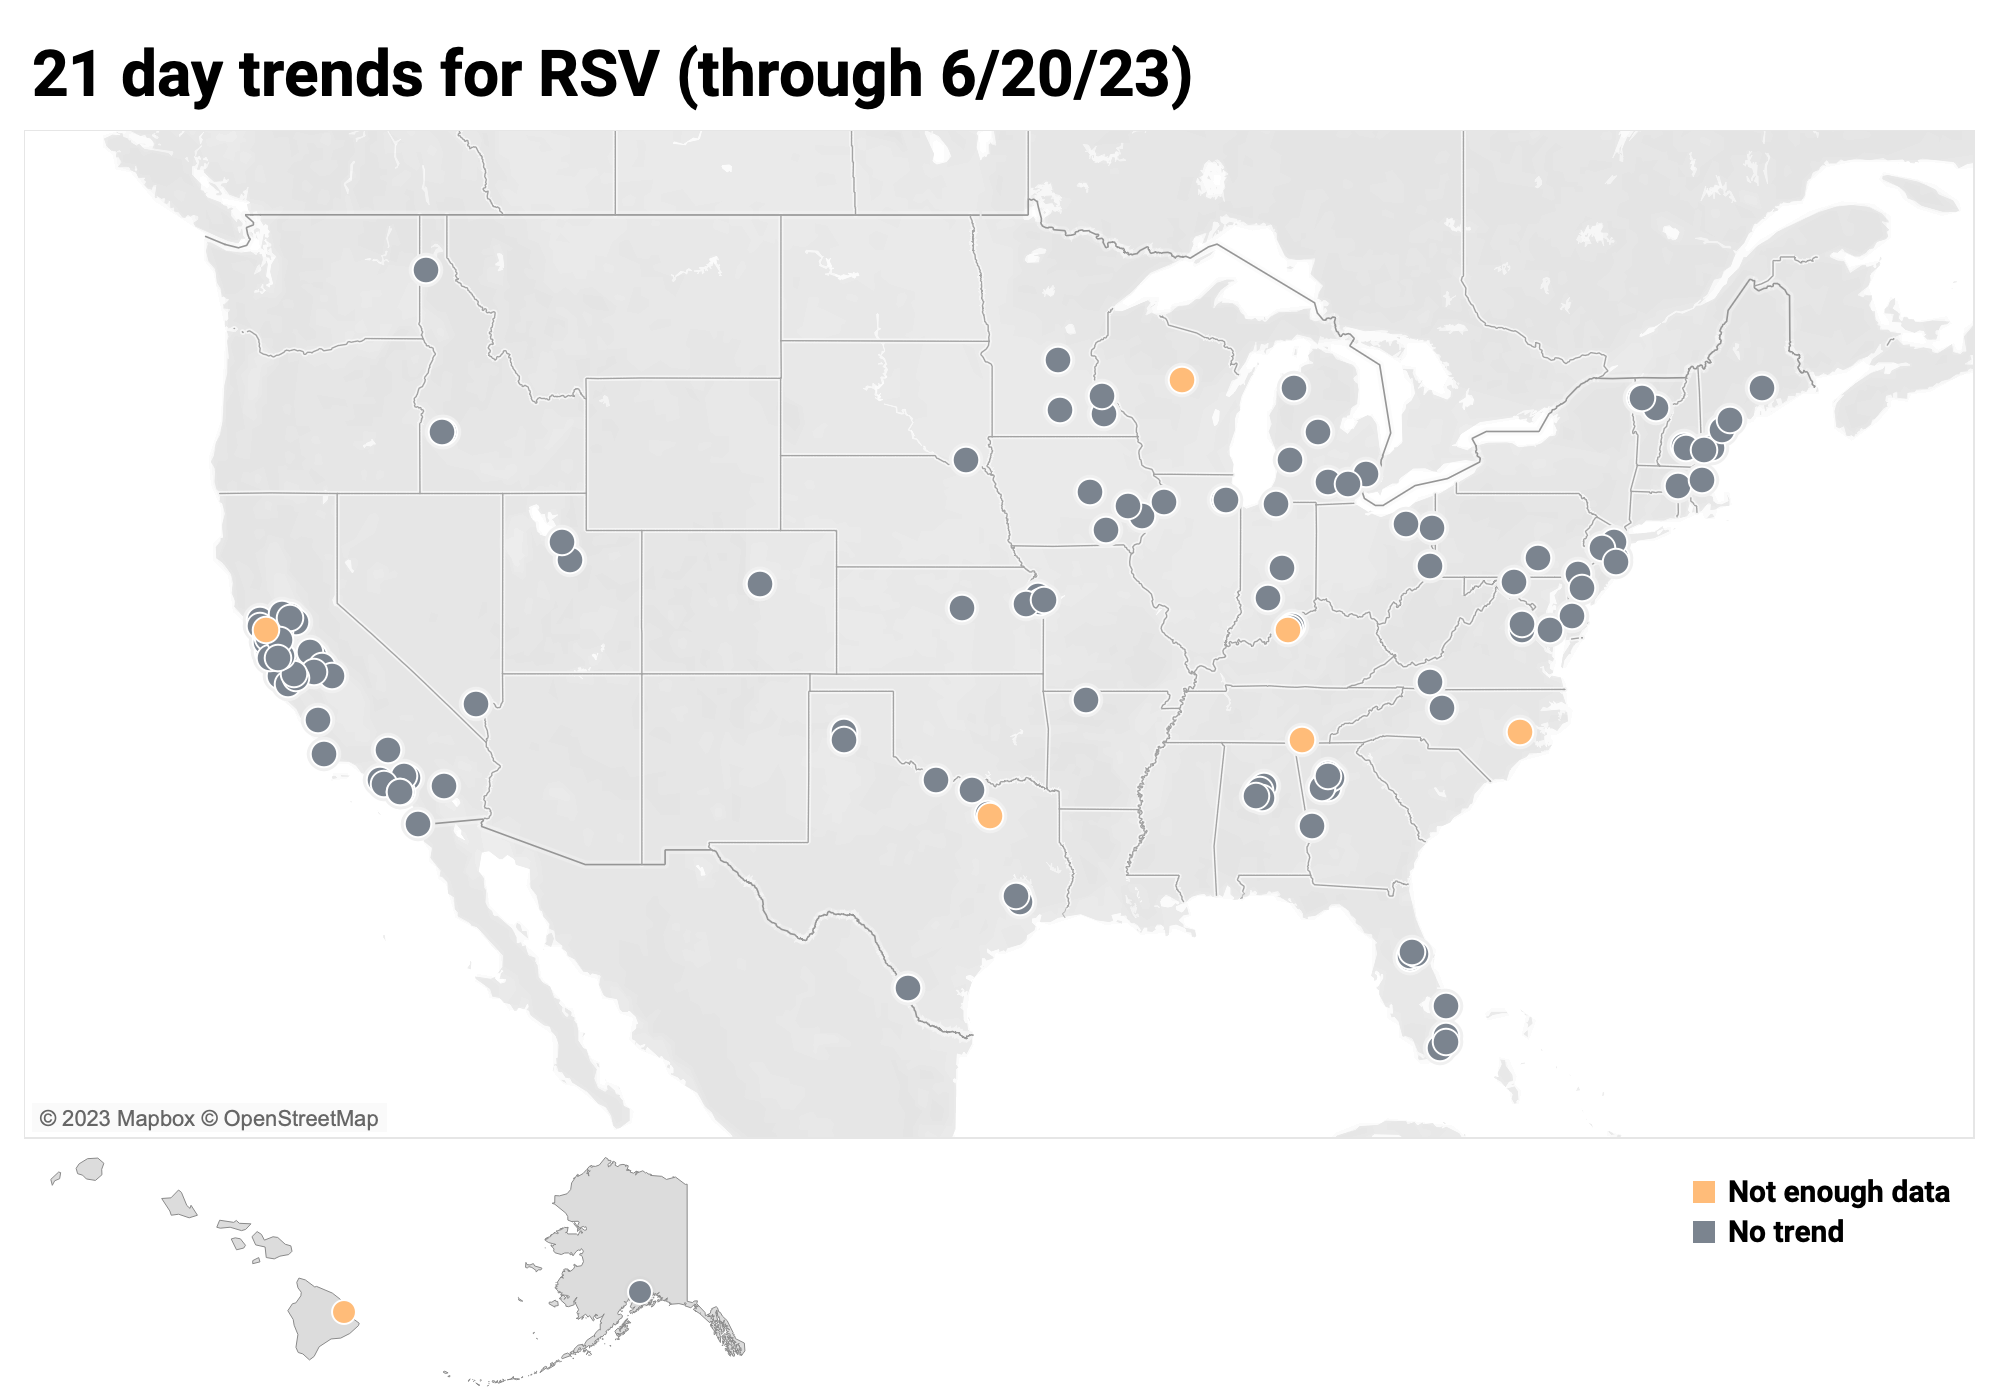
When we look at the 21-day trends at the US Census Region level, the Midwest, Northeast, South and West show no trend.
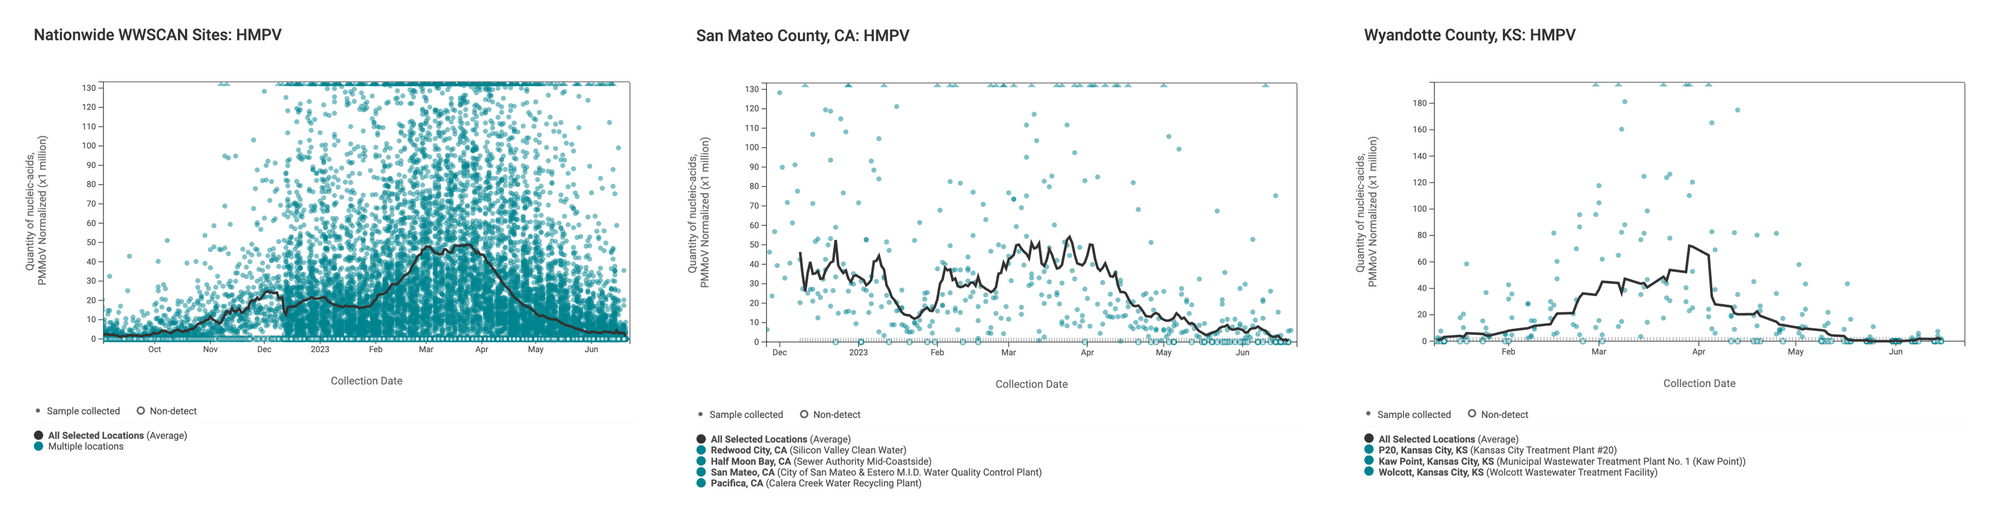
HMPV (Human metapneumovirus) RNA is detected at WWSCAN sites, unlike RSV and Influenza A RNA, but at much lower levels than earlier this year. The median concentration across all sites over the last 21 days is 0 copies/gram, which is about twice our lower limit of detection. Examples below show HMPV RNA at participating sites across the country (left panel), San Mateo County, CA (middle panel), and Wyandotte County, KS (right panel). The weighted average lines in these plots appear to beA trending down.
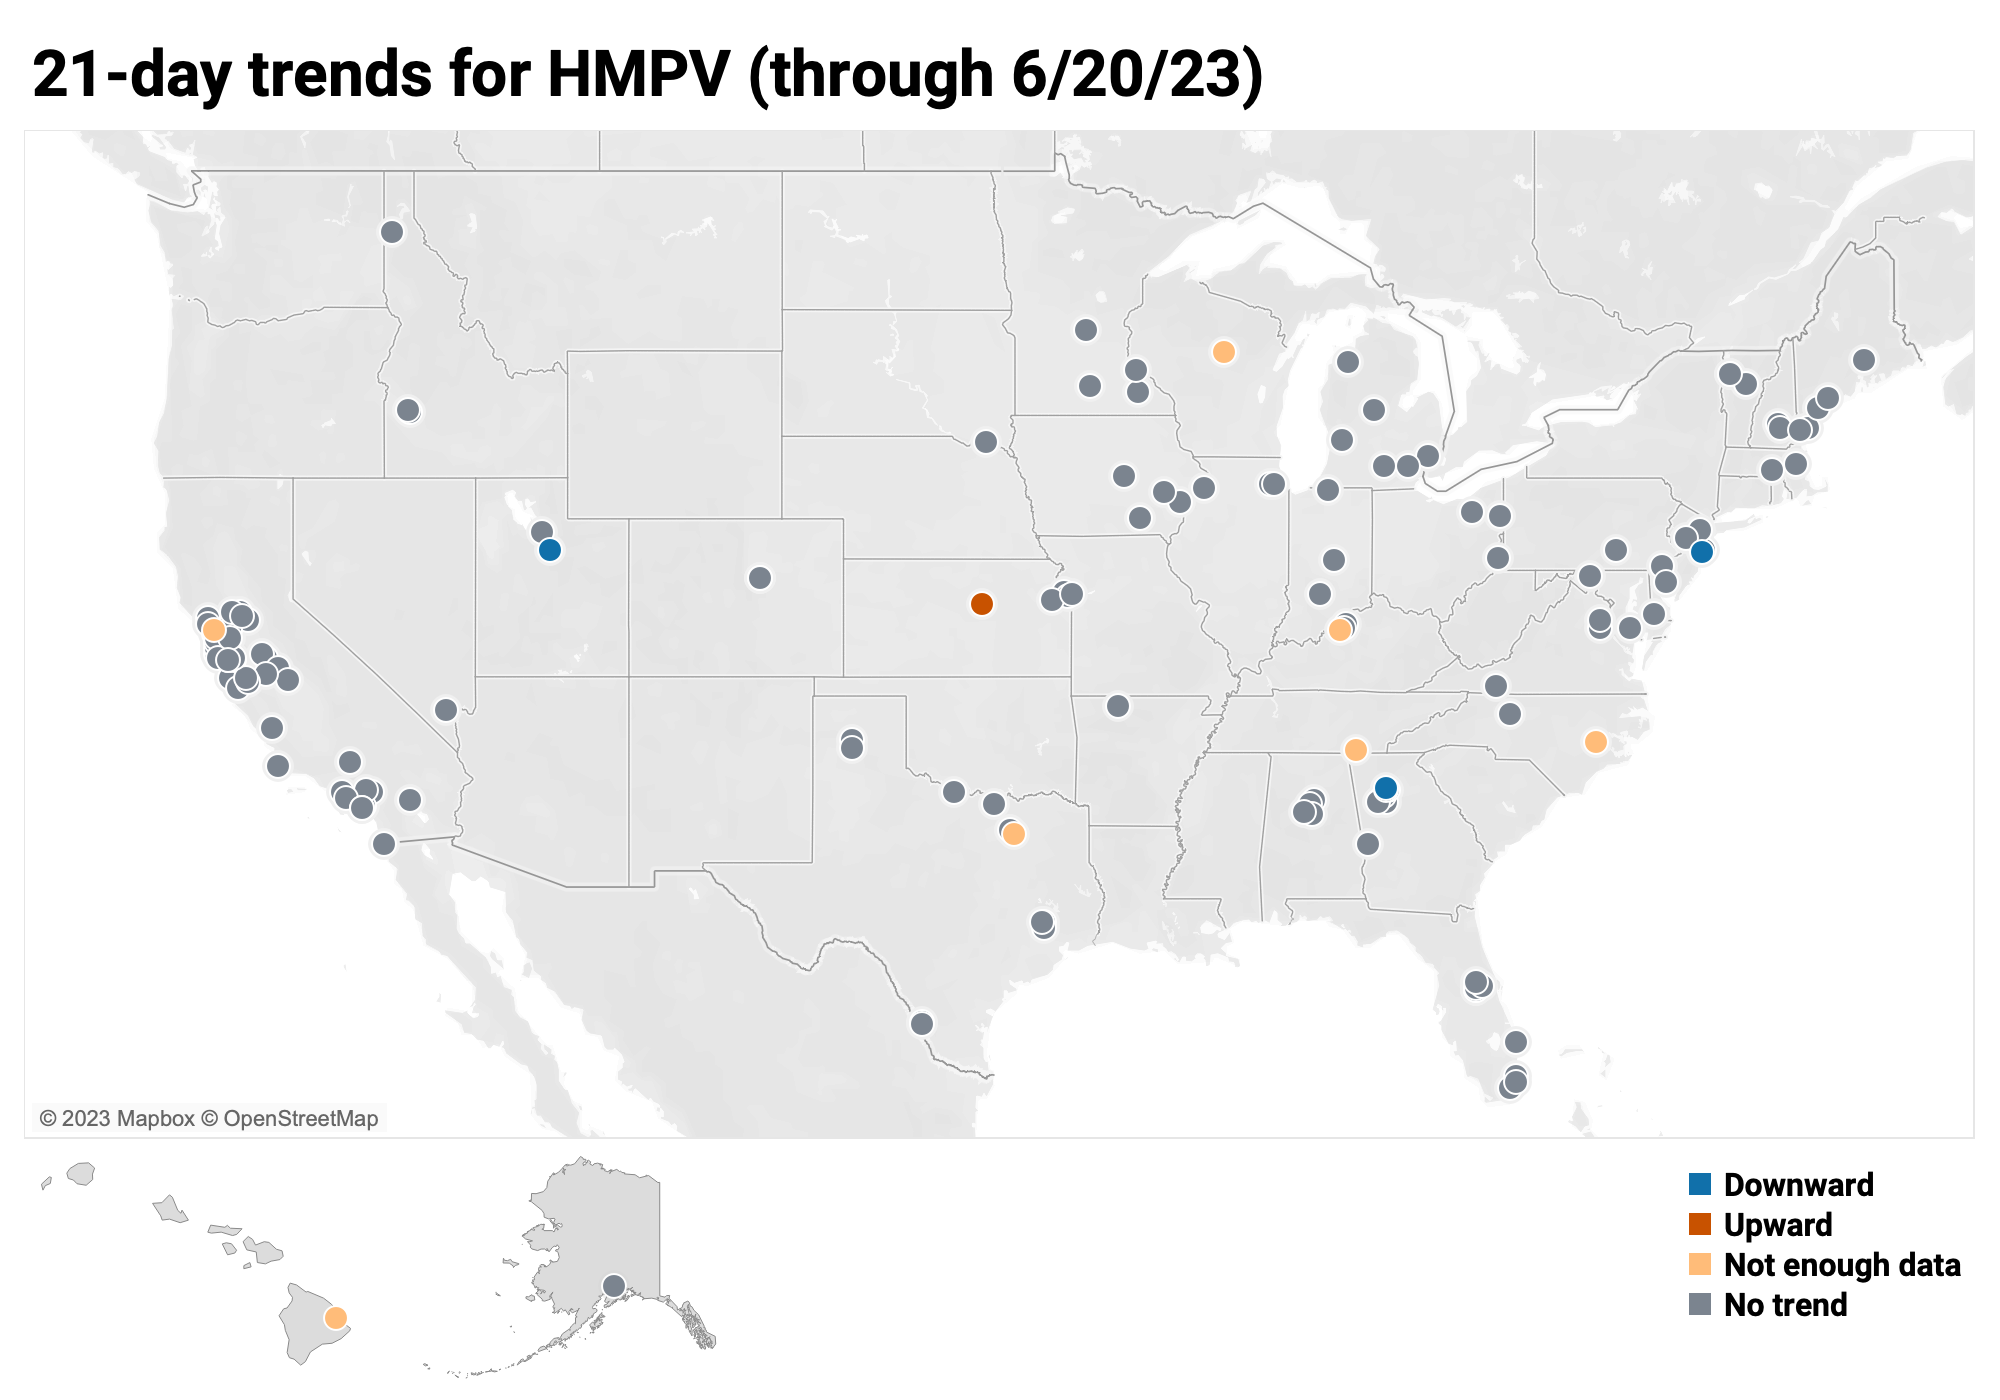
Below is the trend analysis for the RSV RNA concentrations (normalized by PMMoV) in wastewater solids at all participating plants. Red indicates a significant upward trend, blue is a significant downward trend, and dark grey is no trend. Yellow indicates that there were not enough data points to calculate a trend. Of the 162 sites, 1 shows an upward trend, 151 show no trend, and 3 show a decreasing trend. The remaining 7 sites (Chattanooga TN, Hilo HI, Kinston NC, Louisville KY, Petaluma CA, Sunnyvale TX, and Wausau WI) do not have enough data to calculate a trend.
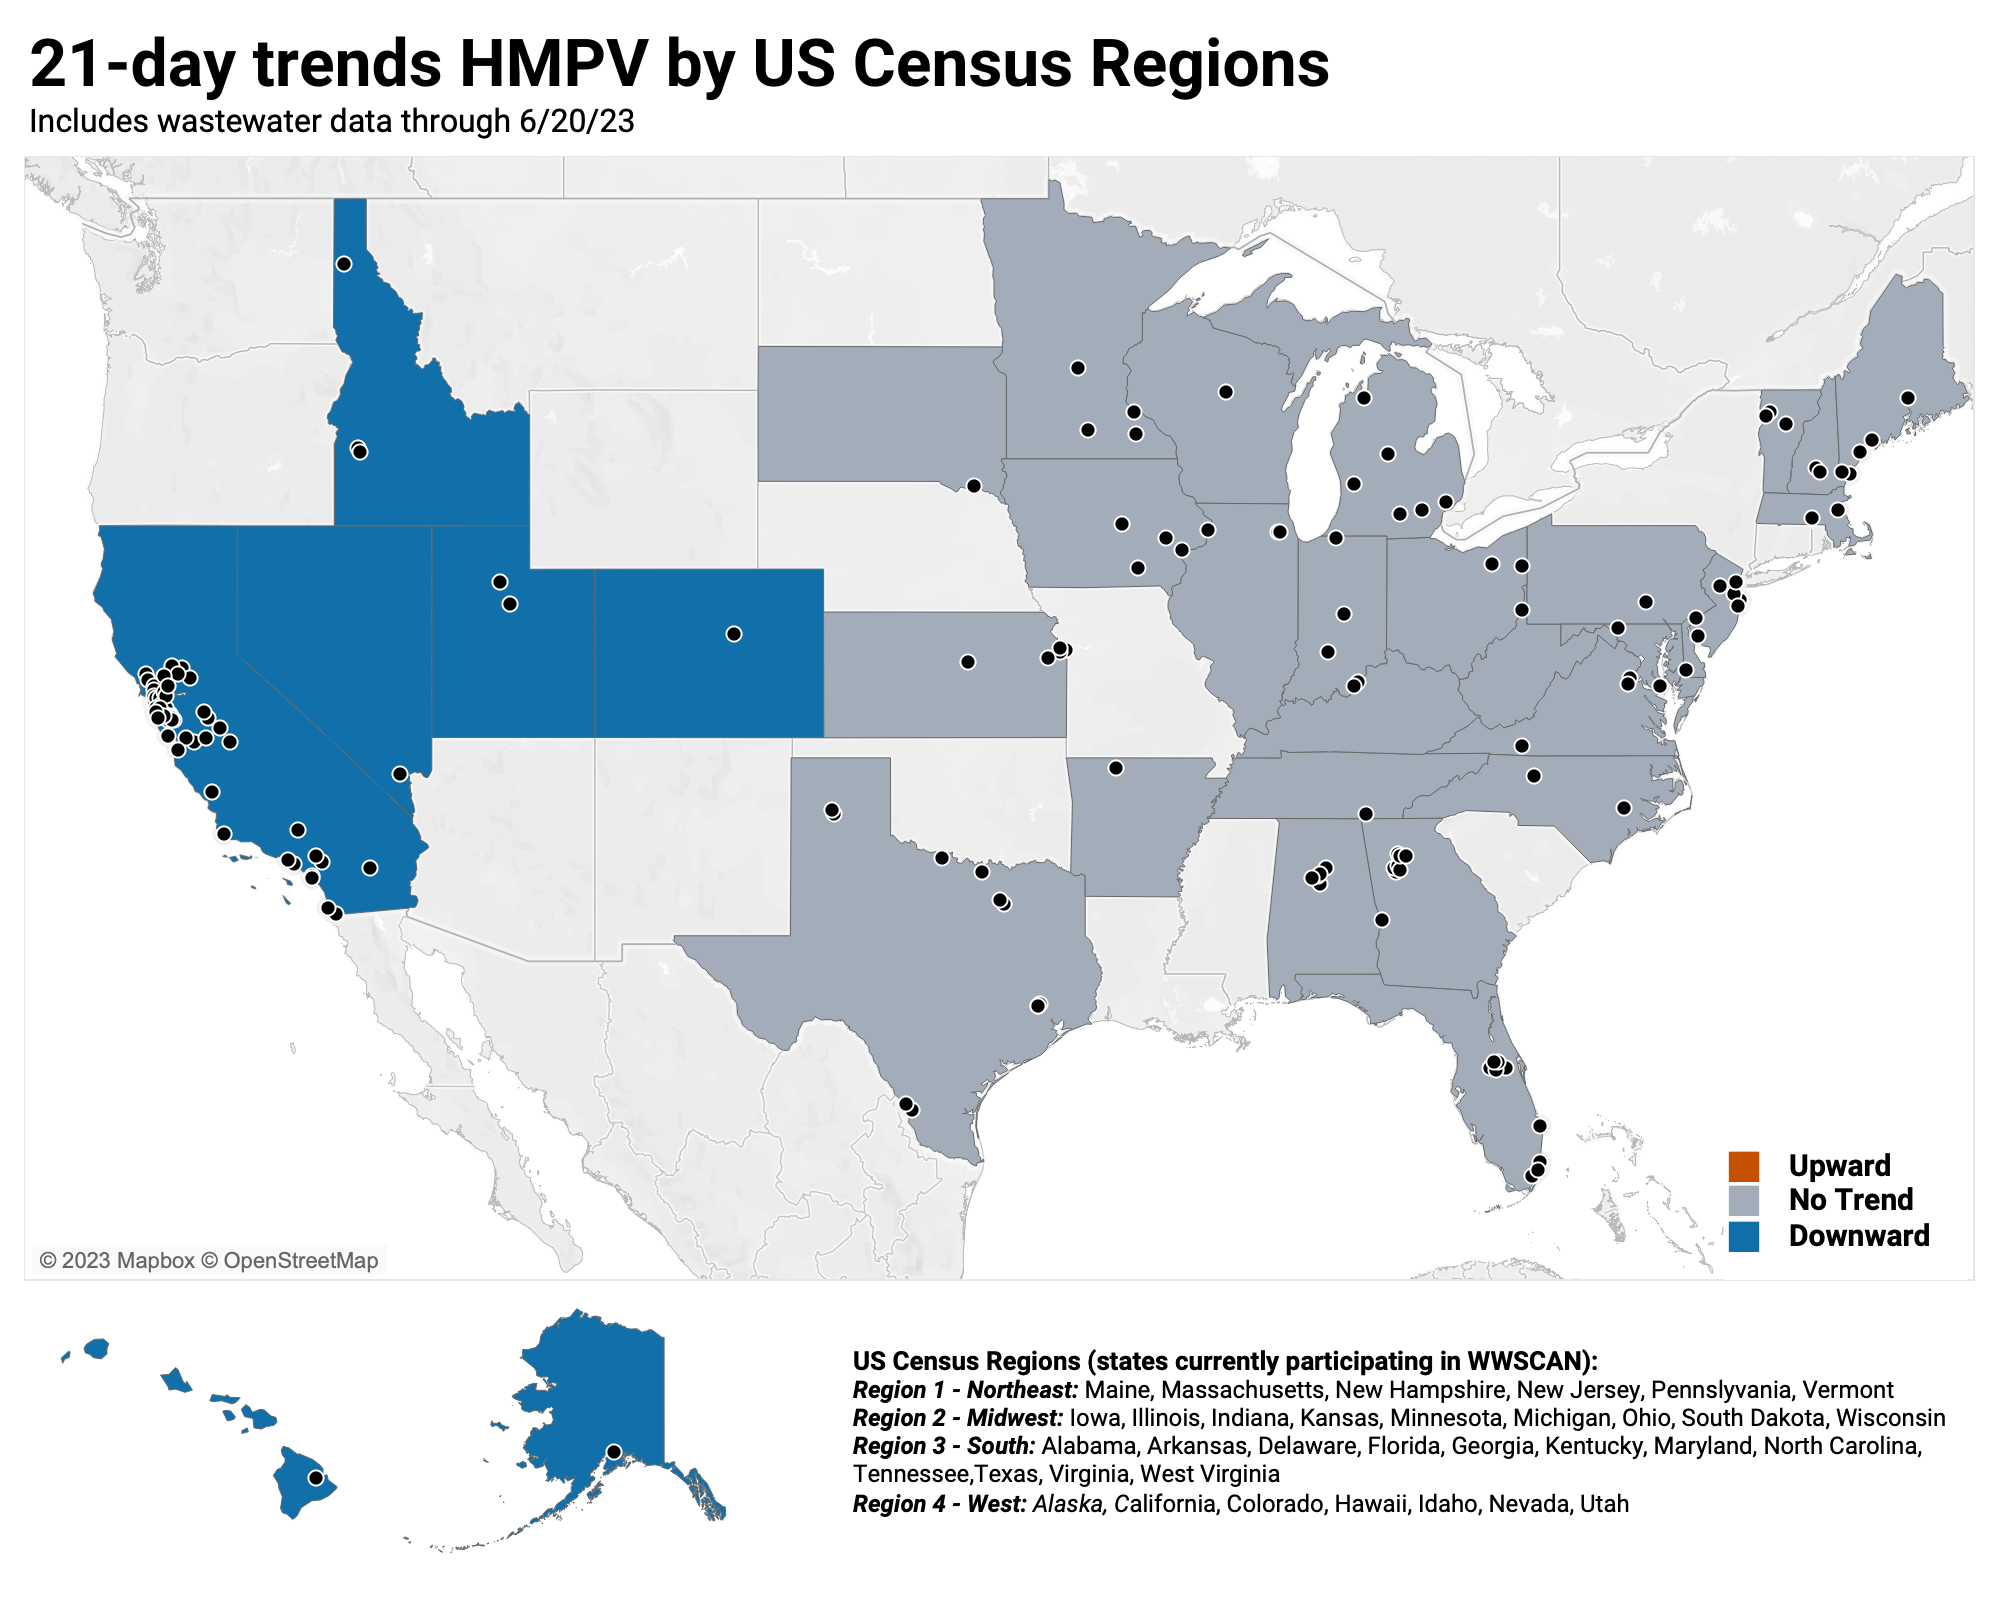
When we look at the 21-day trends at the US Census Region level, the Midwest, Northeast and South show no trend, and the West shows show decreasing trends.
Enteric Targets
Enteric diseases are caused by micro-organisms that can cause intestinal illness
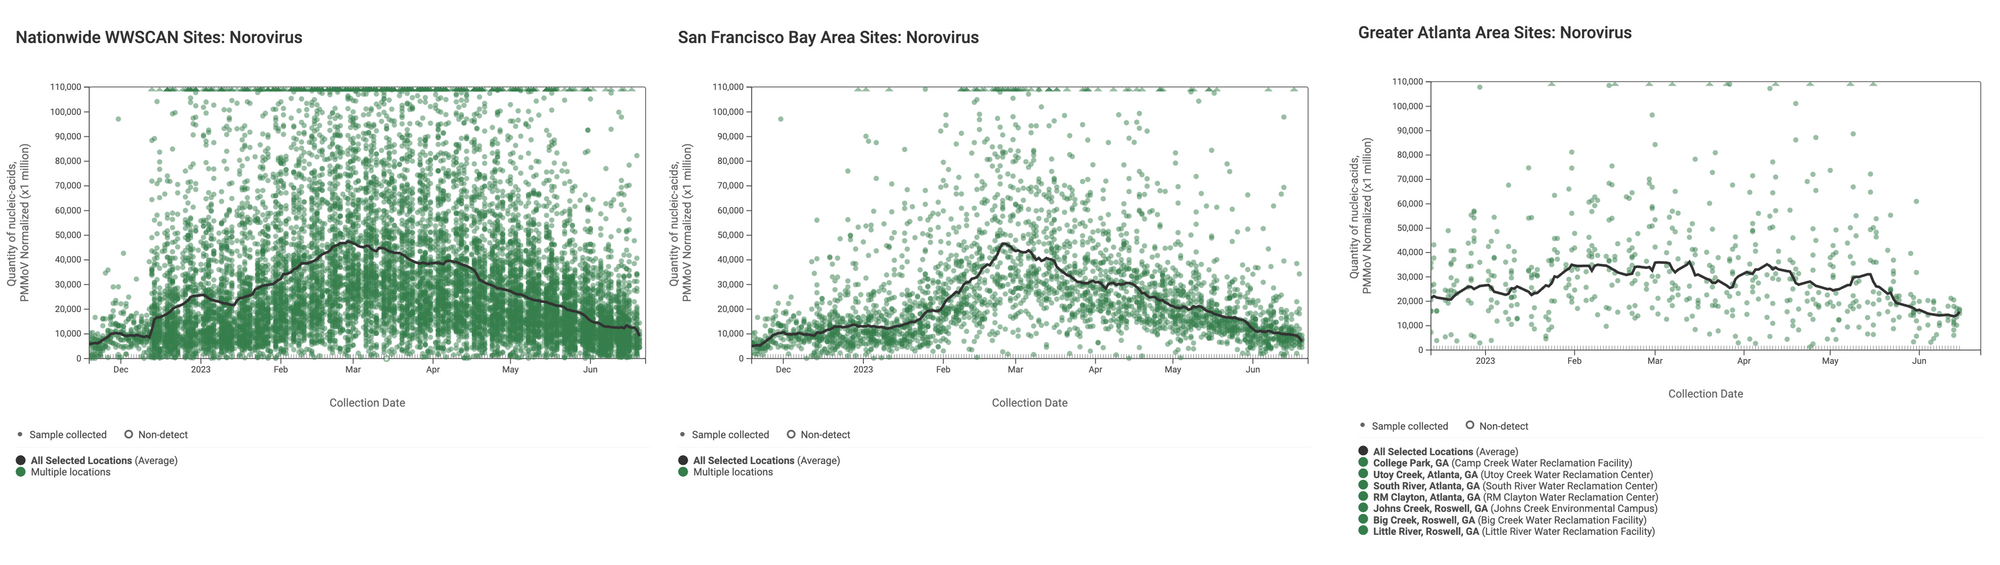
Norovirus GII (HuNoV GII) RNA has been consistently detected at the sites. The median concentration across all sites over the last 21 days is 5,451,592 copies/gram. Example charts showing concentrations (normalized by PMMoV) in wastewater solids below are from all participating sites across the country (left panel), San Francisco Bay Area sites (middle panel), and Atlanta Metro Area sites (right panel). The weighted average lines in these plots appear to be trending down.
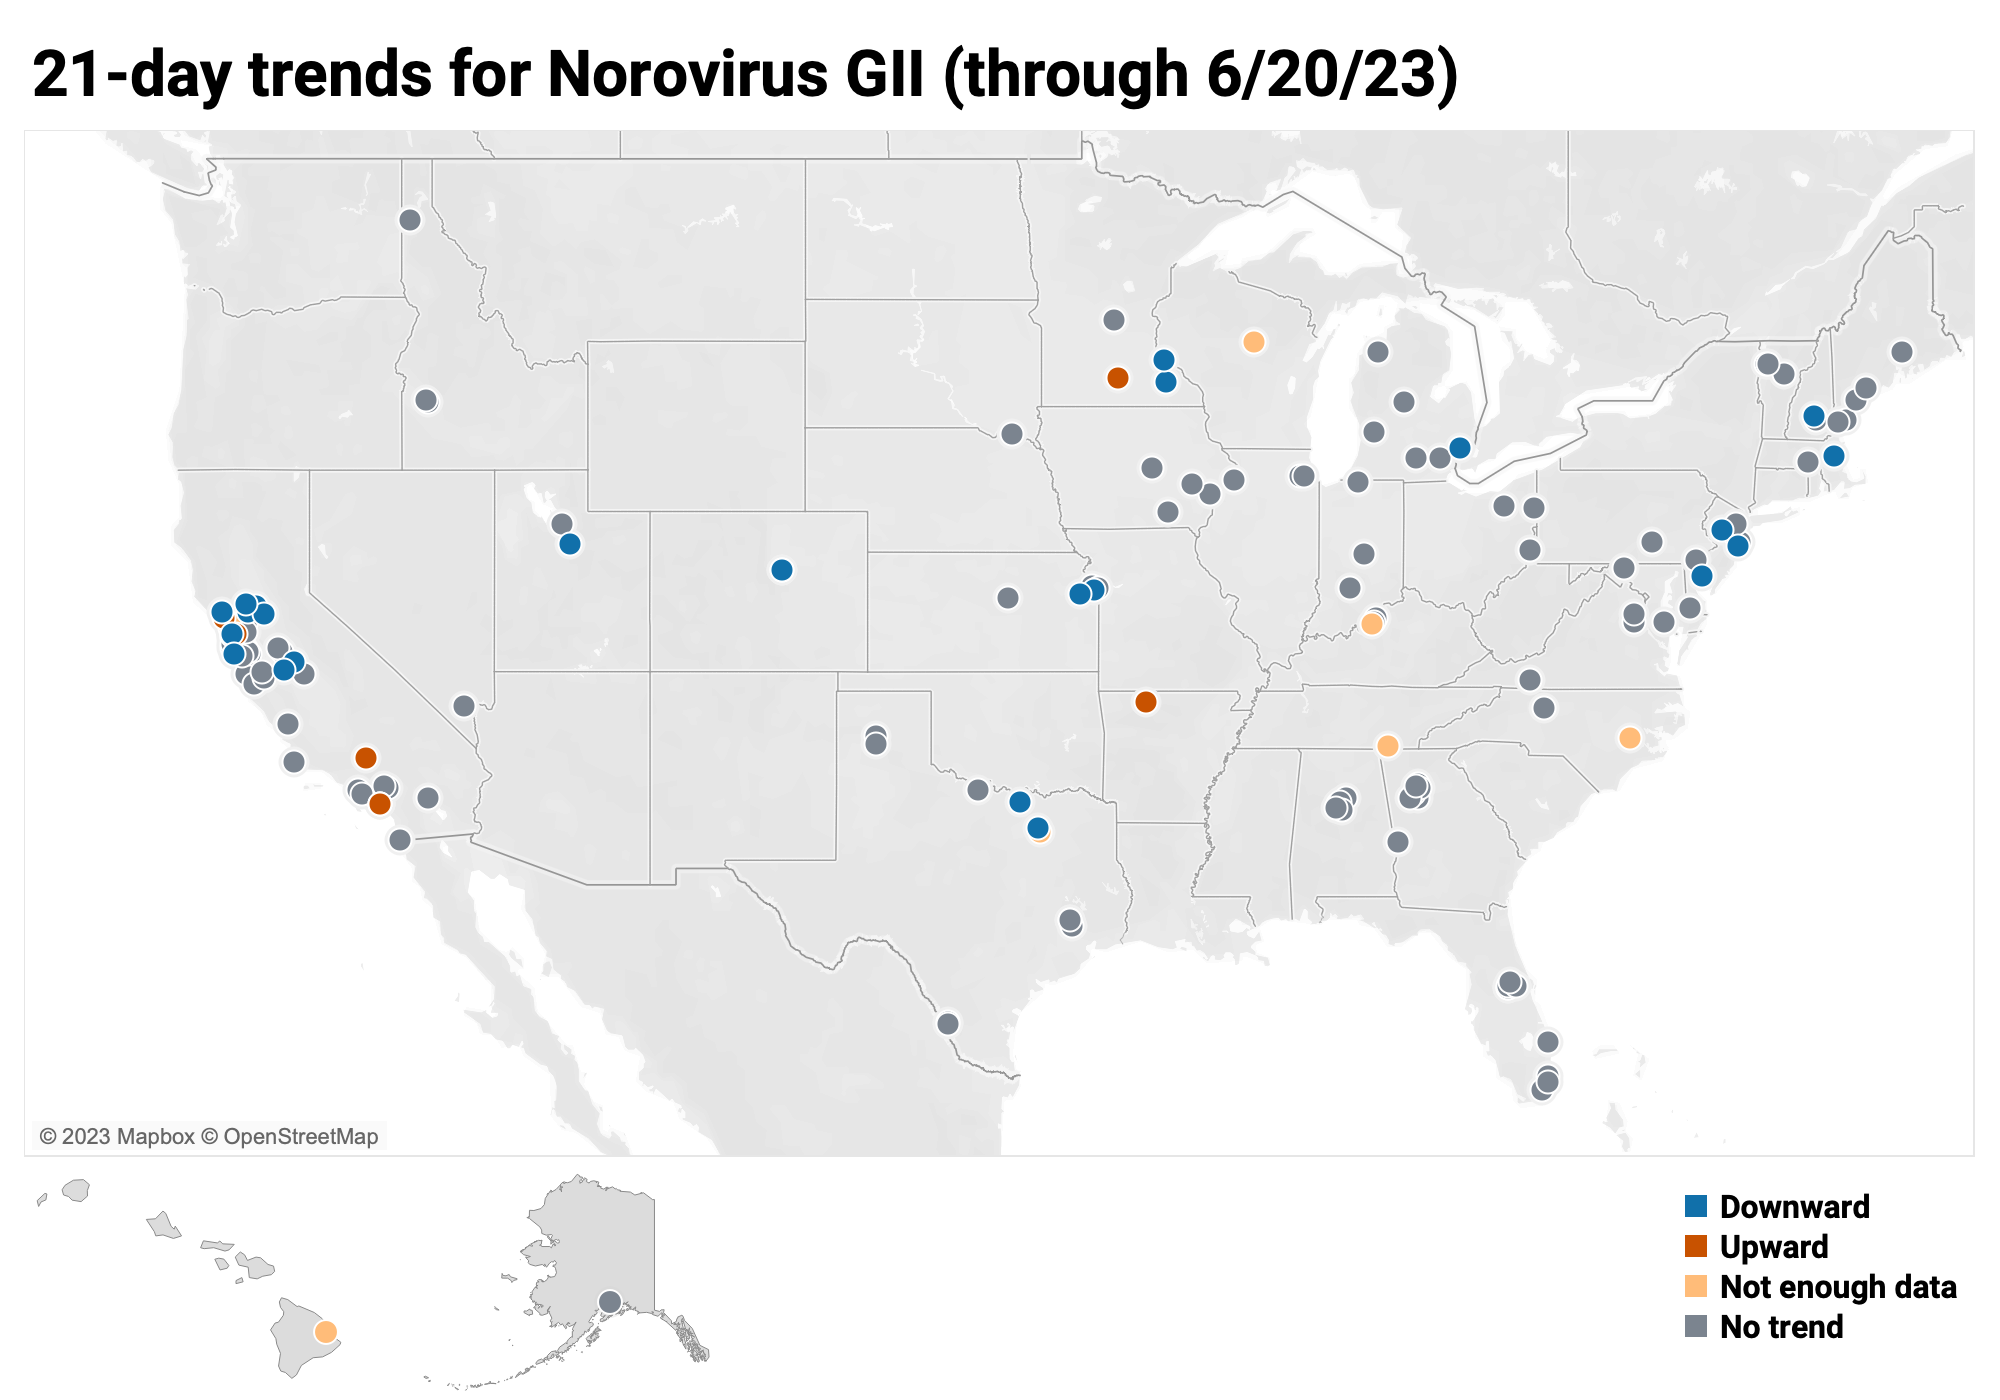
Below is the trend analysis for the Norovirus GII RNA concentrations (normalized by PMMoV) in wastewater solids at the plants. Red indicates a significant upward trend, blue is a significant downward trend, and dark grey is no trend. Yellow indicates that there were not enough data points to calculate a trend. Of the 162 sites, 7 show an upward trend, 124 show no trend, and 24 show a decreasing trend. The remaining 7 sites (Chattanooga TN, Hilo HI, Kinston NC, Louisville KY, Petaluma CA, Sunnyvale TX, and Wausau WI) do not have enough data to calculate a trend.
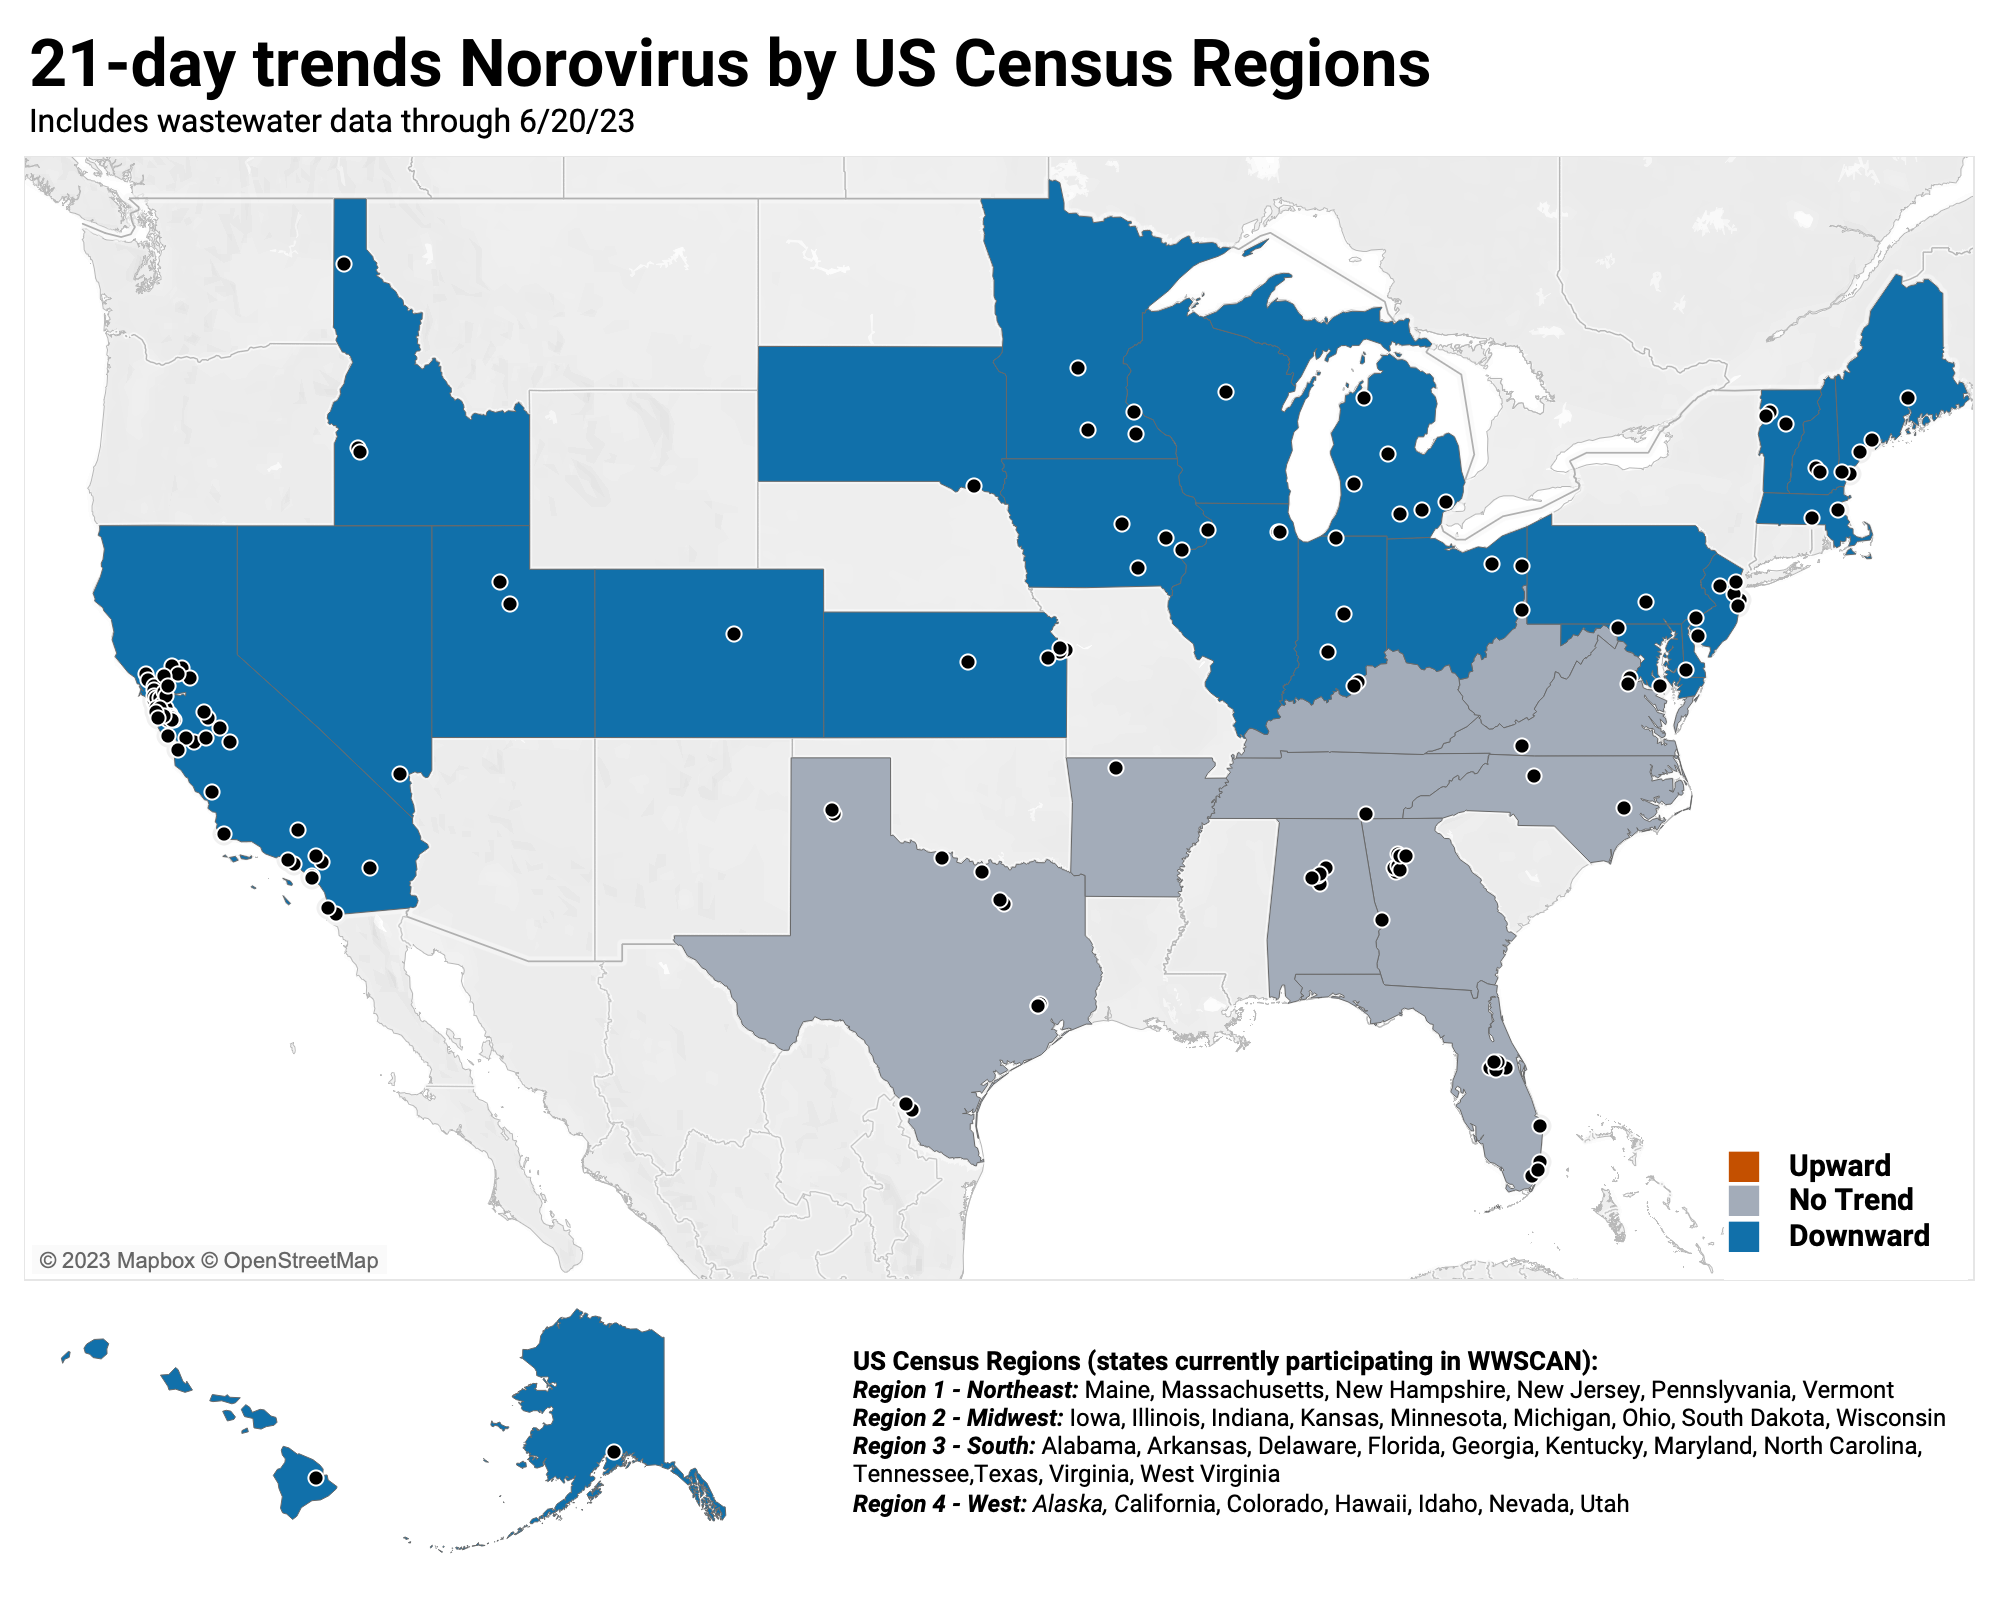
When we look at the 21-day trends at the US Census Region level, the South shows no trend, and the Midwest, Northeast, and West show decreasing trends.
Other Targets
Detection of Mpox DNA in wastewater solids over past 21-days is rare
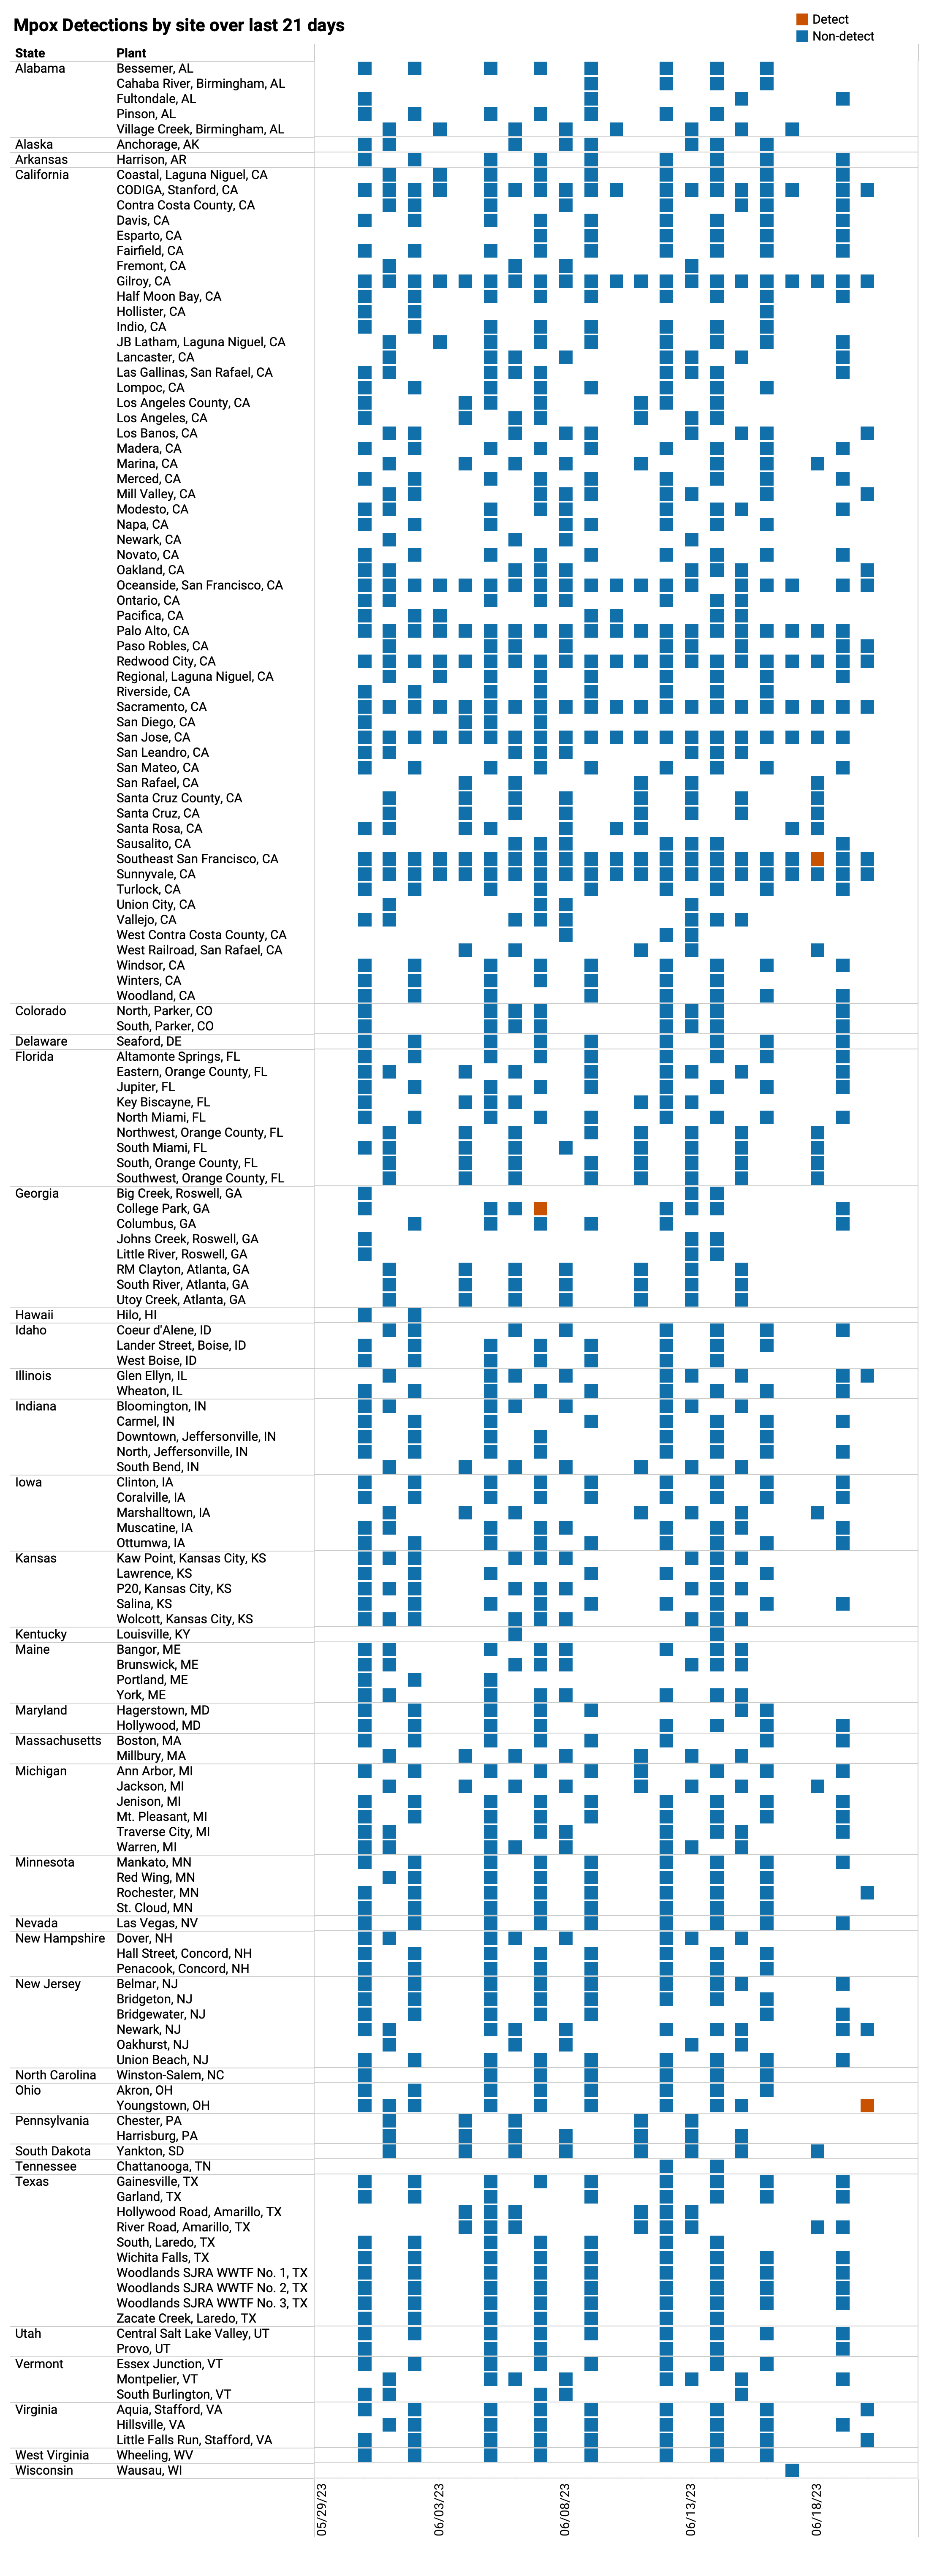
Mpox DNA We rarely detected mpox DNA in samples from any site over the past three-weeks. Below you can see, in red, there have only been 3 positive samples out of 1,316 samples during the past 21 days. Outbreaks seem to be under control, but we will continue to monitor so that public health departments can respond if we see consistent detections and increases in concentrations in any sites. The chart below shows every plant in WWSCAN (approximately 162) as rows, and the last 21 days as columns (labeled at the bottom axis). White indicates no samples, blue is non-detect for mpox DNA and red is detect for mpox DNA. As a reminder, you can access our paper in New England Journal of Medicine about how mpox wastewater monitoring compares to clinical reports of infectious here.
Join us at the next WWSCAN Stakeholder call on July 14th, 2023
At the July WWSCAN Stakeholder meeting we will discuss plans to add more targets to the program as well as going over new website features to help with interpreting wastewater trends.
If you have questions about the website or anything else, submitting them in advance here will help us plan to address everything. We hope to see you there!