
Nationwide WWSCAN Update 12/20/23
Hi everyone,
This newsletter contains updates on the WastewaterSCAN program with wastewater samples analyzed by the lab through December 20, 2023. Below you will find information on the program in terms of participating partners, review of targets being measured, as well as current categories (low, medium, high) of the infectious disease targets.
Enjoy your holiday,
Ali & Marlene
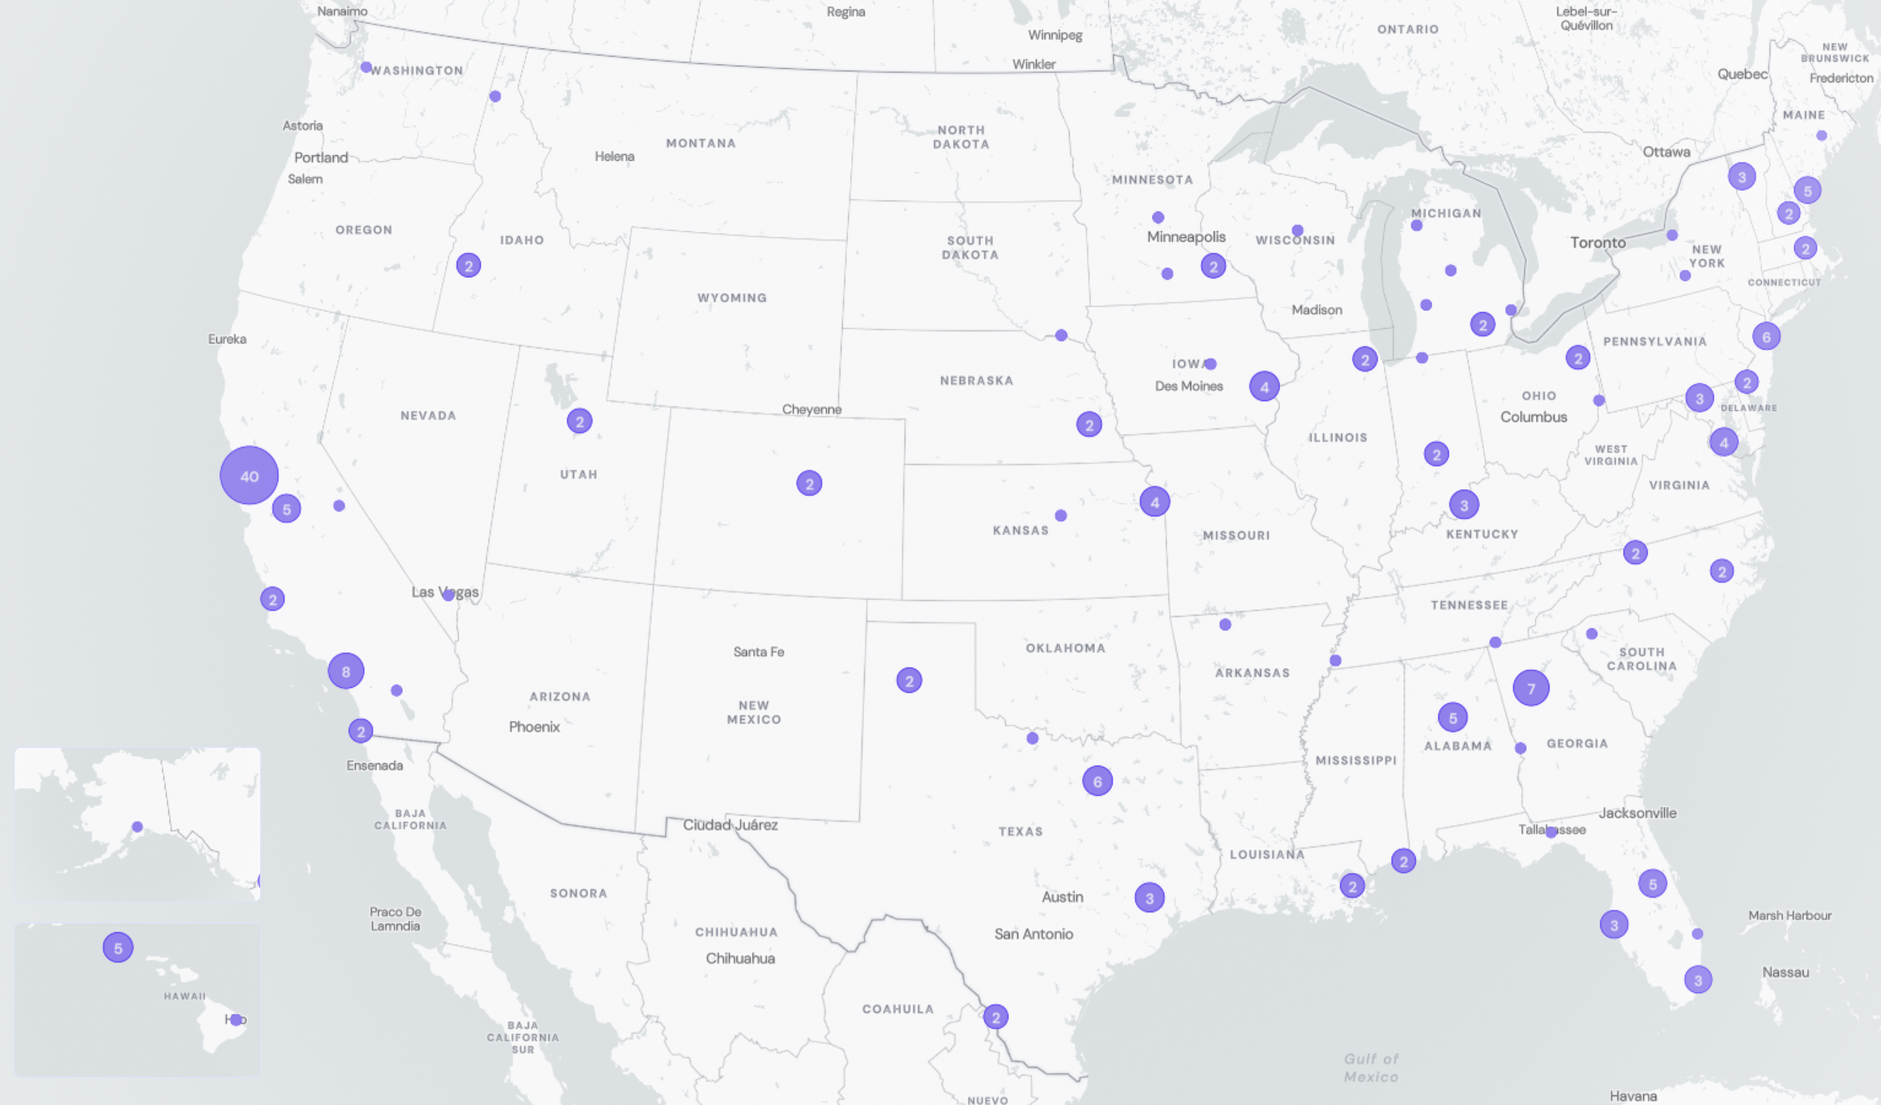
Participating Plants
191 plants from 40 states and Washington DC are sampling, which represents ~13.5% of the US population
WastewaterSCAN Participant Stats:
- 191 plants sampling
- 45,334,248 people covered through sampling efforts
- 40 states and Washington DC represented
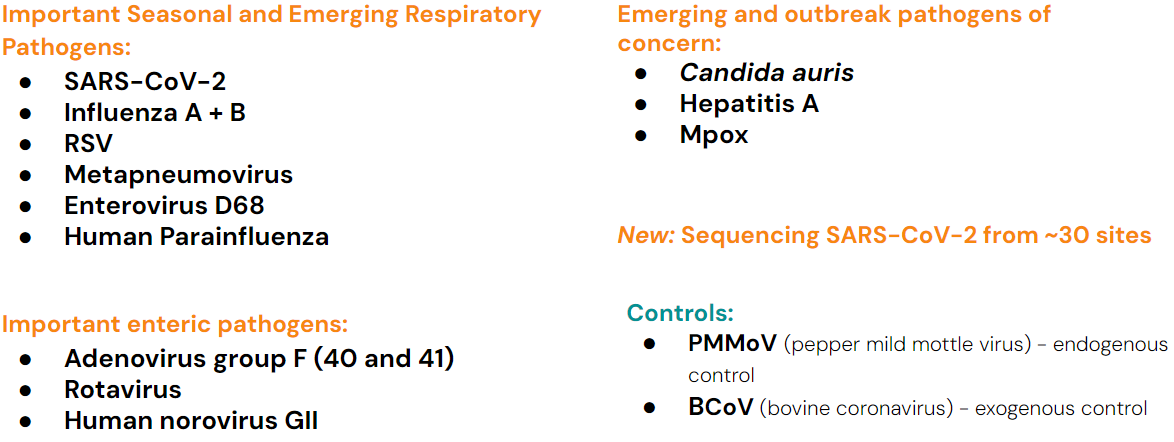
Infectious Disease Target Review
Currently monitoring a suite of Respiratory, Gastrointestinal and Outbreak Pathogens of Concern
The methods for our assays are in the public domain and links for these are provided at the end of the newsletter.
Program Updates
WWSCAN funding is secured through Spring 2024
WastewaterSCAN currently has funding to continue monitoring approximately until May 2024.
Respiratory Pathogens
SARS-CoV-2, Influenza A & B, Respiratory Syncytial Virus, Human metapneumovirus, Human Parainfluenza & EV-D68
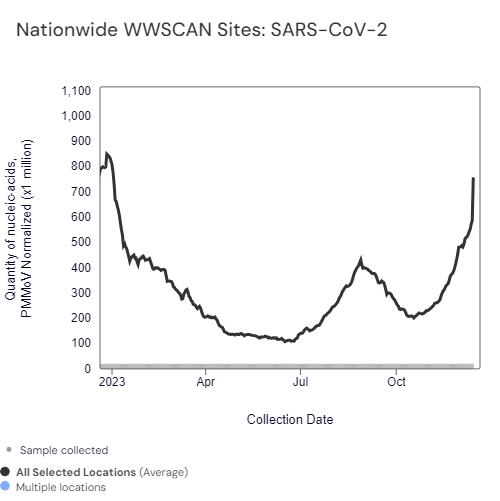
SARS-CoV-2 N gene RNA median concentration across all sites over the last 21 days is 156,778 copies/gram. For reference, the median concentration in November 2023 was 98,332 copies/gram. Below is the population weighted average SARS-CoV-2 N gene concentrations (normalized by PMMoV) from all participating WWSCAN sites across the country over the last 365 days. Nationally, SARS-CoV-2 is in the "High" category with aggregated measurements showing high concentrations and no trend over the past 21 days.
Below are the population-weighted average SARS-CoV-2 N gene concentrations (normalized by PMMoV) from sites in the Midwest US (top left panel), Northeast US (top right panel), Southern US (bottom left panel) and Western US (bottom right panel) over the last 365 days. Raw data have been omitted from the plots for clarity of presentation but are still available in the chart settings on dashboard..
The data shows high concentration levels across all US regions, especially in the Midwest and the Northeast. All regions are currently in the "High" category.
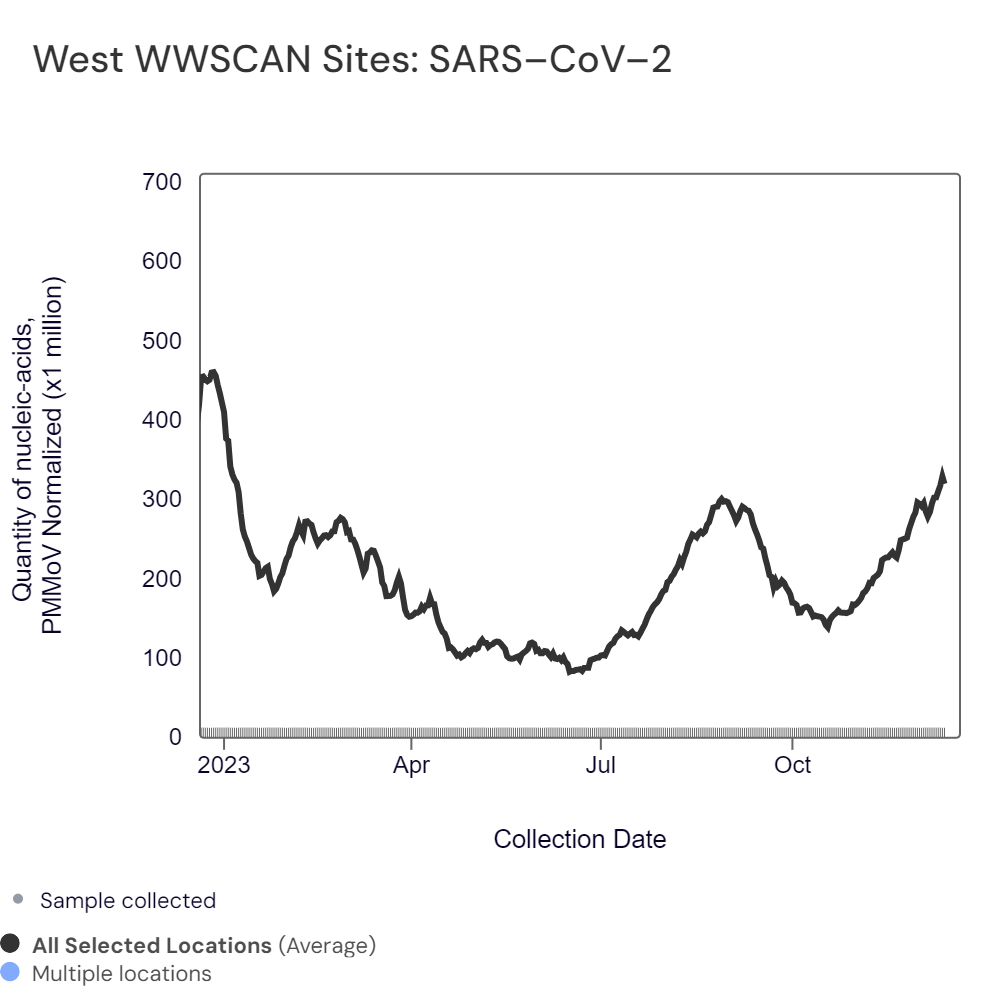
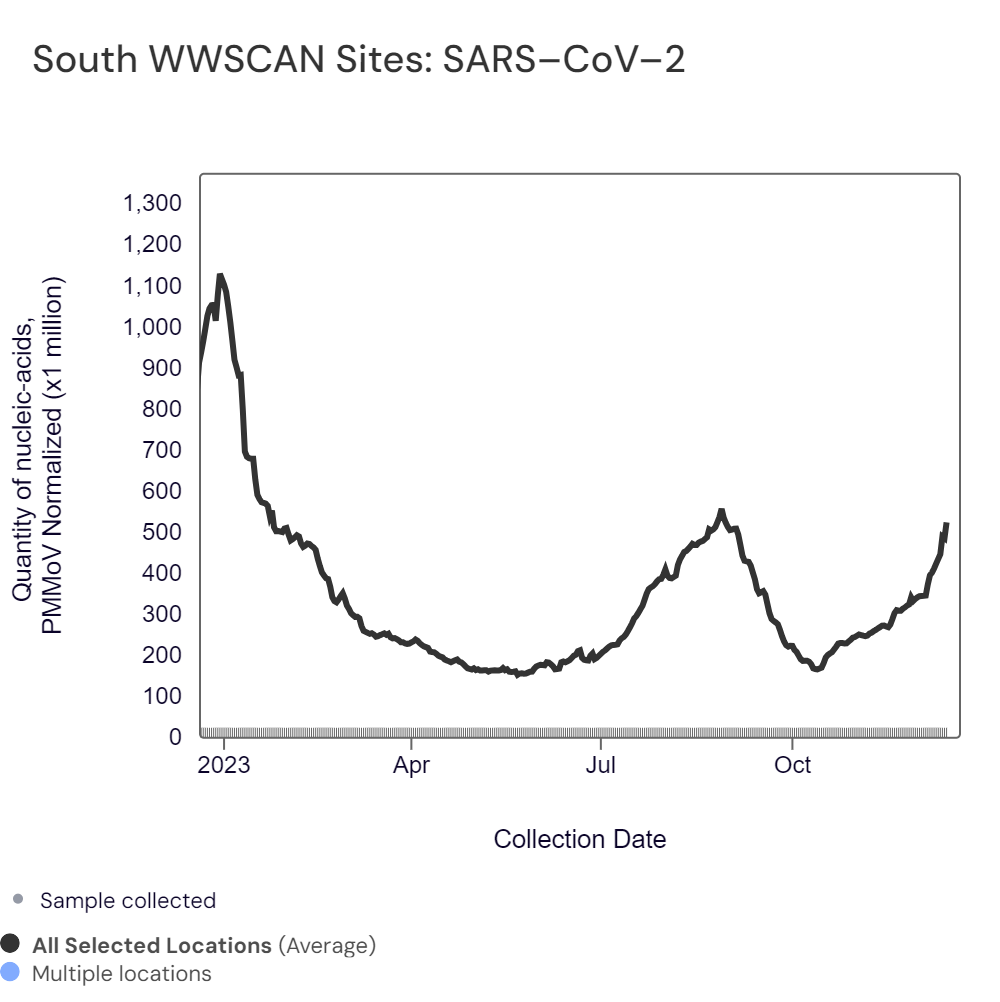

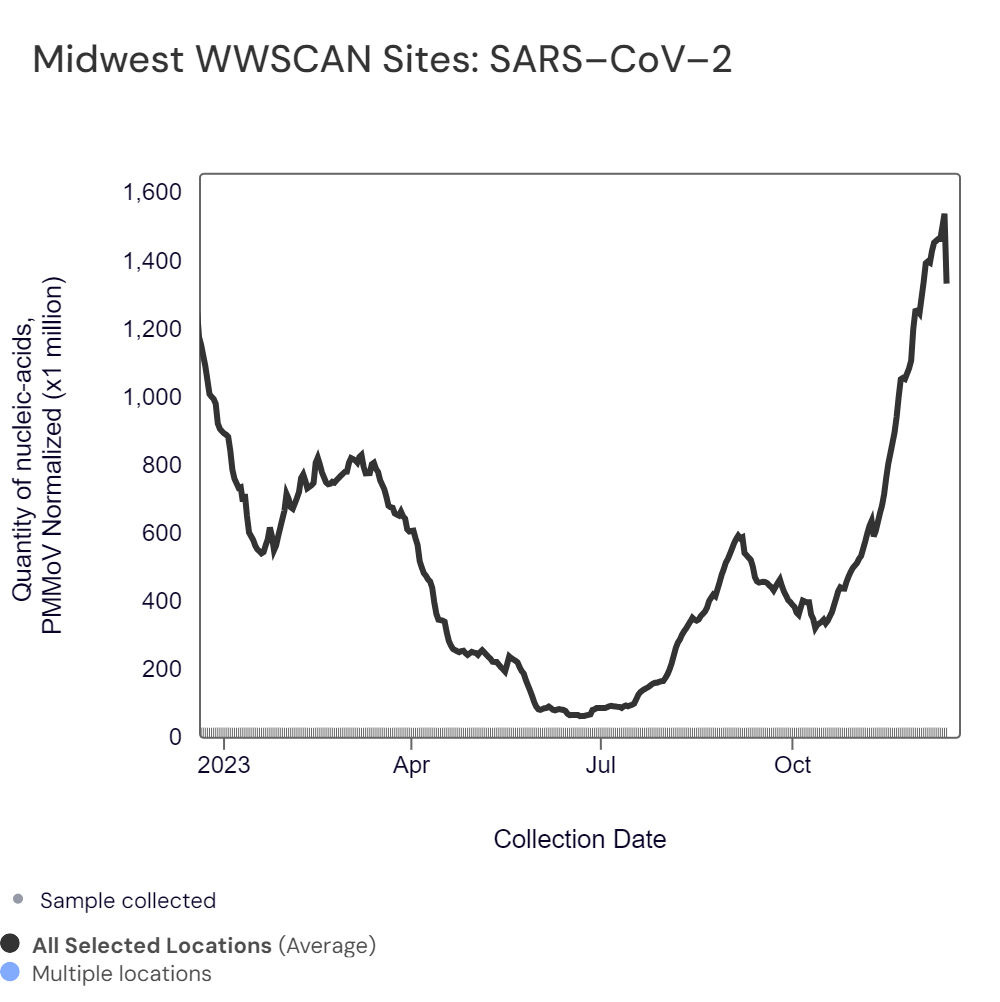
Midwest states: IA, IL, IN, KS, MI, MN, NE, OH, SD, WI. Northeast states: CT, MA, ME, NH, NJ, NY, PA, VT. Southern states: AL, AR, DE, FL, GA, KY, LA, MD, MS, NC, TN, TX, VA, WV and Washington DC. Western States: AK, CA, CO, HI, ID, NV, UT, WA.
Below are the current SARS-CoV-2 wastewater categories for all WWSCAN sites:
- 23 are in the LOW Wastewater Category
- 43 are in the MEDIUM Wastewater Category
- 109 are in the HIGH Wastewater Category
- 16 do not have enough data to calculate (Mendenhall, Juneau, AK; South San Diego, CA; Petaluma, CA; Fremont, CA; Newark, CA; San Rafael, CA; Union City, CA; West Railroad, San Rafael, CA; South Miami, FL; Key Biscayne, FL; Gautier, MS; Greenville, SC; Hollywood Road, Amarillo, TX; River Road, Amarillo, TX; Southside, Dallas, TX)

Influenza A (IAV) RNA median concentration across all sites over the last 21 days is 2,339 copies/gram (note that our lower detection limit is between 500 and 1000 copies/gram). There have been 748 positive samples out of 1382 samples during the past 21 days (~54.1% detection rate). Below is the population weighted average IAV RNA concentrations (normalized by PMMoV) from all participating WWSCAN sites across the country over the last 365 days. Nationally, influenza A is in the "Low" category, with <50% of sites showing onset of influenza in wastewater.

Below is the population-weighted average IAV RNA concentrations (normalized by PMMoV) from sites in the Midwest US (top left panel), Northeast US (top right panel), Southern US (bottom left panel) and Western US (bottom right panel) over the last 365 days.
These plots show low concentrations across all US regions. All regions are in the "Low" category.

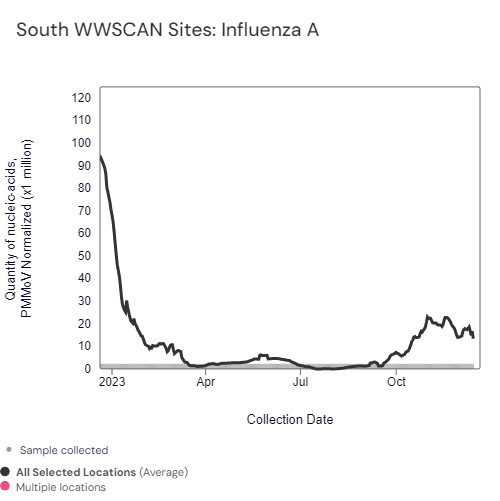


Midwest states: IA, IL, IN, KS, MI, MN, NE, OH, SD, WI. Northeast states: CT, MA, ME, NH, NJ, NY, PA, VT. Southern states: AL, AR, DE, FL, GA, KY, LA, MD, MS, NC, TN, TX, VA, WV and Washington DC. Western States: AK, CA, CO, HI, ID, NV, UT, WA.
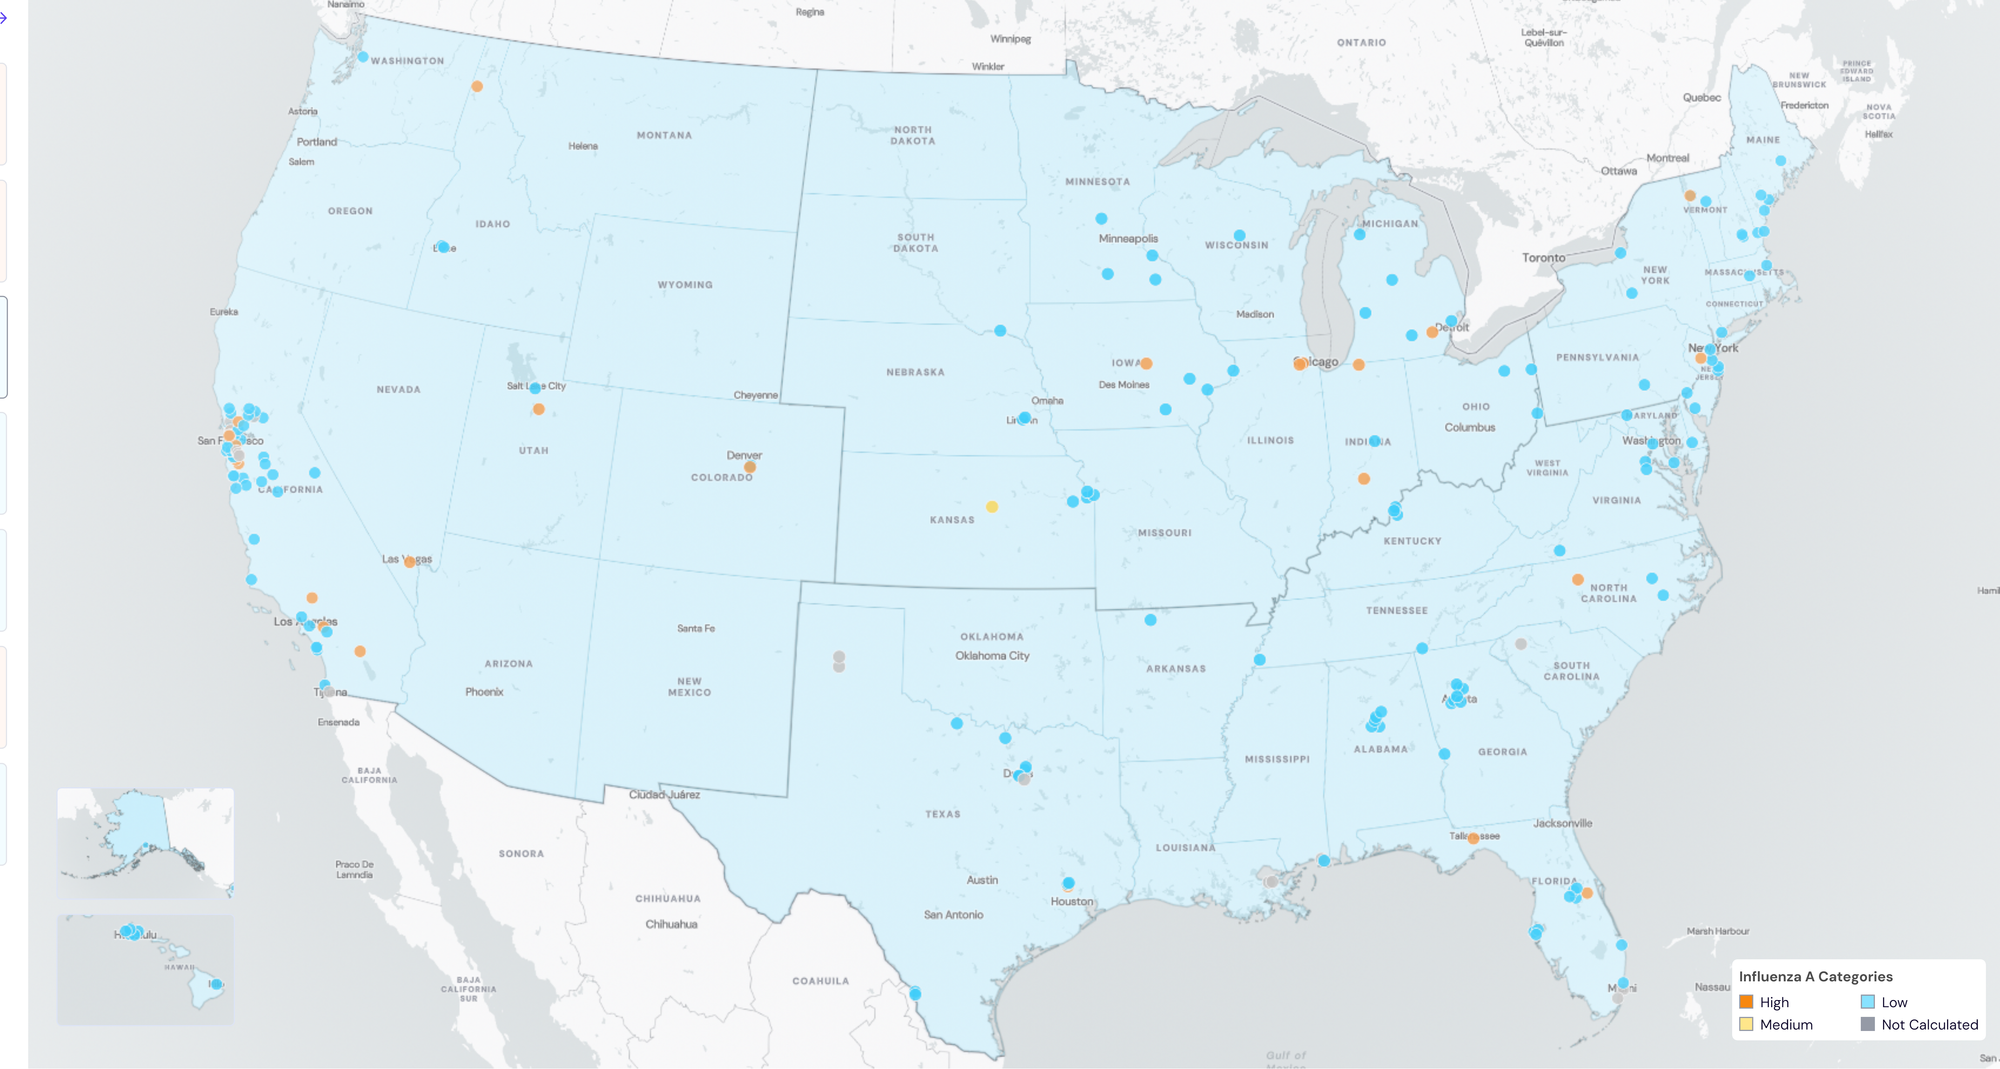
Below are the current Influenza A wastewater categories for all WWSCAN sites, with 38 sites showing wastewater onset for IAV:
- 147 are in the LOW Wastewater Category
- 1 is in the MEDIUM Wastewater Category
- 27 are in the HIGH Wastewater Category
- 16 do not have enough data to calculate (Mendenhall, Juneau, AK; South San Diego, CA; Petaluma, CA; Fremont, CA; Newark, CA; San Rafael, CA; Union City, CA; West Railroad, San Rafael, CA; South Miami, FL; Key Biscayne, FL; Gautier, MS; Greenville, SC; Hollywood Road, Amarillo, TX; River Road, Amarillo, TX; Southside, Dallas, TX)
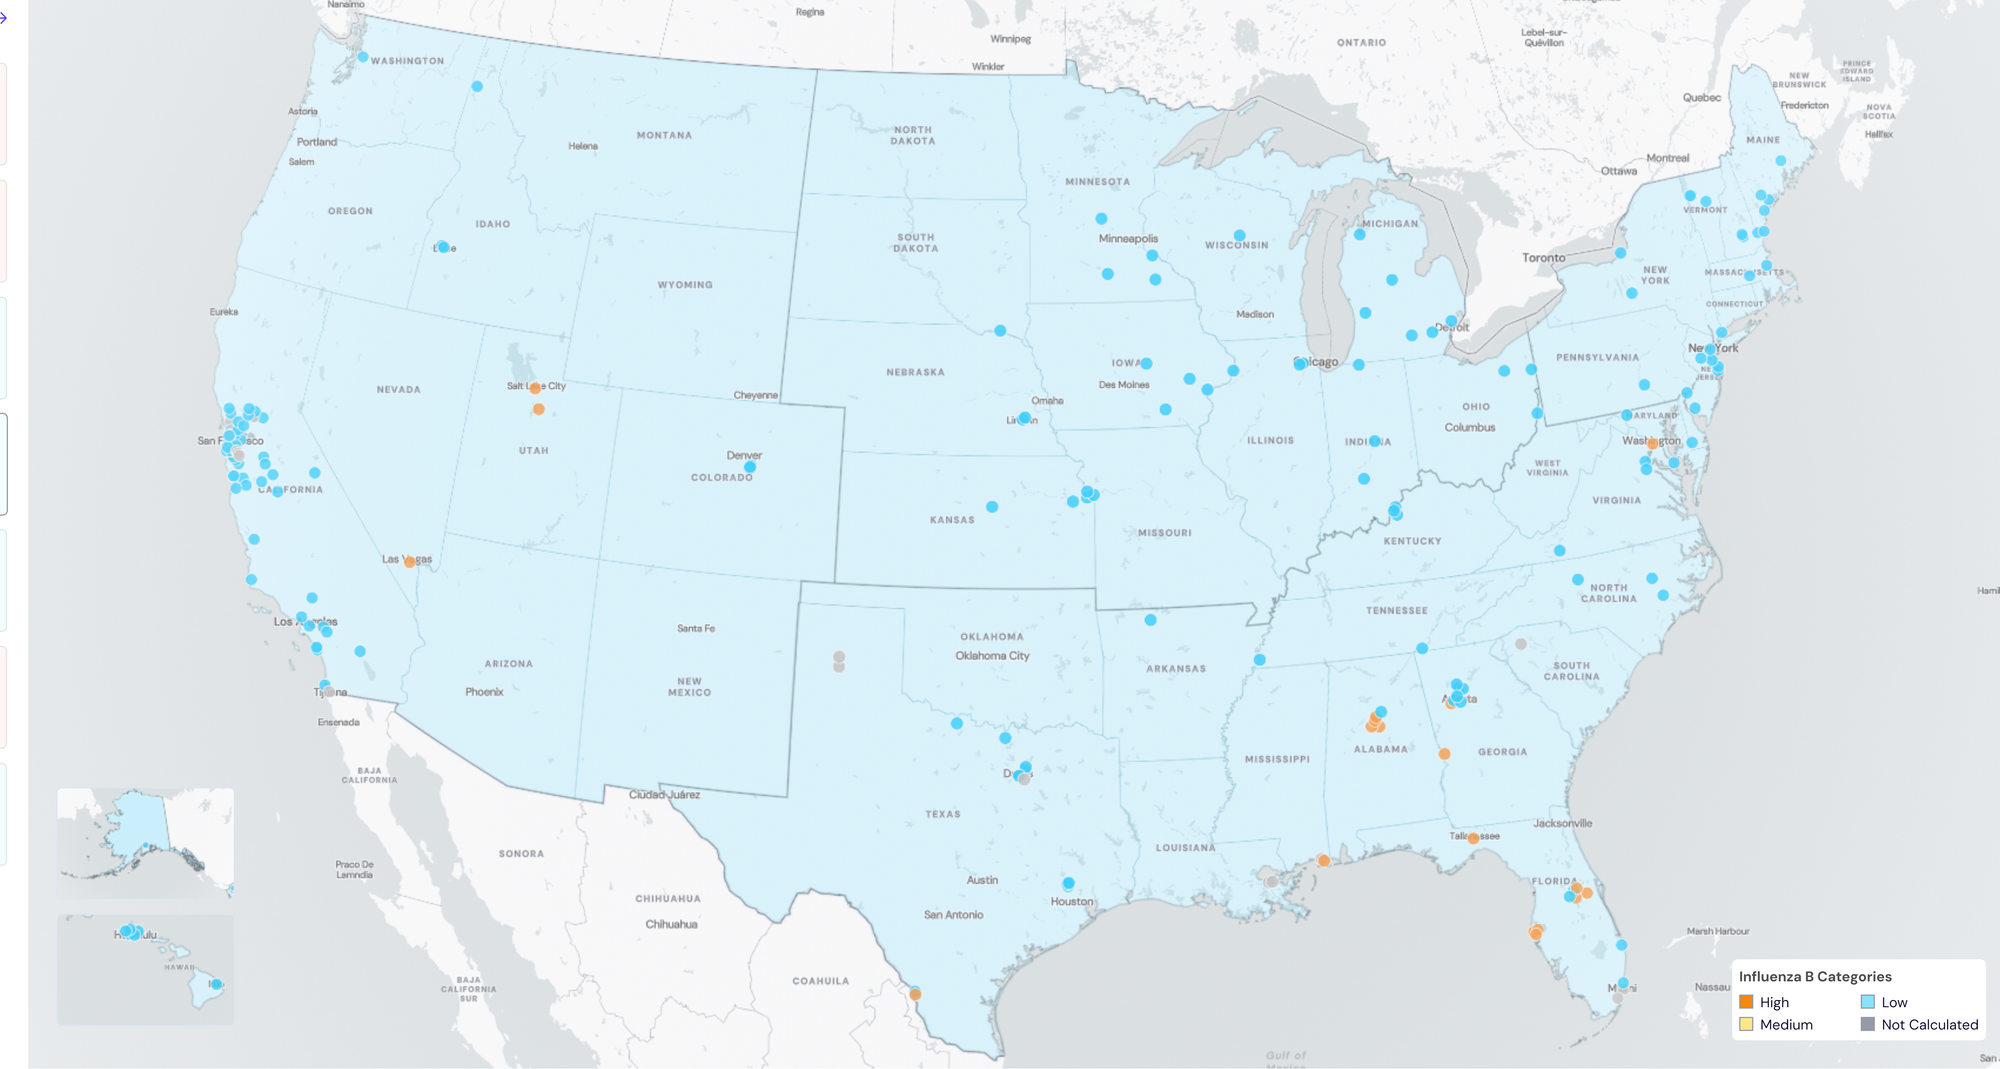
Influenza B (IBV) RNA has been detected in 445 out of 1,382 samples during the past 21 days (~32.1% detection rate). Below is the population-weighted average IBV RNA concentrations (normalized by PMMoV) from all participating WWSCAN sites across the country over the last 365 days.
Nationally, influenza B is in the "Low" category with onset in <50% of sites. Notably, the South and West are the only regions with individual sites in the "High" category.

Below are the current Influenza B wastewater categories for all WWSCAN sites, with at least 19 sites showing wastewater onset for IBV:
- 156 are in the LOW Wastewater Category
- 0 are in the MEDIUM Wastewater Category
- 19 are in the HIGH Wastewater Category
- 16 do not have enough data to calculate (Anchorage, AK; Mendenhall, Juneau, AK; Fremont, CA; Newark, CA; Pacifica, CA; Santa Rosa, CA; South San Diego, CA; Union City, CA; Wahiawa, Honolulu, HI; Wolcott, Kansas City, KS; East Bank, New Orleans, LA; West Bank, New Orleans, LA; Pascagoula Moss Point, MS; Greenville, SC)
Respiratory syncytial virus (RSV) RSV RNA median concentration across all sites over the last 21 days is 23,810 copies/gram. For reference, the median concentration in November 2023 was 14,728 copies/gram. There have been 1,292 positive samples out of 1,382 samples during the past 21 days (~93.5% detection rate). Below are the RSV RNA concentrations (normalized by PMMoV) from all participating WWSCAN sites across the country over the last 365 days shown as the population-weighted average.

Below are the population-weighted average RSV RNA concentrations (normalized by PMMoV) from sites in the Midwest US (top left panel), Northeast US (top right panel), Southern US (bottom left panel) and Western US (bottom right panel) over the last 365 days.
The plots below show relatively high concentrations across all US regions. Nationally, RSV is in the "High" category, with >50% of sites showing onset of RSV in wastewater and aggregated measurements showing high concentrations. The Midwest and Northeast have had an upward trend over the past 21 days.
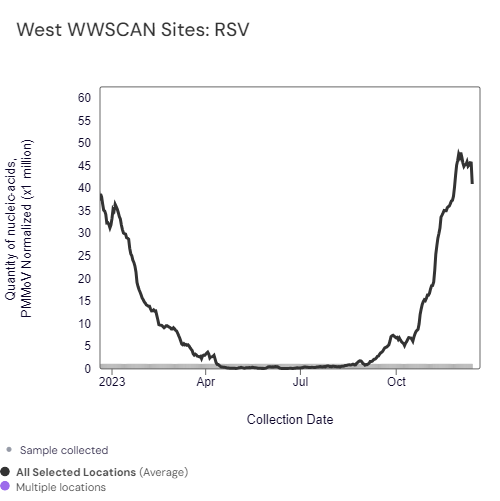
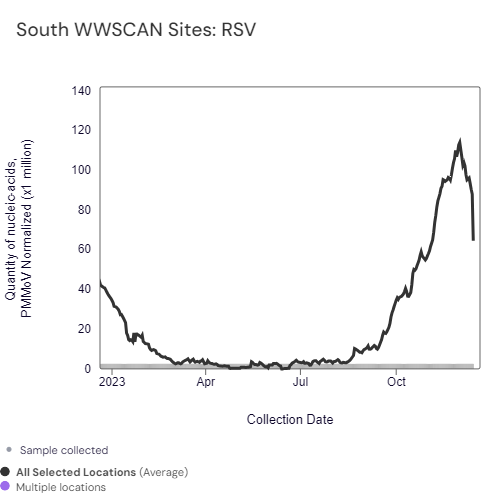
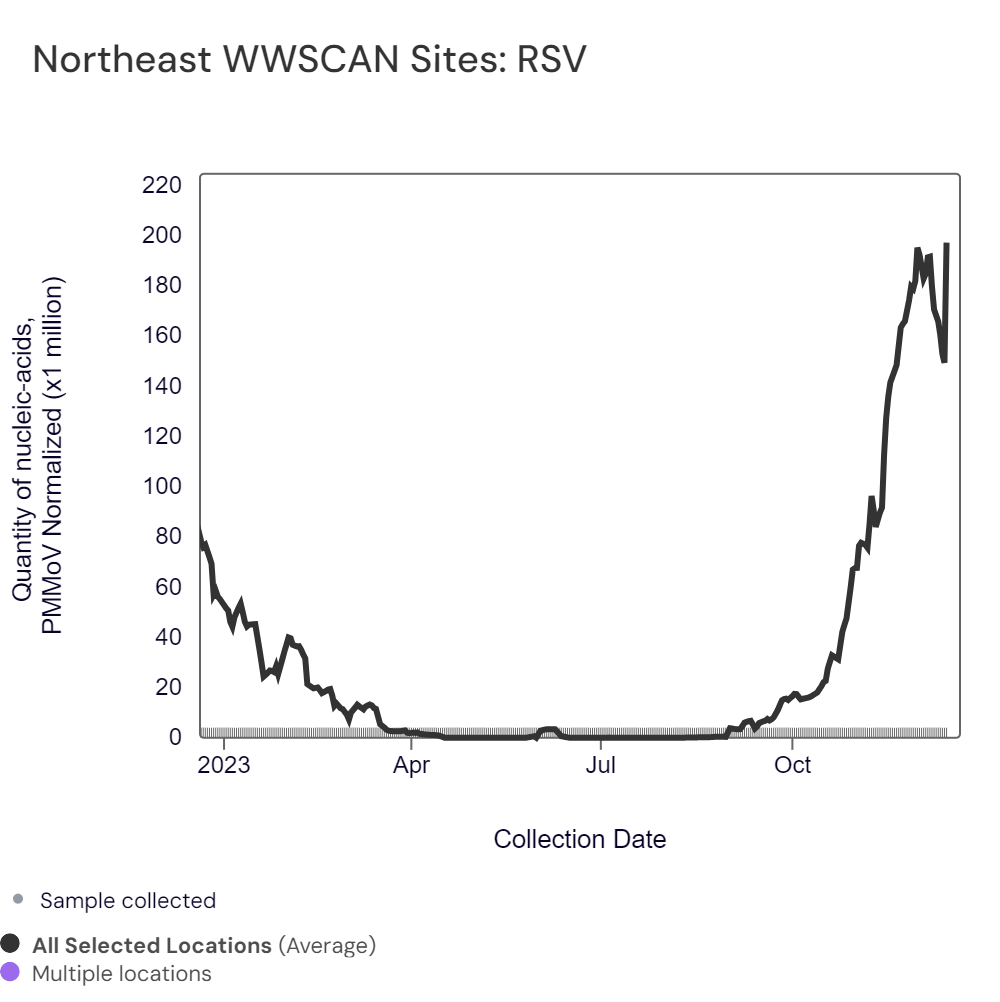
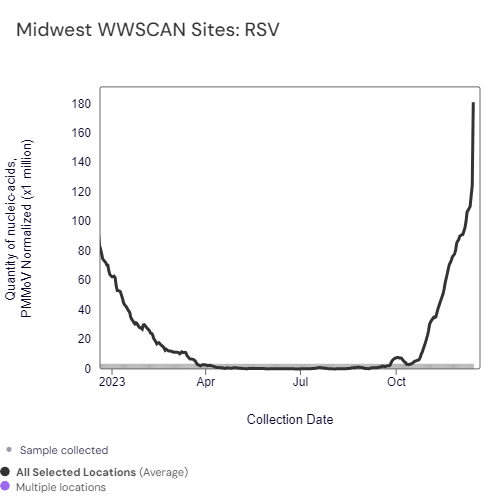
Midwest states: IA, IL, IN, KS, MI, MN, NE, OH, SD, WI. Northeast states: CT, MA, ME, NH, NJ, NY, PA, VT. Southern states: AL, AR, DE, FL, GA, KY, LA, MD, MS, NC, TN, TX, VA, WV and Washington DC. Western States: AK, CA, CO, HI, ID, NV, UT, WA.
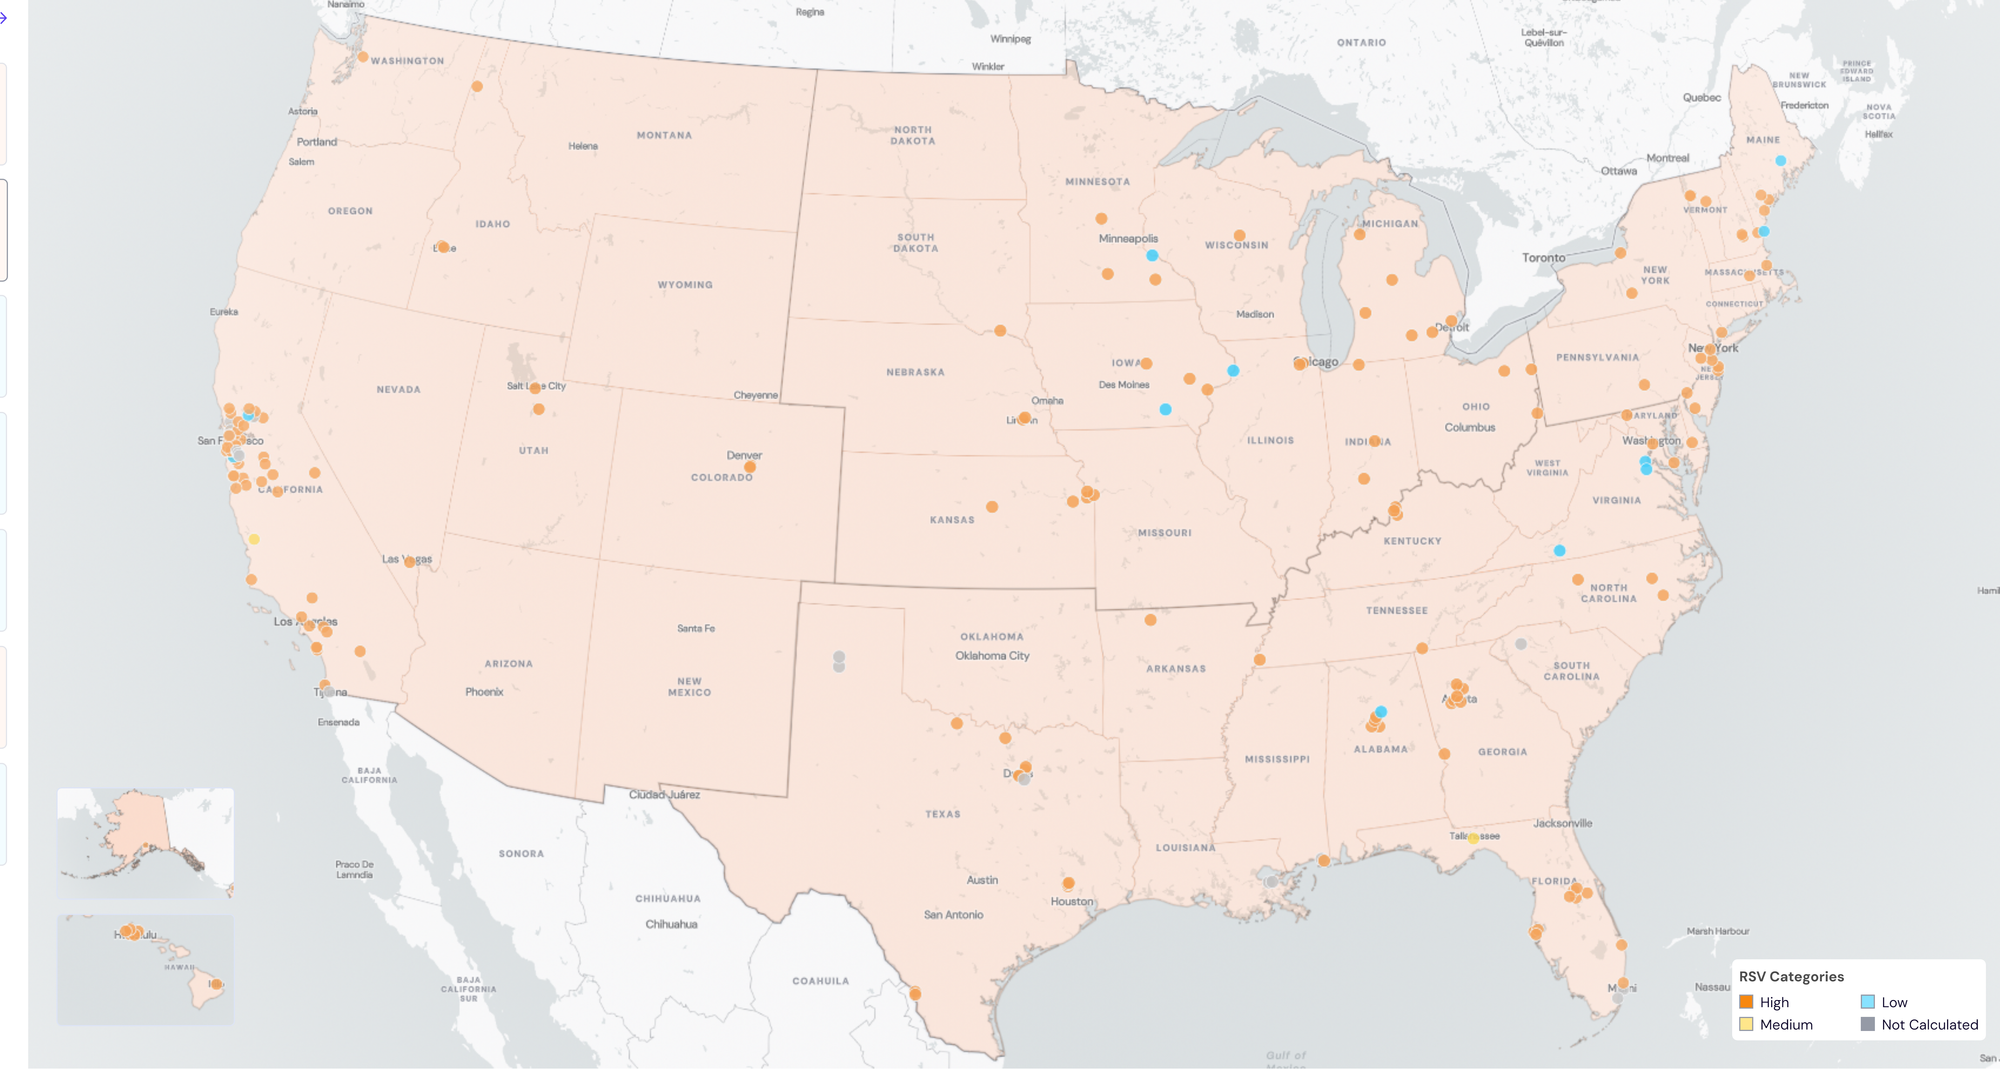
Below are the current RSV wastewater categories for all WWSCAN sites, with at least 165 sites are showing wastewater onset for RSV:
- 11 are in the LOW Wastewater Category
- 2 are in the MEDIUM Wastewater Category
- 162 are in the HIGH Wastewater Category
- 16 do not have enough data to calculate (Mendenhall, Juneau, AK; South San Diego, CA; Petaluma, CA; Fremont, CA; Newark, CA; San Rafael, CA; Union City, CA; West Railroad, San Rafael, CA; South Miami, FL; Key Biscayne, FL; Gautier, MS; Greenville, SC; Hollywood Road, Amarillo, TX; River Road, Amarillo, TX; Southside, Dallas, TX)
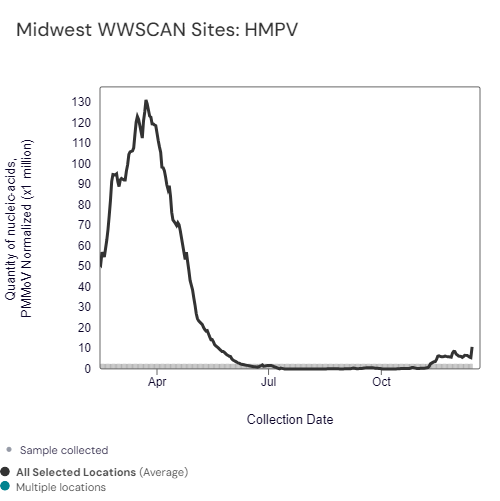
HMPV (human metapneumovirus) RNA median concentrations across all sites over the last 21 days are below the lower detection limit of the assay. There have been 521 positive samples out of 1,382 samples during the past 21 days (~37.7% detection rate). Below is the population weighted average HMPV RNA concentrations (normalized by PMMoV) from all participating WWSCAN sites across the country since we started monitoring in late December 2022.
Nationally, HMPV is in the "Low" category.

Below are the population-weighted average HMPV RNA concentrations (normalized by PMMoV) from sites in the Midwest US (top left panel), Northeast US (top right panel), Southern US (bottom left panel) and Western US (bottom right panel) since we started monitoring HMPV late December 2022.
The charts below indicate levels in wastewater have decreased since a small peak last month. All regions are in the "Low" category.
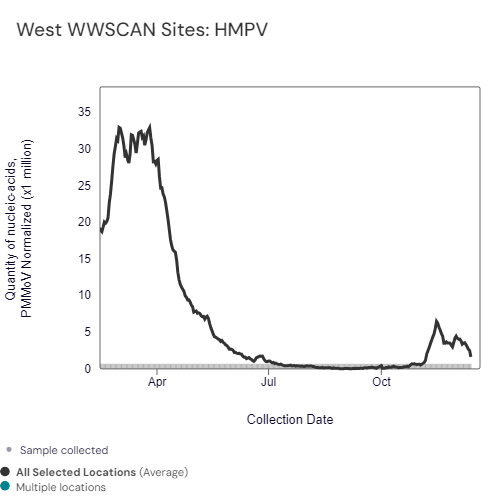
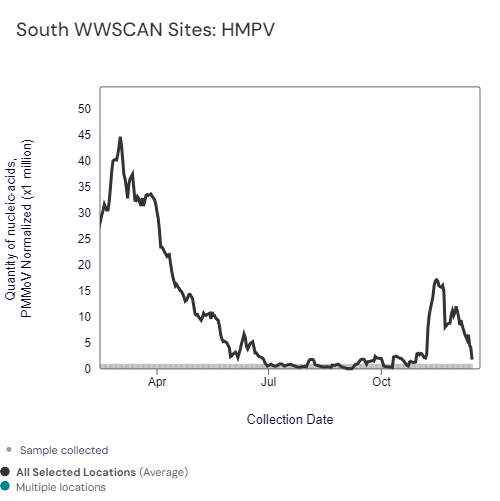

Midwest states: IA, IL, IN, KS, MI, MN, NE, OH, SD, WI. Northeast states: CT, MA, ME, NH, NJ, NY, PA, VT. Southern states: AL, AR, DE, FL, GA, KY, LA, MD, MS, NC, TN, TX, VA, WV and Washington DC. Western States: AK, CA, CO, HI, ID, NV, UT, WA.
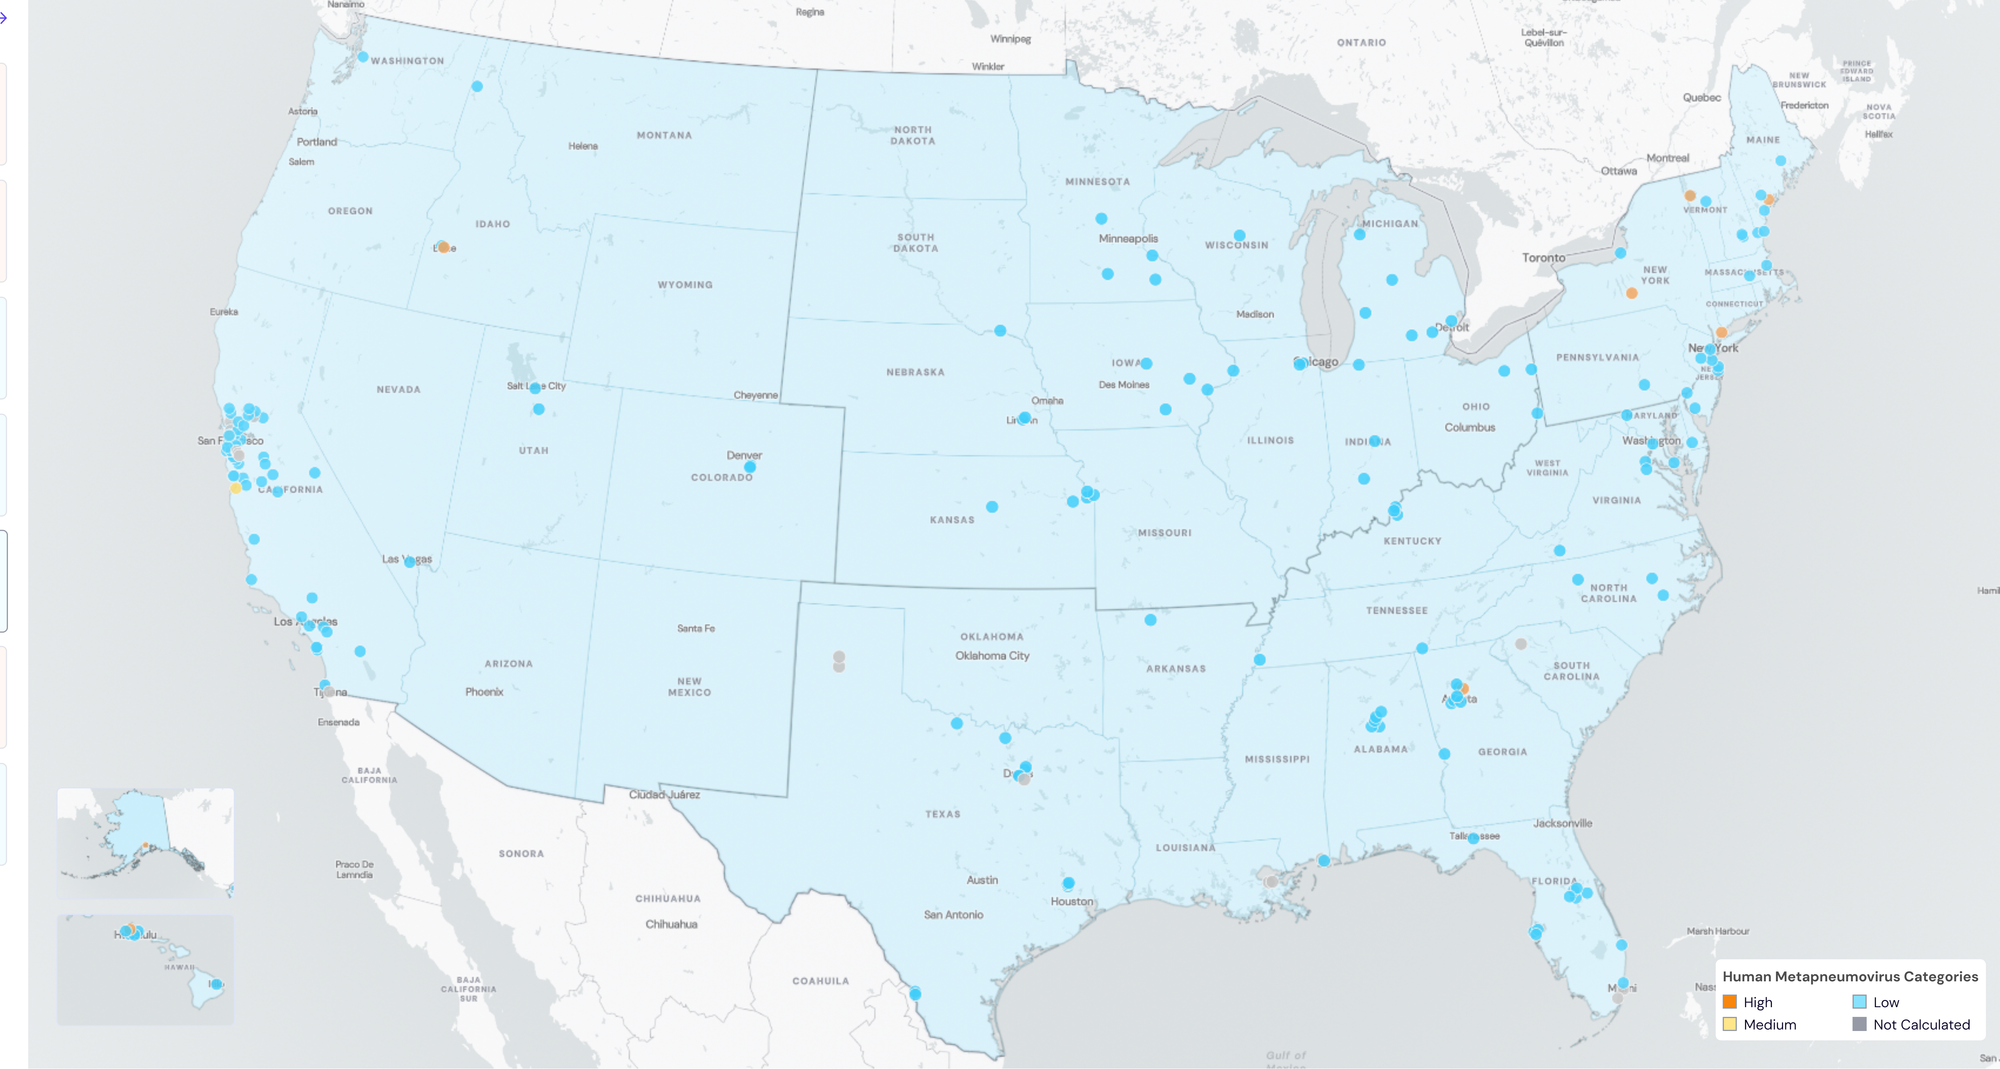
Below are the current HMPV wastewater categories for all WWSCAN sites, with at least 16 sites showing wastewater onset for HMPV:
- 166 are in the LOW Wastewater Category
- 1 is in the MEDIUM Wastewater Category
- 8 are in the HIGH Wastewater Category
- 16 do not have enough data to calculate (Mendenhall, Juneau, AK; South San Diego, CA; Petaluma, CA; Fremont, CA; Newark, CA; San Rafael, CA; Union City, CA; West Railroad, San Rafael, CA; South Miami, FL; Key Biscayne, FL; Gautier, MS; Greenville, SC; Hollywood Road, Amarillo, TX; River Road, Amarillo, TX; Southside, Dallas, TX)
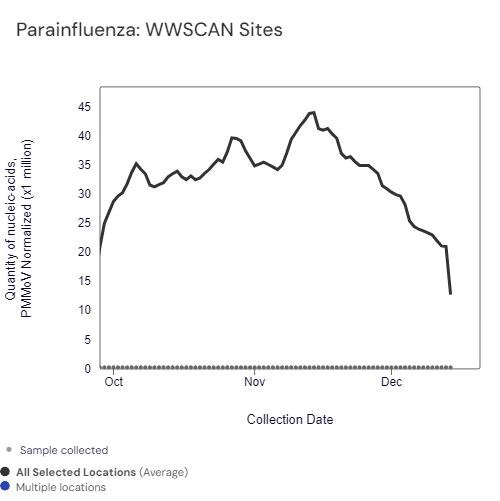
Human Parainfluenza (HPIV) RNA has been detected in ~78% of samples collected from WWSCAN sites. The HPIV median concentration across all sites over the last 21 days is 6,043 copies/gram. The population-weighted average line is shown below. You can interact with the chart of all the plants here. These data will become easier to interpret as we collect more data; we do not have enough data currently to start assessing trends or levels.
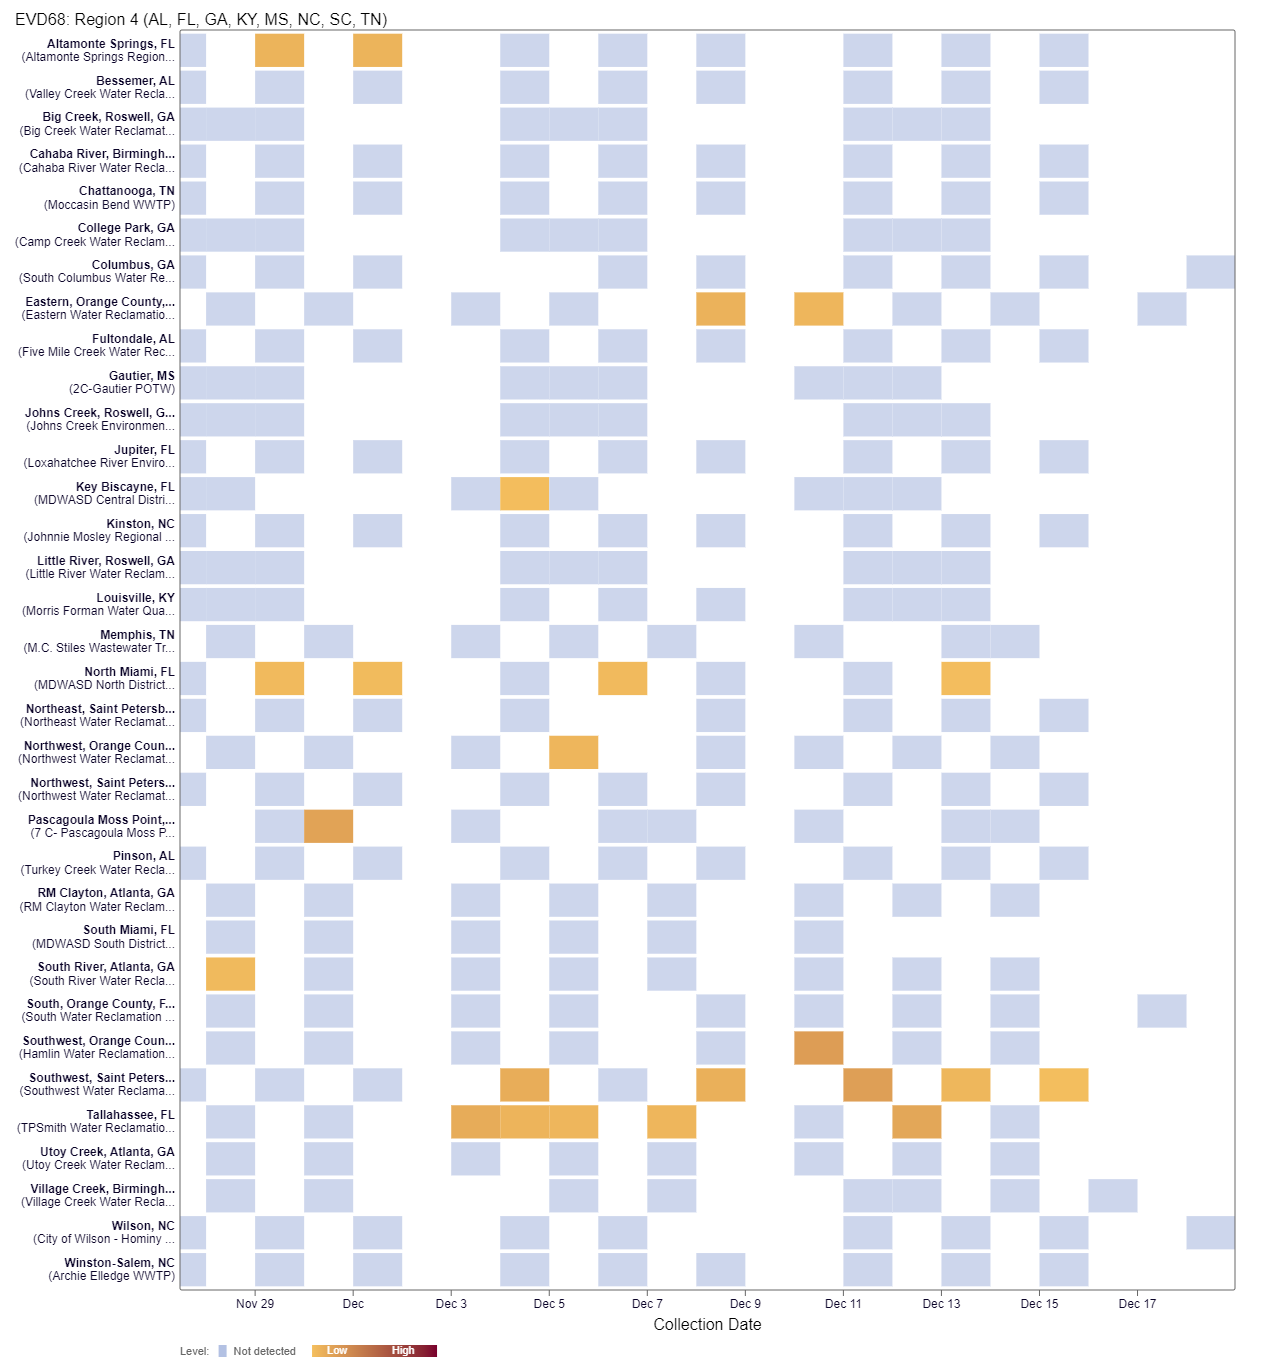
Enterovirus D68 (EV-D68) RNA was sporadically detected (4%) in samples collected in the last 21 days at most WWSCAN sites and the median concentration across all sites over the last 21 days is below the level of detection. The heat map below shows all WWSCAN sites in HHS Region 4 as a row, and each date as a column since monitoring began in September 2023. The color blue means the sample was non-detect for EV-D68 RNA and the colors get darker with higher concentrations. White indicates no sample was collected.
Gastrointestinal Pathogens
Norovirus GII, Rotavirus, and Human Adenovirus Group F
Norovirus GII (HuNoV GII) RNA has been consistently detected at the sites. The median concentration across all sites over the last 21 days is 6,830,652 copies/gram (for reference median concentration in November 2023 was 4,935,561 copies/gram). Below are the HuNoV GII RNA concentrations (normalized by PMMoV) from all participating WWSCAN sites across the country since we started monitoring in late December 2022. The population-weighted average is shown.
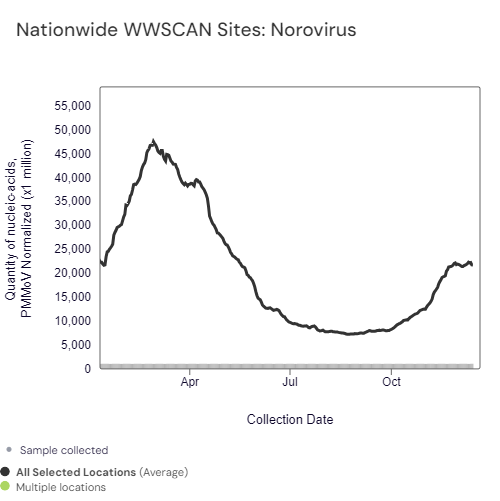
Below are the population-weighted average HuNoV GII RNA concentrations (normalized by PMMoV) from sites in the Midwest US (top left panel), Northeast US (top right panel), Southern US (bottom left panel) and Western US (bottom right panel) since we started monitoring Norovirus in late December 2022.

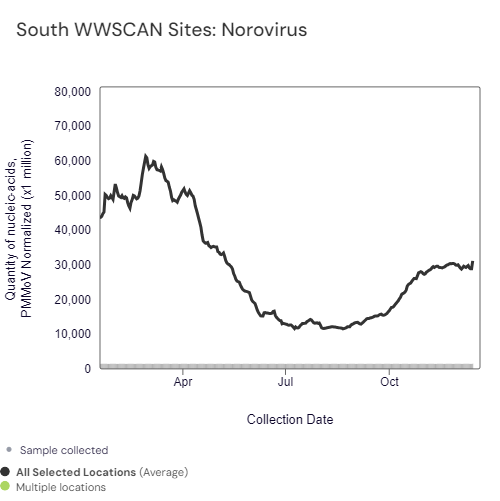


Midwest states: IA, IL, IN, KS, MI, MN, NE, OH, SD, WI. Northeast states: CT, MA, ME, NH, NJ, NY, PA, VT. Southern states: AL, AR, DE, FL, GA, KY, LA, MD, MS, NC, TN, TX, VA, WV and Washington DC. Western States: AK, CA, CO, HI, ID, NV, UT, WA.
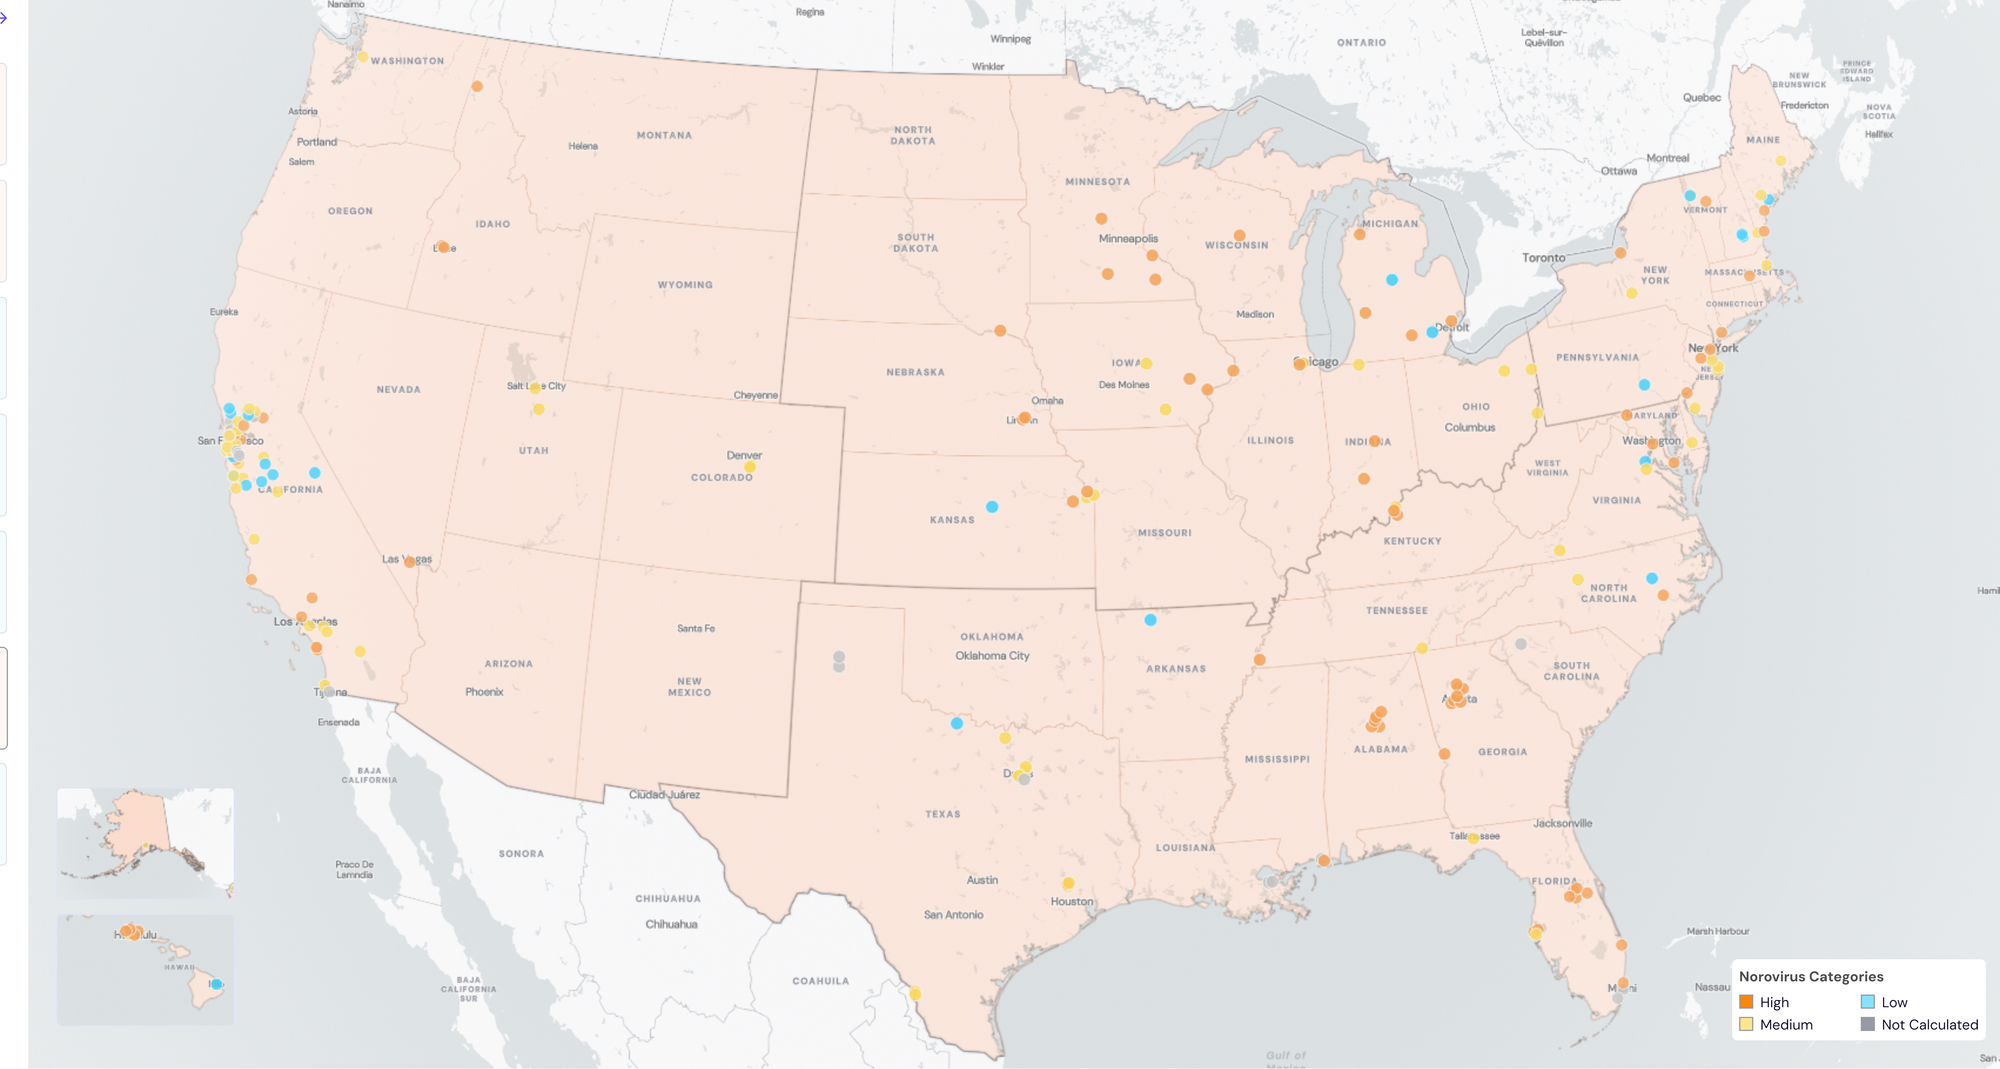
Below are the current Norovirus wastewater categories for ALL WWSCAN sites:
- 23 are in the LOW Wastewater Category
- 68 are in the MEDIUM Wastewater Category
- 84 are in the HIGH Wastewater Category
- 16 do not have enough data to calculate (Mendenhall, Juneau, AK; South San Diego, CA; Petaluma, CA; Fremont, CA; Newark, CA; San Rafael, CA; Union City, CA; West Railroad, San Rafael, CA; South Miami, FL; Key Biscayne, FL; Gautier, MS; Greenville, SC; Hollywood Road, Amarillo, TX; River Road, Amarillo, TX; Southside, Dallas, TX)
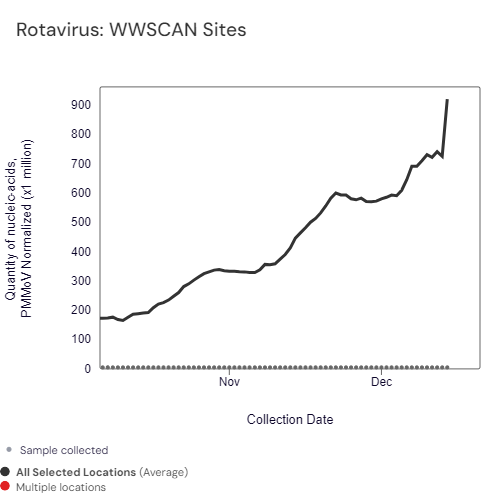
Rotavirus RNA concentrations are shown in the chart below; all the WWSCAN plants are shown together as a population-weighted average line. Rotavirus median concentrations across all sites over the last 21 days is 69,977 copies/gram. For reference, the median concentration in November 2023 was 38,418 copies/gram. You can interact with the chart of all the plants here. As we collect more data, we will be better able to interpret trends and levels of this pathogen.
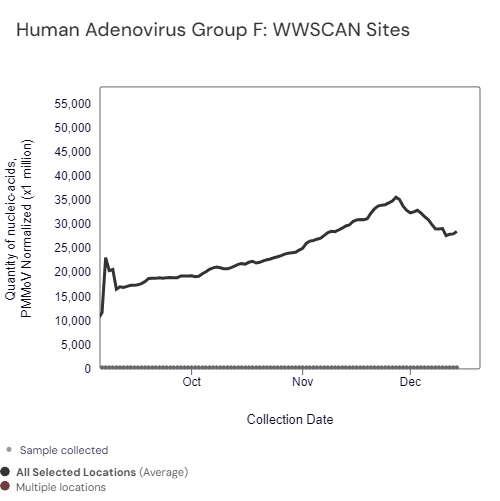
Human Adenovirus Group F DNA has been detected in ~99.6 % of samples collected from WWSCAN sites in the past 21 days. The human Adenovirus Group F median concentration across all sites over the last 21 days is 7,131,203 copies/gram (for reference median concentration in November 2023 was 7,162,135 copies/gram). Concentrations are shown in the chart below; all WWSCAN plants are shown together as a population-weighted average line. You can interact with the chart of all the plants here. As we collect more data, we will be better able to interpret trends and levels of this pathogen.
Other Pathogens of Concern
Mpox, Candida auris, and Hepatitis A
Mpox DNA We have only detected mpox DNA in 9 samples from all sites in the past 21 days. The chart below plants in HHS region 6 as rows, and the last 21 days as columns (labeled at the bottom axis). White indicates no samples, blue is non-detect for mpox DNA and red is detect for mpox DNA.
The wastewater categorization for Mpox at 175 sites is LOW. The heat map below shows recent detections in HHS region 6. 16 sites did not have enough data to calculate a category.

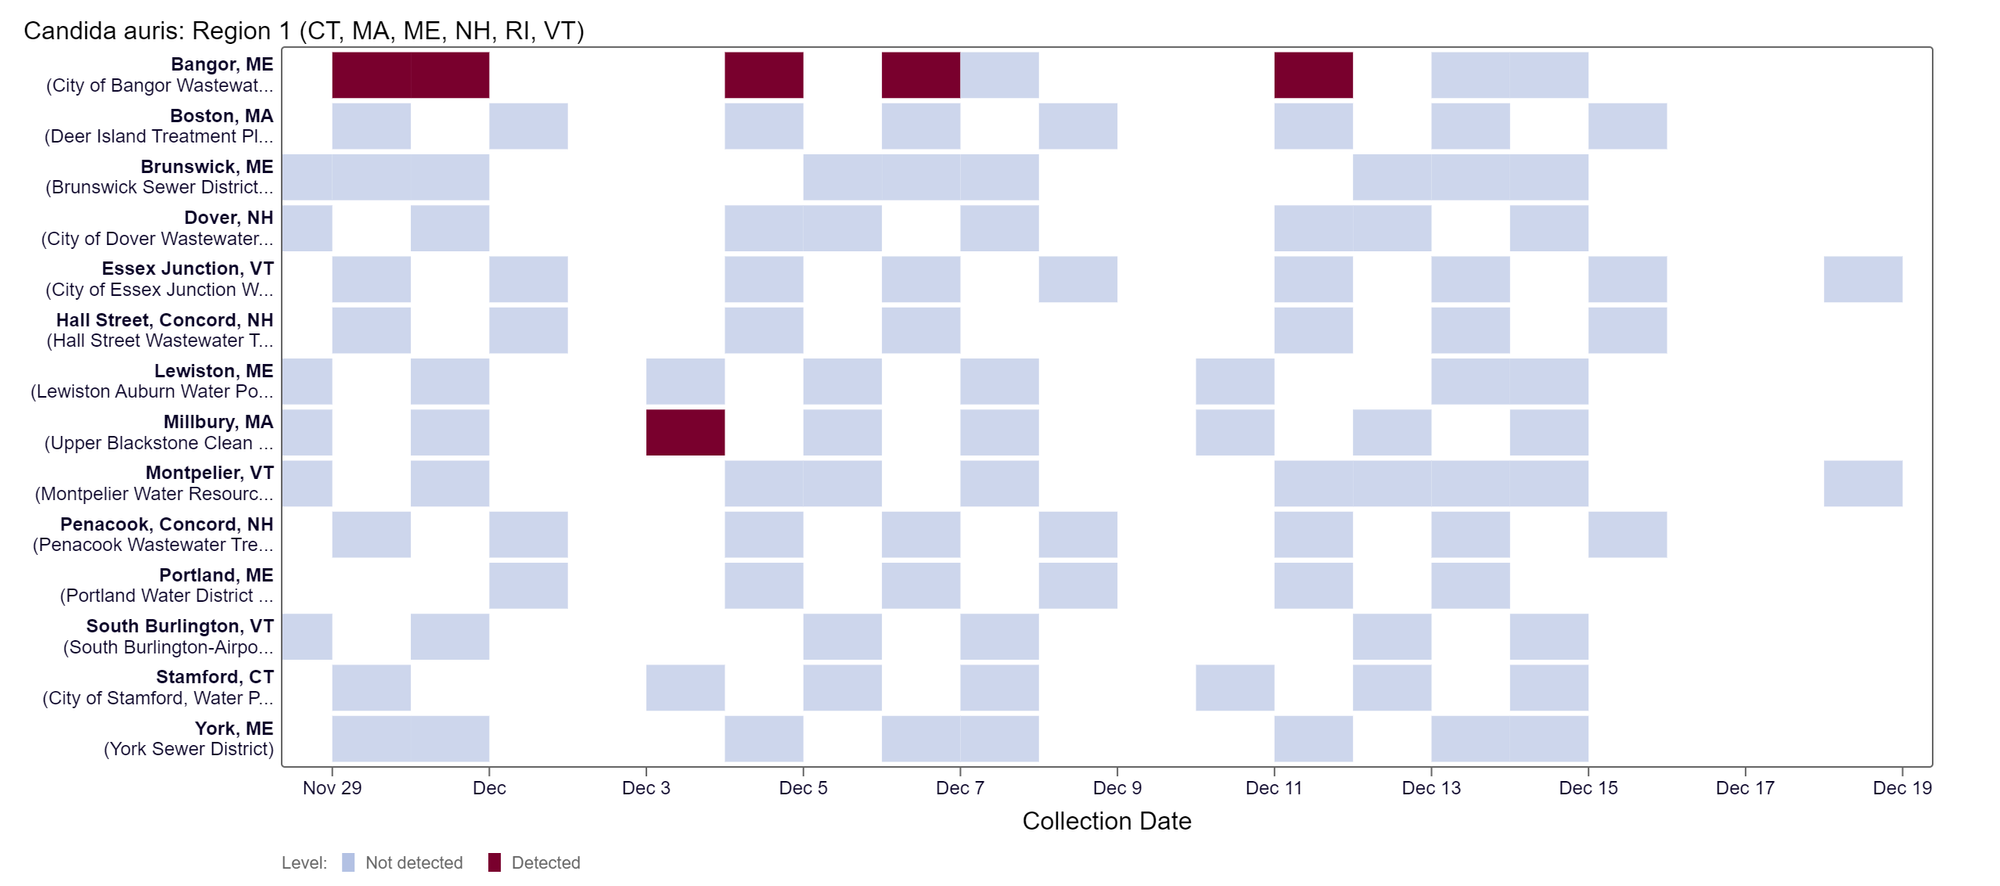
Candida auris (C.auris) DNA - We have detected C. auris DNA in 1.2% of samples from all WWSCAN sites over the past three weeks. The chart below shows each WWSCAN plant in HHS Region 1 as rows, and the last 21 days as columns (labeled at the bottom axis). White indicates no samples, blue is non-detect for C. auris DNA and red is detect for C. auris DNA.
Hepatitis A (Hep A) RNA - We have detected Hep A RNA in 12% of samples from all WWSCAN sites over the past three weeks. The chart below shows each WWSCAN plant in HHS Region 9 as rows, and the last 21 days as columns (labeled at the bottom axis). White indicates no samples, blue is a non-detect for Hep A RNA and red is a detect for Hep A RNA.

WWSCAN protocols and methods in peer reviewed publications
Protocols (Pre-analytical methods and SARS-CoV-2 analytical methods including controls):
- High Throughput RNA Extraction and PCR Inhibitor Removal of Settled Solids for Wastewater Surveillance of SARS-CoV-2 RNA
- High Throughput pre-analytical processing of wastewater settled solids for SARS-CoV-2 RNA analyses
- Quantification of SARS-CoV-2 variant mutations (HV69-70, E484K/N501Y, del156-157/R158G, del143-145, LPPA24S, S:477-505, and ORF1a Del 141-143) in settled solids using digital RT-PCR
- High Throughput SARS-COV-2, PMMoV, and BCoV quantification in settled solids using digital RT-PCR
Pre-prints and peer-reviewed publications provided WWSCAN methods:
- SARS-CoV-2
- Influenza, Human metapneumovirus, Respiratory syncytial virus, Human parainfluenza
- Mpox
- Norovirus GII
- Adenovirus group F, Rotavirus, Candida auris, Hepatitis A
- Enterovirus D68
Join us at the next WWSCAN Stakeholder call on January 12th, 2023
You can use this zoom link to join. We hope to see you there!
If you have questions about the website or anything else, please email: wwscan_stanford_emory@lists.stanford.edu.