SCAN Weekly Update - 12/20/23
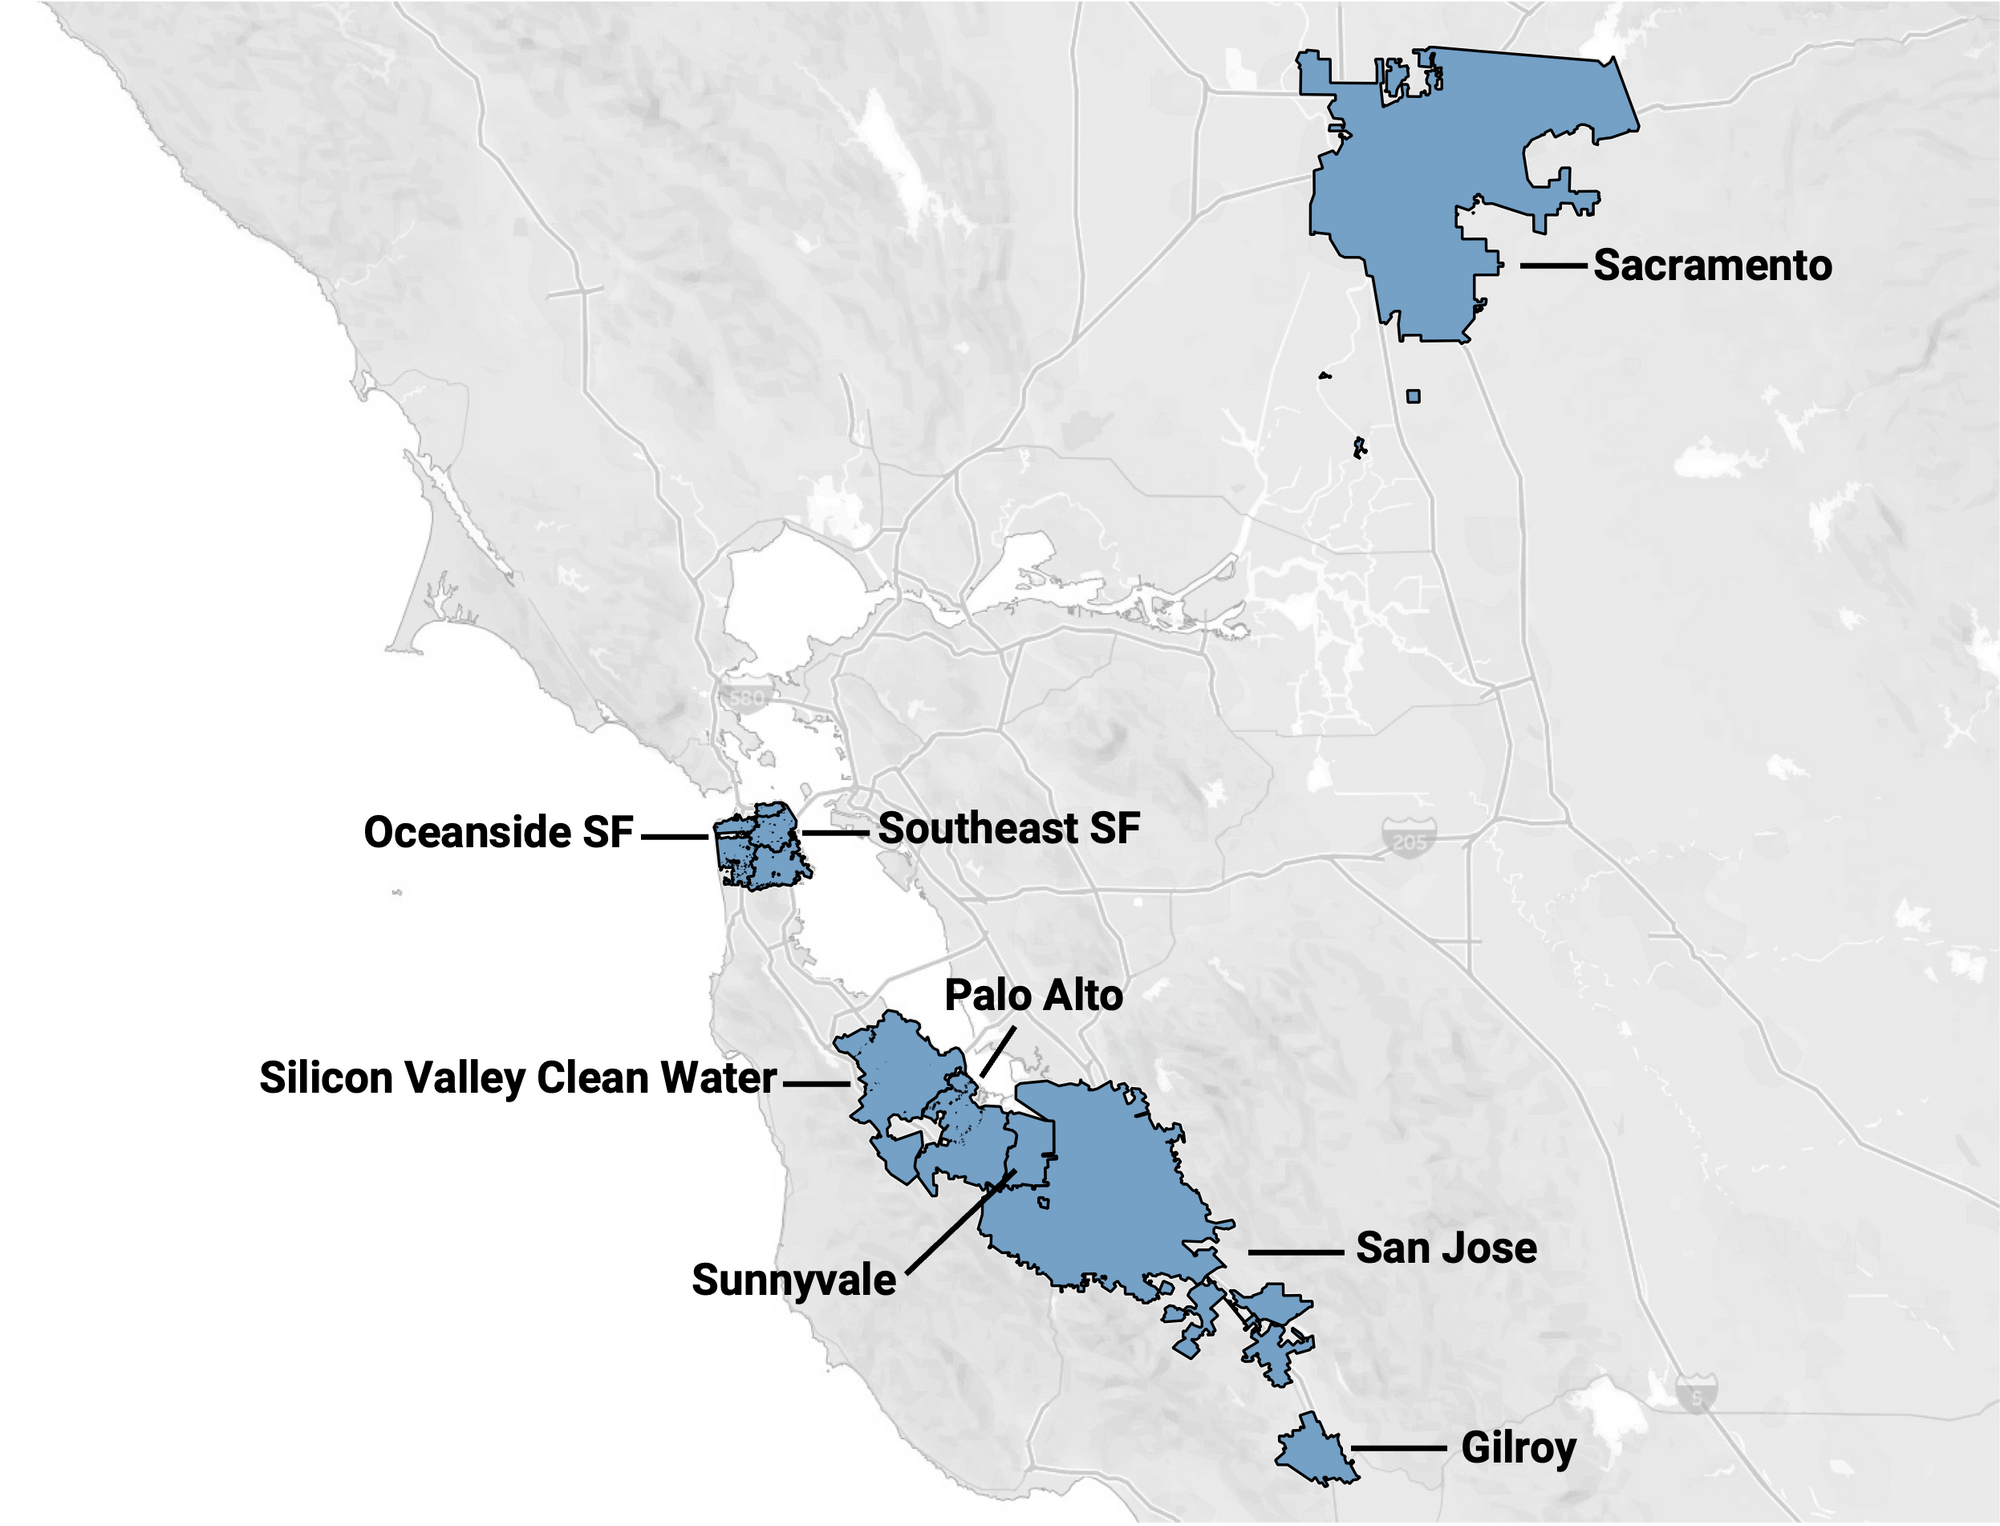
This blog post describes data collected at 8 wastewater treatment plants in the Greater Bay Area of San Francisco, CA, including Sacramento, that are partners in the SCAN project which began in late 2020. The SCAN plants are a subset of the WastewaterSCAN plants.
All samples picked up by the couriers as of 12/18/23 have been processed and their data are on the site: data.wastewaterscan.org. Please email Ali at aboehm@stanford.edu if you identify any bugs on the site.
For more information about the Wastewater Categorization system (i.e., how LOW, MEDIUM, or HIGH categories are determined for each pathogen), please see "How are wastewater categories determined?" in the About page for wastewaterSCAN.
COVID-19
SARS-CoV-2 and Variants
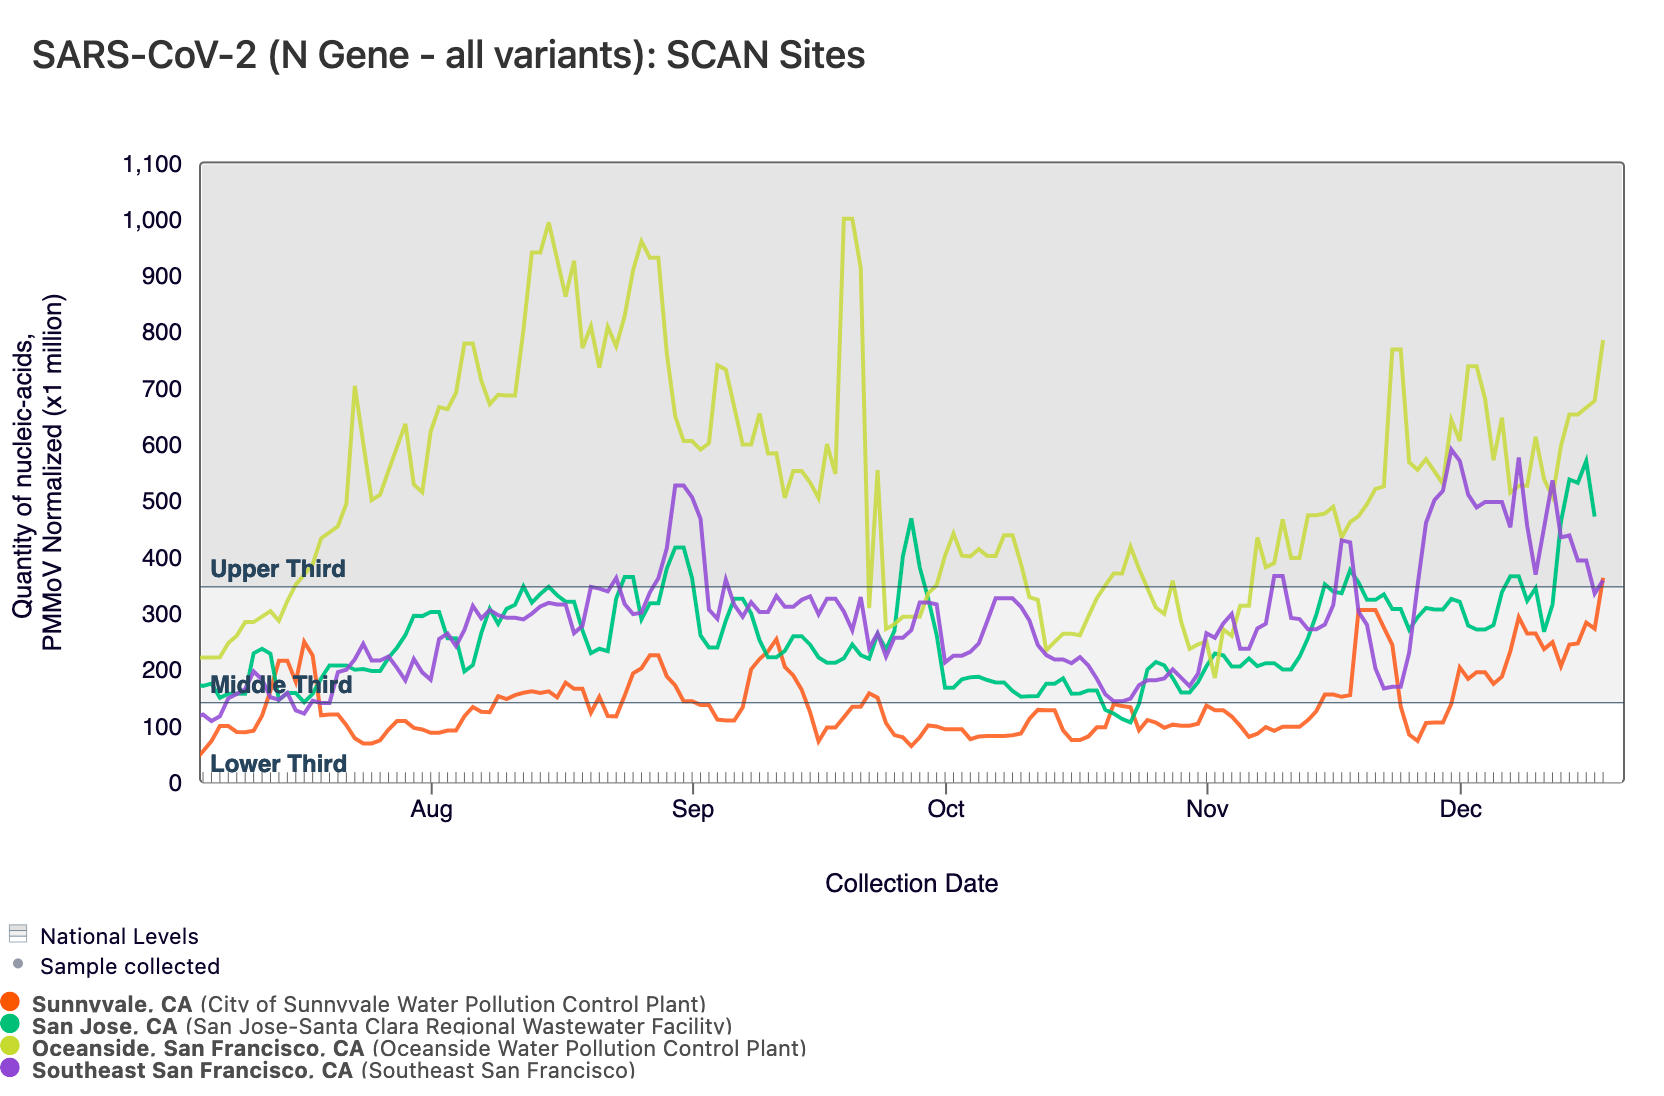
SARS-CoV-2 N gene concentrations are between 10,000 and ~1,000,000 copies/g. In the chart below, the National Levels benchmarks are superimposed on the the SARS-CoV-2 concentrations at Southeast SF, Sunnyvale, San Jose, and Oceanside SF since July.
Below are the current SARS-CoV-2 wastewater categories for the SCAN sites (recall the category is determined by both the trend and the level):
Gilroy is in the LOW Wastewater Category Palo Alt0, Sacramento, and SVCW are in the MEDIUM Wastewater CategorySoutheast SF, Sunnyvale, San Jose, and Oceanside SF are in the HIGH Wastewater Category
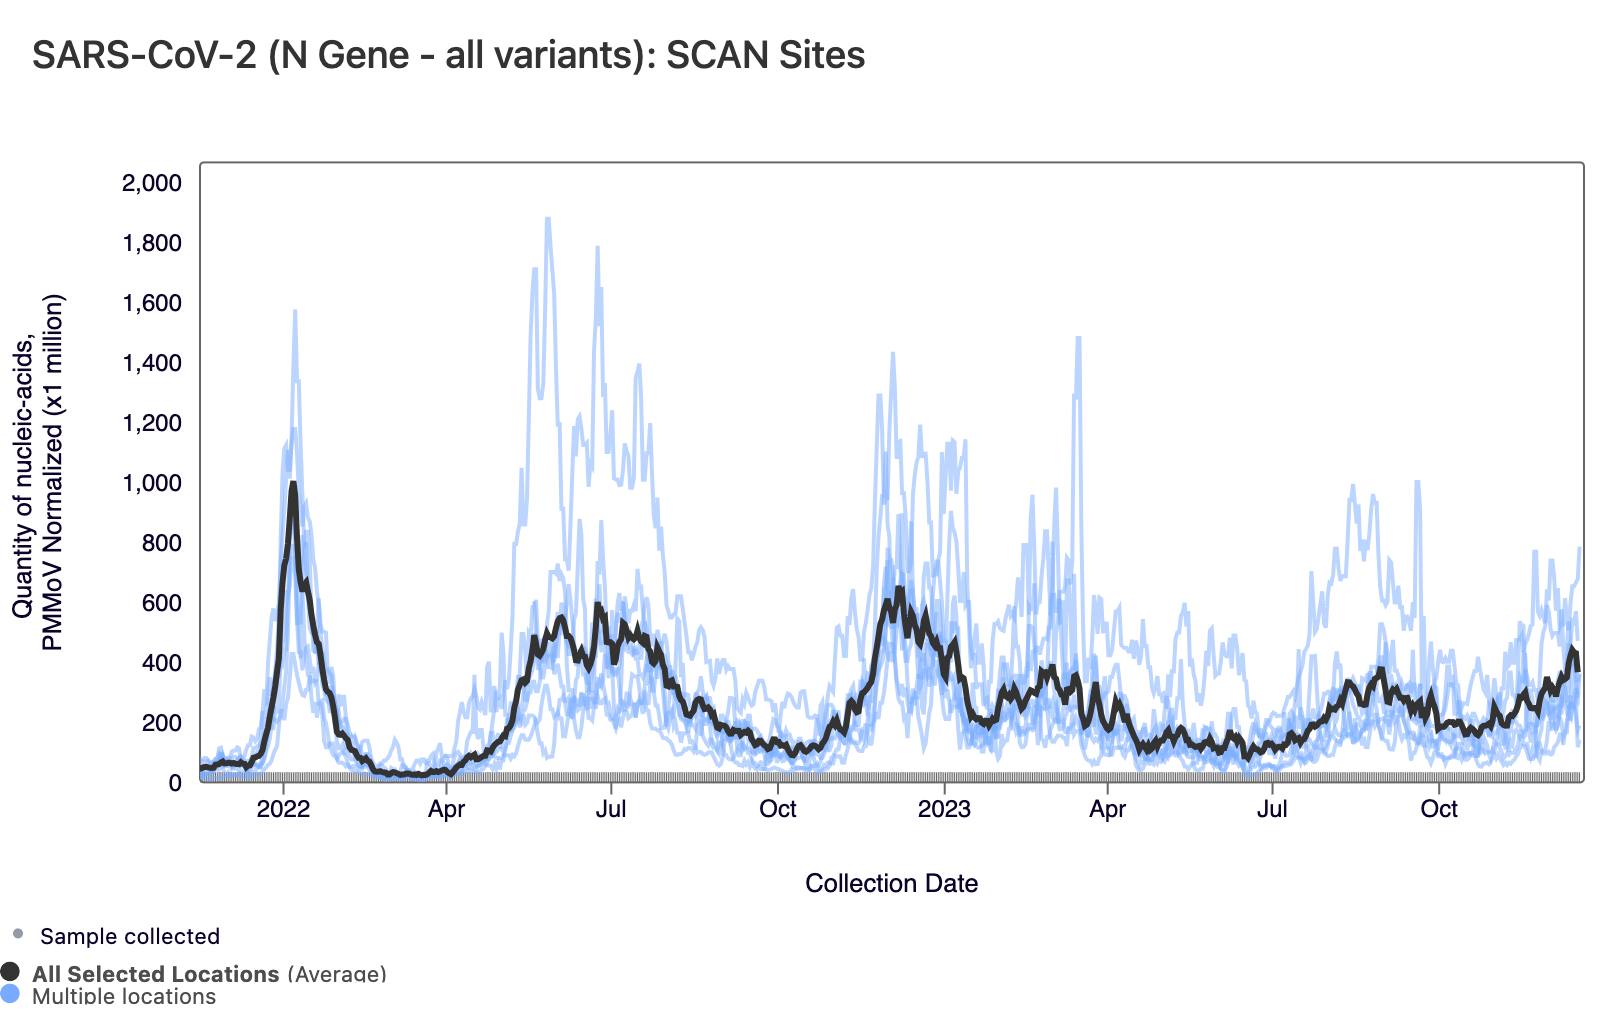
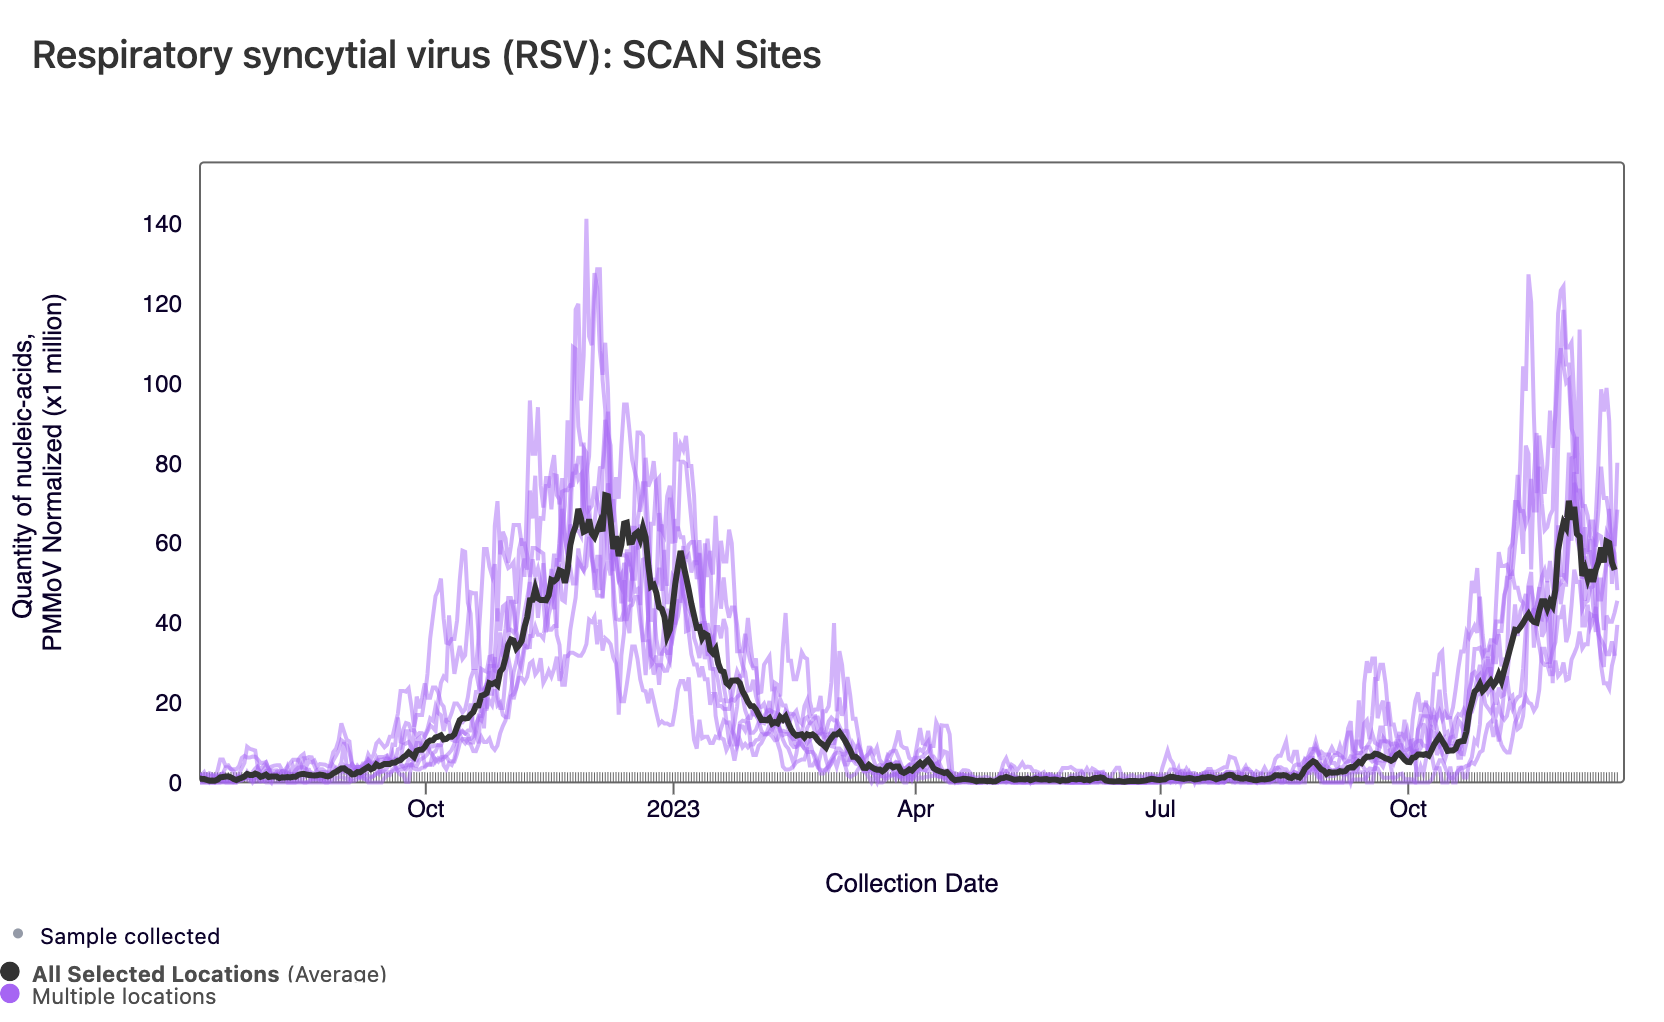
Below are all the data from all the SCAN plants for the last two years. You can access the graph here. The population weighted average across the SCAN plants is shown in black.
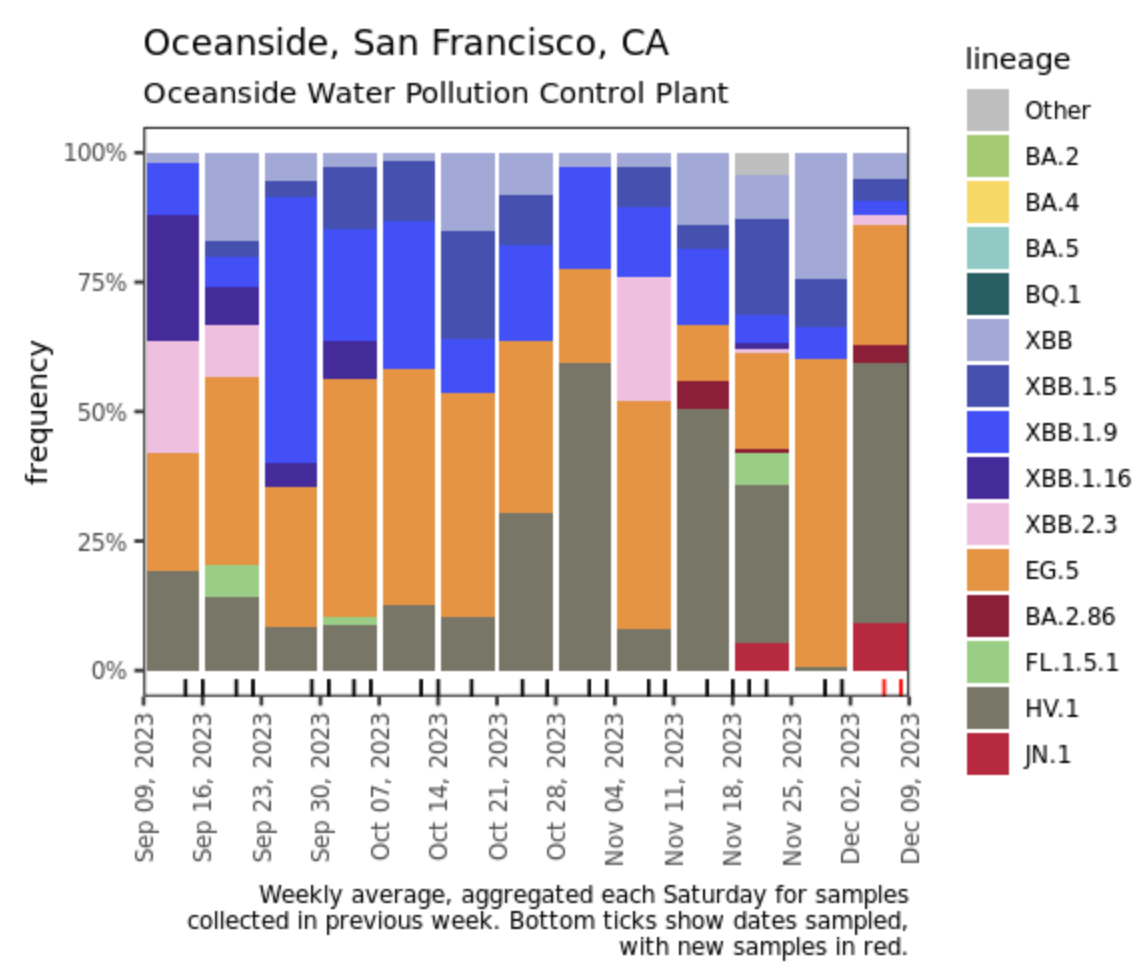
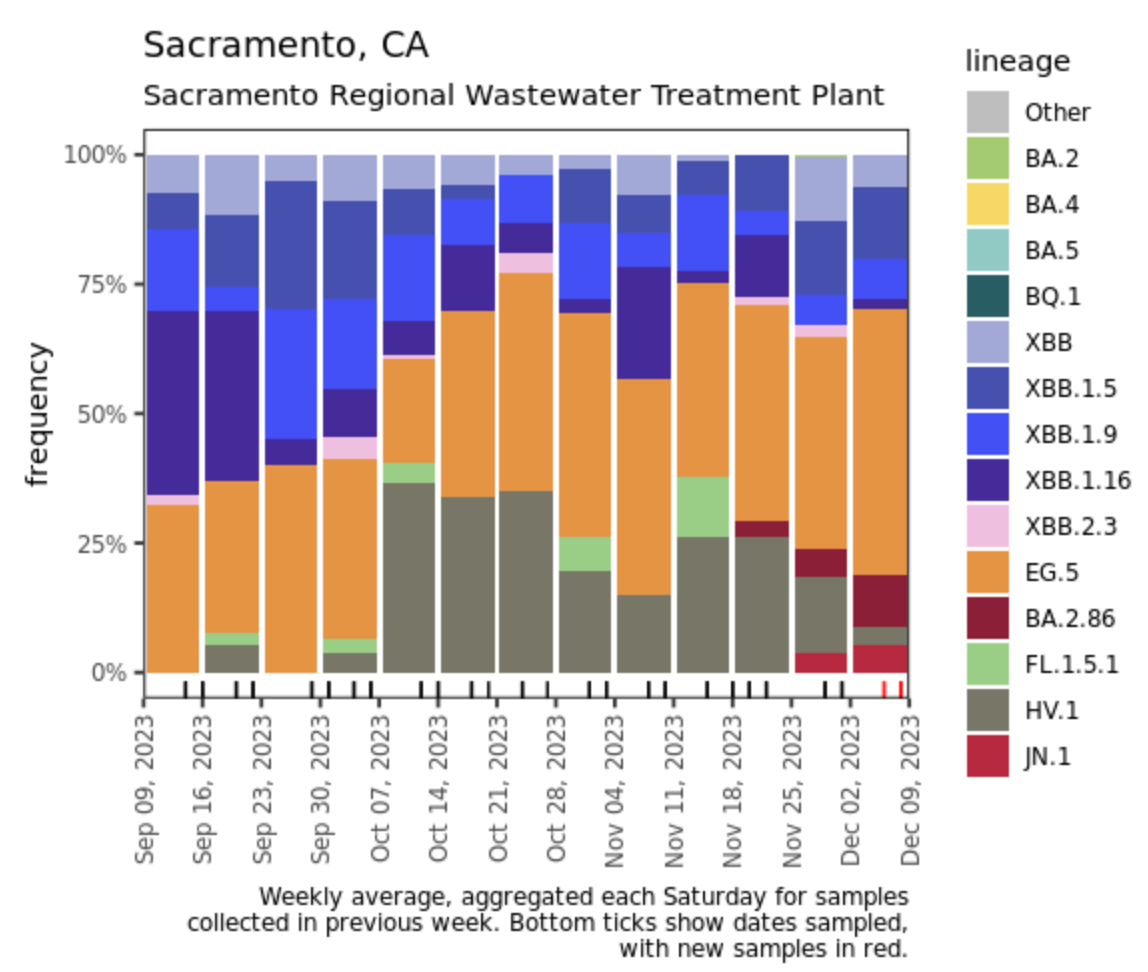
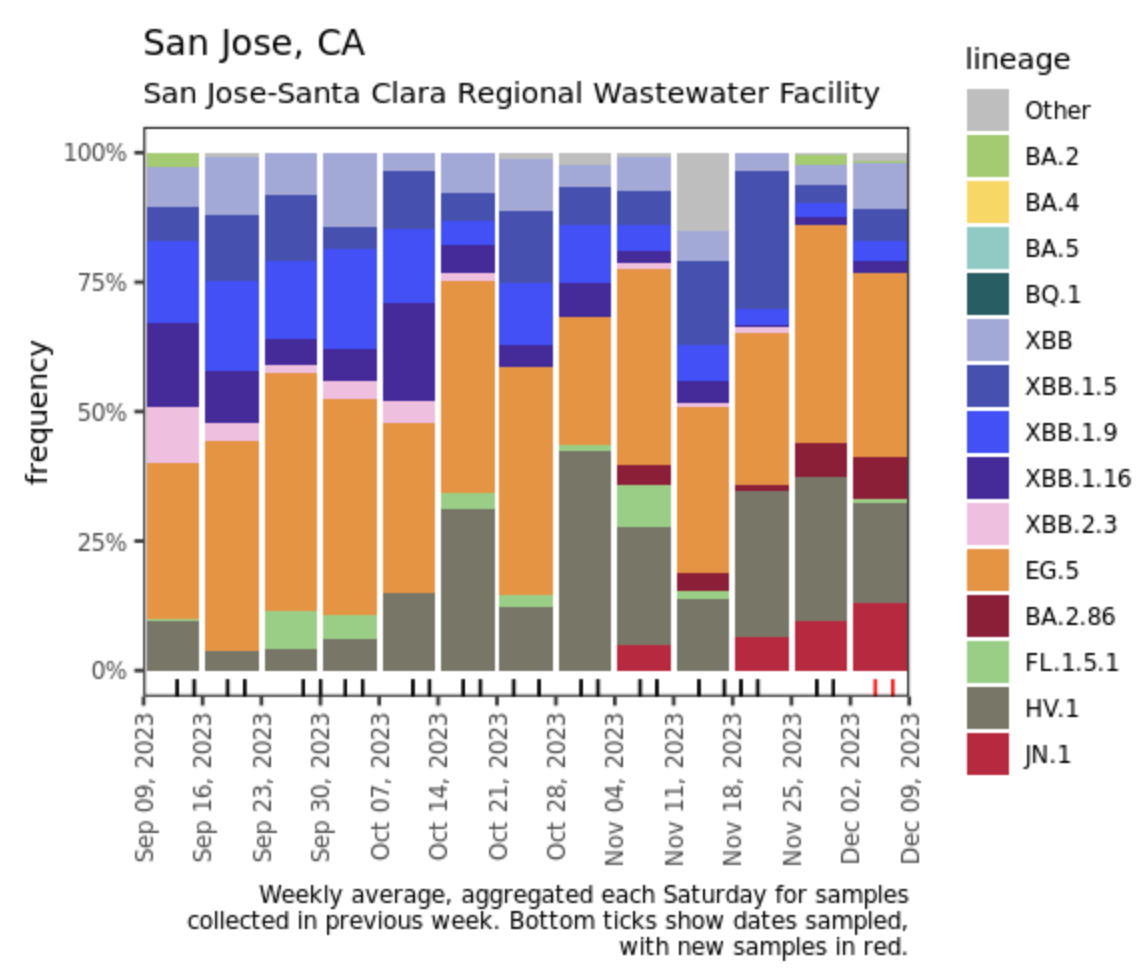
Below are plots from Oceanside SF, Sacramento, and San Jose showing the relative proportions of different variants inferred from sequencing the entire genome of SARS-CoV-2. In the most recent samples, EG.5 made up at least 20-50% of the lineages detected at Oceanside SF, Sacramento, and San Jose. In addition, BA.2.86, HV.1, and JN.1 were detected at Sacramento and San Jose, and HV.1 made up ~50% of the lineages detected at Oceanside SF. Note that the sequencing data are always from samples taken between 1- 2 weeks ago. Recent news articles have documented the "rapid spread" of JN.1.
Other Respiratory Targets
Influenza A & B, RSV, HMPV, EV-D68 and Parainfluenza
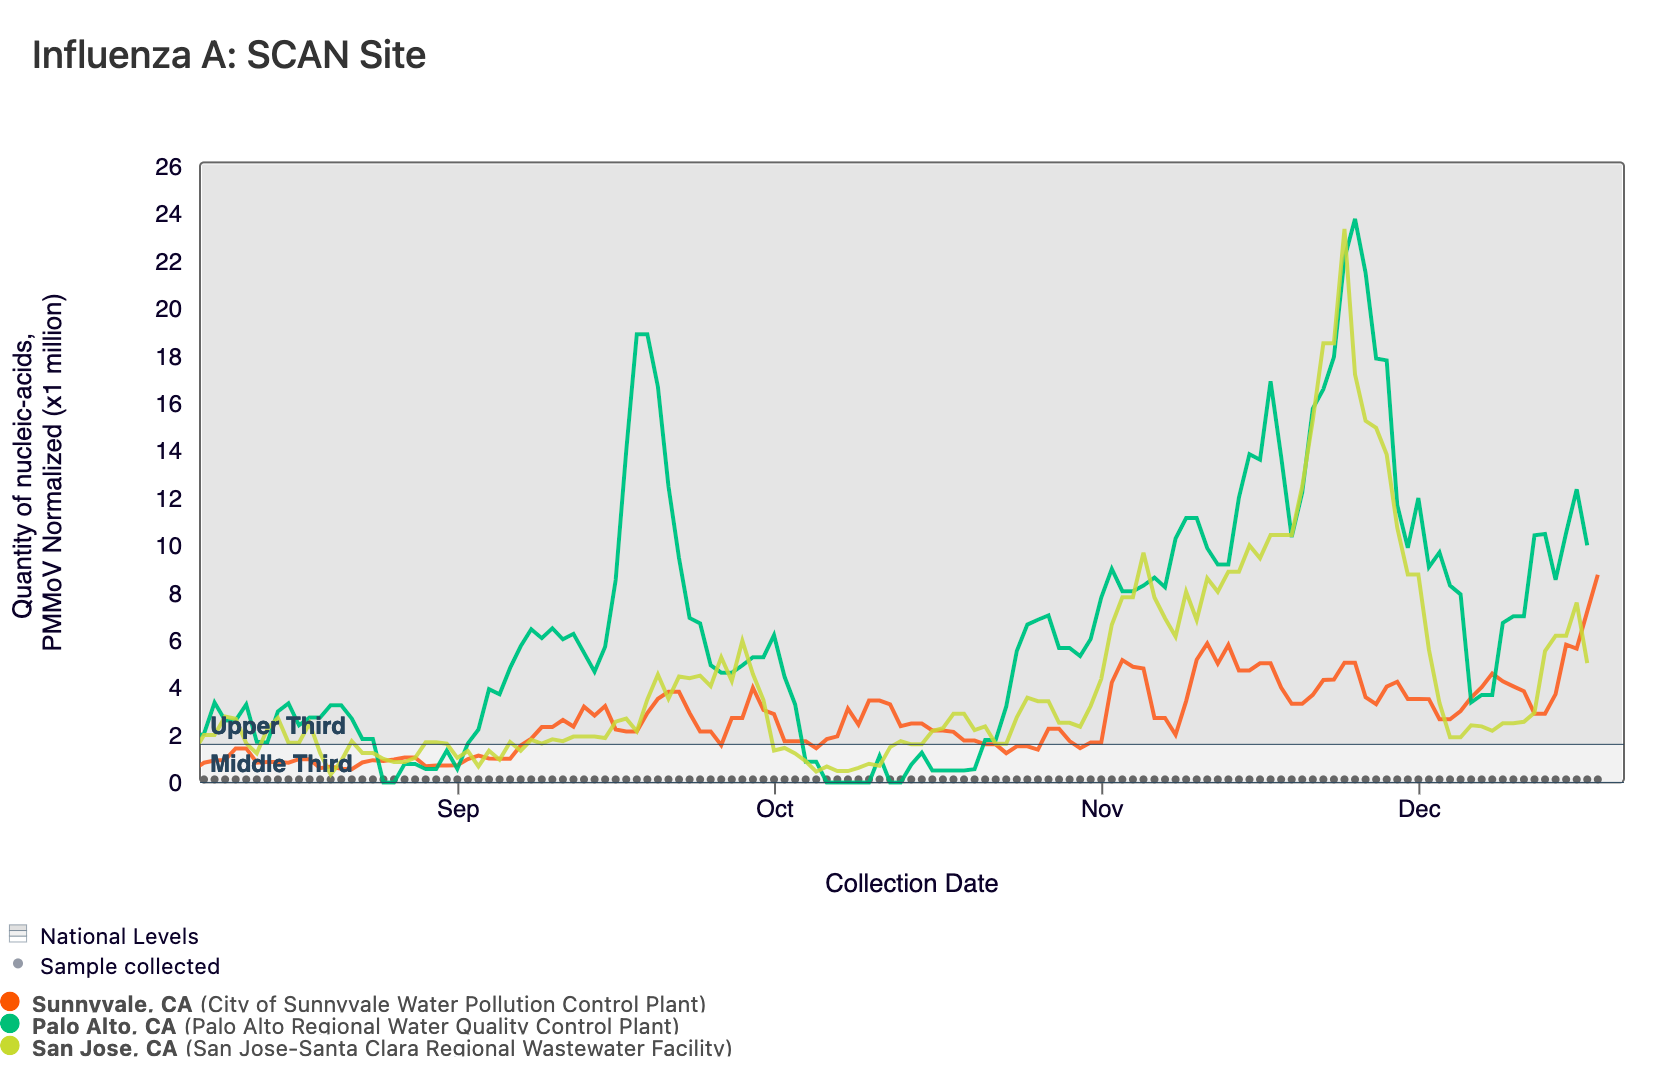
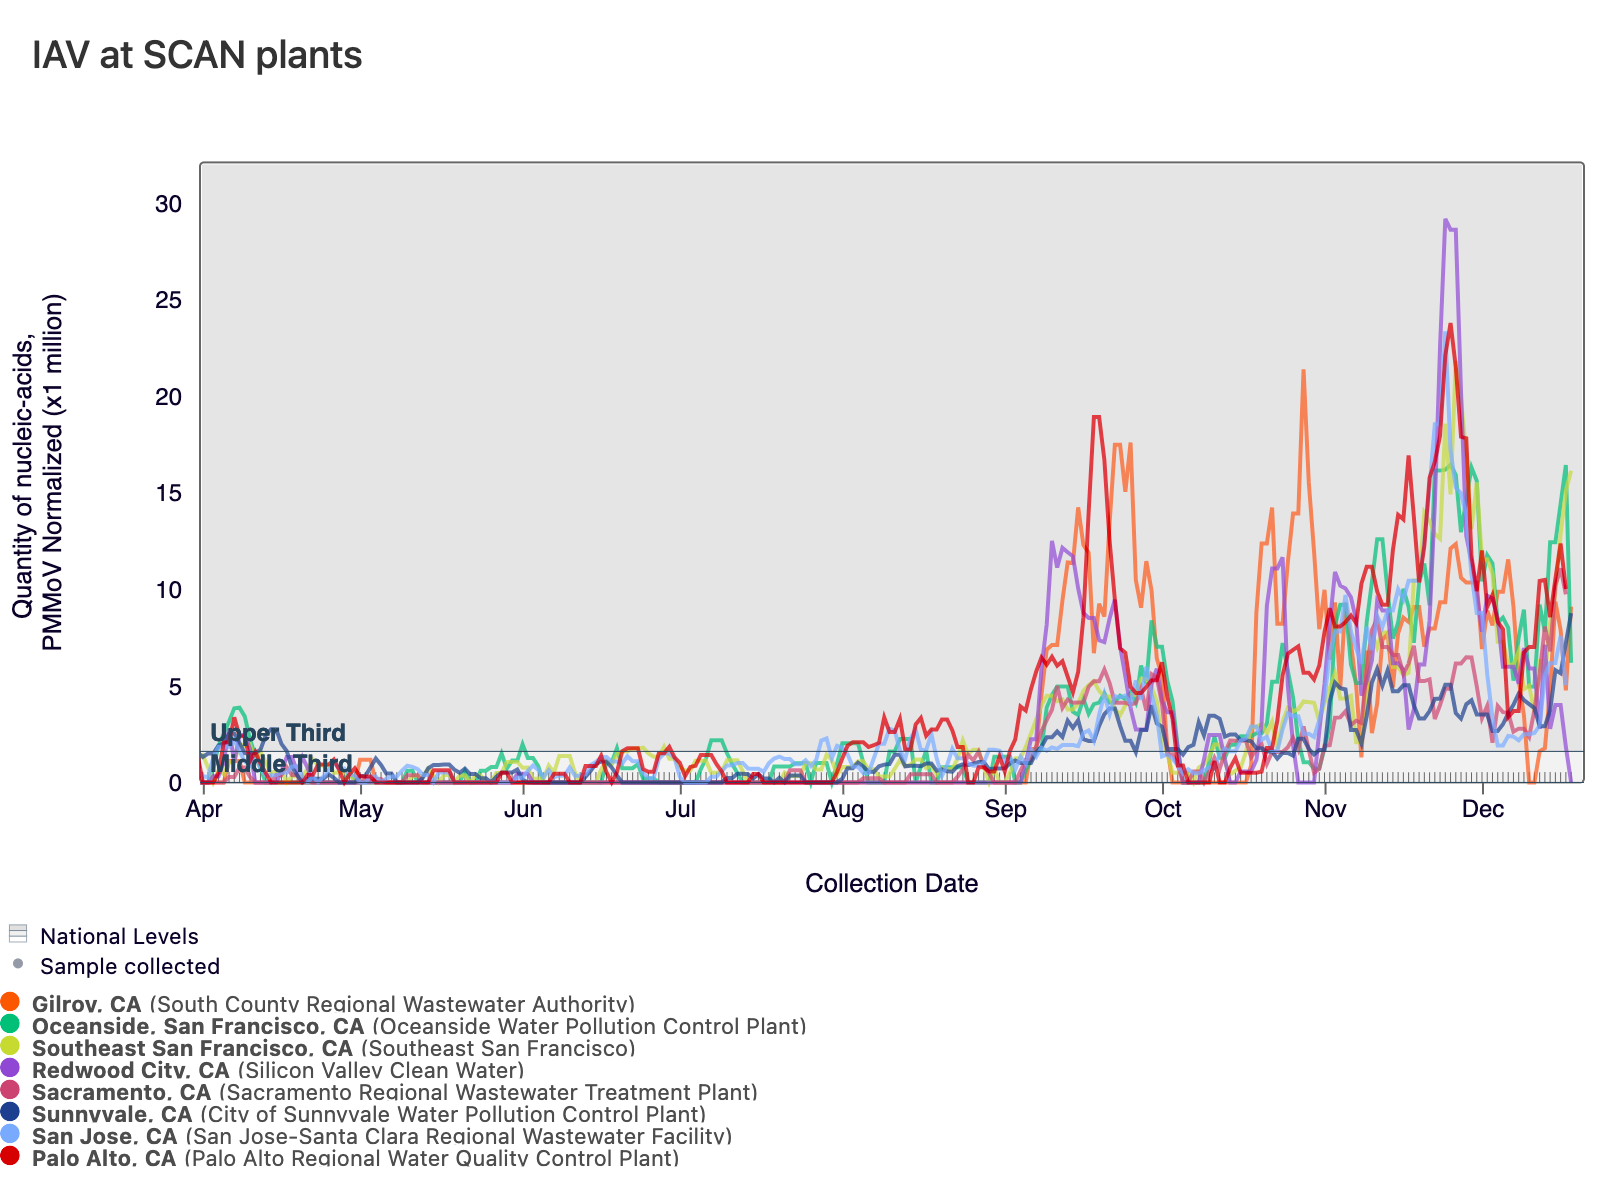
Influenza A (IAV) RNA concentrations are relatively high at most SCAN sites, and three sites have currently met the benchmark for wastewater onset (Palo Alto, San Jose, and Sunnyvale). In the chart below, the National Levels benchmarks are superimposed on the the IAV concentrations at Palo Alto, San Jose, and Sunnyvale since August.
Below are the current IAV wastewater categories for the SCAN sites (recall the category is determined by both the trend and the level):
Gilroy, Sacramento, Oceanside SF, SVCW, and Southeast SF are in the LOW Wastewater Category (not in onset)Palo Alto, San Jose, and Sunnyvale are in the HIGH Wastewater Category (in onset)
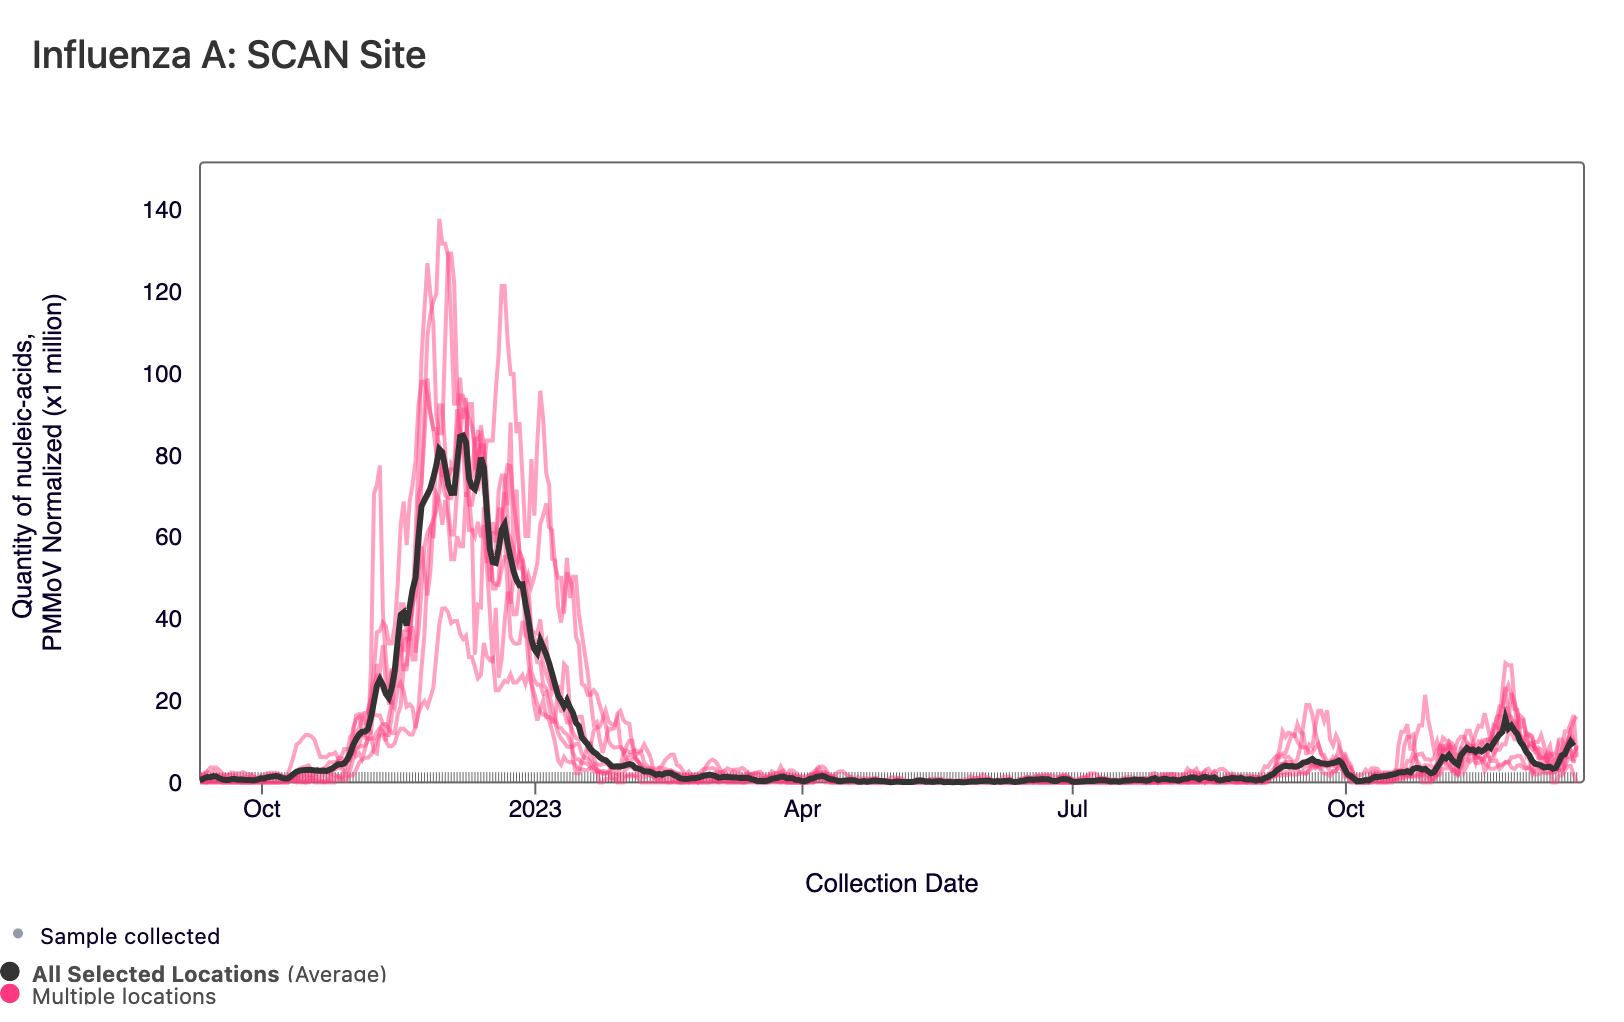
In the chart below, the population weighted average line across all the SCAN plants is shown in black. The link to the chart below is here if you would like to interact with it. Last year at this time, we will in the midst of some of the highest levels of IAV; so this flu season is definitely different from last in the timing of flu season.
Below is a chart showing the National Levels benchmarks superimposed on the IAV data from the SCAN sites (you can access this chart here). Currently, SVCW has IAV concentrations in the middle third tier, and all other SCAN sites have IAV concentrations in the upper third level.
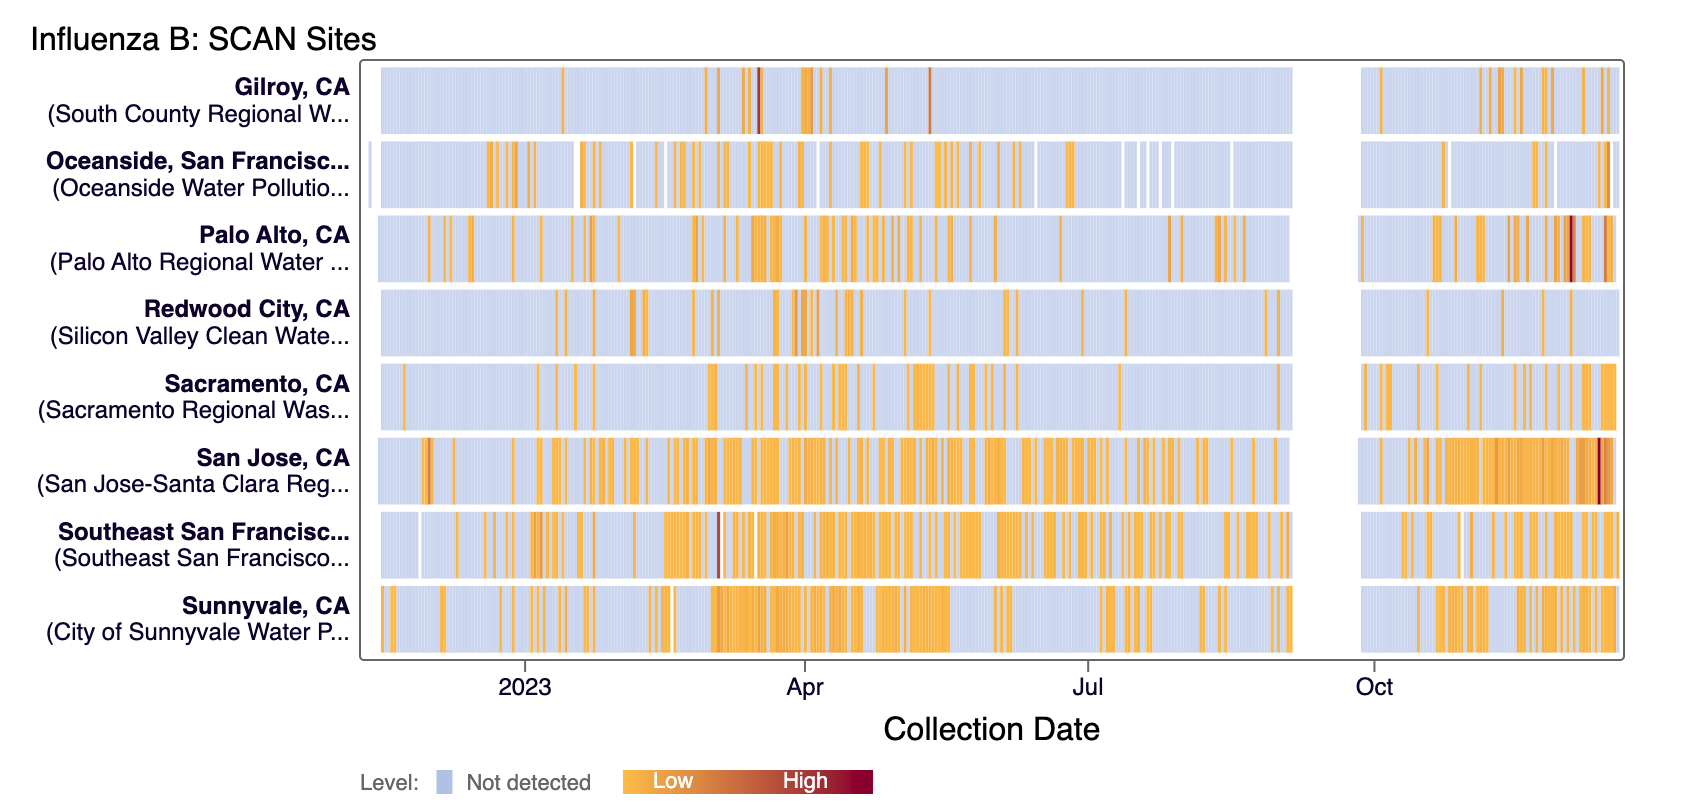
Influenza B (IBV) RNA has been detected the majority of San Jose, Southeast SF, Palo Alto, and Sunnyvale in the last 21 days. IBV has been detected sporadically at Gilroy, Sacramento, Oceanside SF, and SVCW in the last 21 days. The heat map below shows all the SCAN sites as a row and each date as a column. The color blue means the sample was non-detect for IBV RNA and the colors get darker with higher concentrations. White indicates no sample was collected. We briefly stopped monitoring for IBV, which explains gap in data across sites in September. Here is the link to the heat map chart - the linked chart will update automatically as more data are added to the site.
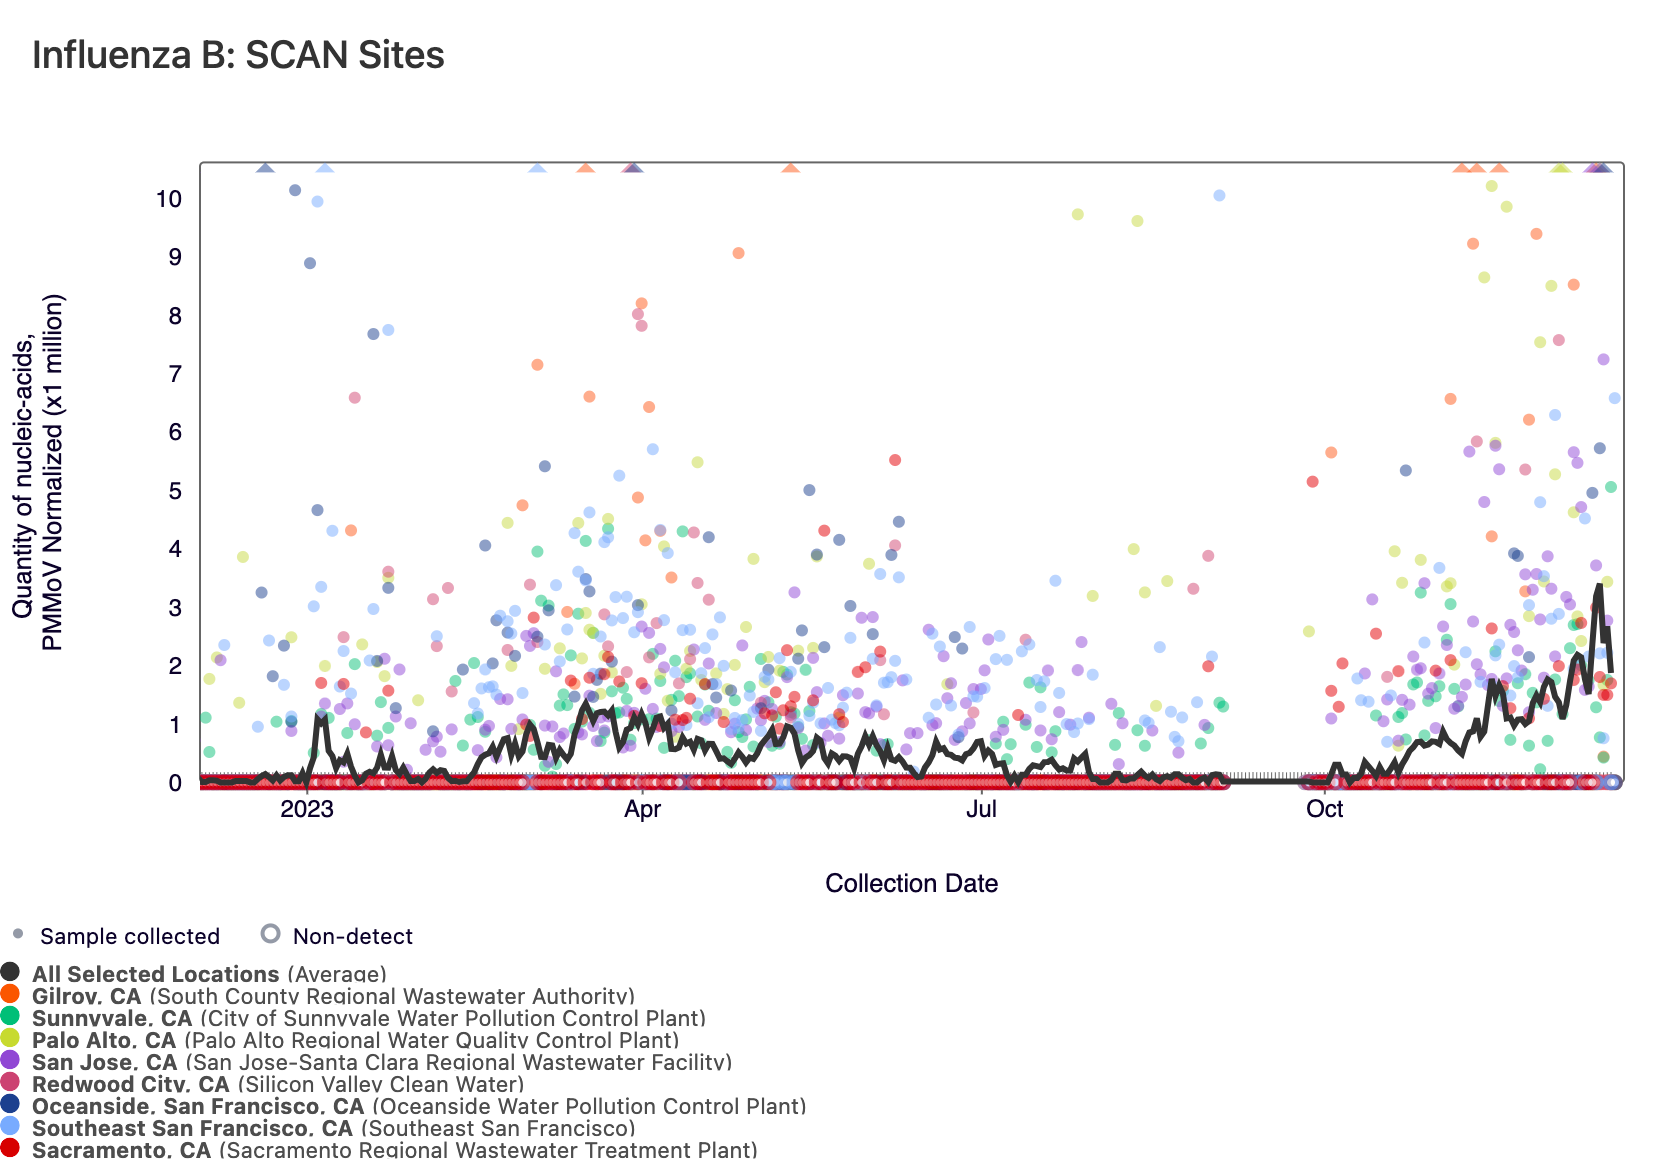
In the chart below, the population weighted average line across all the SCAN plants is shown in black and raw IBV data for the SCAN sites are shown as points. Here is the link to the chart if you want to interact with it.
RSV RNA concentrations are high at most SCAN sites, and all SCAN sites have met the benchmark for wastewater onset. In the chart below, the population weighted average line across all the SCAN plants (black) is compared to the RSV concentrations at individual SCAN plants since August.
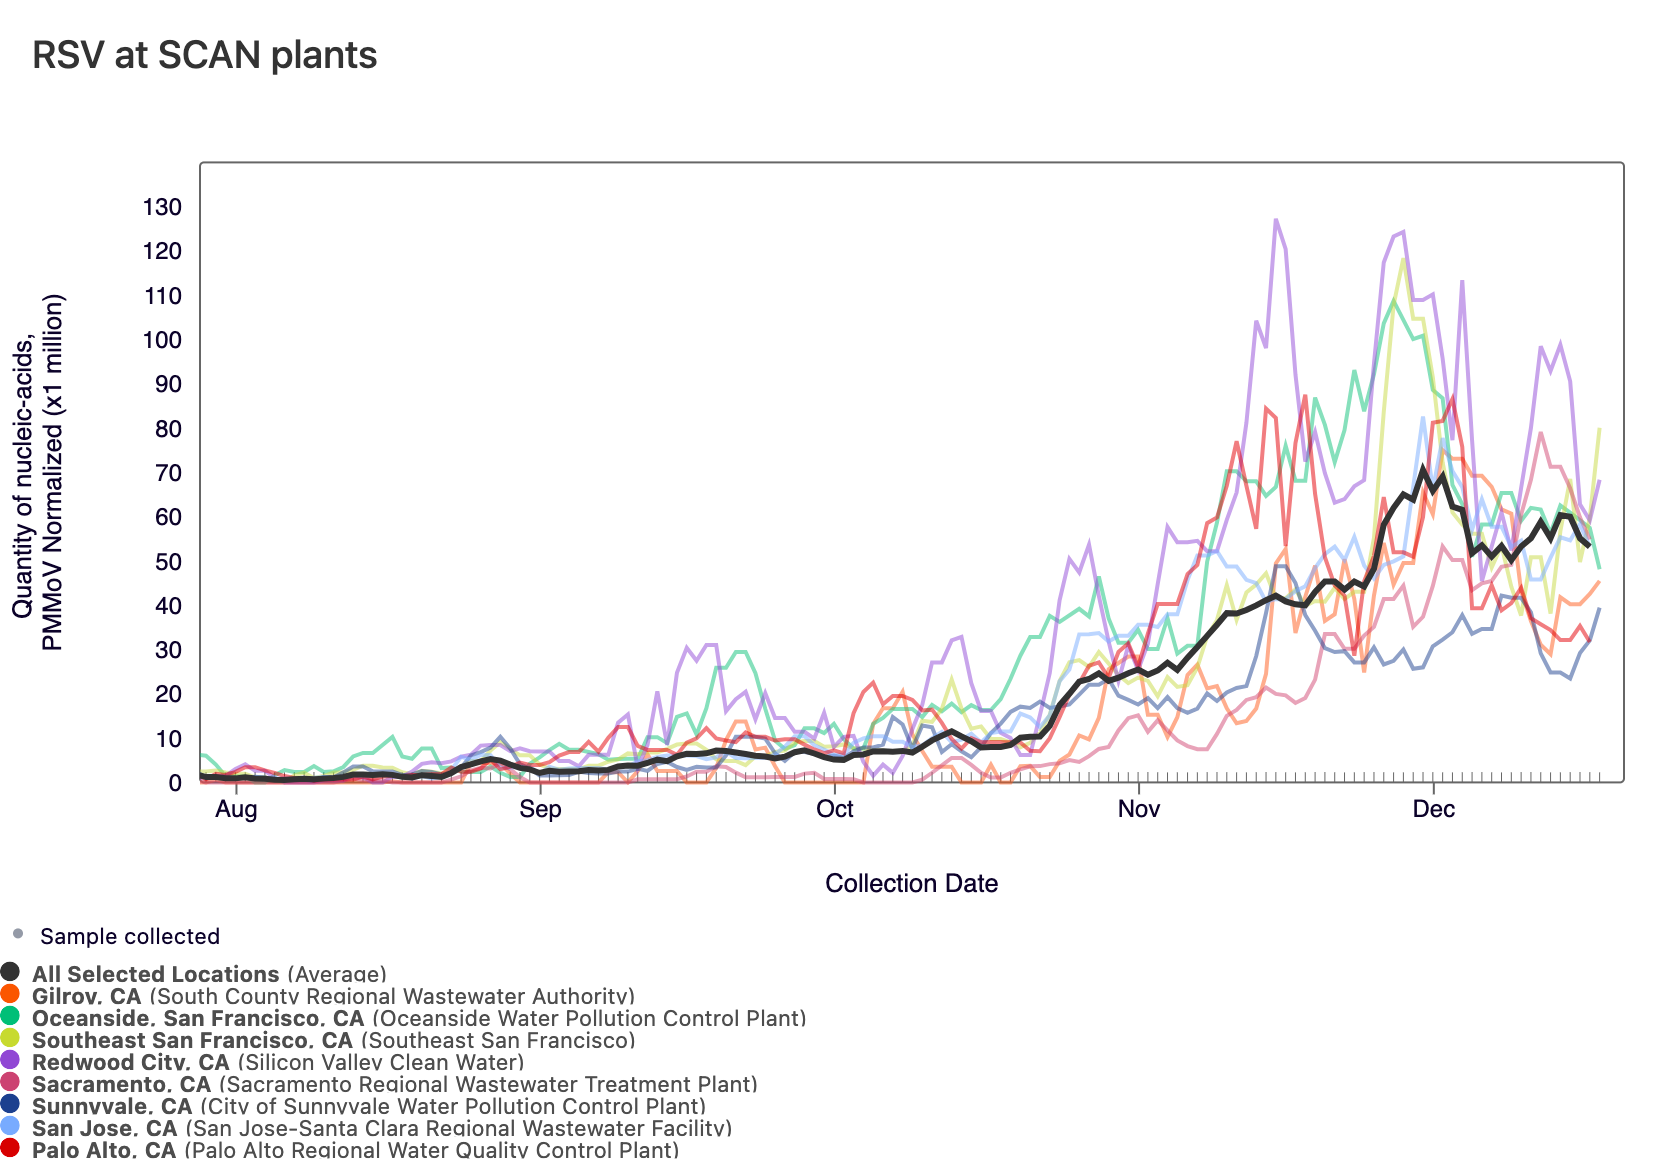
All SCAN sites are in the 'HIGH' Wastewater Category for RSV and are in onset.
In the chart below, the population weighted average line across all the SCAN sites is shown in black, and you can see the current concentrations are similar to peak RSV levels from last year. The link to the chart below is here if you would like to interact with it.
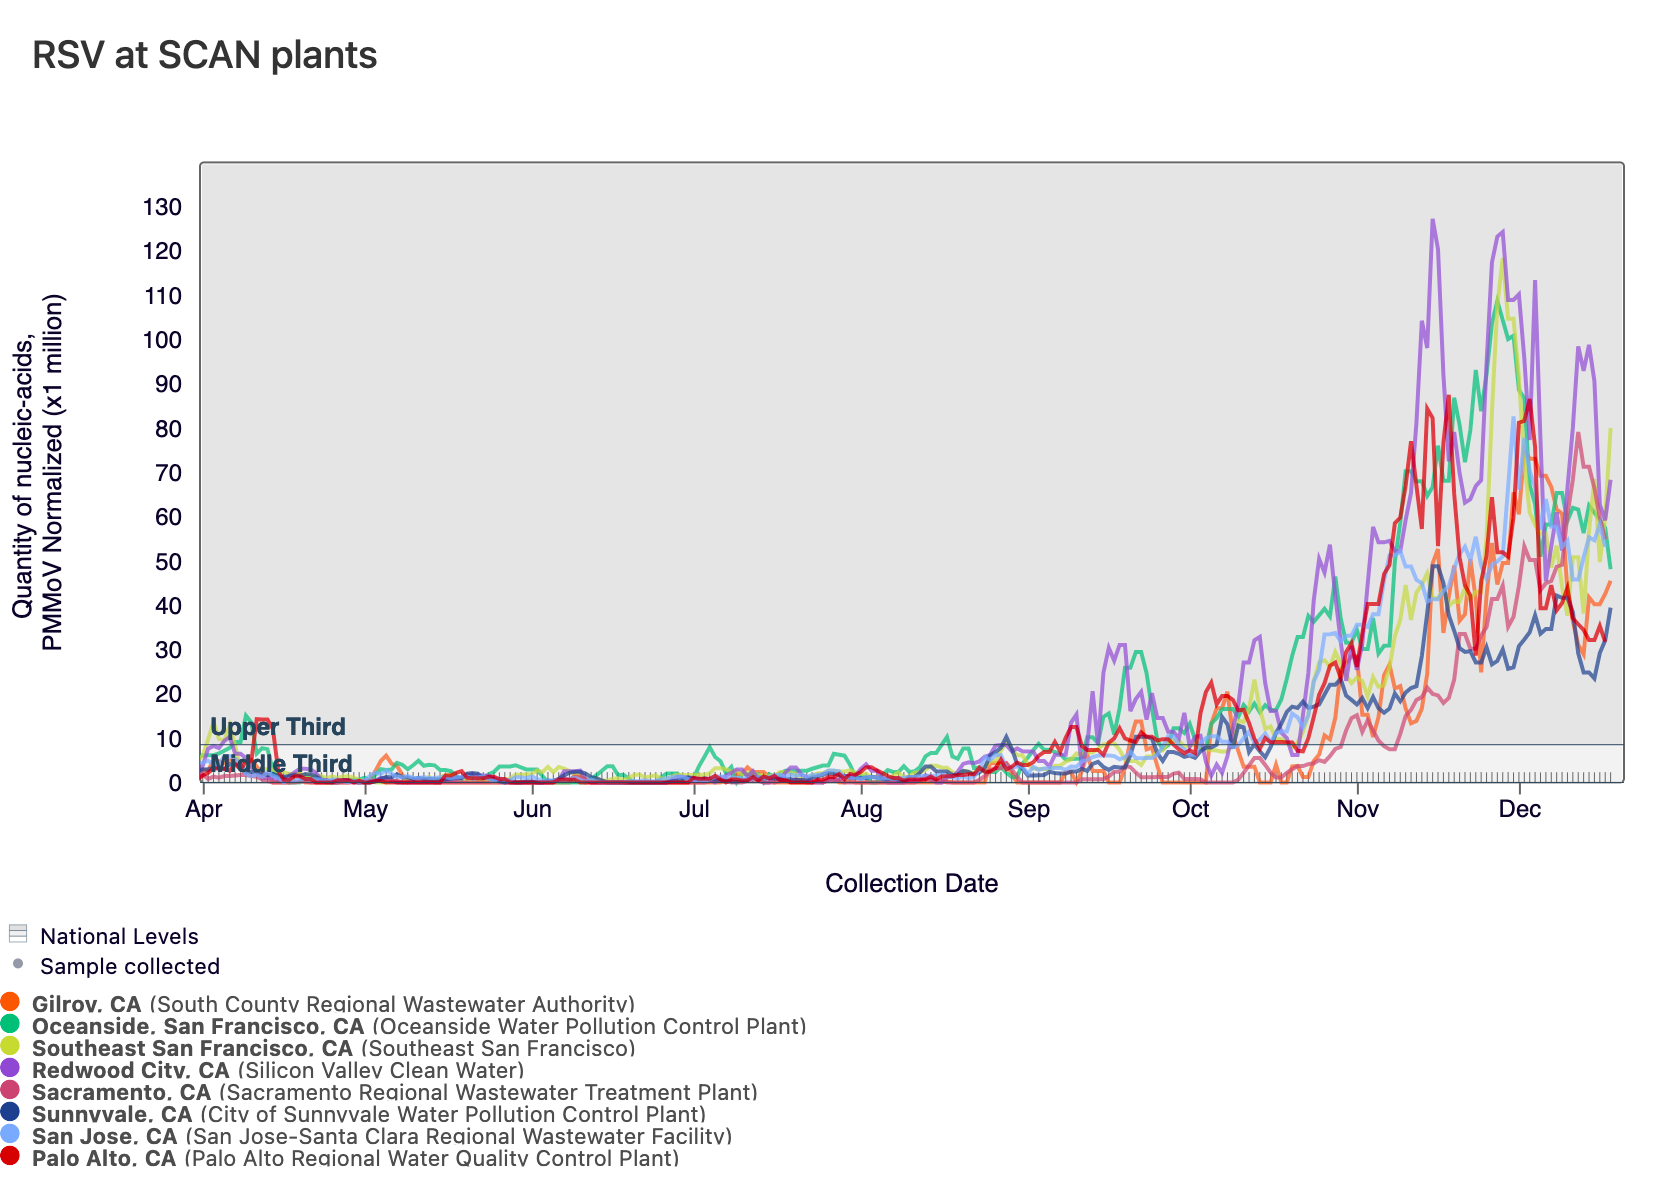
Below is a chart showing the National Levels benchmarks superimposed on the RSV data from the SCAN sites (you can access this chart here). Currently, all SCAN sites have RSV concentrations in the upper third level.
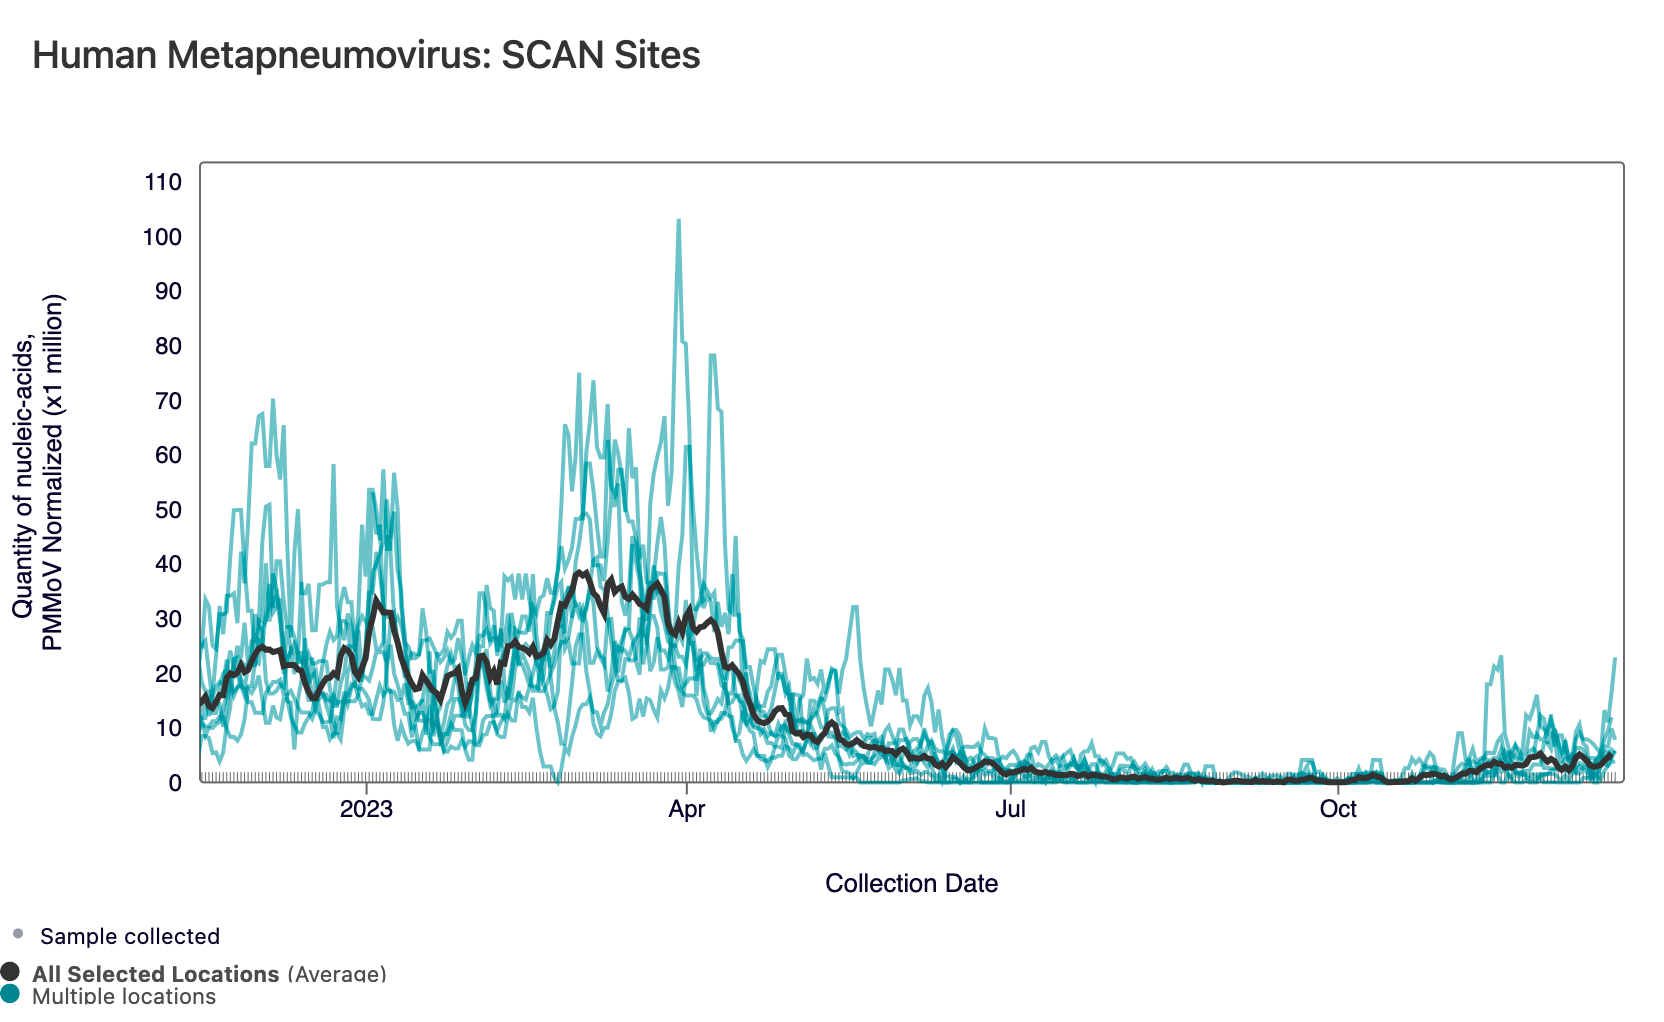
HMPV (Human metapneumovirus) RNA concentrations are low but increasing at most of plants in SCAN. However, no SCAN sites have met the benchmark for onset. In the chart below, the population weighted average line for all SCAN plants (black) is shown compared to the HMPV concentrations at individual SCAN sites since September.
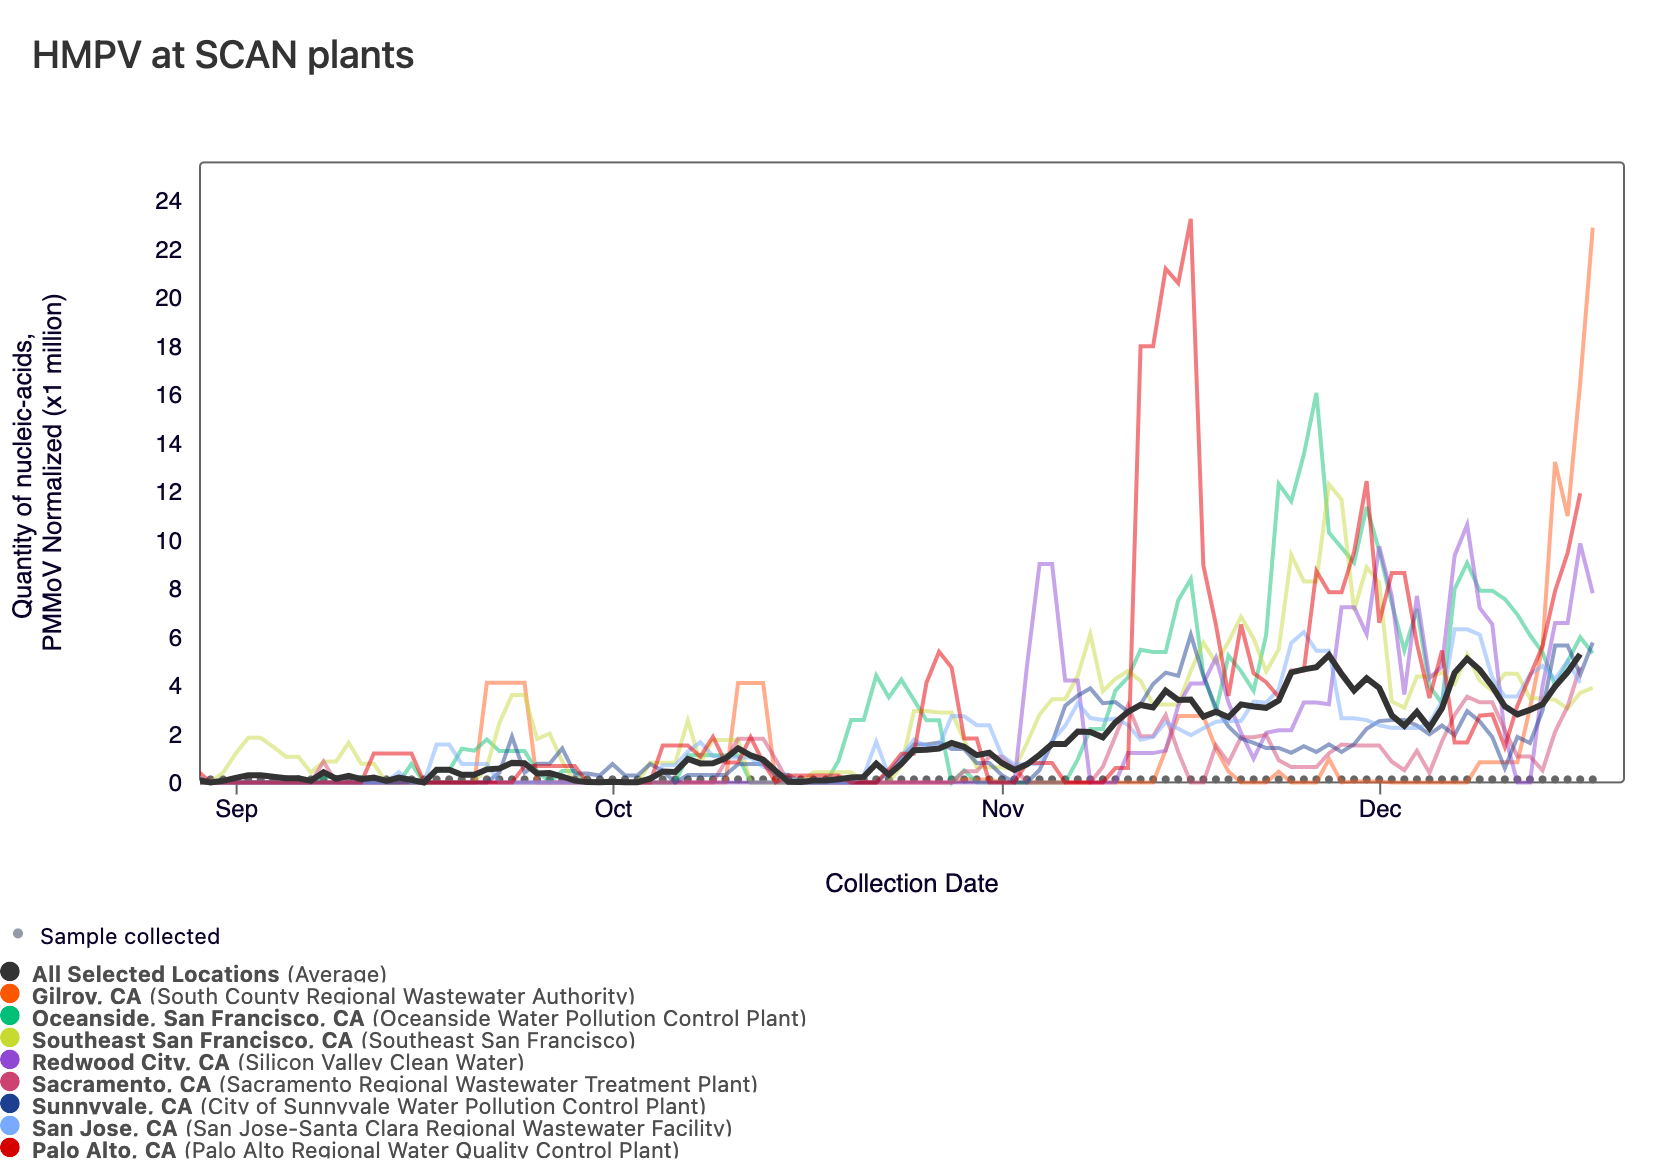
Currently all SCAN sites are in the 'LOW' category for HMPV (not in onset).
In the chart below, the population weighted average line across all the SCAN plants is shown in black (link here to this chart if you want to interact with it).
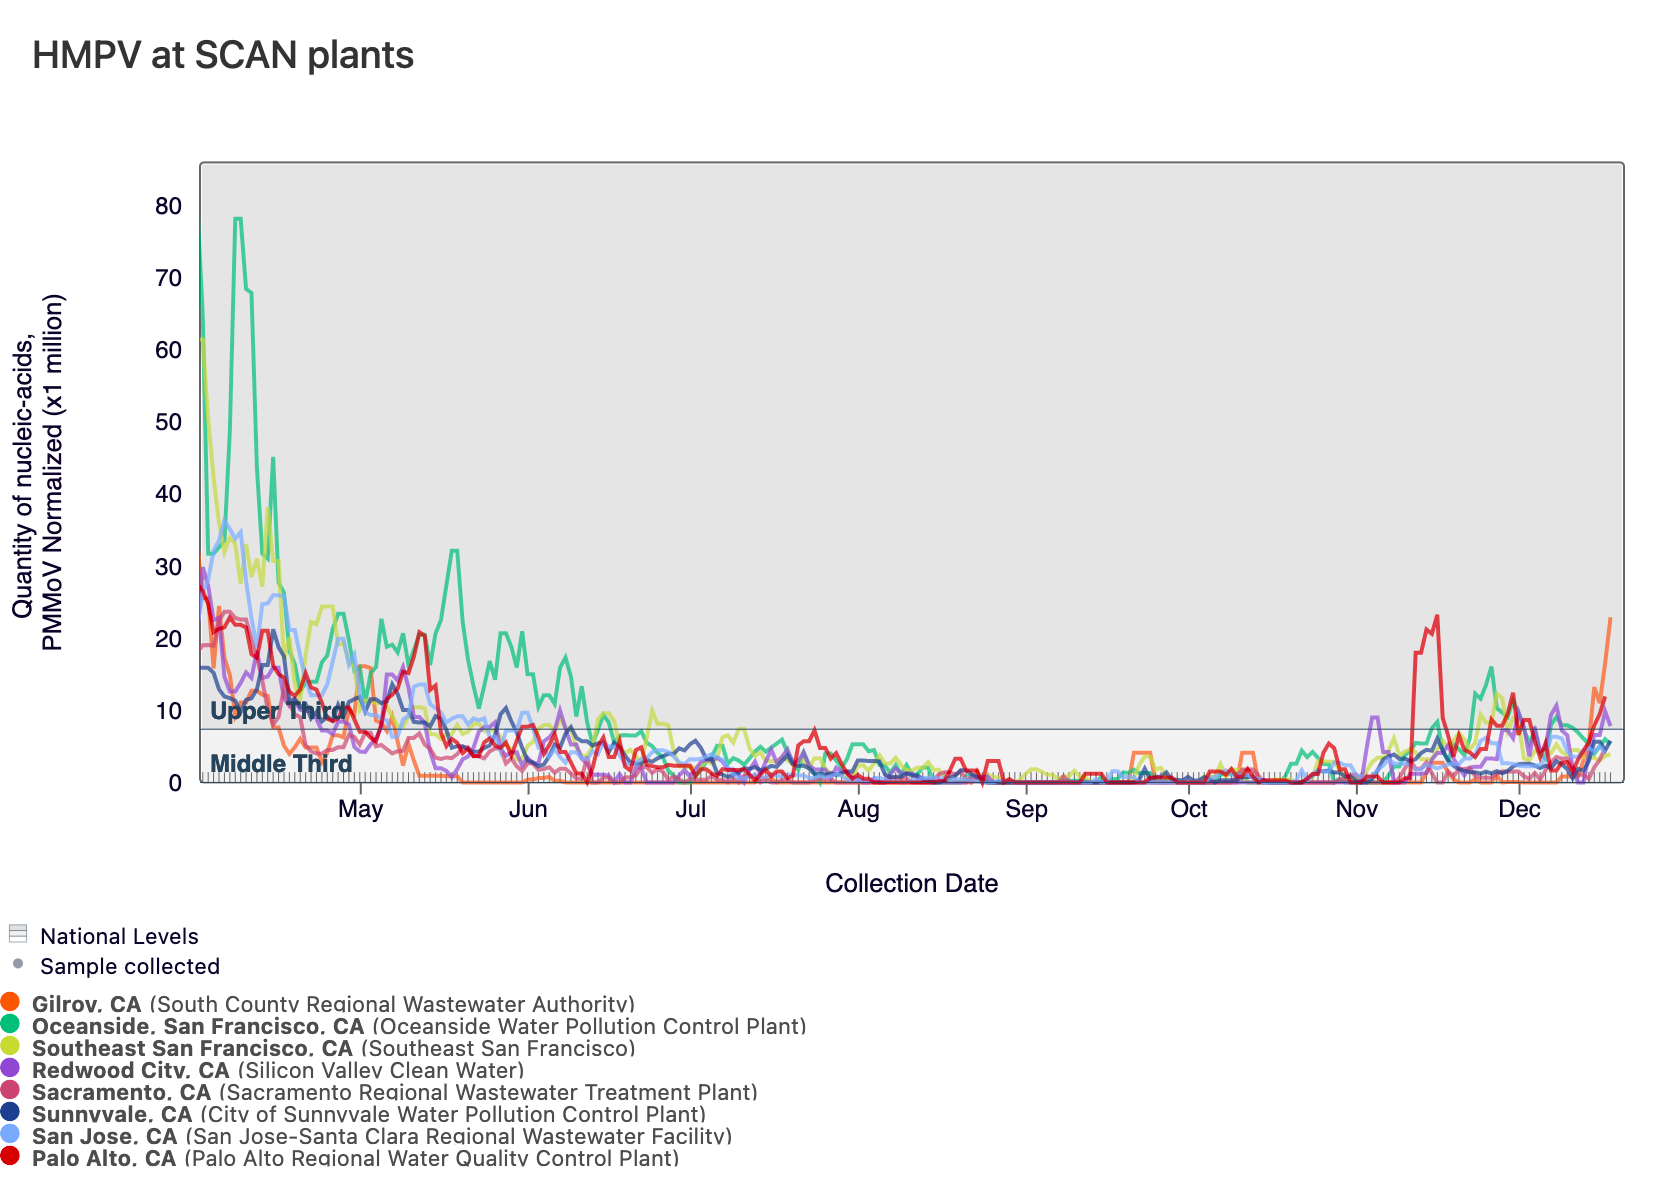
Below is a chart showing the National Levels benchmarks superimposed on the HMPV data from the SCAN sites. (You can access the chart here.) Currently, Gilroy, Palo Alto, and SVCW have HMPV concentrations in the upper third level, and all other SCAN sites have HMPV concentrations in the middle third level.
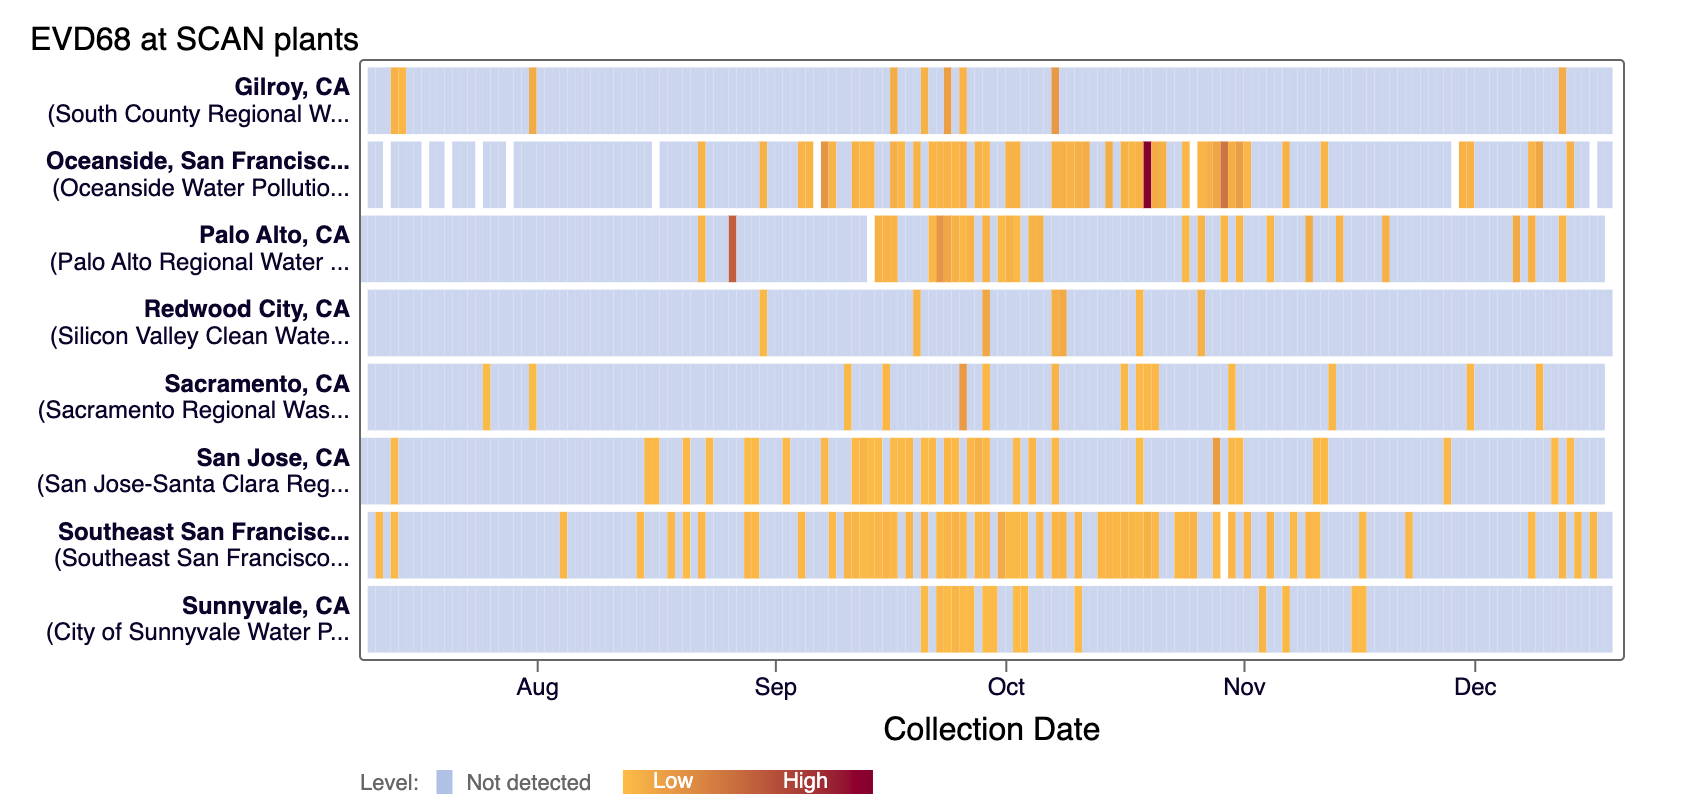
EV-D68 RNA was sporadically detected in samples collected in the last 21 days at all SCAN sites. The heat map below shows all the SCAN sites as a row, and each date as a column since monitoring began in July. The color blue means the sample was non-detect for EV-D68 RNA and the colors get darker with higher concentrations. White indicates no sample was collected. You can access the chart here. EV-D68 is believed to occur biennially, and we saw it last year, so perhaps it will not be common this year.
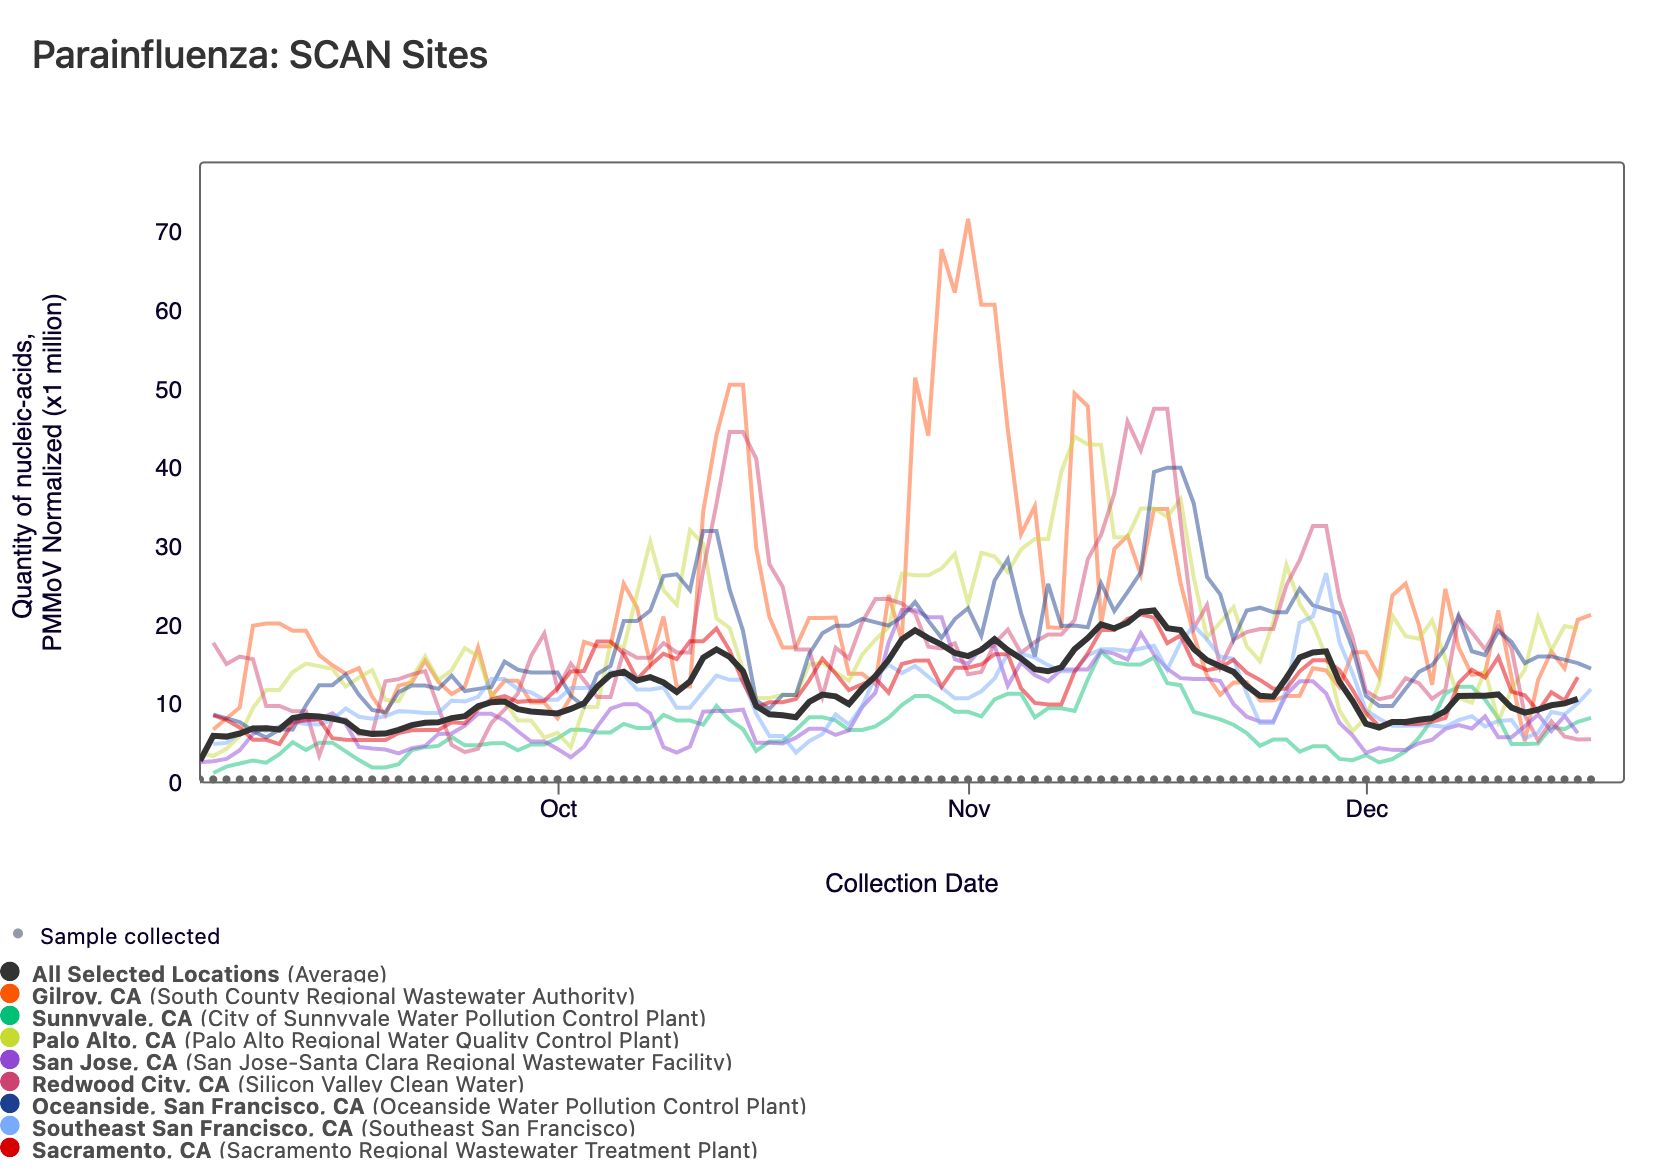
Parainfluenza RNA has been detected in most samples collected from SCAN sites. The population weighted average across SCAN sites is shown in black. You can access the chart here.
Gastrointestinal Targets
Norovirus GII, Rotavirus, and Human Adenovirus Group F
Norovirus GII RNA is commonly detected at all sites. In the chart below, the population weighted average line across all the SCAN plants (black) is compared to the Norovirus concentrations at SVCW (purple) since August.
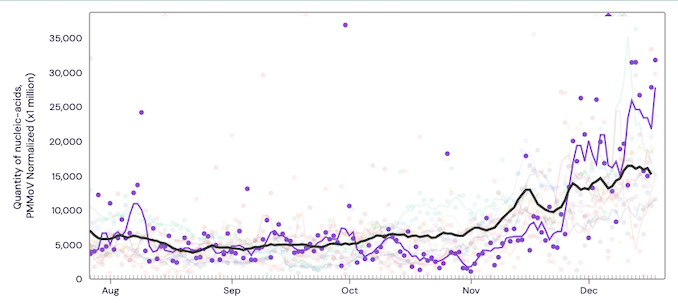
Below are the current Norovirus wastewater categories for the SCAN sites (recall the category is determined by both the trend and the level):
Palo Alto, Oceanside SF, Southeast SF, Gilroy, and San Jose are in the MEDIUM Wastewater Category SVCW, Sunnyvale, and Sacramento are in the HIGH Wastewater Category
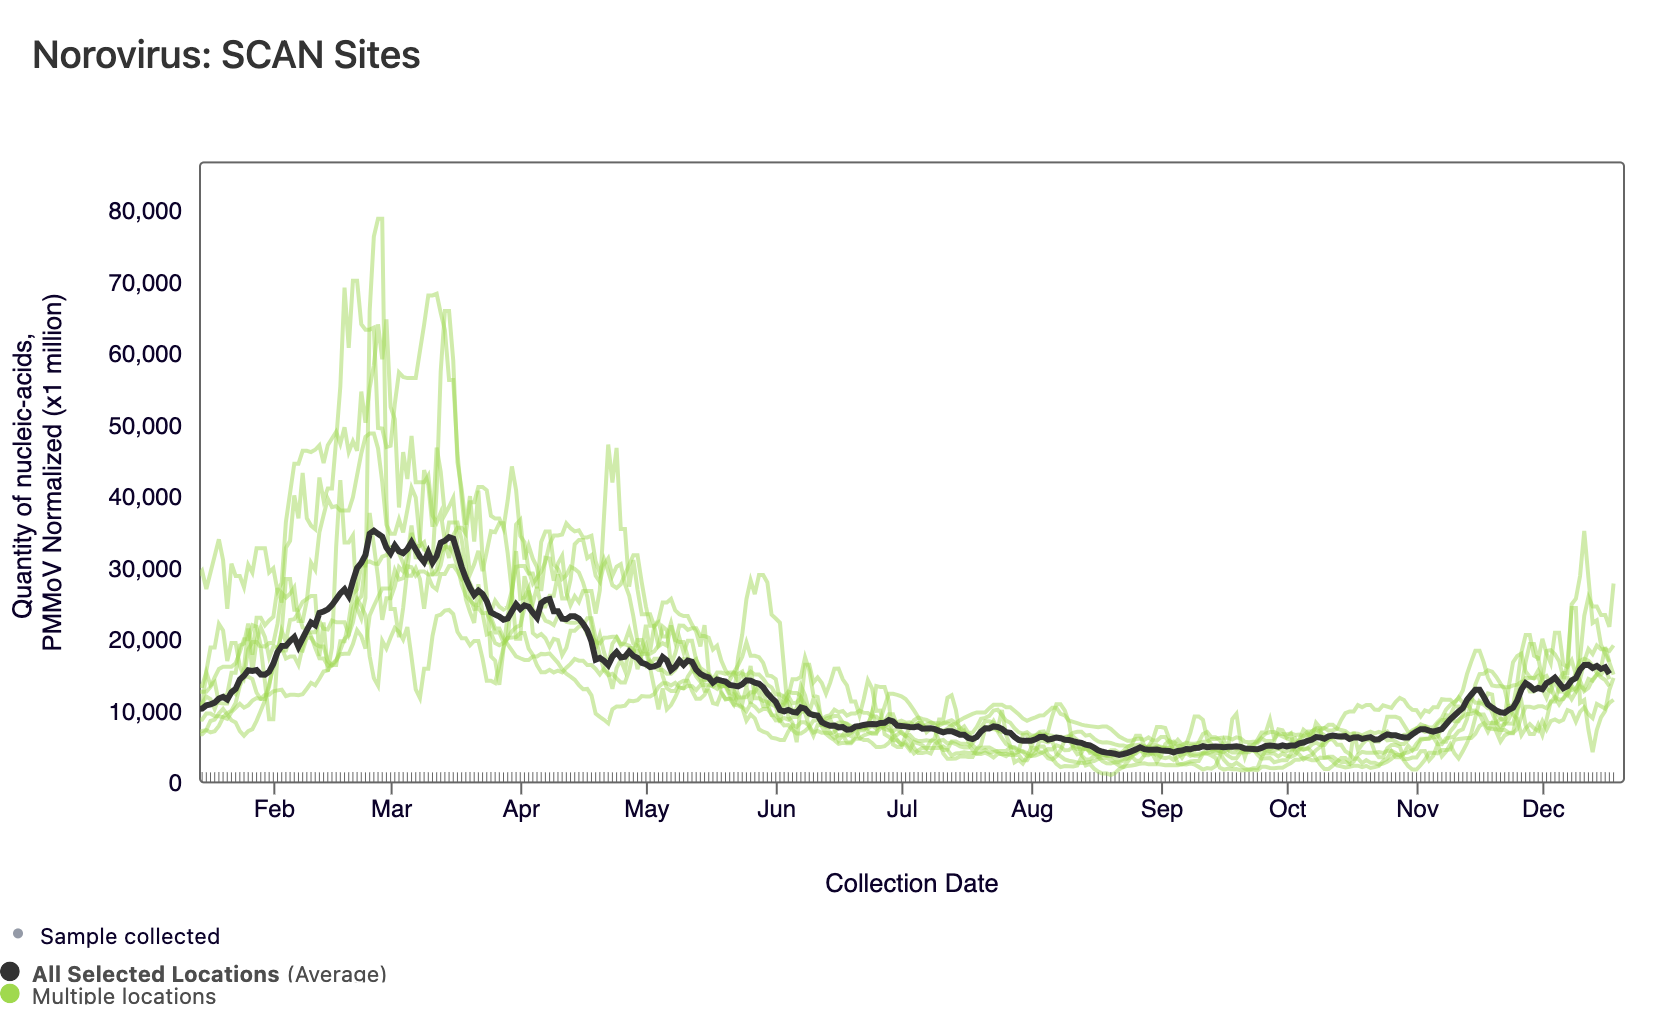
The plot below shows the Norovirus concentrations at the SCAN sites. The population weighted average line is shown in black. You can interact with the chart of all the plants at this link.
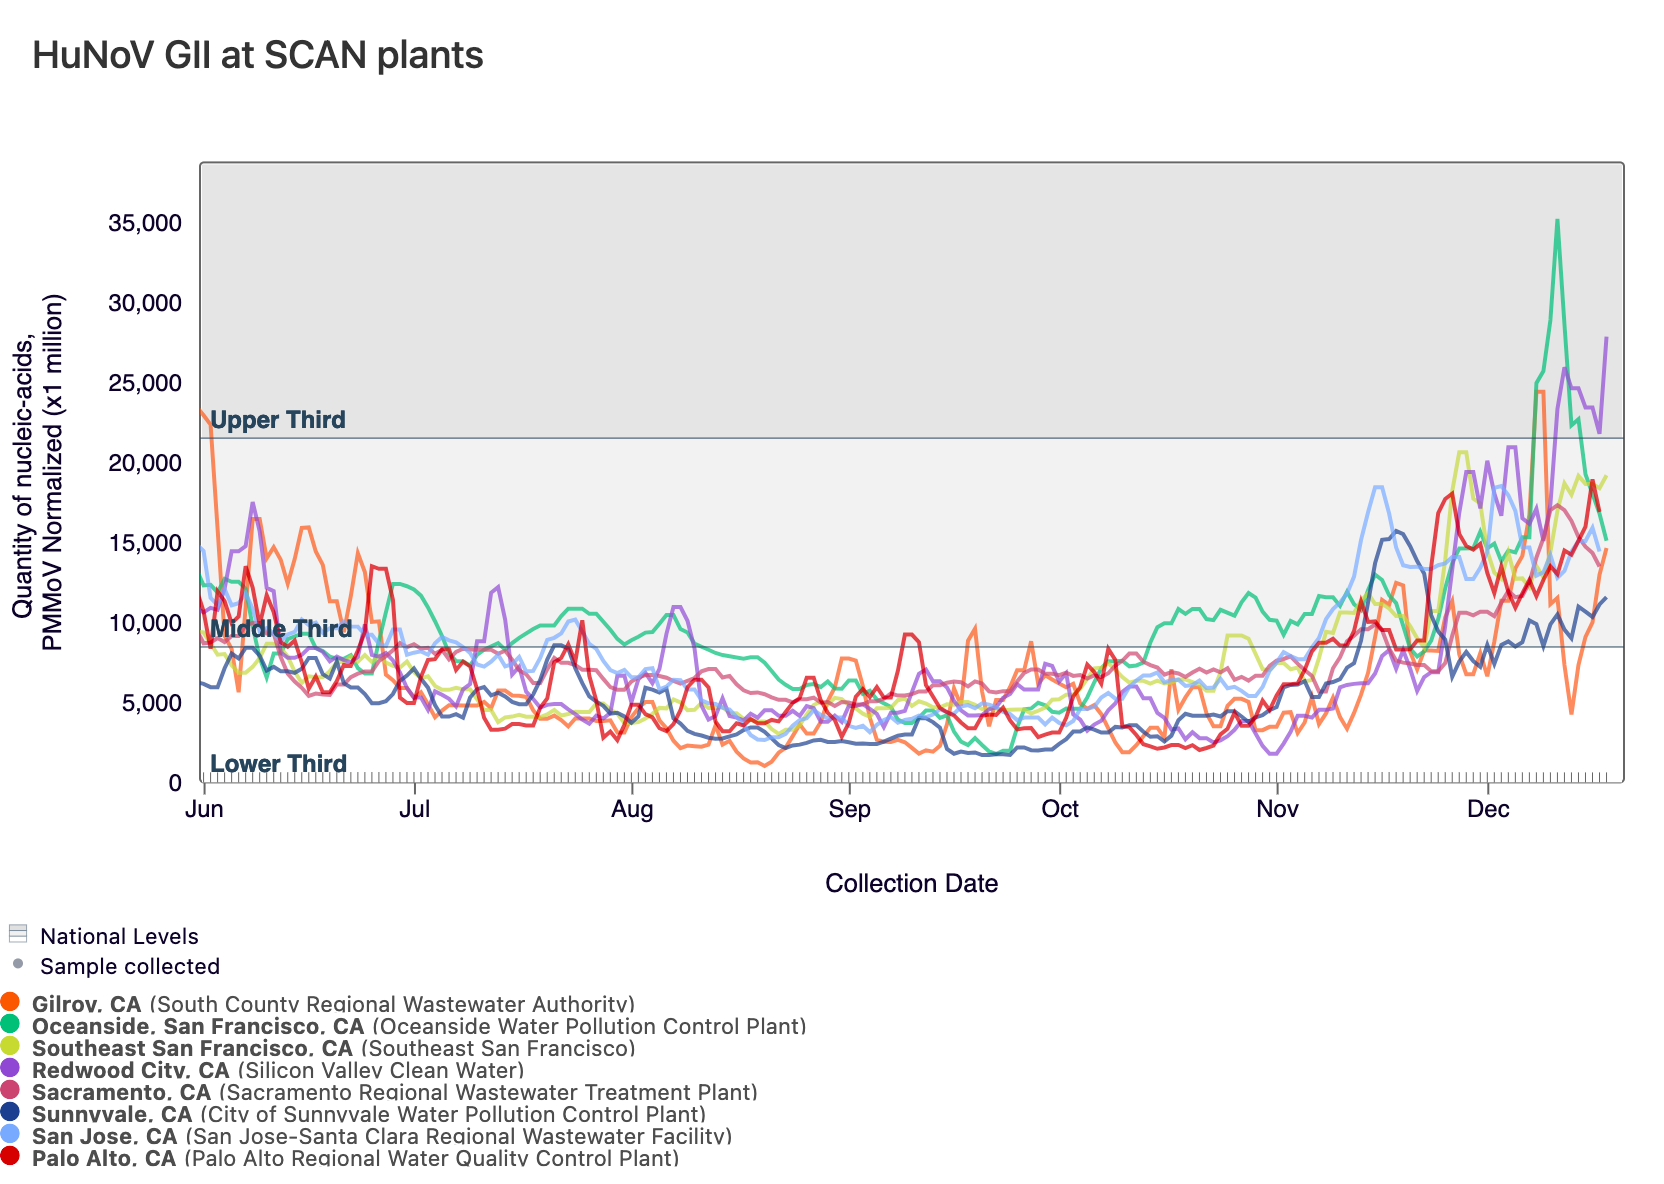
Below is a chart showing the National Levels benchmarks superimposed on the Norovirus concentrations from the SCAN sites. (You can access the chart here.) Currently, SVCW is in the upper third tier and all other SCAN sites have Norovirus concentrations in the middle third tier.
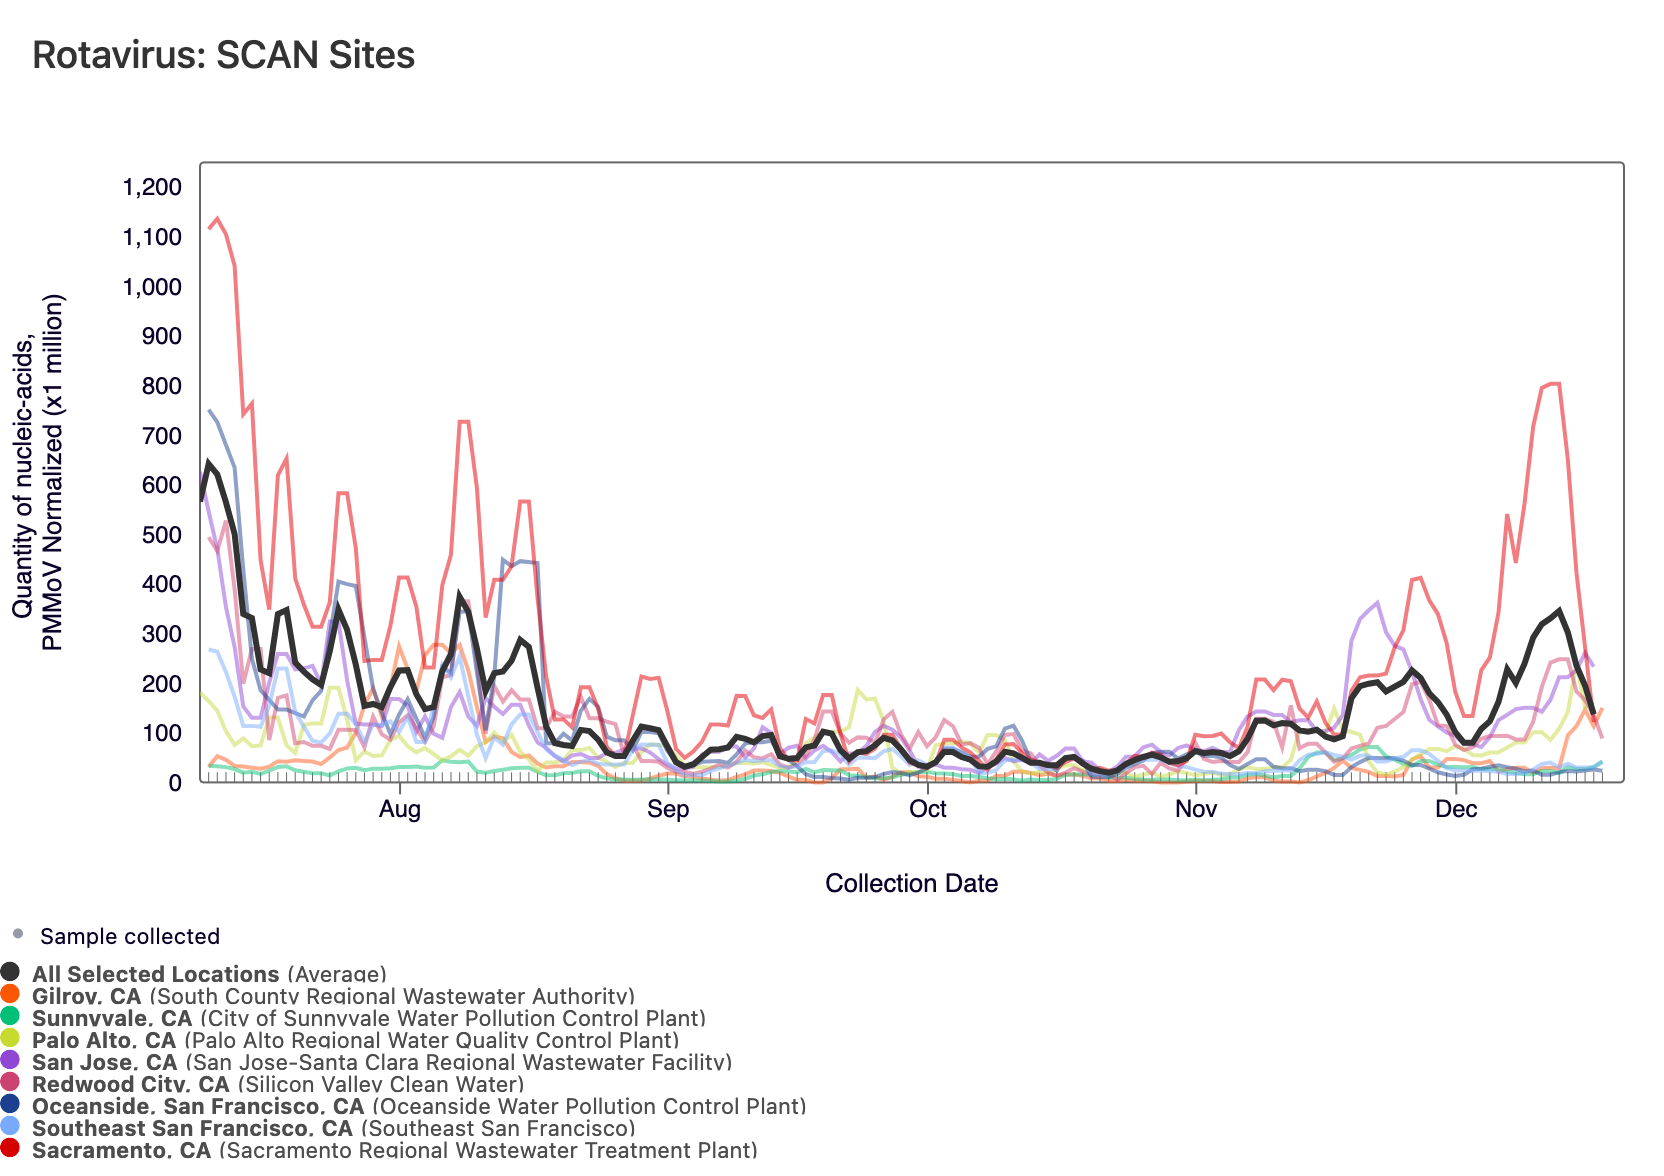
Rotavirus RNA concentrations are shown in the chart below; all the SCAN plants are shown together. The population weighted average line is shown in black. You can interact with the chart of all the plants here.
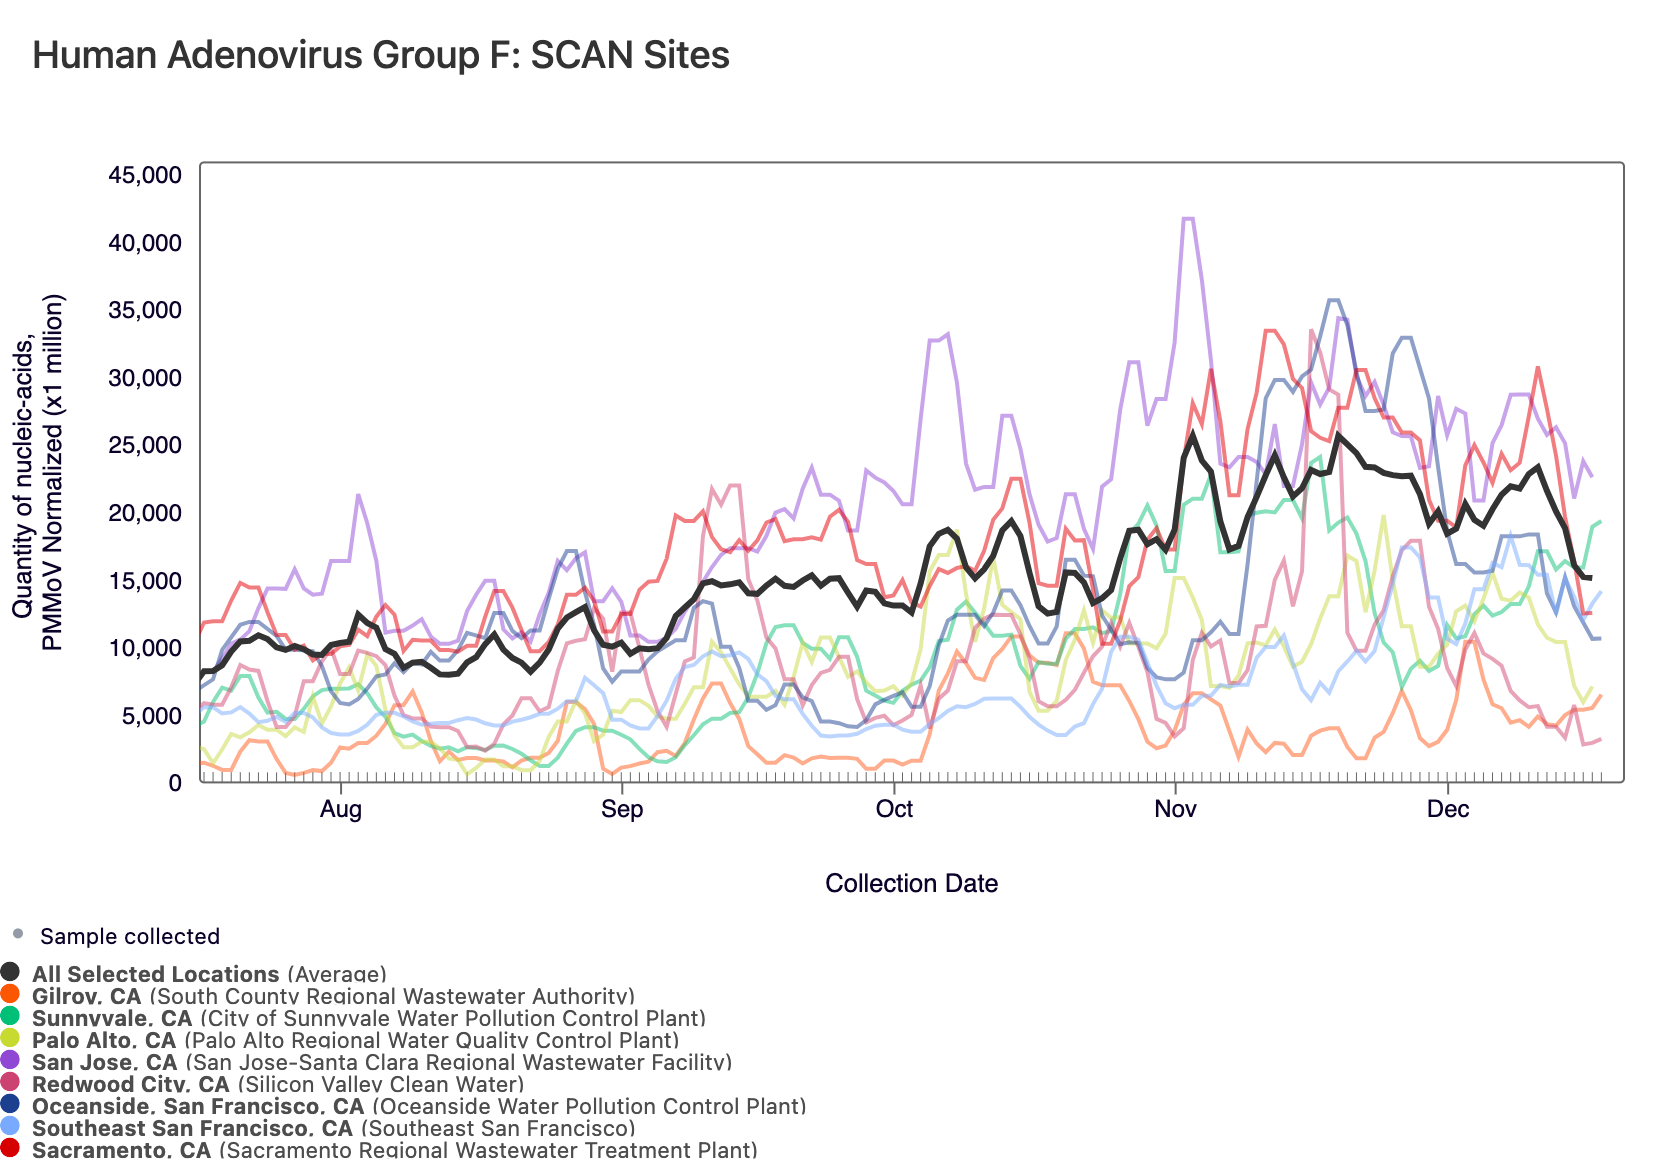
Human Adenovirus Group F DNA concentrations are shown in the chart below; all the SCAN plants are shown together. The population weighted average line is shown in black. You can interact with the chart of all the plants here.
Other Pathogens of Concern
Mpox, Candida auris, and Hepatitis A
Mpox DNA was not detected in most samples collected in the last 21 days at all SCAN sites. The heat map below shows all the SCAN sites as a row, and each date as a column since July 2022. The color blue means that MPXV DNA was not detected in the sample, and the dark purple color means it was detected. White indicates no sample was collected. The chart shows all the data we have collected. You can access the chart here.
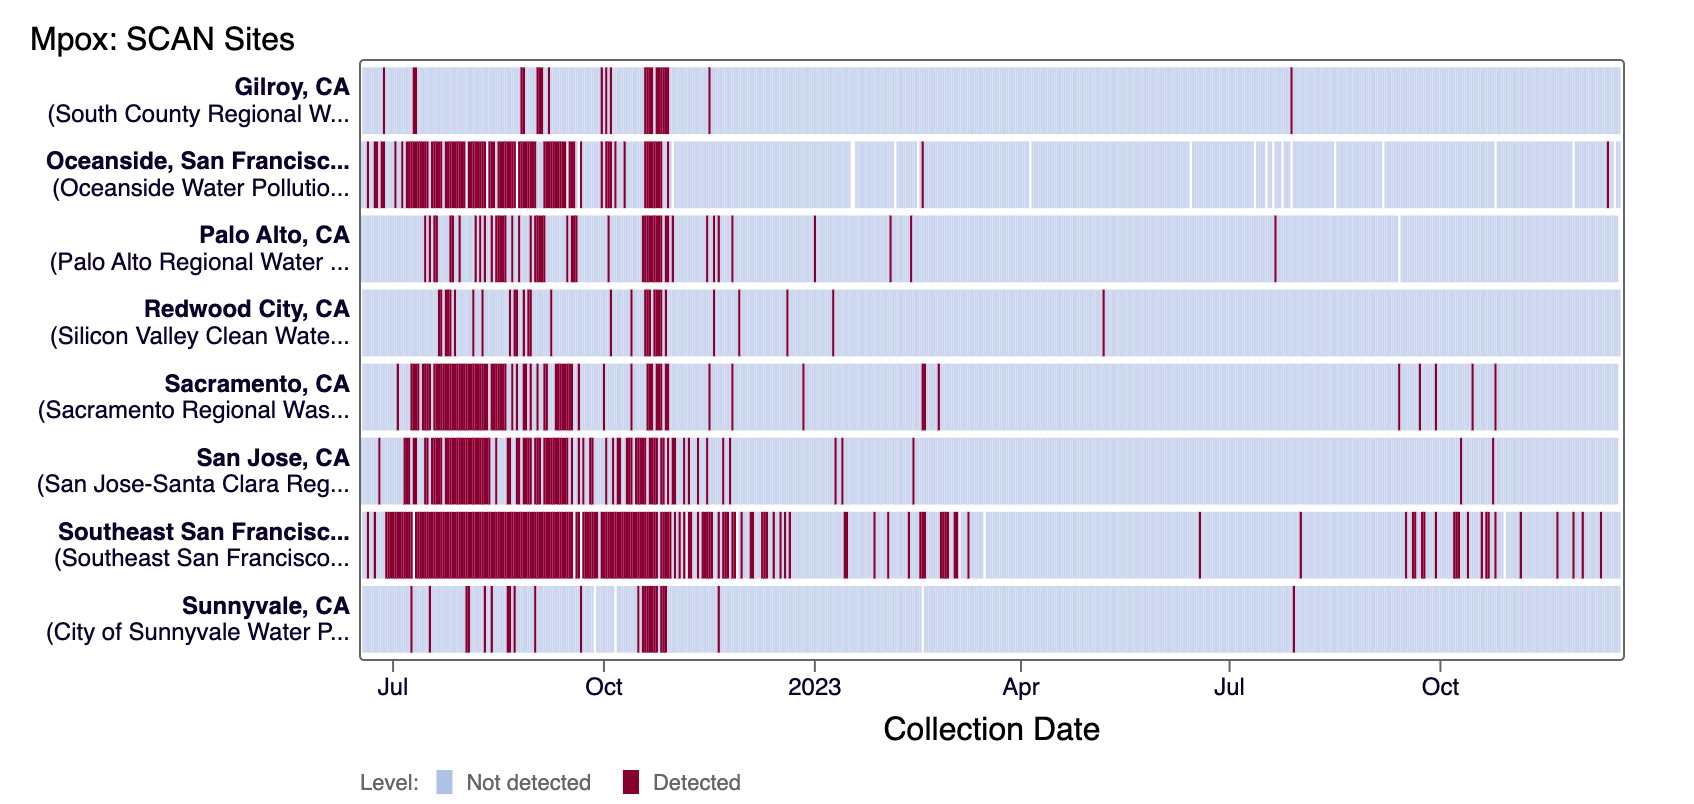
Currently all SCAN sites are in the 'LOW' category for Mpox
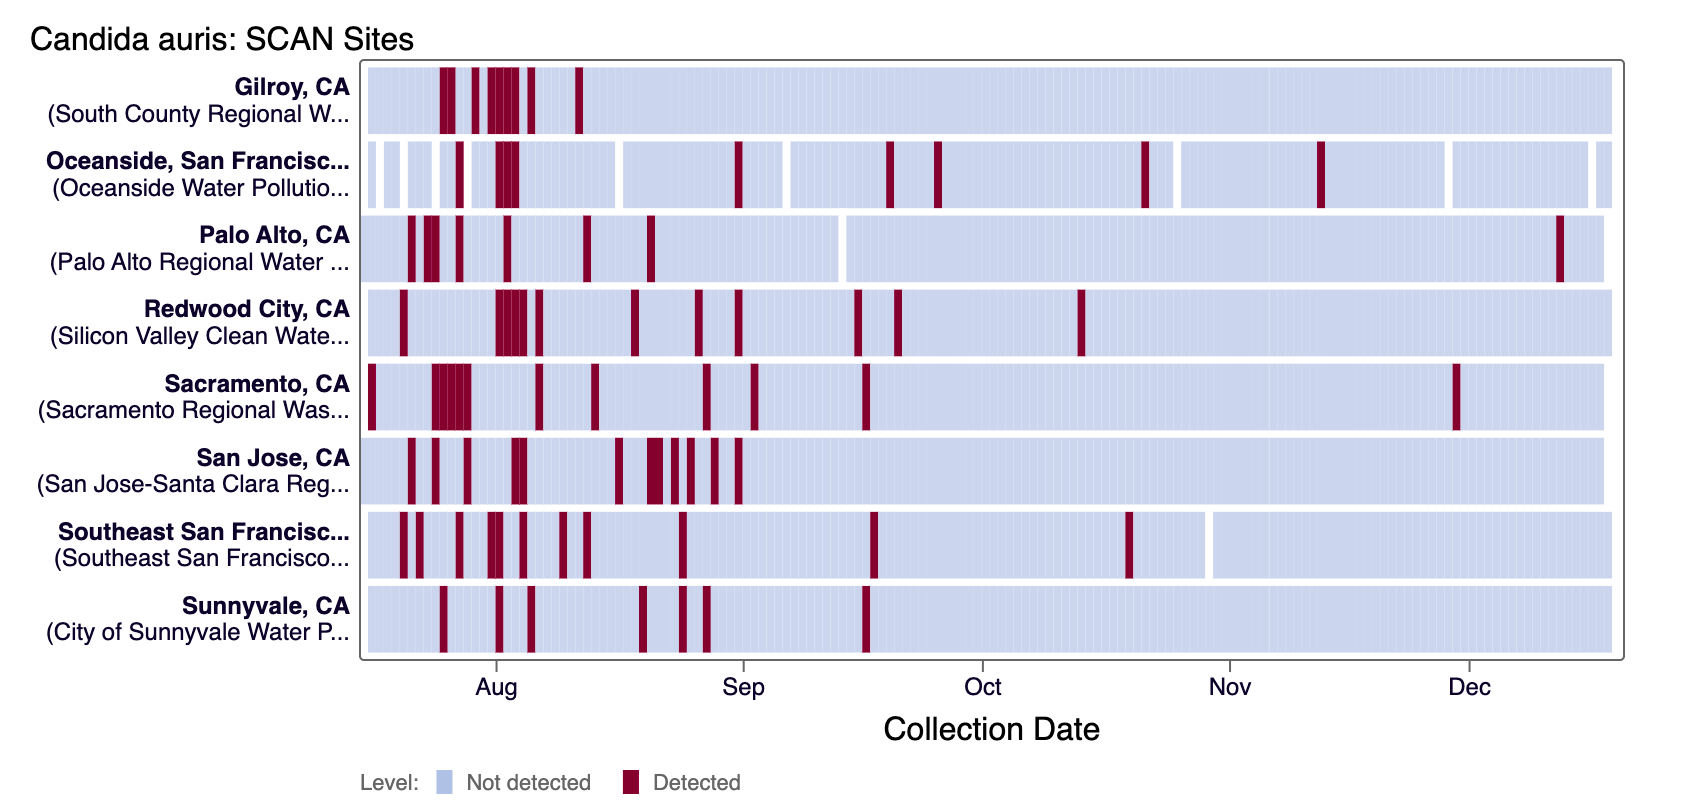
Candida auris DNA was not detected in most samples collected in the last 21 days at all SCAN sites. The heat map below shows all the SCAN sites as a row, and each date as a column for all data collected since monitoring began in July. The color blue means that Candida auris DNA was not detected in the sample, and the dark purple color means it was detected. White indicates no sample was collected. You can access the chart here.
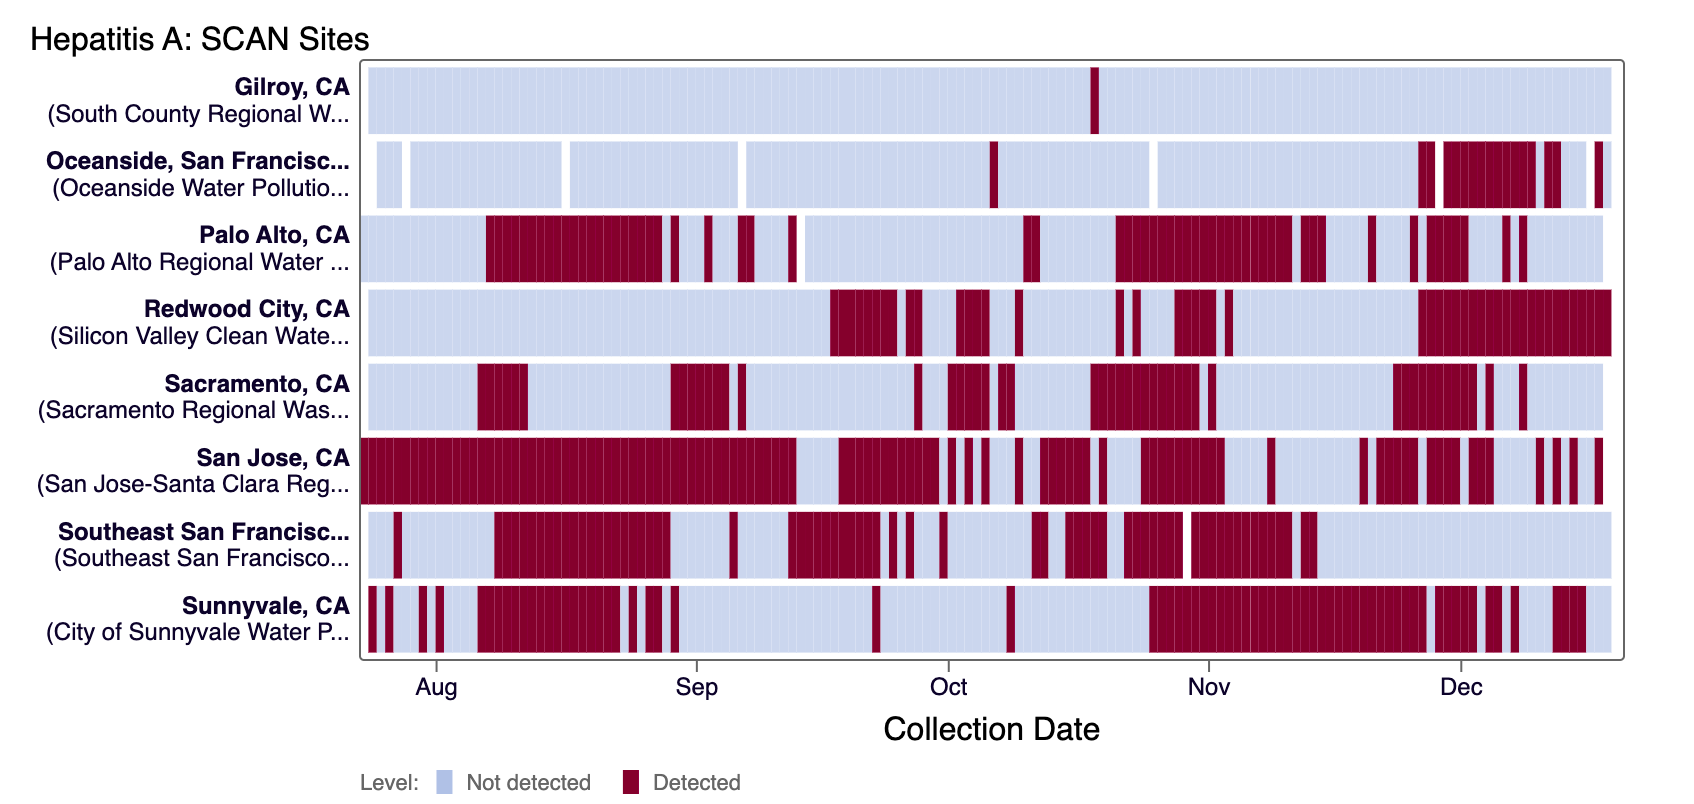
Hepatitis A RNA was detected in most samples from Oceanside SF, SVCW, and Sunnyvale in the last 21 days. Hepatitis A RNA was not detected at Gilroy and Southeast SF and was detected sporadically at Palo Alto, Sacramento, and San Jose in the last 21 days. The heat map below shows all the SCAN sites as a row, and each date as a column for all data collected since monitoring began in July. The color blue means that Hepatitis A RNA was not detected in the sample, and the dark purple color means it was detected. White indicates no sample was collected. You can access the chart here.