
Nationwide WWSCAN Update 10/27/23
Hi everyone,
This newsletter contains updates on the WastewaterSCAN program with wastewater samples analyzed by the lab through October 26, 2023. Below you will find information on the program in terms of participating partners, review of targets being measured, as well as current categories (low, medium, high) of the infectious disease targets.
Enjoy your weekend,
Ali & Marlene
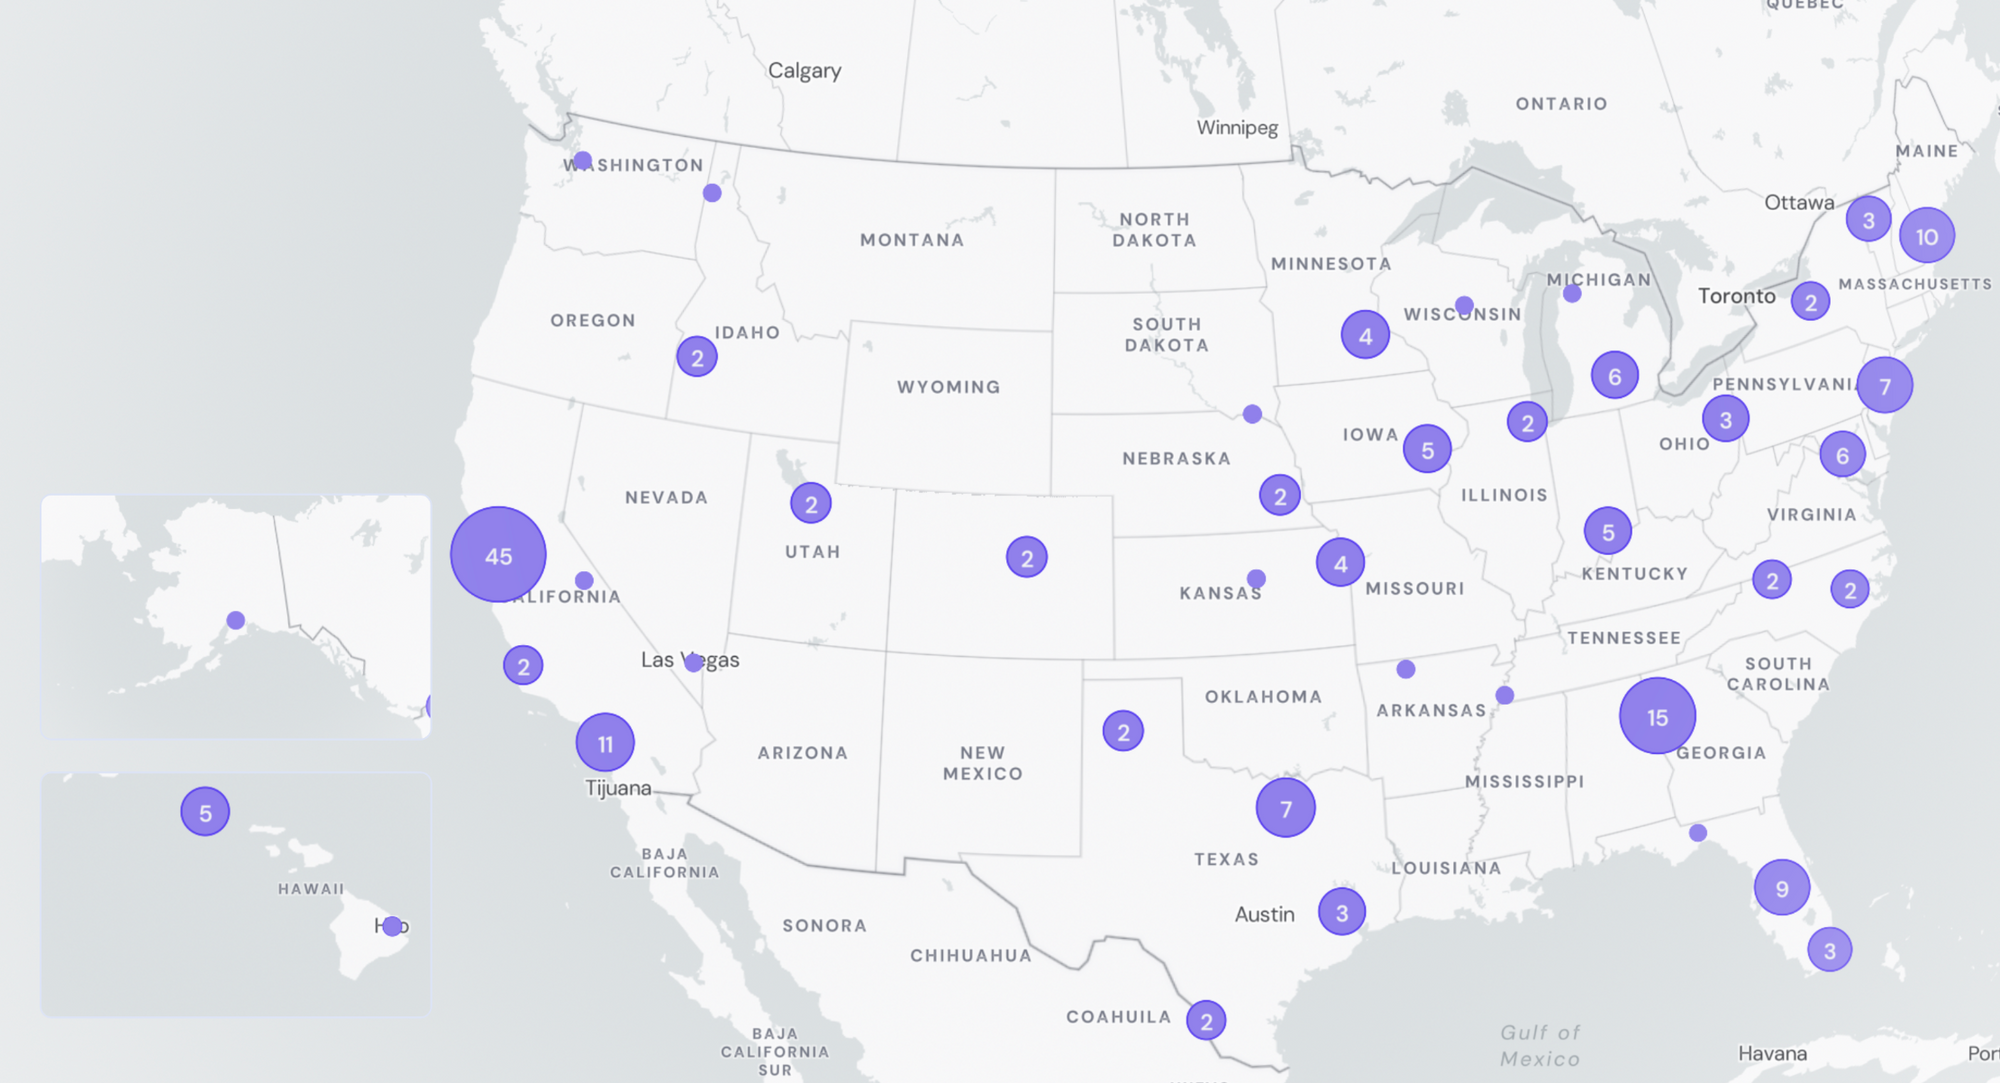
Participating Plants
183 plants from 37 states are sampling, which represents ~12.7% of the US population
WastewaterSCAN Participant Stats:
- 183 plants sampling
- 42,726,910 people covered through sampling efforts
- 37 states represented
- 8 new onboarded sites - Grants Pass OR*, Jackson MS* [2 sites] , New Orleans LA* [2 sites], Penn State University Park PA, Stamford CT*, Washington DC (*= new state)
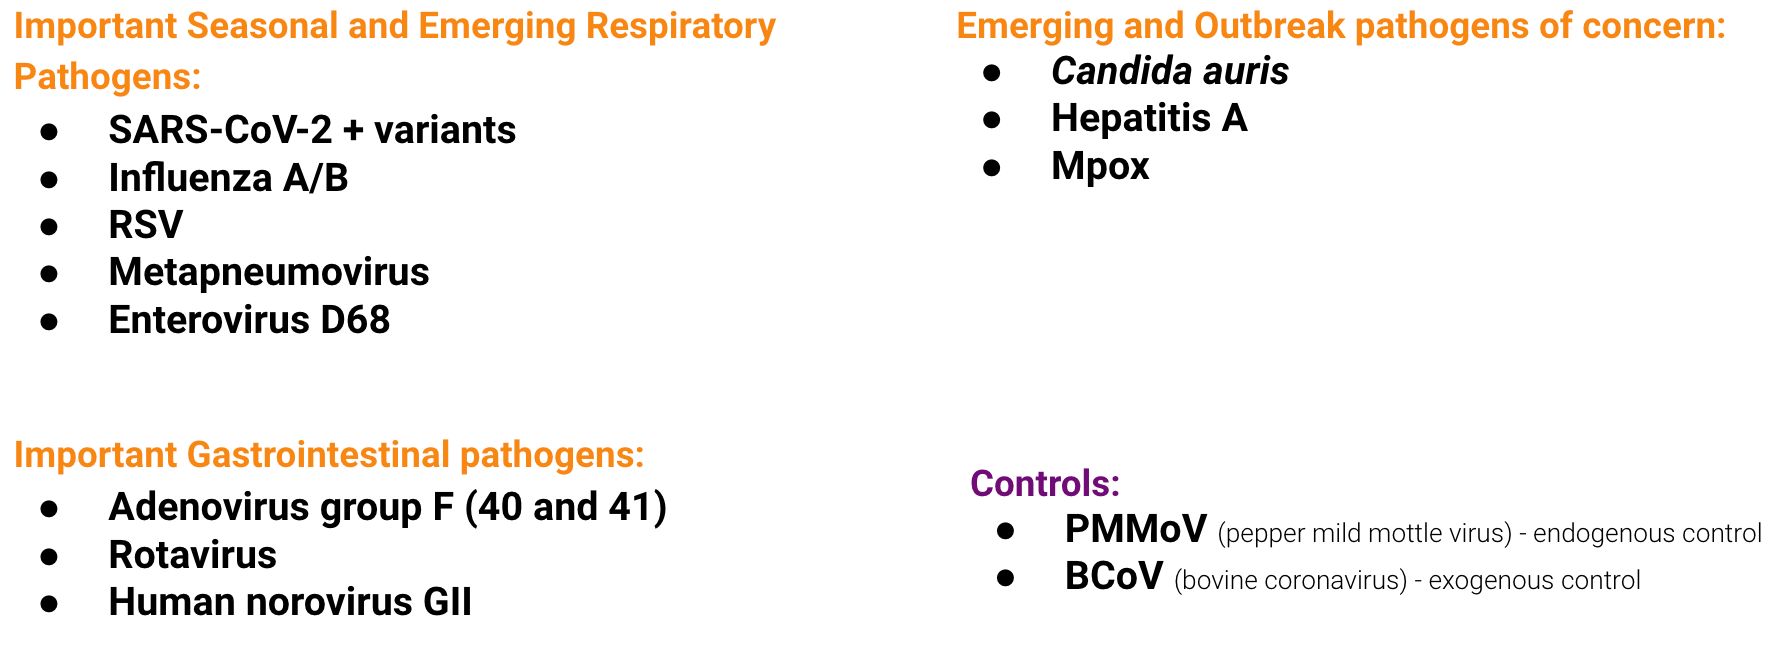
Infectious Disease Target Review
Currently monitoring a suite of Respiratory, Gastrointestinal and Outbreak Pathogens of Concern
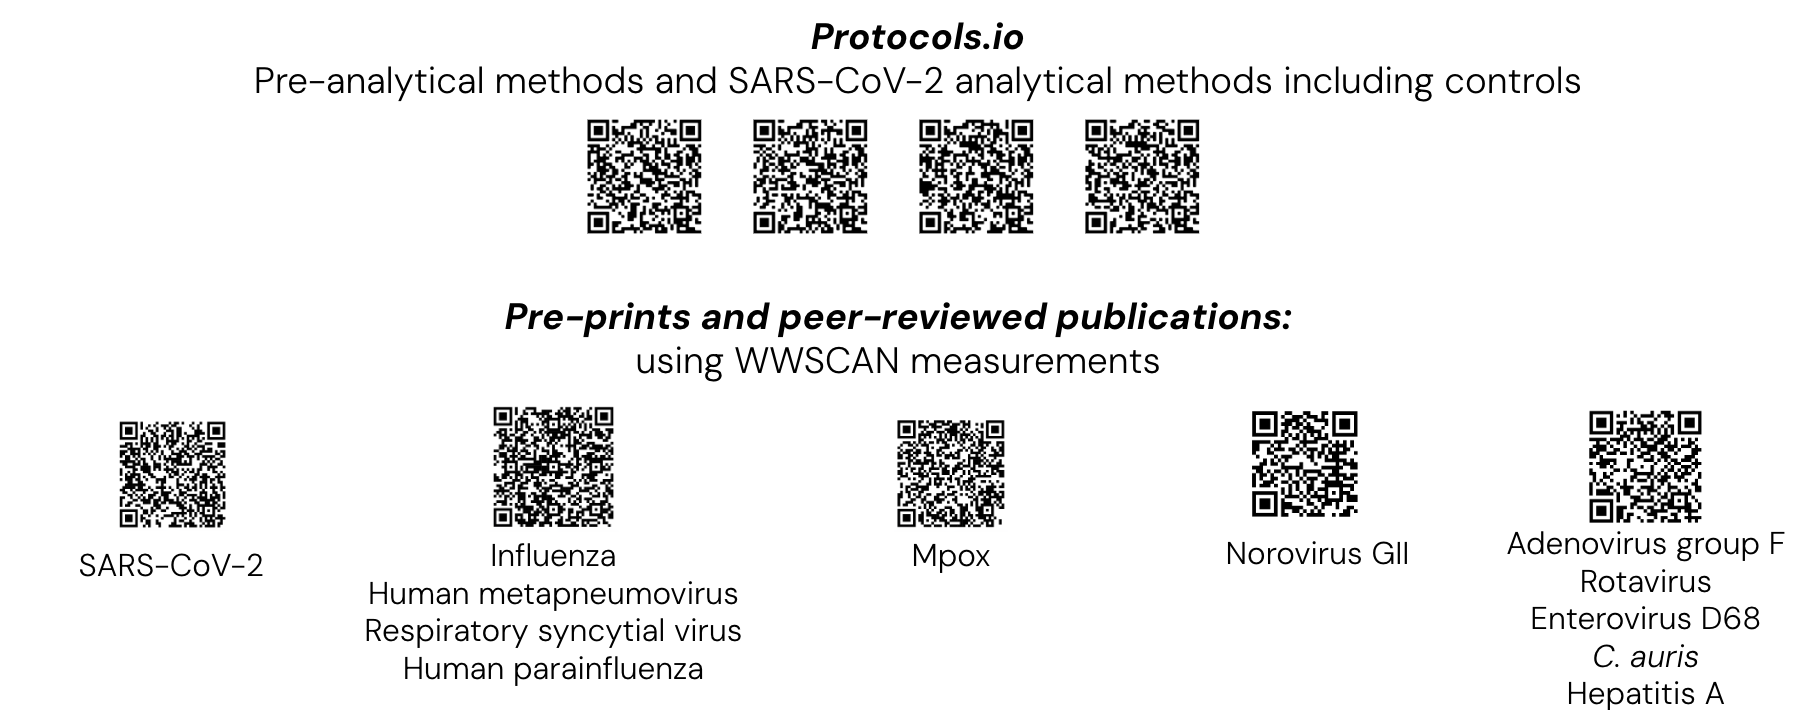
The methods for our assays are in the public domain. You can access them using these QR codes:
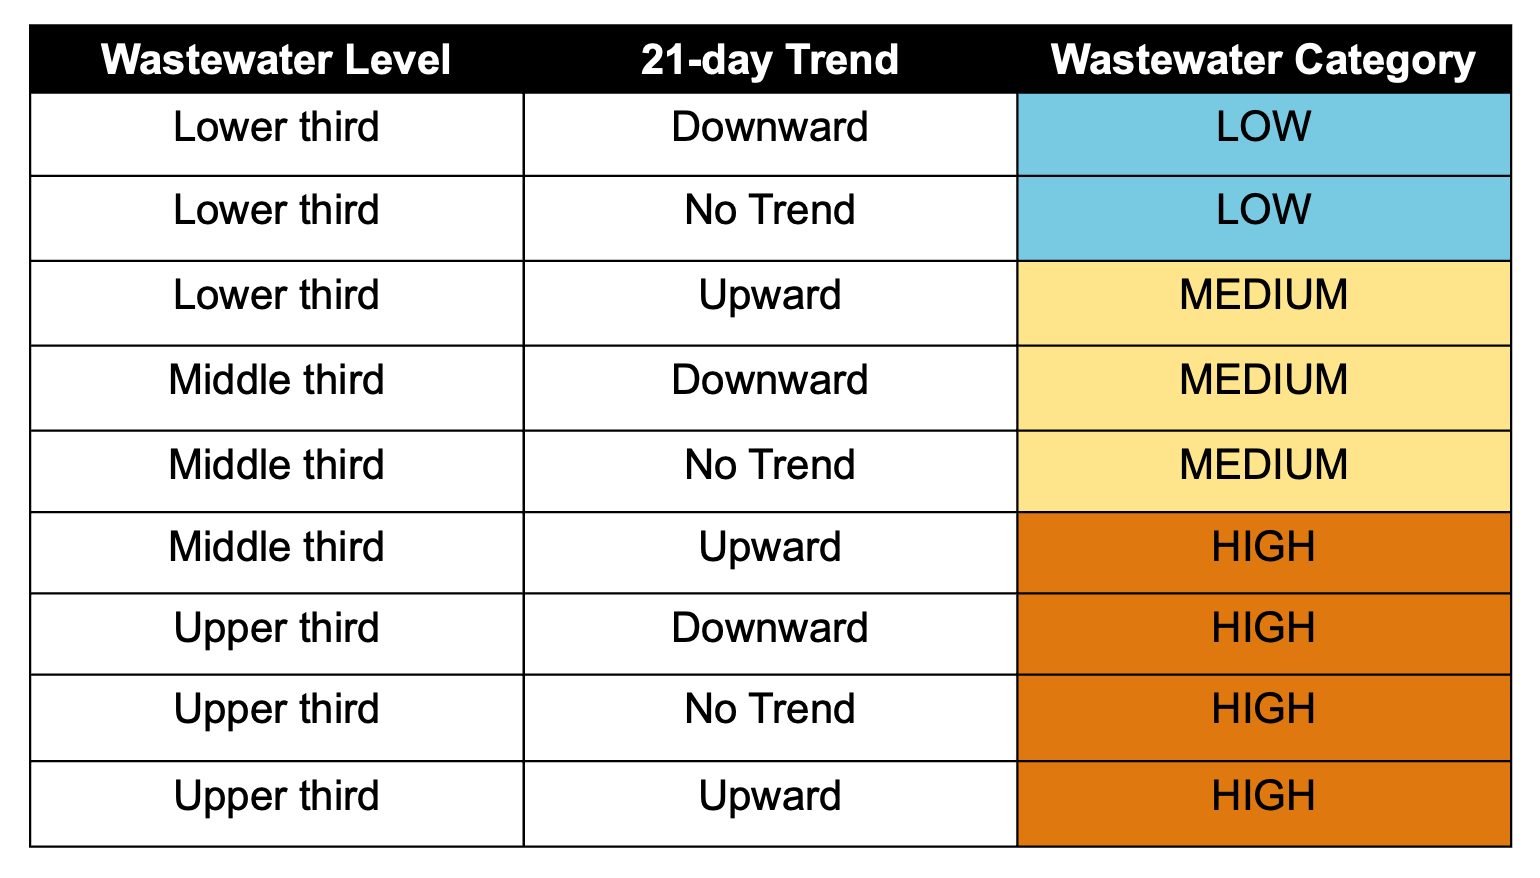
Wastewater Categories
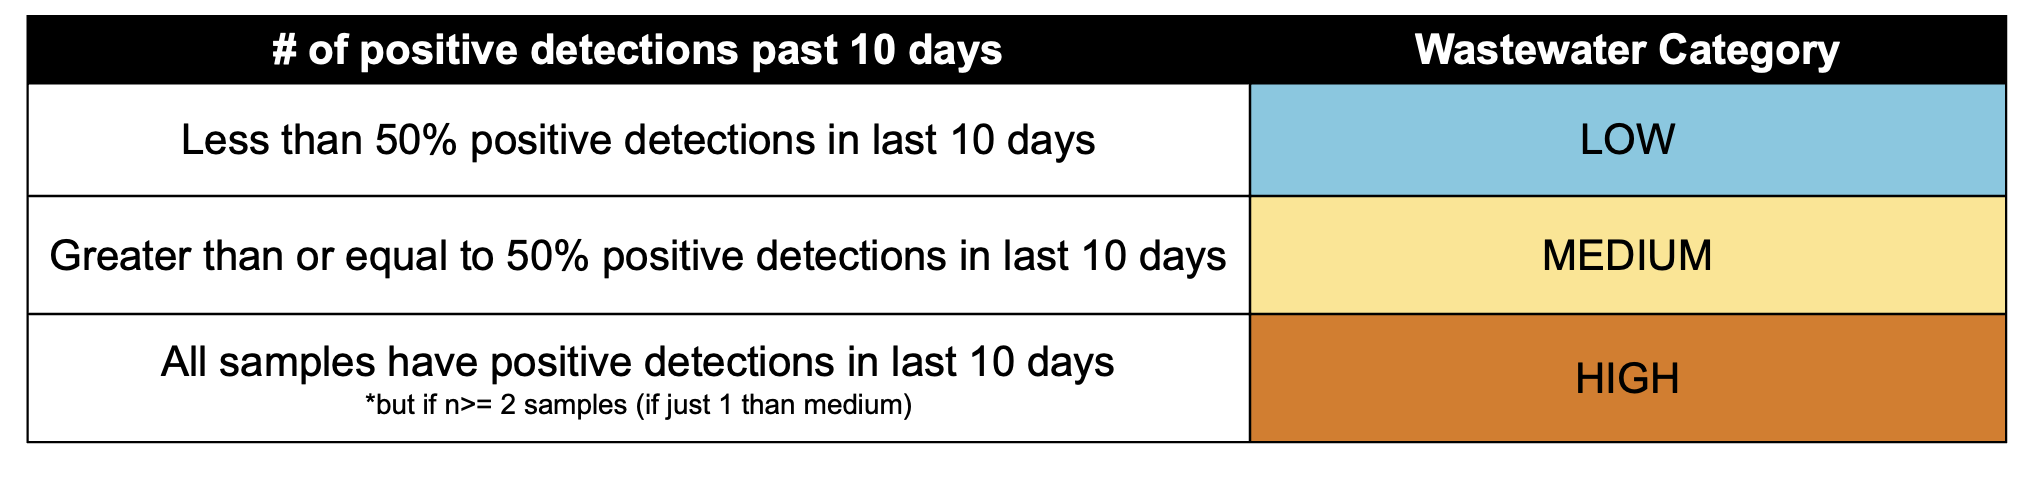
Looking at trends, levels, and frequency of detection to categorize what we are seeing in wastewater
WastewaterSCAN uses a Wastewater Categorization system to communicate insights from recent wastewater results. Research shows that the measurements we make in wastewater are related to disease in the community. The wastewater categorization helps us quickly understand if the recent measurements for a disease fall into a low, medium, or high category and are determined based on a combination of the following variables:
- Trends indicate whether wastewater concentrations of pathogens have been changing significantly (i.e., increasing or decreasing) for each location over the last 21 days
- Levels indicate whether wastewater concentrations are relatively lower or higher at each location compared to national concentrations of each pathogen (i.e., upper third, middle third, or lower third, as measured over the last year)
- Frequency of detection indicates how often a pathogen is detected in wastewater for each location over a recent time period (e.g., the last 10 days)
The new Wastewater Categorization system can now be accessed on the map view of the data.wastewaterscan.org site.
The Wastewater Categories are applied differently for three archetypes of diseases:
- Pathogens that are commonly detected (regardless of season) - SARS-CoV-2, Norovirus, and ‘peak season’ Respiratory pathogens (IAV, RSV, HMPV)
- Seasonal pathogens (rarely detected outside of season/outbreaks) - IAV, RSV, HMPV
The onset dates of IAV, RSV, and HMPV wastewater events are identified as the first day for which all samples in a 14 day look back period had concentrations higher than or equal to 2,000 copies/g, which is approximately twice the lowest detectable concentration. Once IAV, RSV, or HMPV are onset, the method for 'commonly detected pathogens' (see above) is used to determine the wastewater categorization.
The offset dates of IAV, RSV, and HMPV wastewater events were identified as the first day after an onset event for which only 50% of samples during a 14-d look back period have concentrations higher than or equal to 2,000 copies/g. When one of these signals is in offset, it is assign a ‘LOW’ categorization.
- Pathogens that are not commonly detected (regardless of season) - Mpox
Respiratory Pathogens
SARS-CoV-2, Influenza A & B, Respiratory Syncytial Virus, Human metapneumovirus, Human Parainfluenza & EV-D68
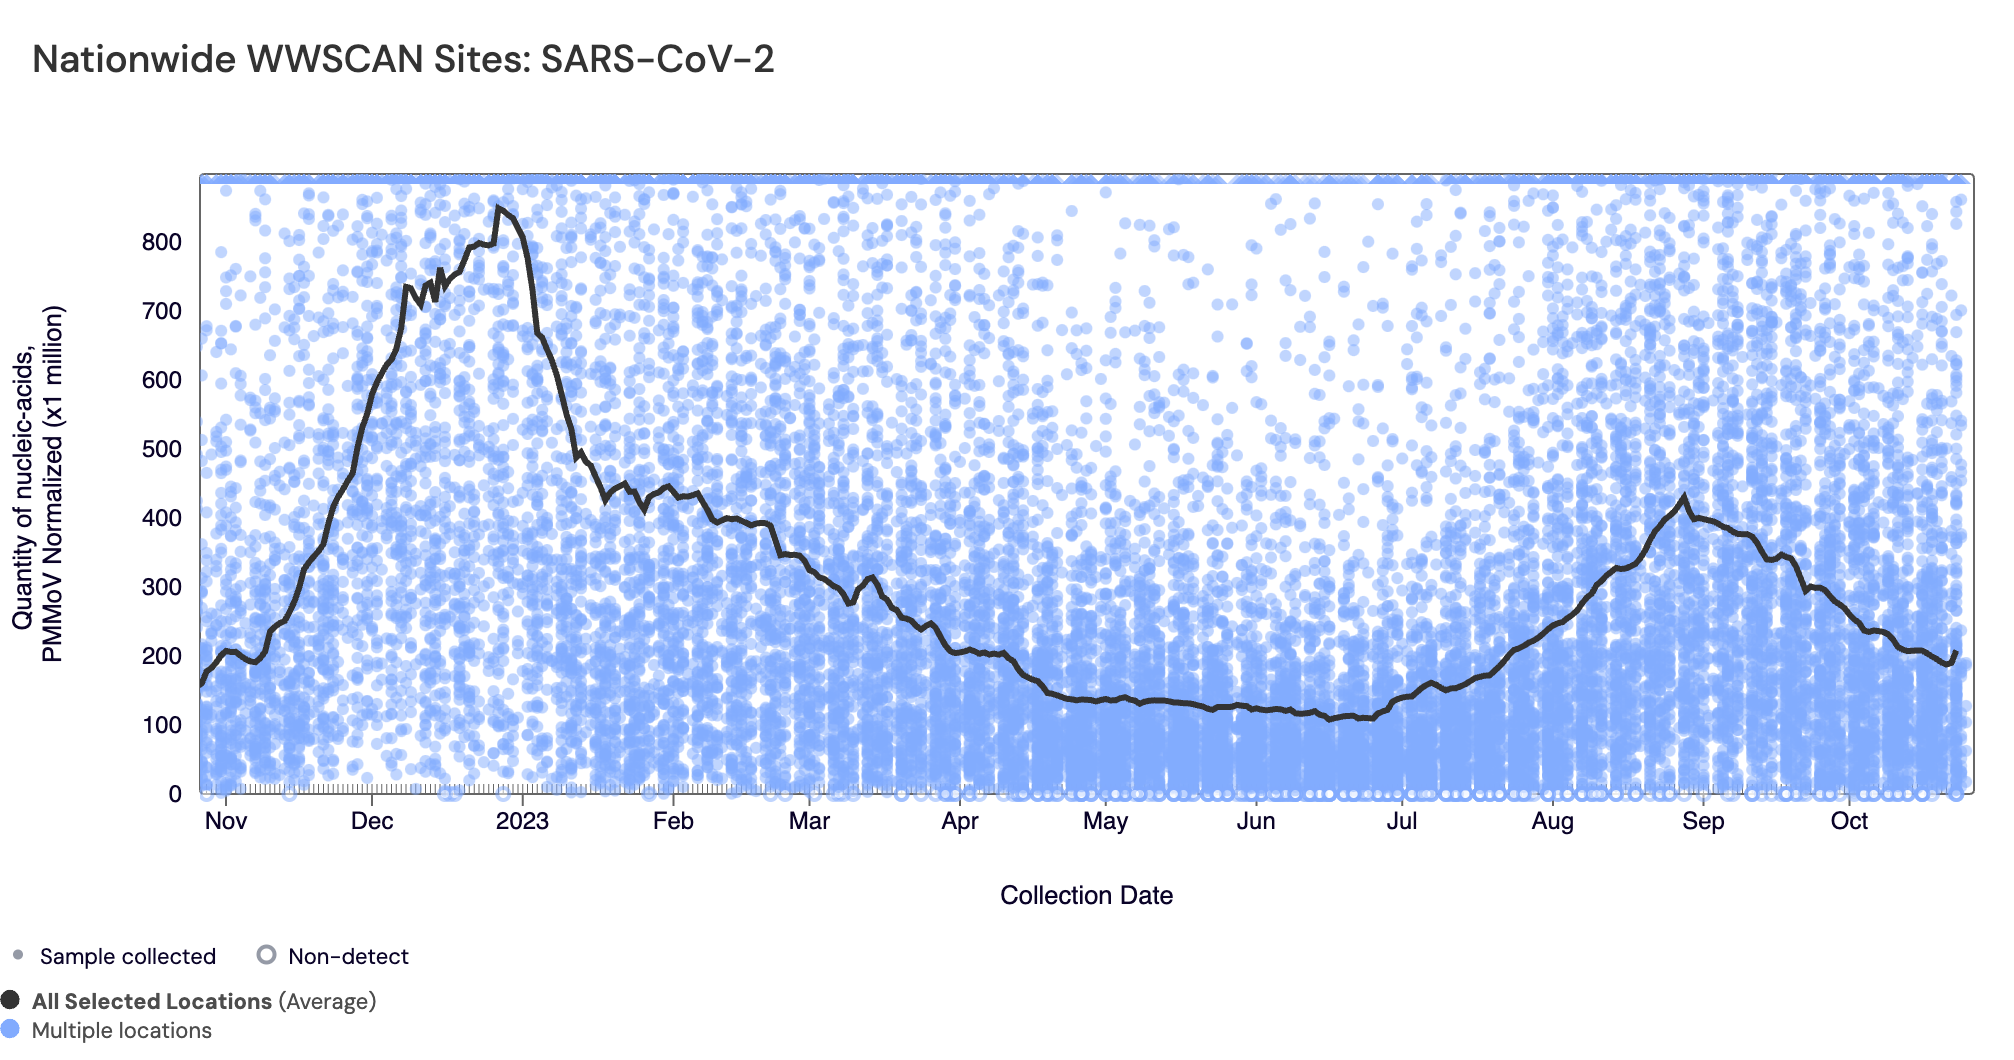
SARS-CoV-2 N gene RNA median concentrations across all sites over the last 21 days is 75,000 copies/gram (for reference median concentration in September 2023 was 104,000 copies/gram). Below are the SARS-CoV-2 N gene concentrations (normalized by PMMoV) from all participating WWSCAN sites across the country over the last 365 days. Raw data are shown as blue dots and the population weighted average is shown as a bold black line. Evident in the data is a recent peak in concentrations around September with medium levels still currently observed.
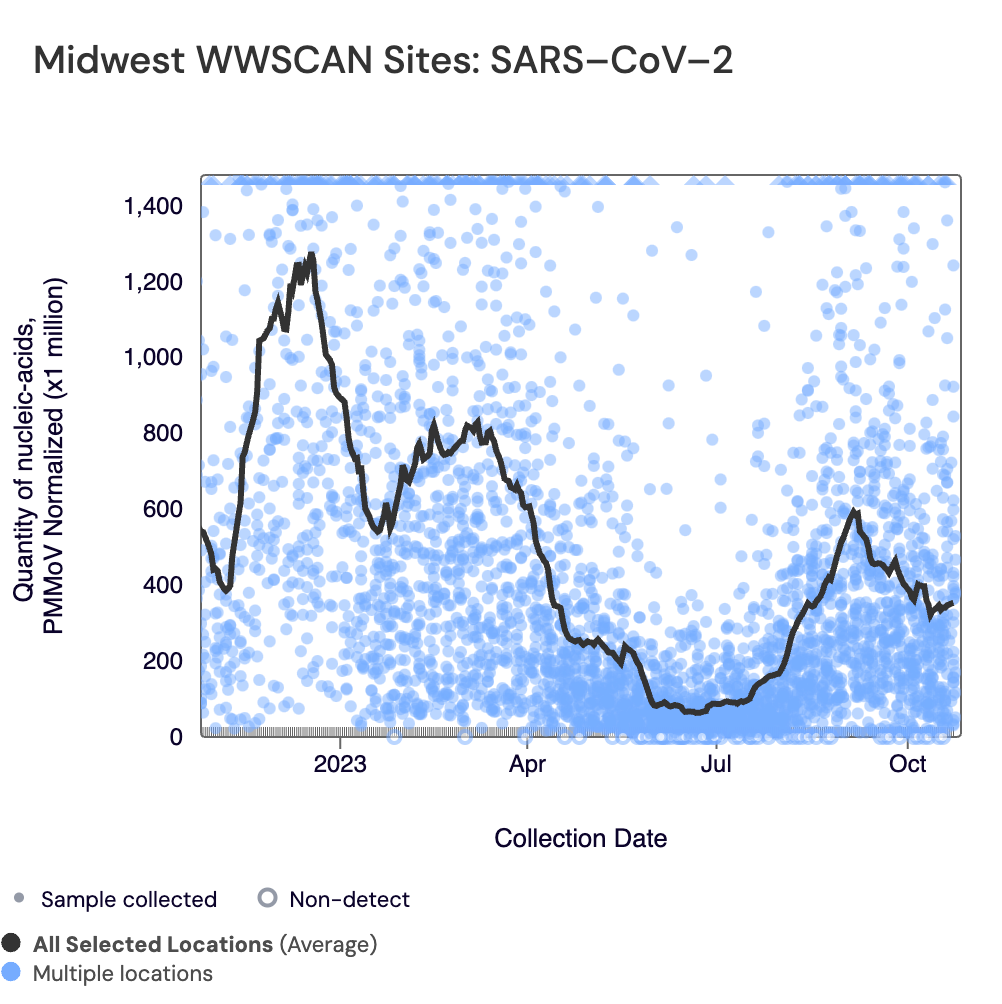
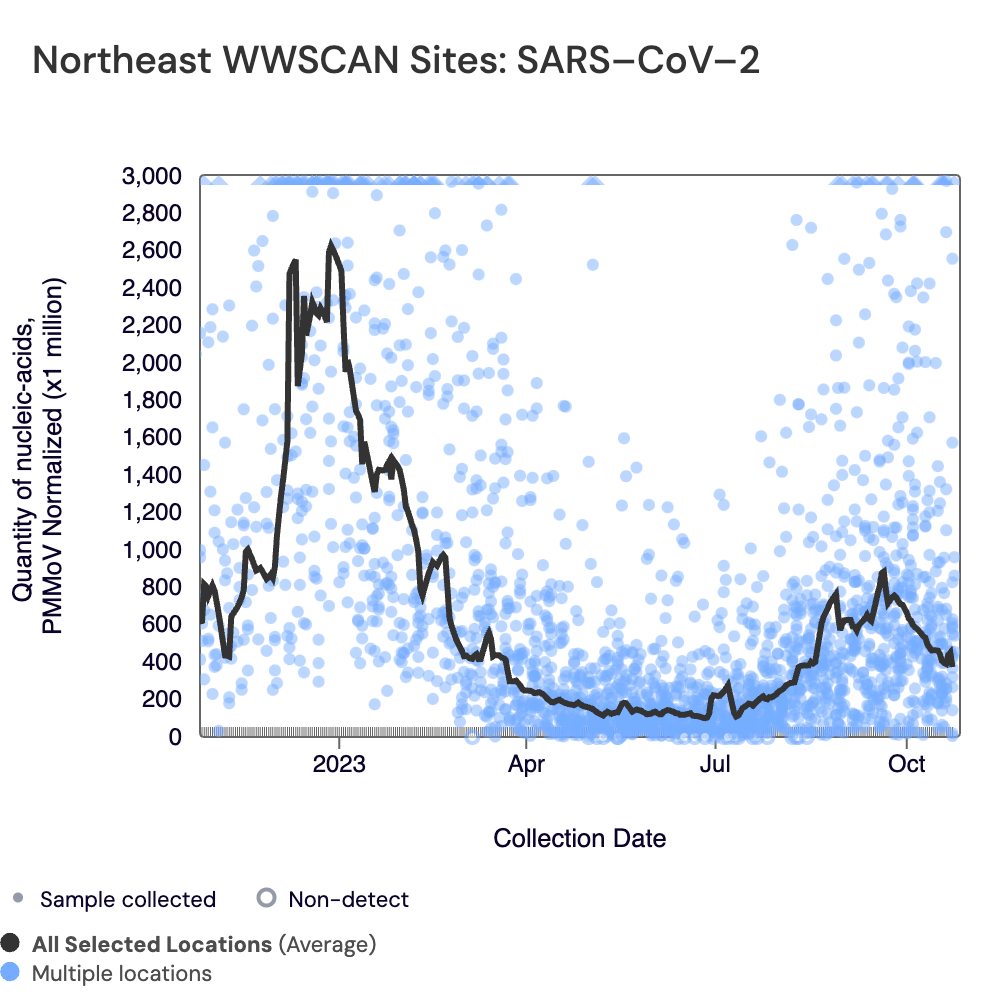
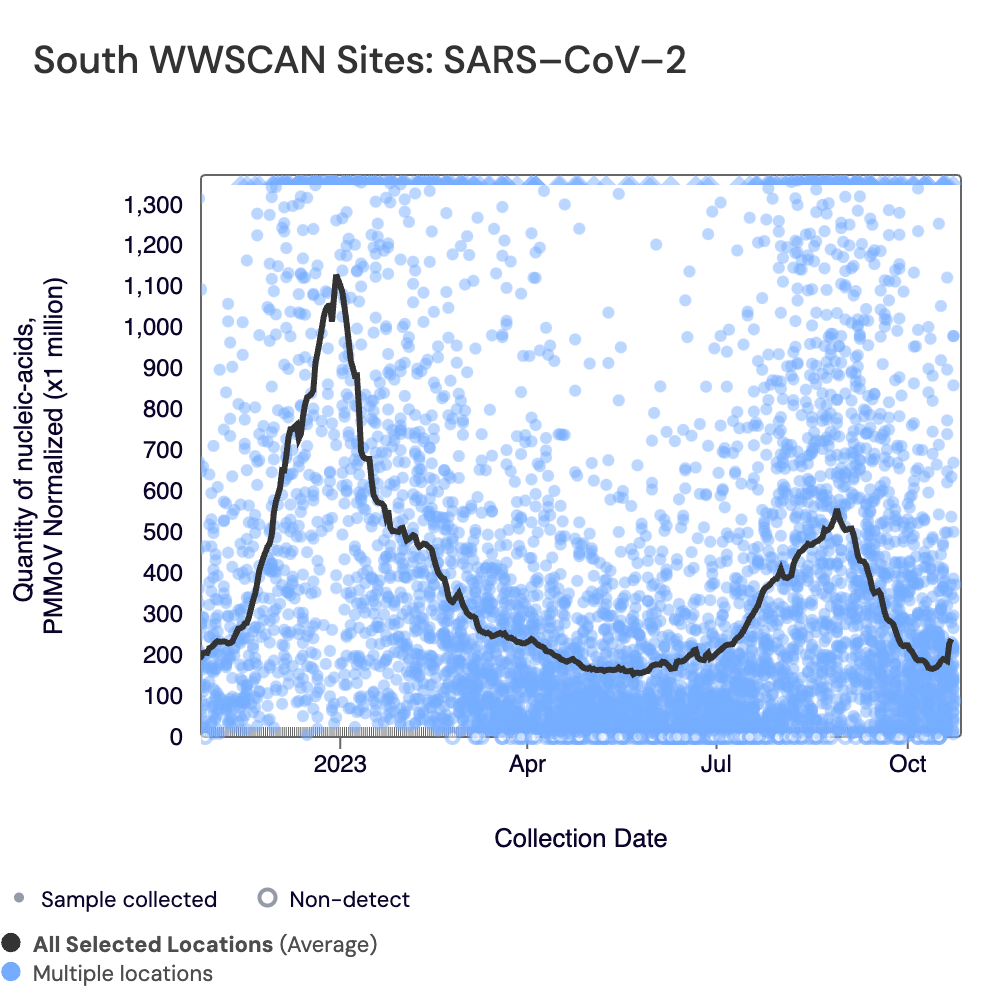
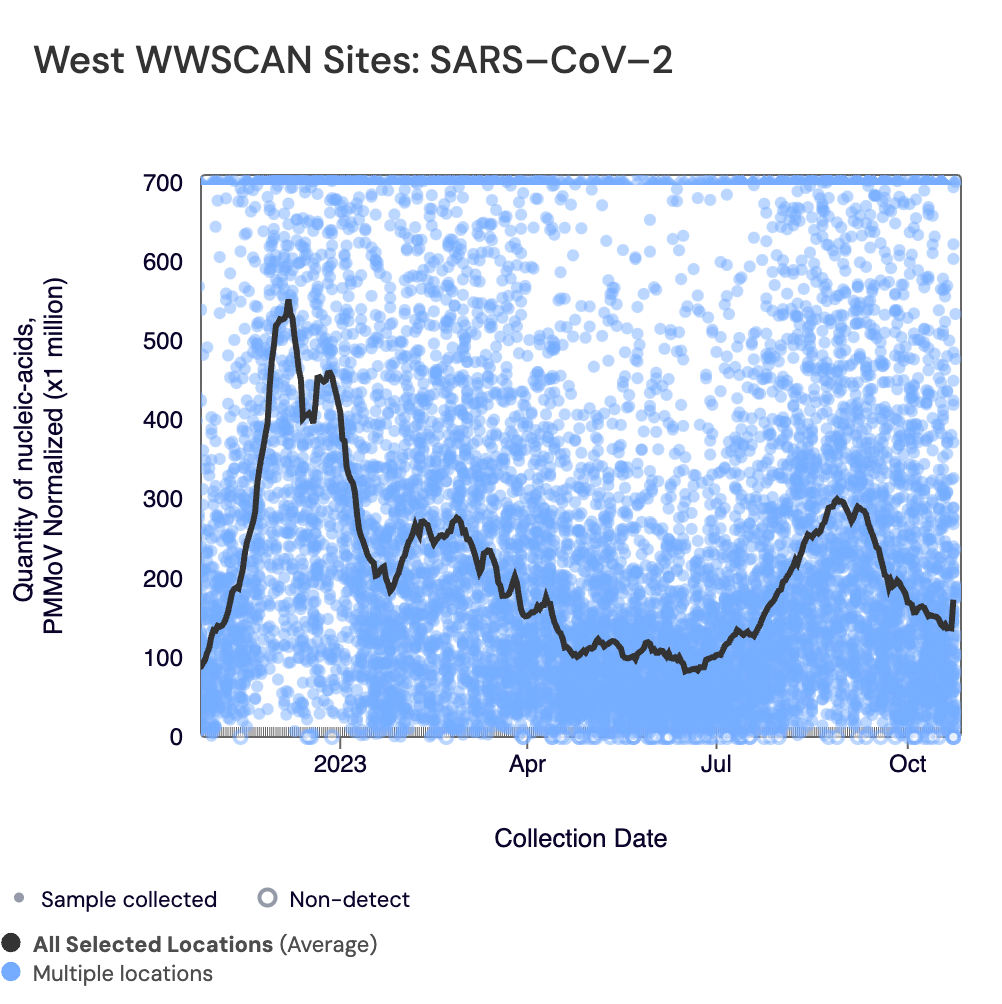
Below are the SARS-CoV-2 N gene concentrations (normalized by PMMoV) from sites in the Midwest US (top left panel), Northeast US (top right panel), Southern US (bottom left panel) and Western US (bottom right panel) over the last 365 days. The population weighted average across the regional WWSCAN plants is shown in black, and the raw data are shown in blue. Evident in the data is a recent peak in concentrations around September across all US regions with medium to high levels presently observed. Concentrations across all 4 regionals levels are well above the detection limit of the N gene, and recent measurements suggest that concentrations are slightly increasing in some regions.
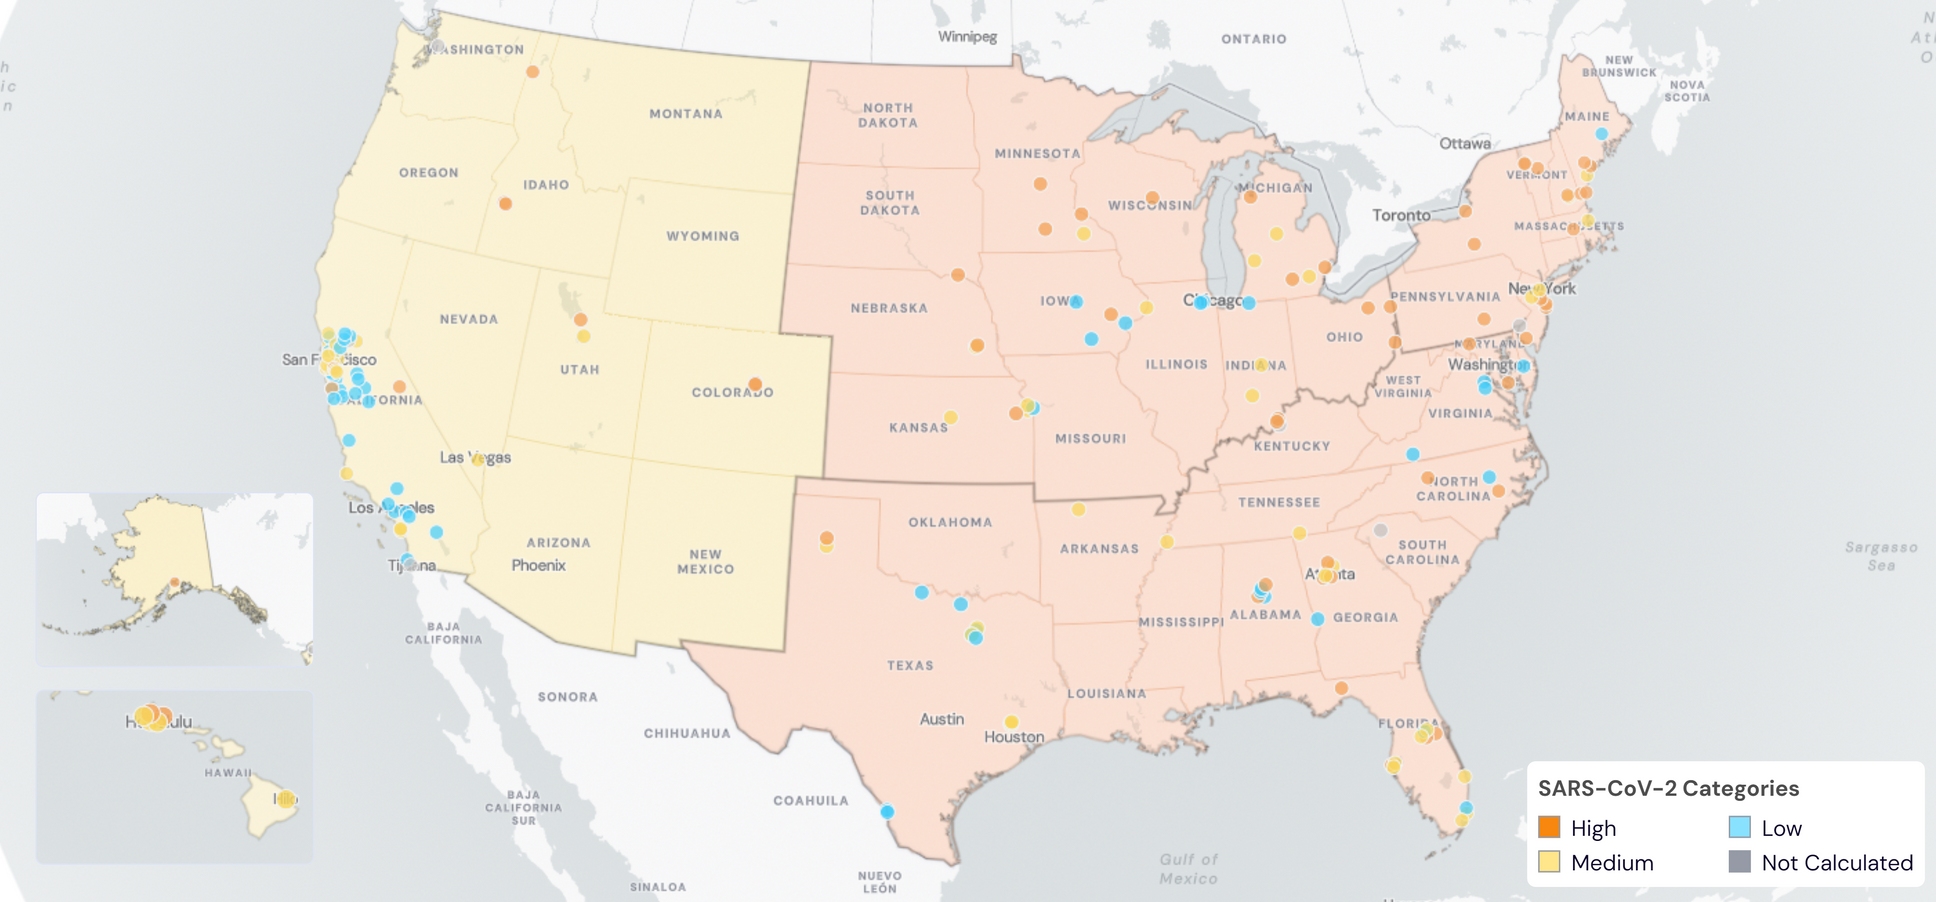
Below are the current SARS-CoV-2 wastewater categories for all WWSCAN sites:
- 54 are in the LOW Wastewater Category
- 65 are in the MEDIUM Wastewater Category
- 60 are in the HIGH Wastewater Category
- 4 do not have enough data to calculate (South San Diego, CA; Louisville, KY; Chester, PA; Snohomish, WA)
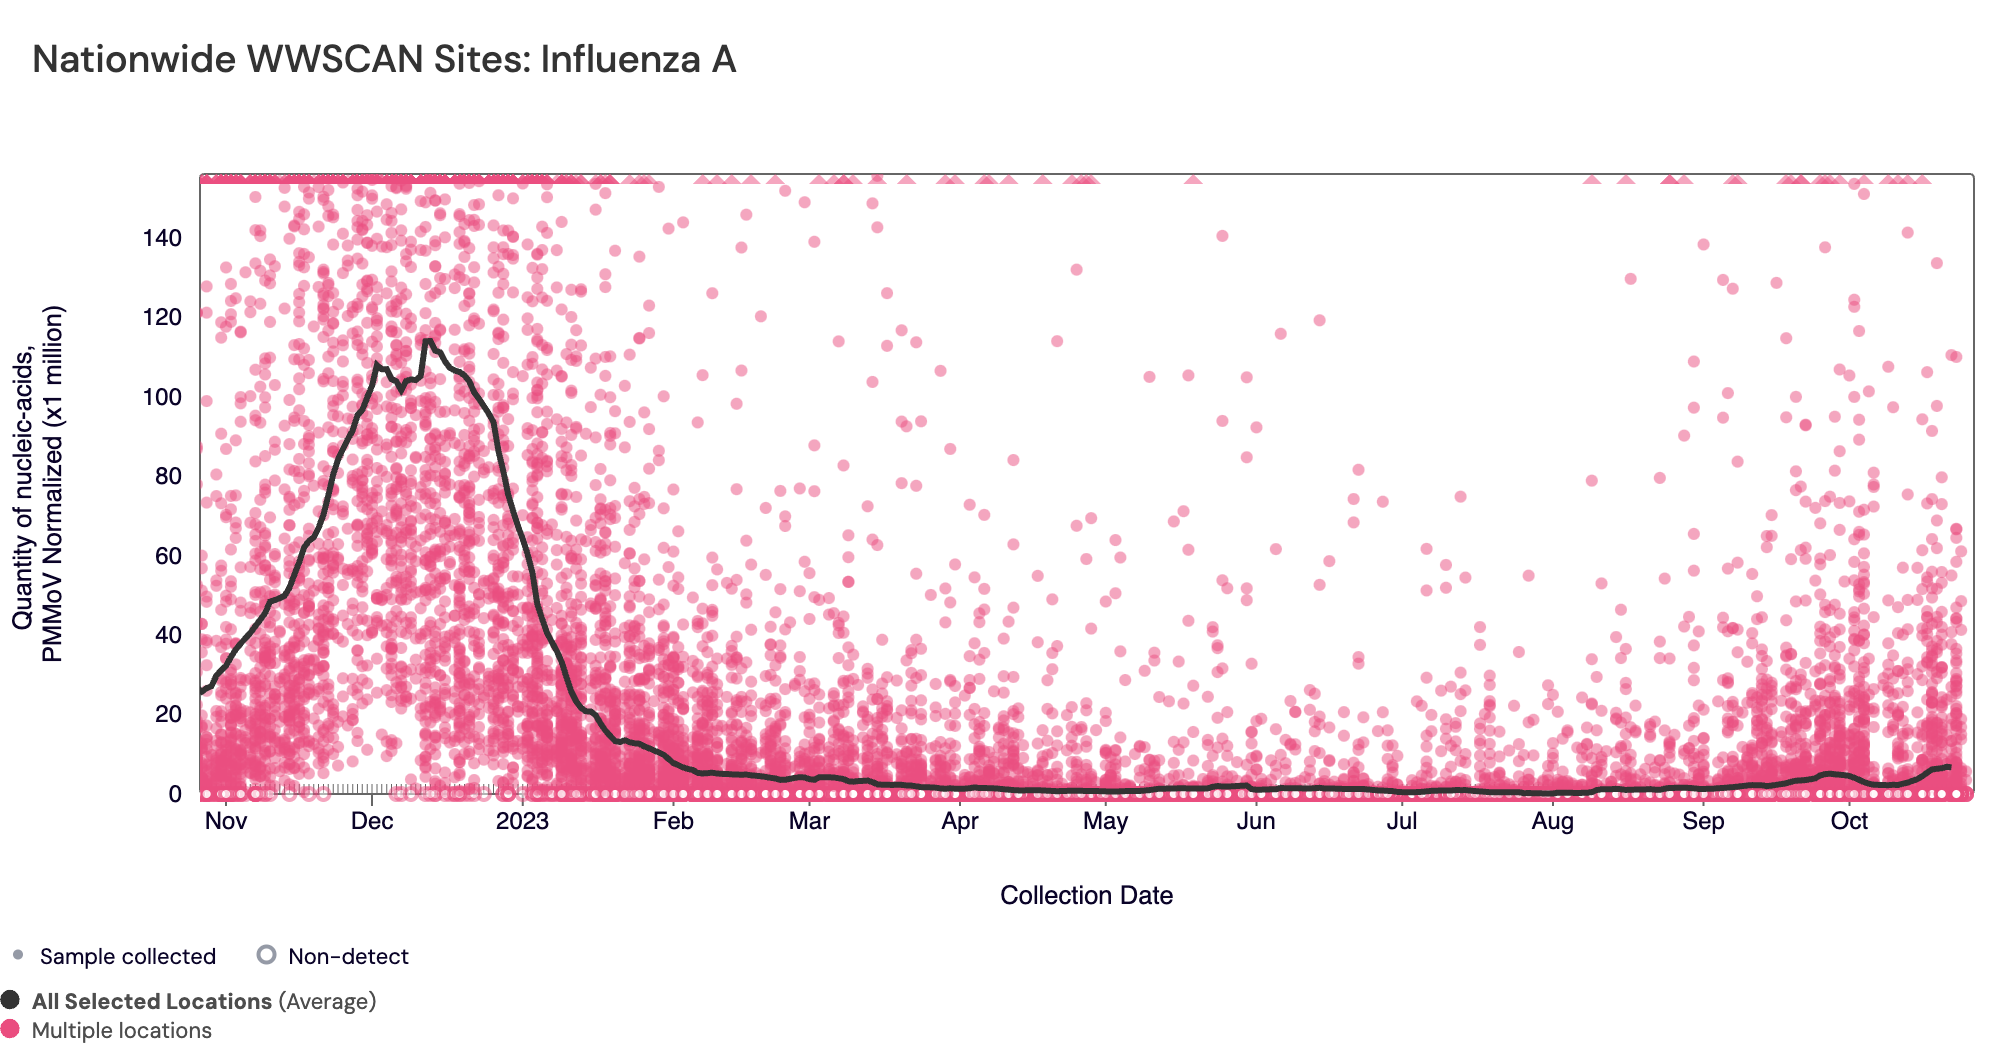
Influenza A (IAV) RNA concentrations (normalized by PMMoV) are low. The median concentration across all sites over the last 21 days is below the lower detection limit of the assay. There have been 437 positive samples out of 1,376 samples during the past 21 days (~31.8% detection rate). Below are the IAV RNA concentrations (normalized by PMMoV) from all participating WWSCAN sites across the country over the last 365 days. The pink dots are the raw data and the black line is the population weighted average.
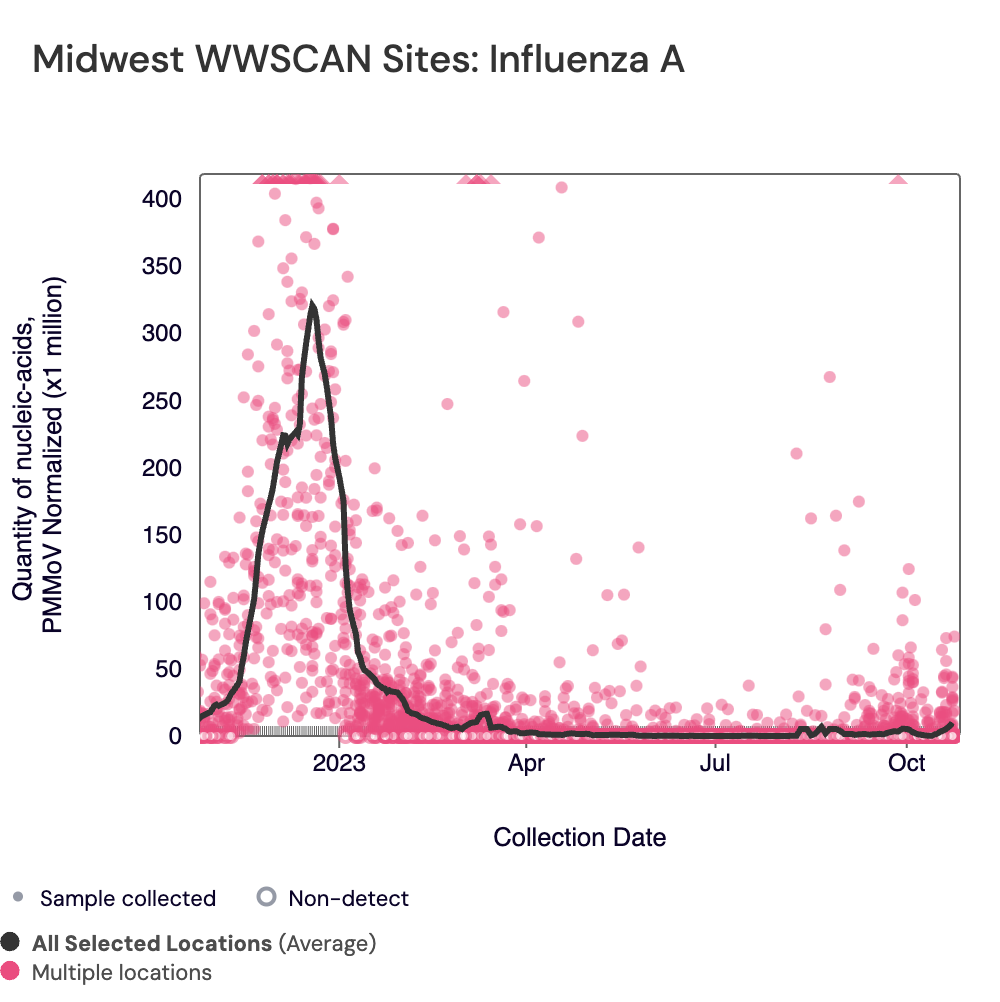
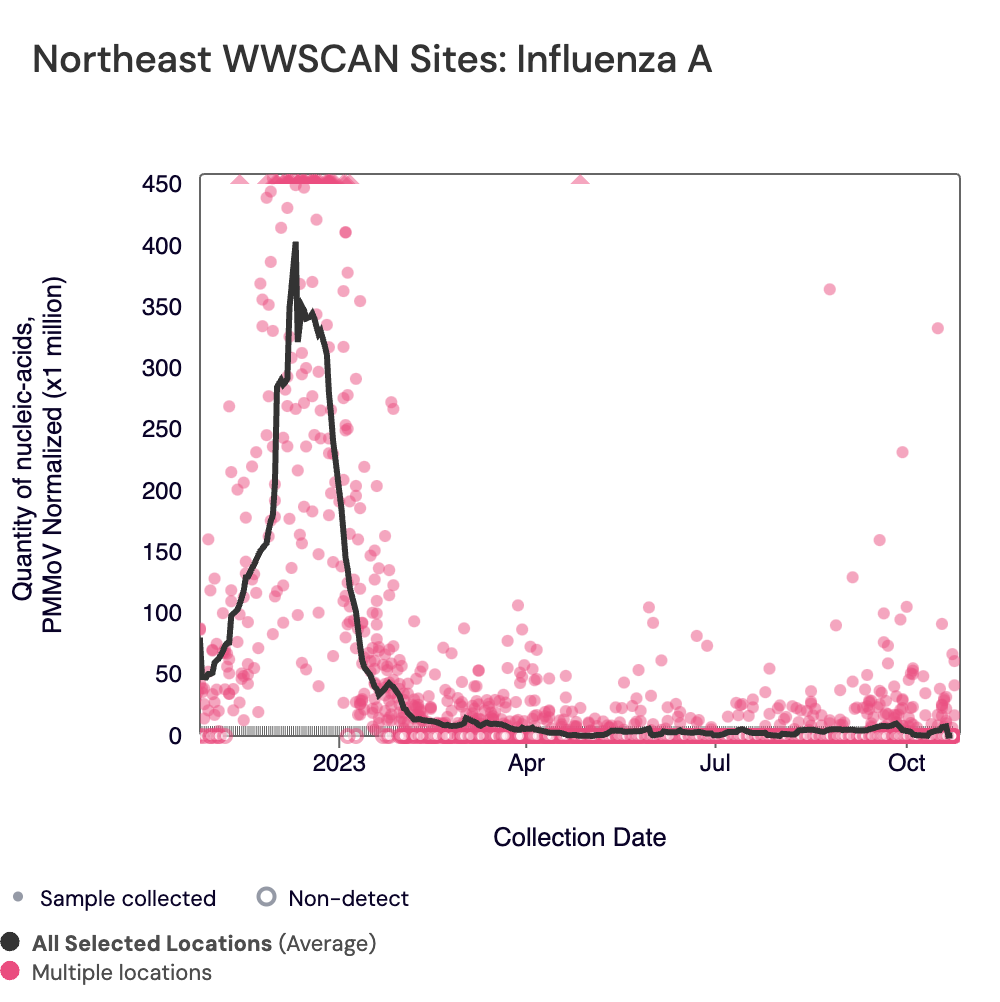
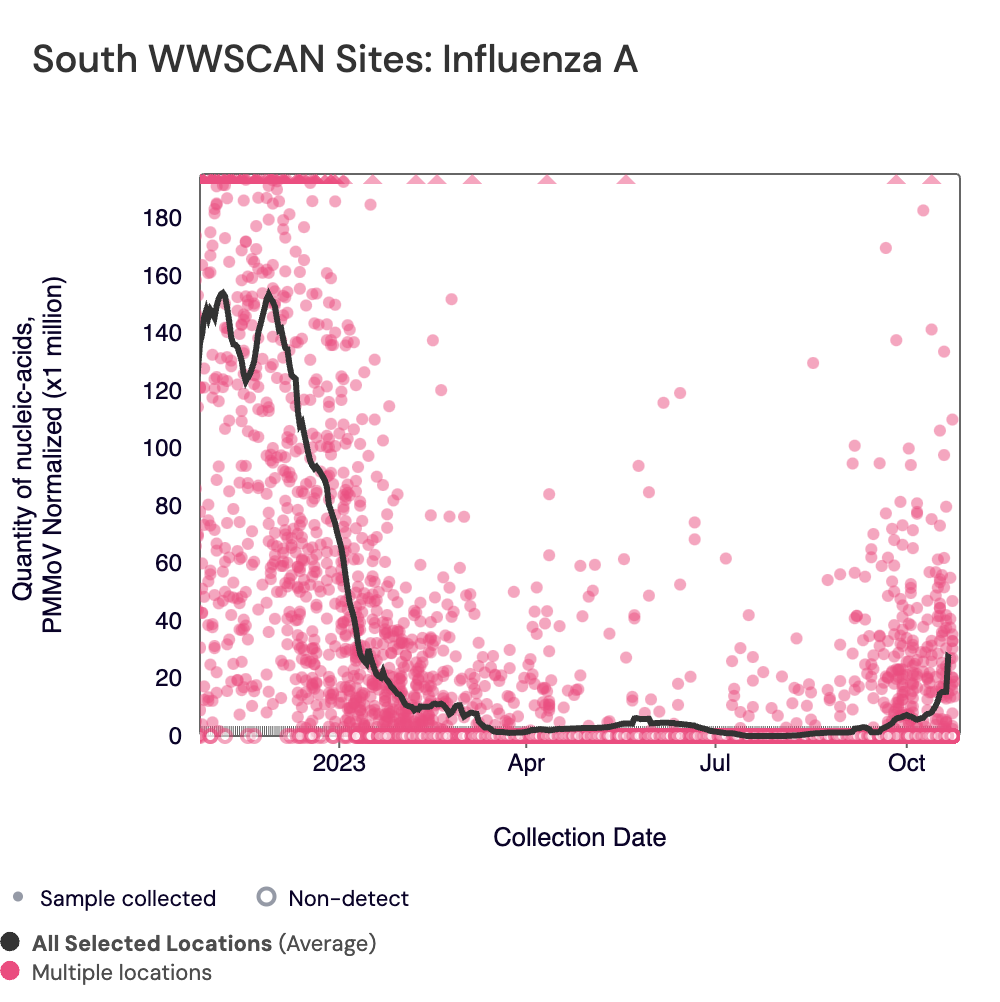
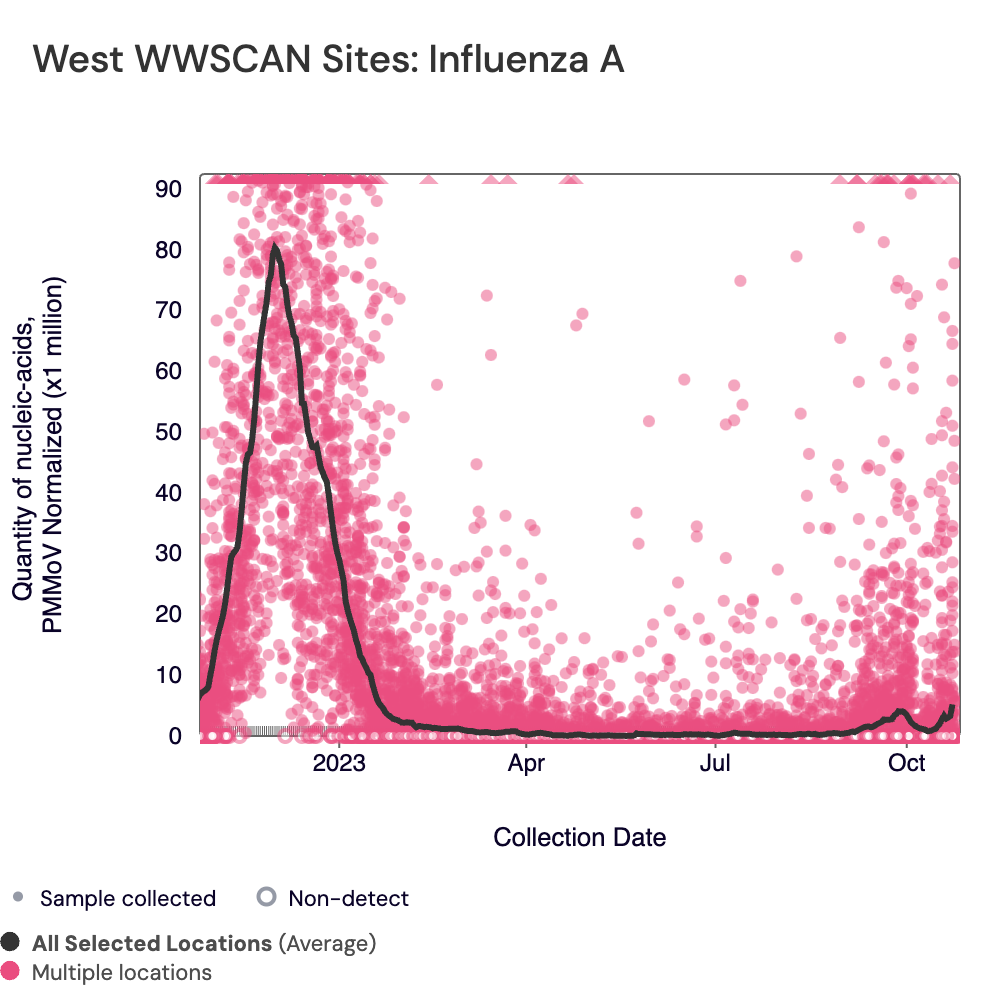
Below are the IAV RNA concentrations (normalized by PMMoV) from sites in the Midwest US (top left panel), Northeast US (top right panel), Southern US (bottom left panel) and Western US (bottom right panel) over the last 365 days. The population weighted average across regional WWSCAN plants is shown in black, raw data are shown in pink. Evident in the data is relatively high concentrations across all US regions during the last influenza season with low levels and mostly non-detects presently observed, but with an increasing rate of positive samples in recent weeks.
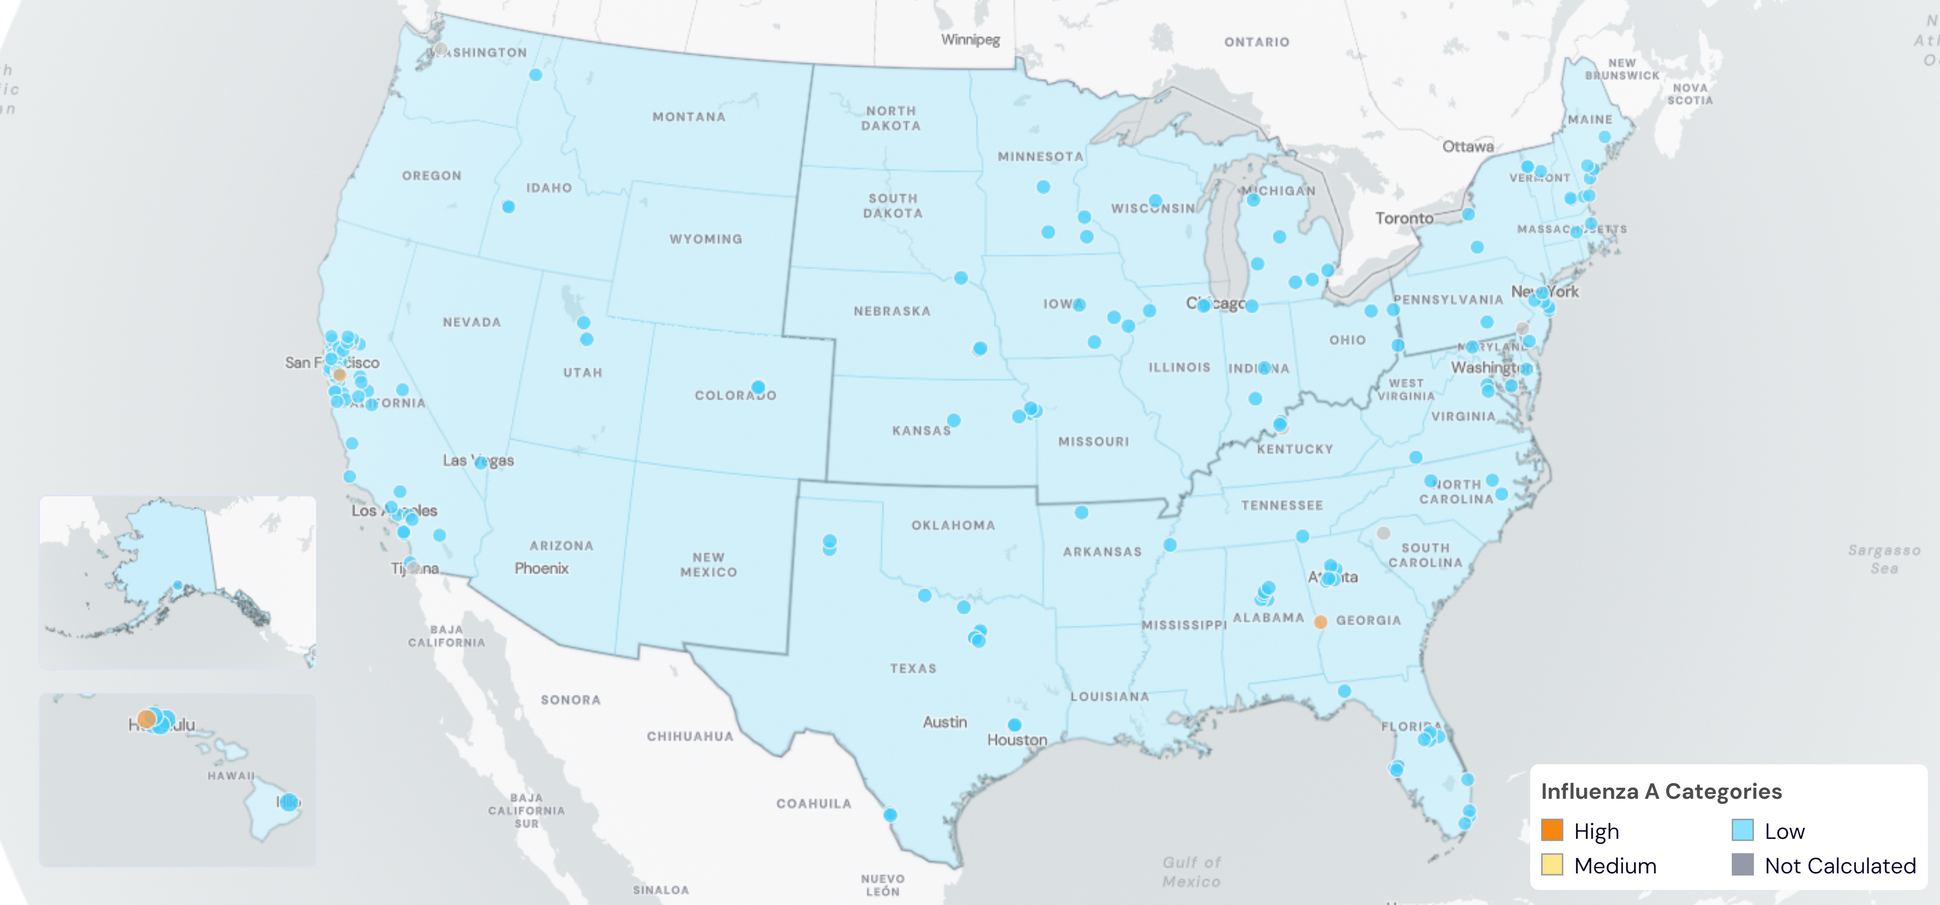
Below are the current Influenza A wastewater categories for all WWSCAN sites:
- 176 are in the LOW Wastewater Category
- 0 are in the MEDIUM Wastewater Category
- 3 are in the HIGH Wastewater Category
- 4 do not have enough data to calculate (South San Diego, CA; Louisville, KY; Chester, PA; Snohomish, WA)
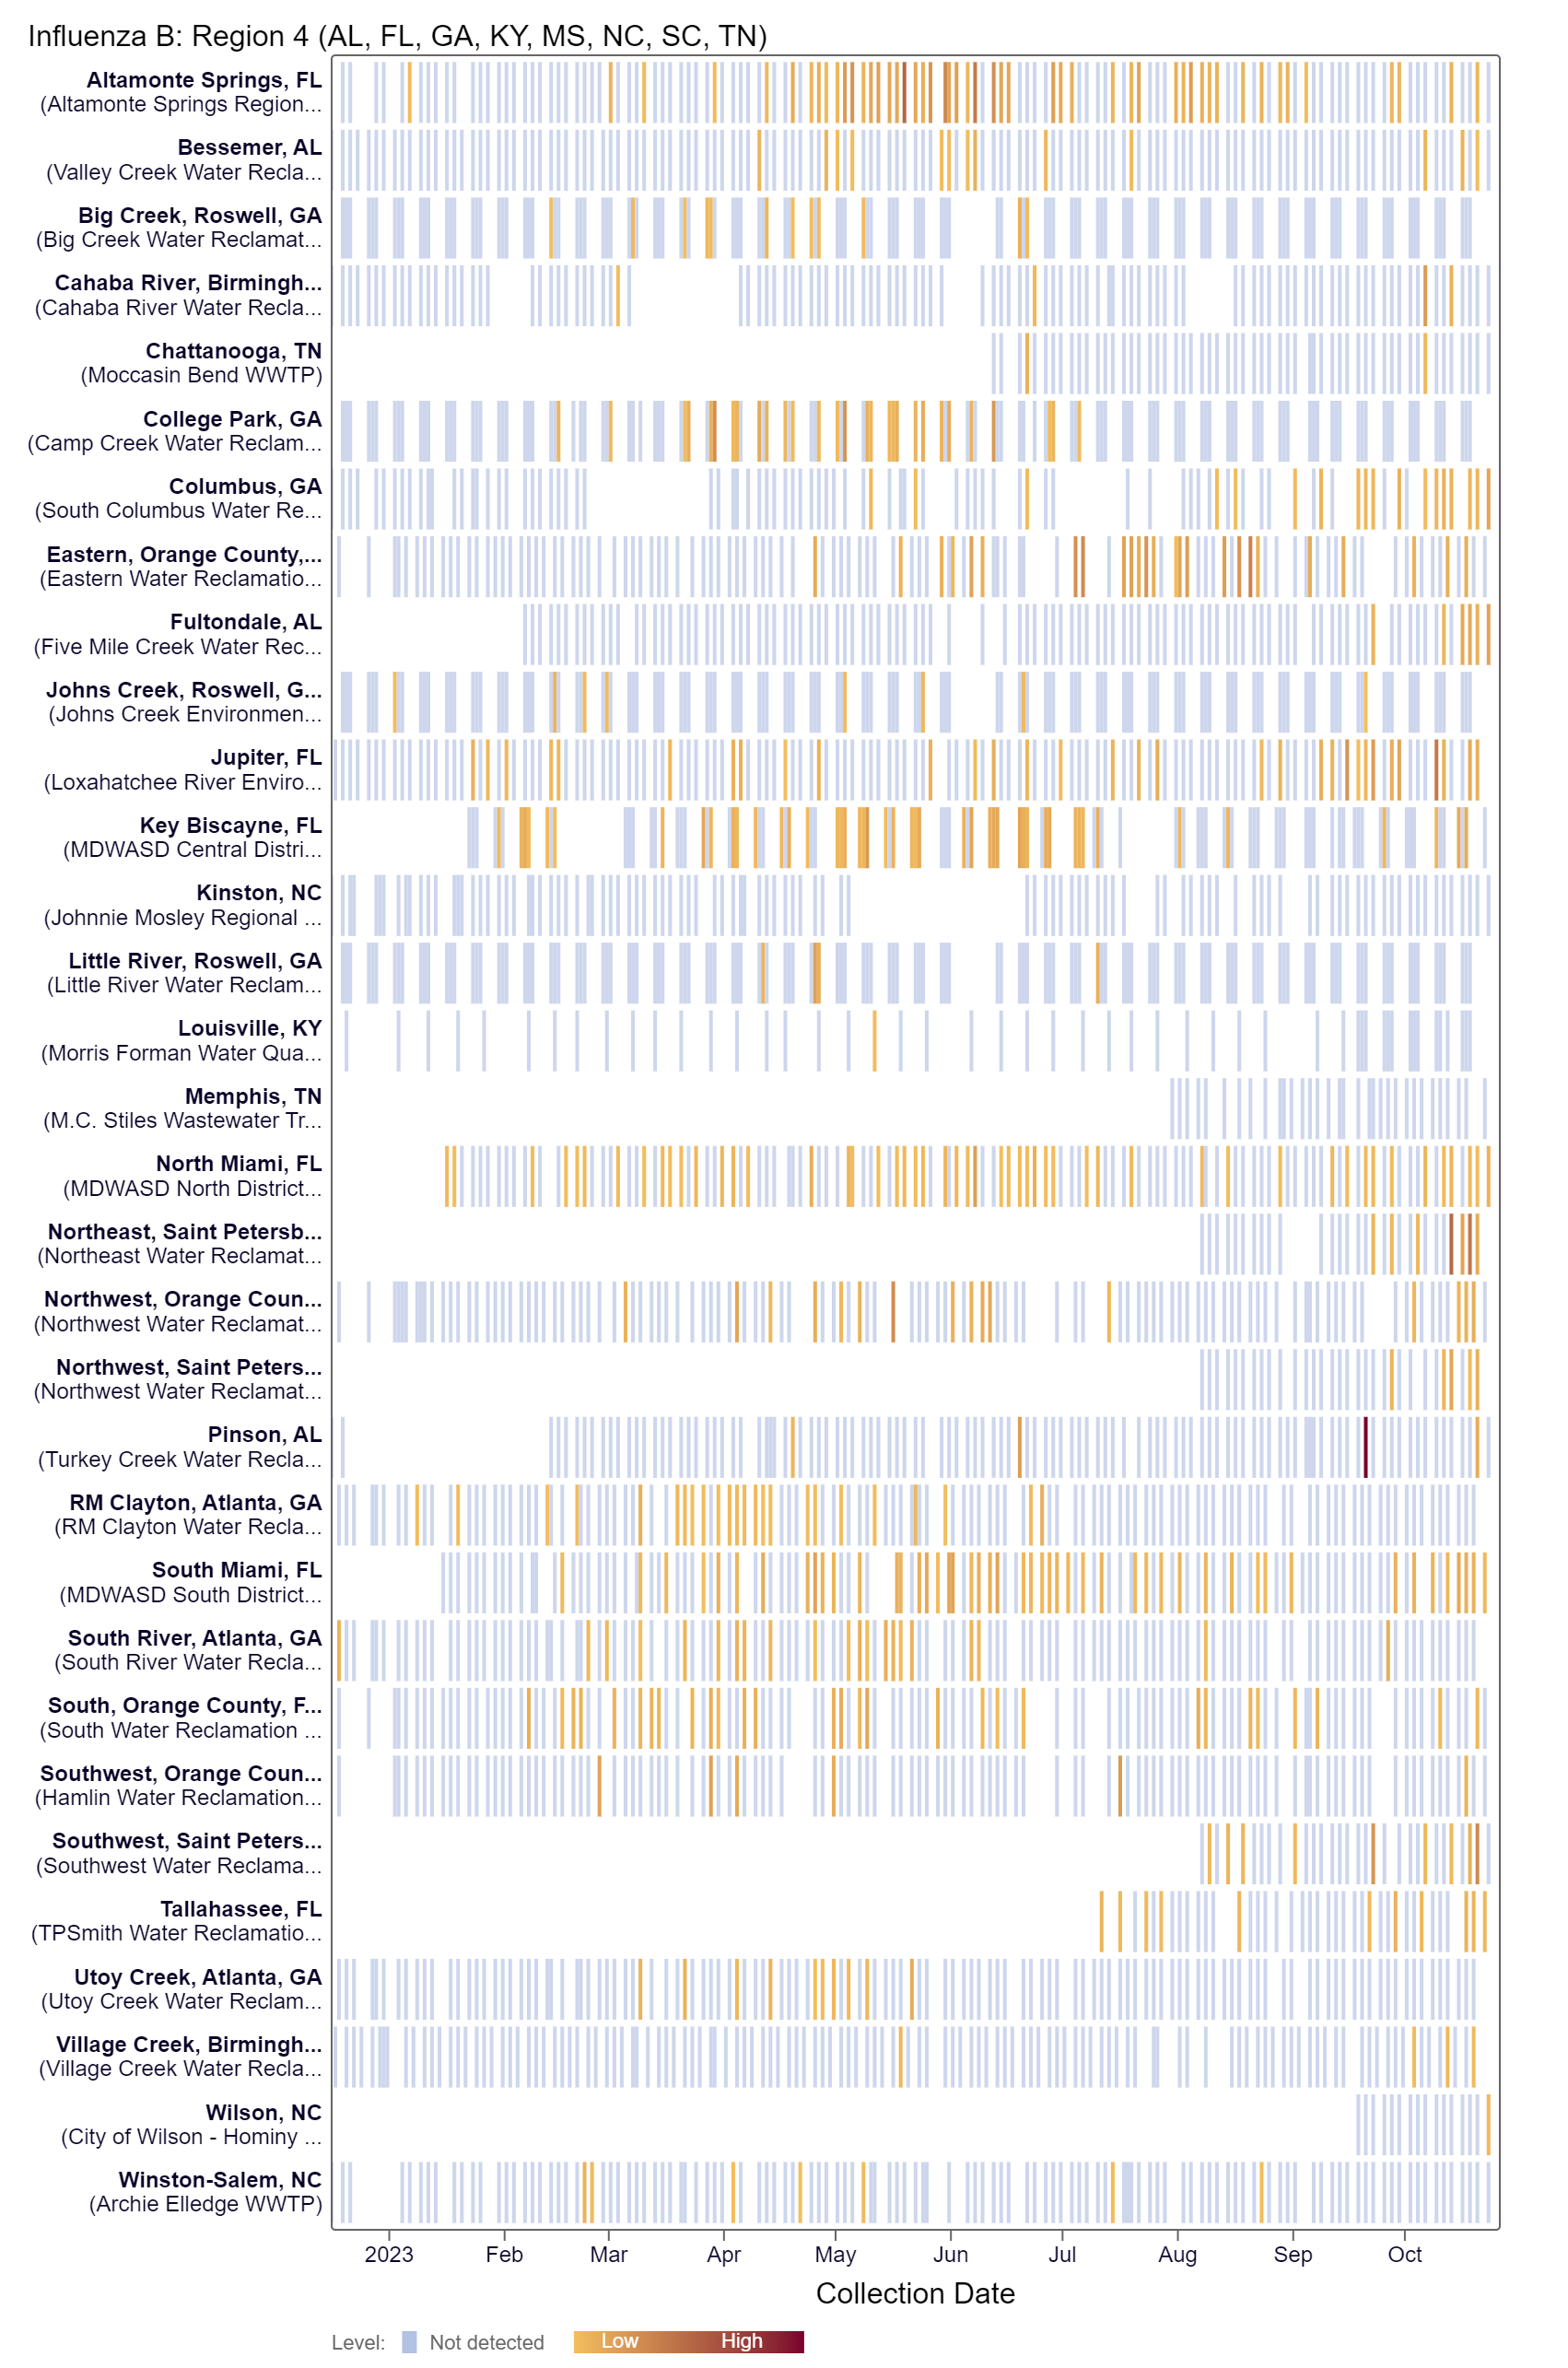
Influenza B (IBV) RNA concentrations are mostly non-detect at WWSCAN sites. There have been 137 positive samples out of 1,376 samples during the past 21 days (~10% detection rate), all at low concentrations. Below is a heat map showing IBV detections at all the plants in WWSCAN in HHS Region 4. Each location is a row, and the date is a column. White indicates no sample, blue indicates non-detect, and the orange to red show variable concentrations of IBV. You can see how IBV RNA is occasionally detected since we began measuring it in mid December 2022 at these sites.
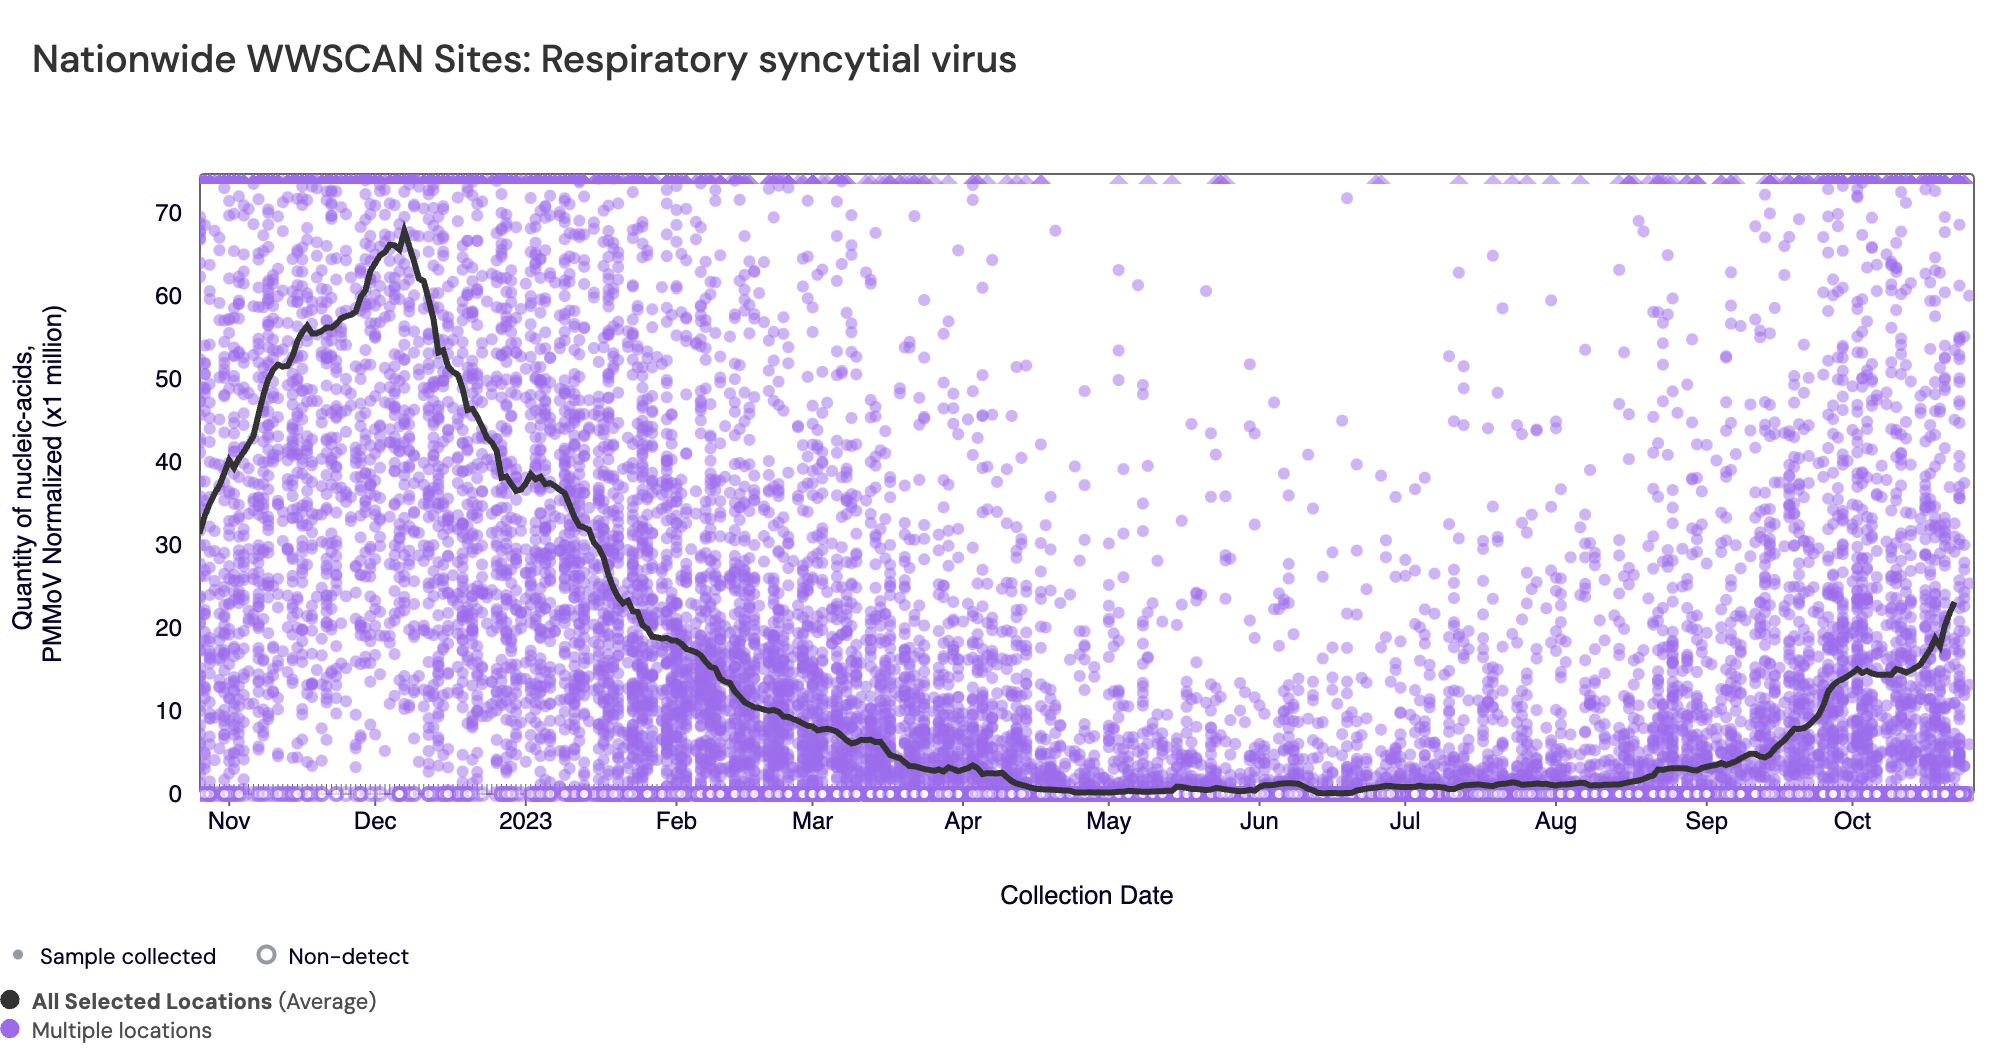
Respiratory syncytial virus (RSV) RSV RNA median concentration across all sites over the last 21 days is 2,160 copies/gram. There have been 714 positive samples out of 1,376 samples during the past 21 days (~ 51.9% detection rate). Below are the RSV RNA concentrations (normalized by PMMoV) from all participating WWSCAN sites across the country over the last 365 days. Raw data are shown as purple dots, and the black line is the population weighted average. Evident in the data are relatively high concentrations Oct 2022 - Feb 2023 with lower levels recently observed, that appear to be trending upward.
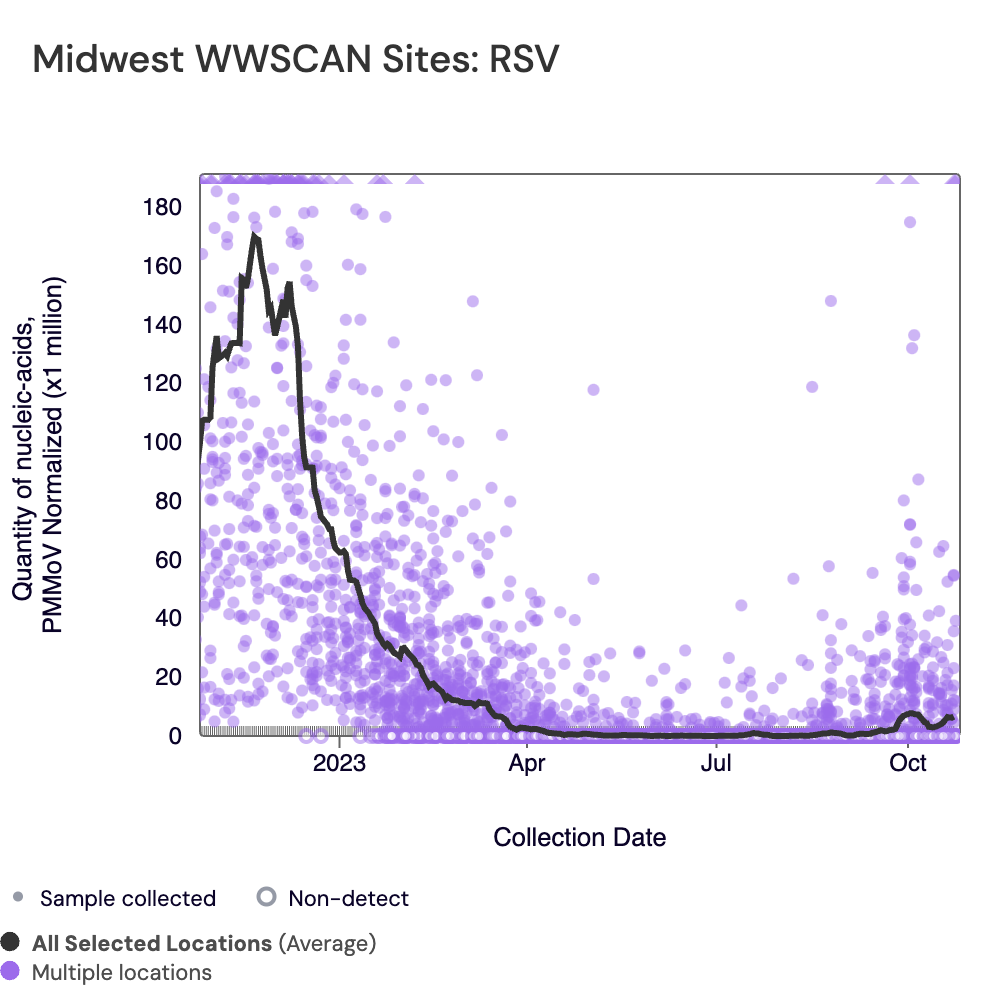
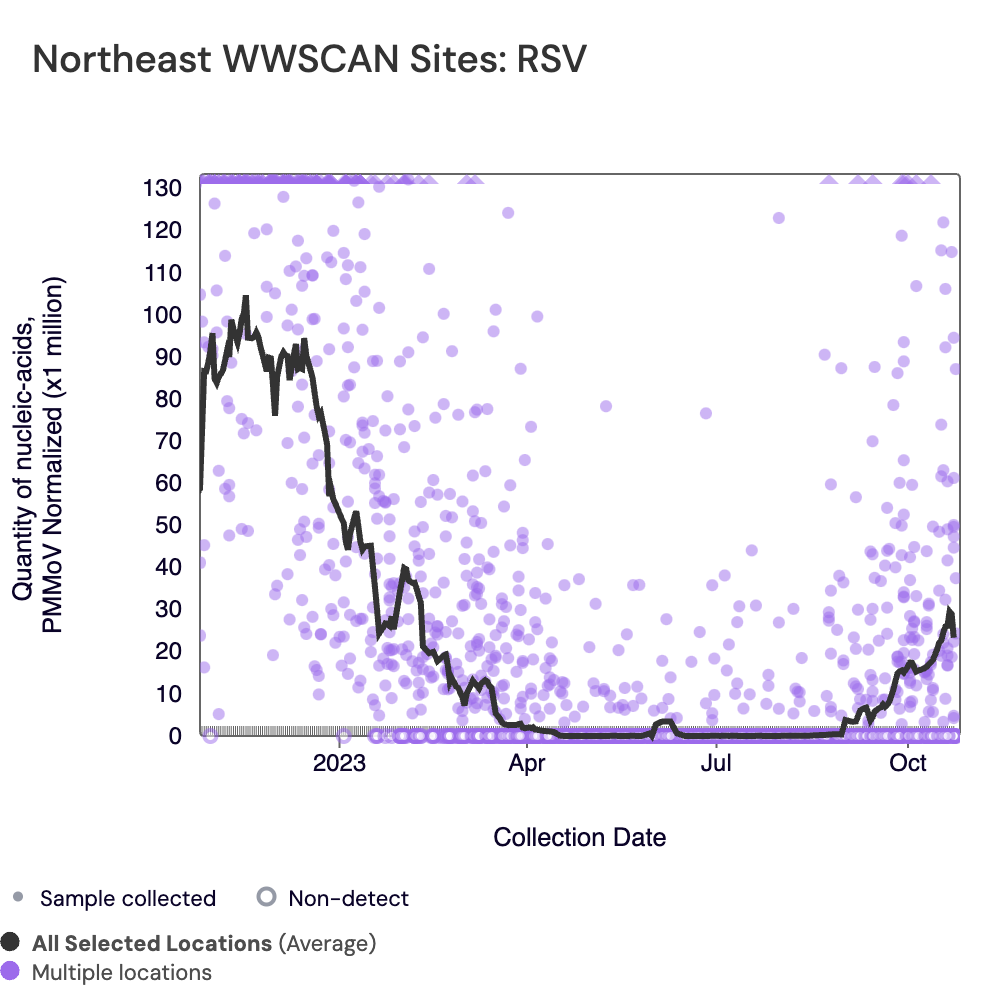
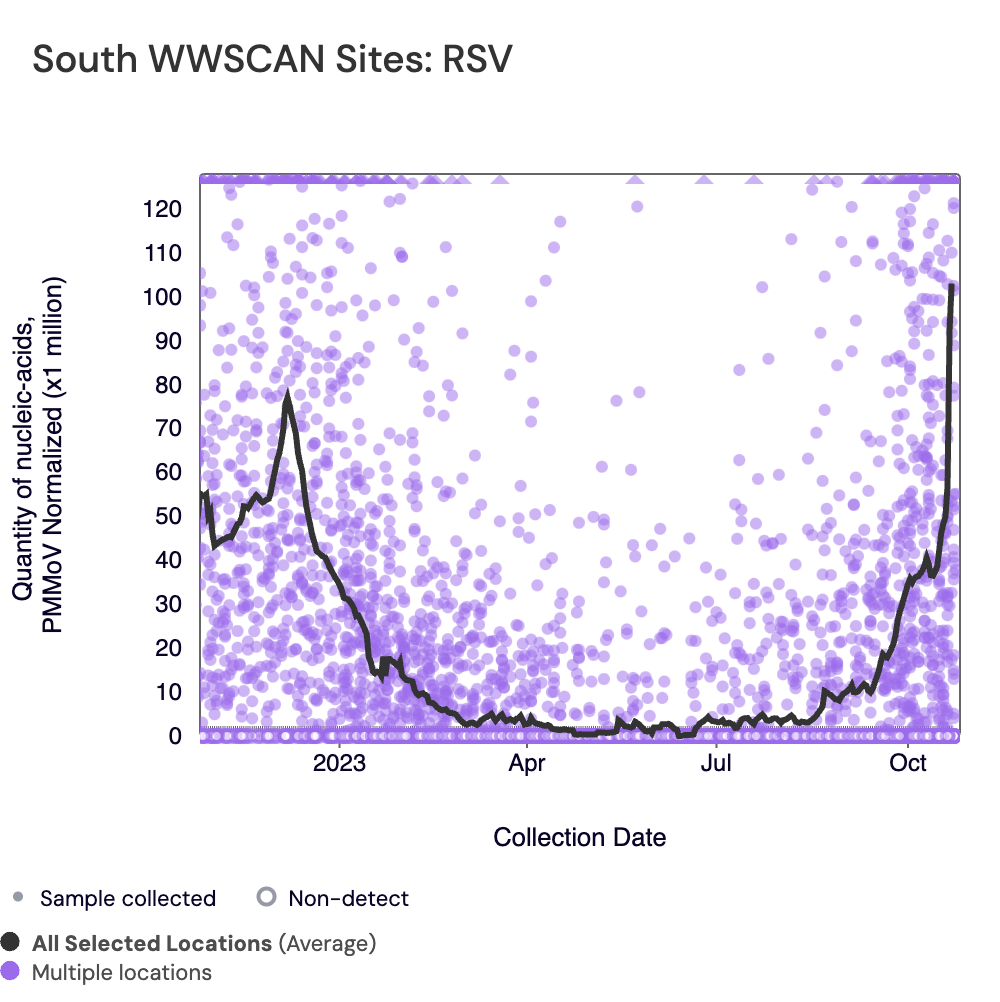
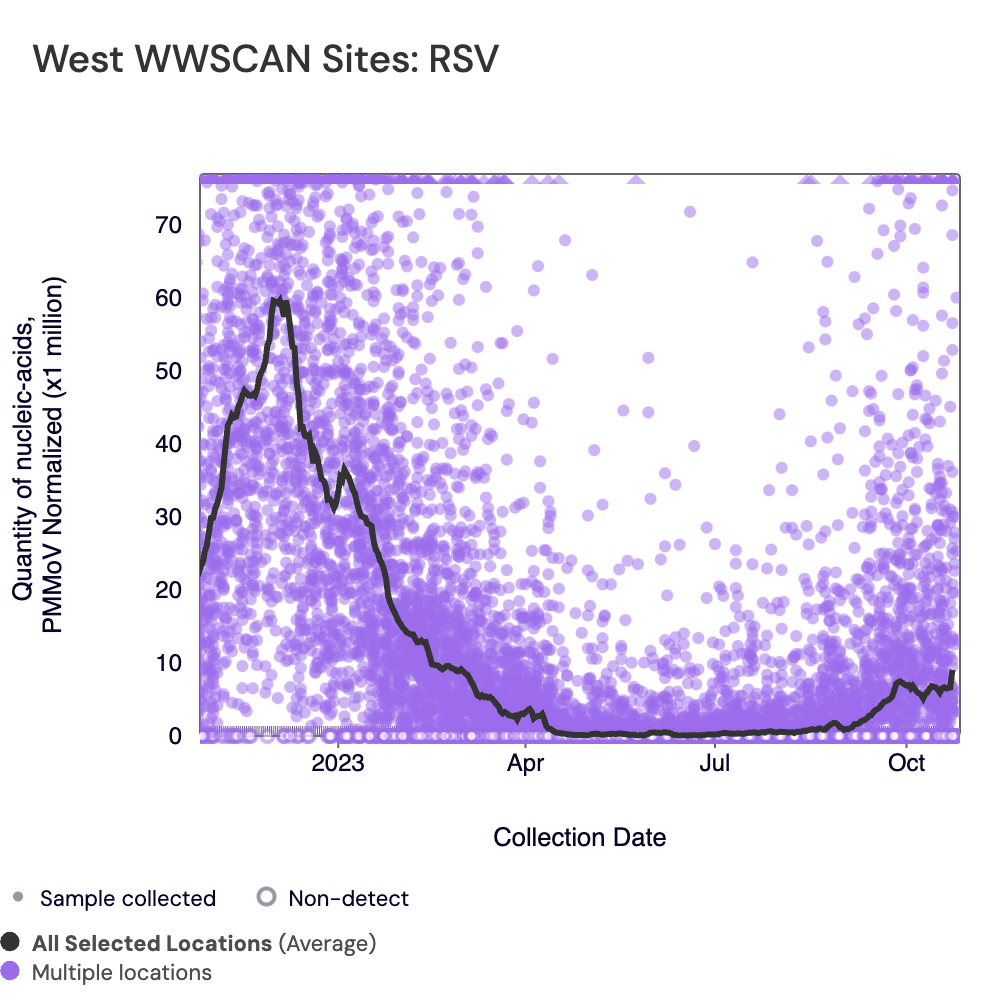
Below are the RSV RNA concentrations (normalized by PMMoV) from sites in the Midwest US (top left panel), Northeast US (top right panel), Southern US (bottom left panel) and Western US (bottom right panel) over the last 365 days. The population weighted average across regional WWSCAN plants is shown in black and raw data are shown as purple dots. In the plots below we see relatively high concentrations across all US regions around the start of the year with rising levels, particularly in the South and Northeast, presently observed.
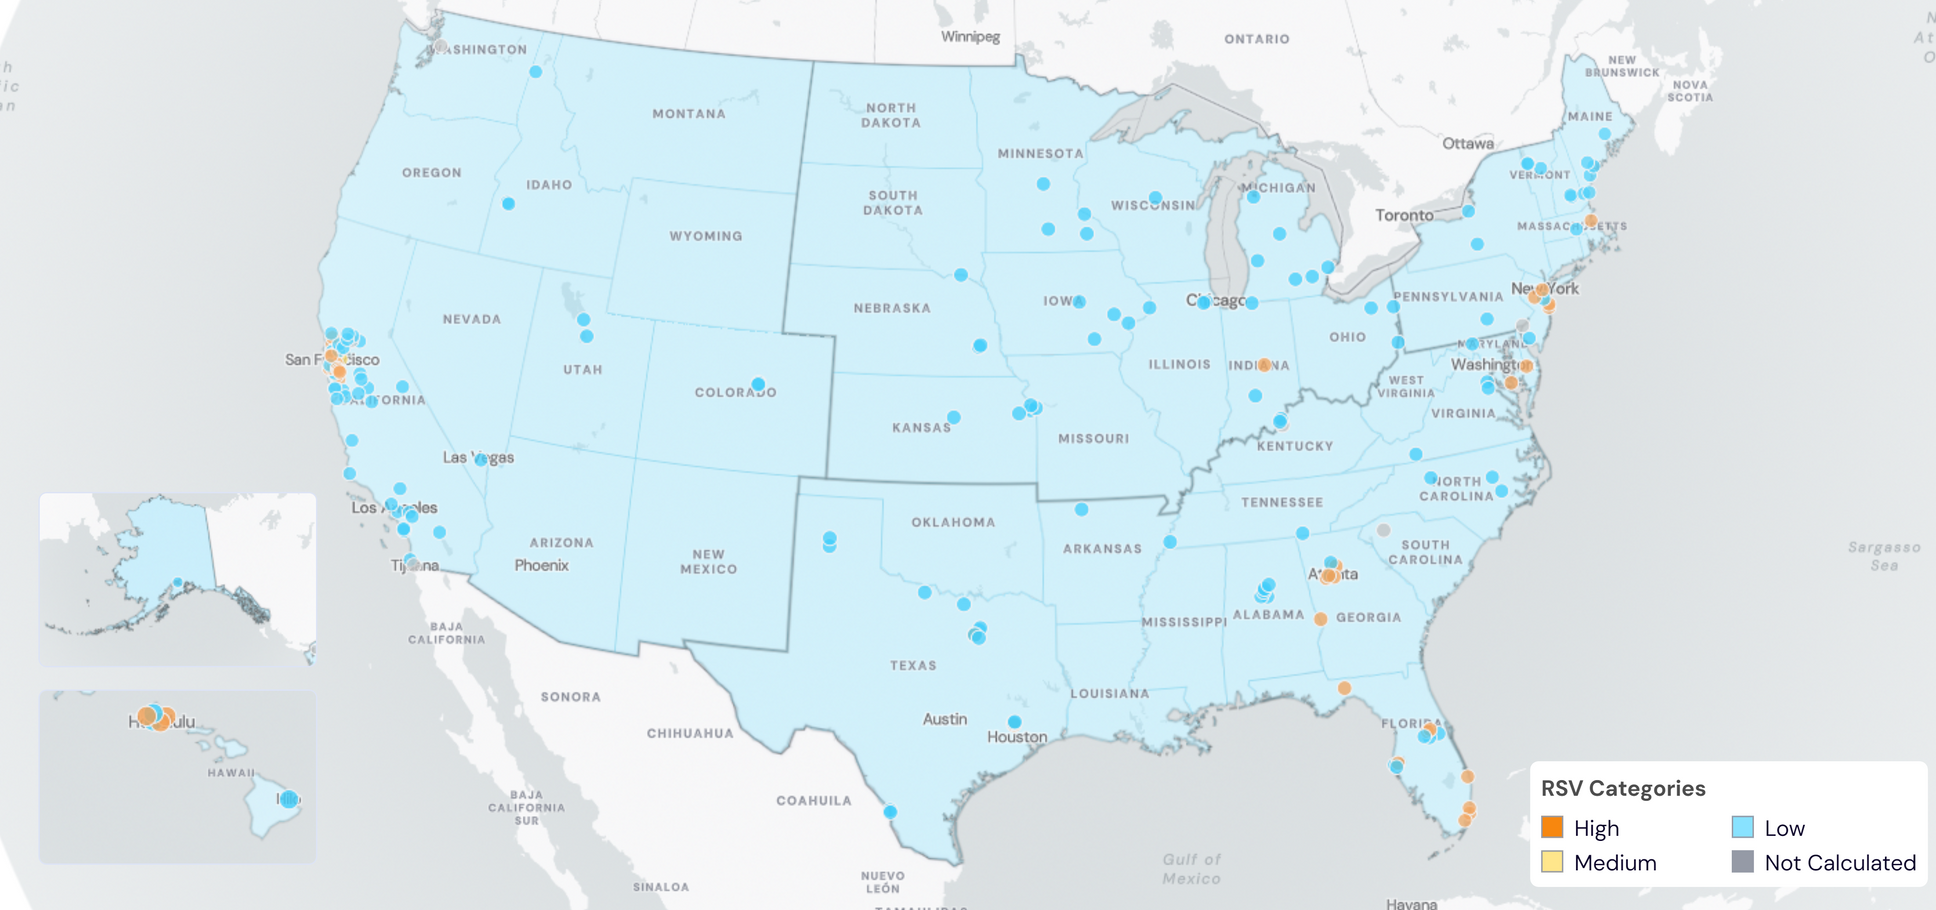
Below are the current RSV wastewater categories for all WWSCAN sites, showing at least 44 sites are showing wastewater onset for RSV:
- 135 are in the LOW Wastewater Category
- 1 are in the MEDIUM Wastewater Category
- 43 are in the HIGH Wastewater Category
- 4 do not have enough data to calculate (South San Diego, CA; Louisville, KY; Chester, PA; Snohomish, WA)
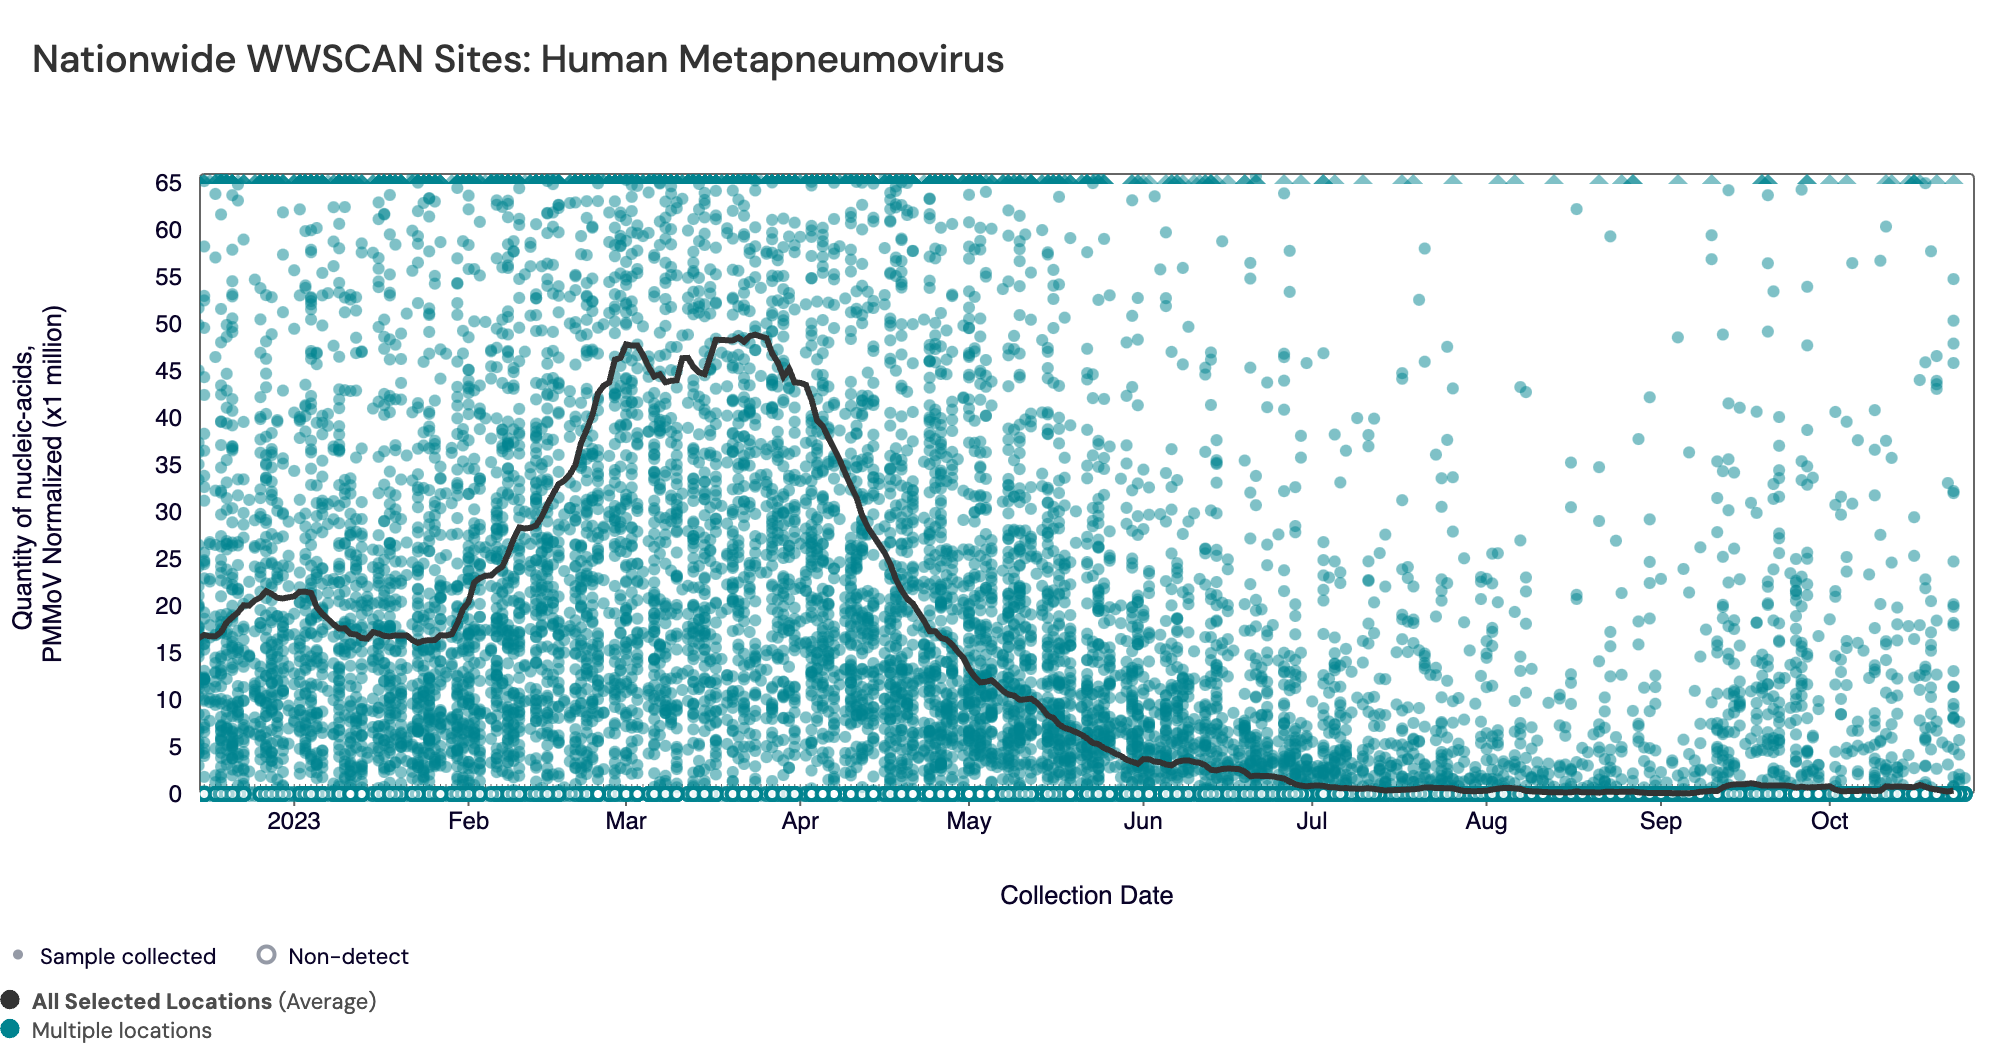
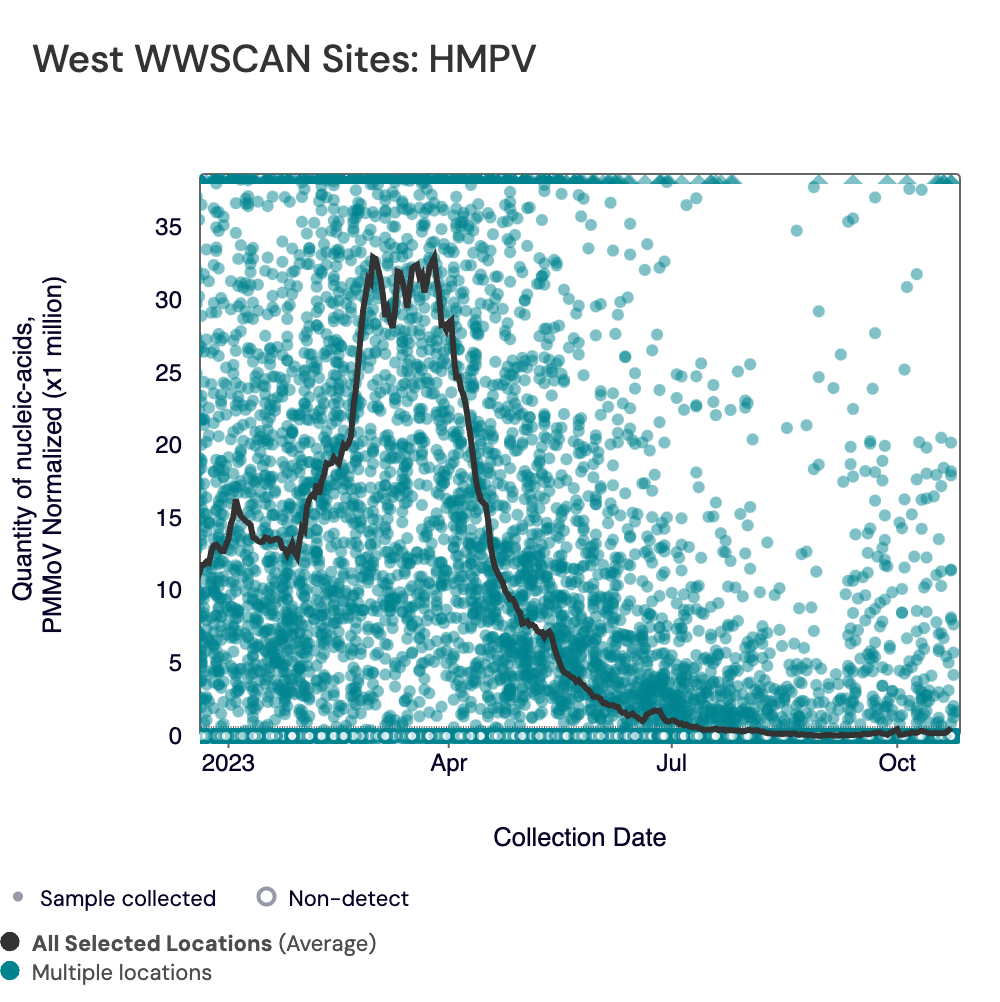
HMPV (human metapneumovirus) RNA median concentrations across all sites over the last 21 days is below the lower detection limit of the assay. Below are the HMPV RNA concentrations (normalized by PMMoV) from all participating WWSCAN sites across the country over since we started monitoring in late December 2022. The turquoise dots are the raw data and the black line is the population weighted average.
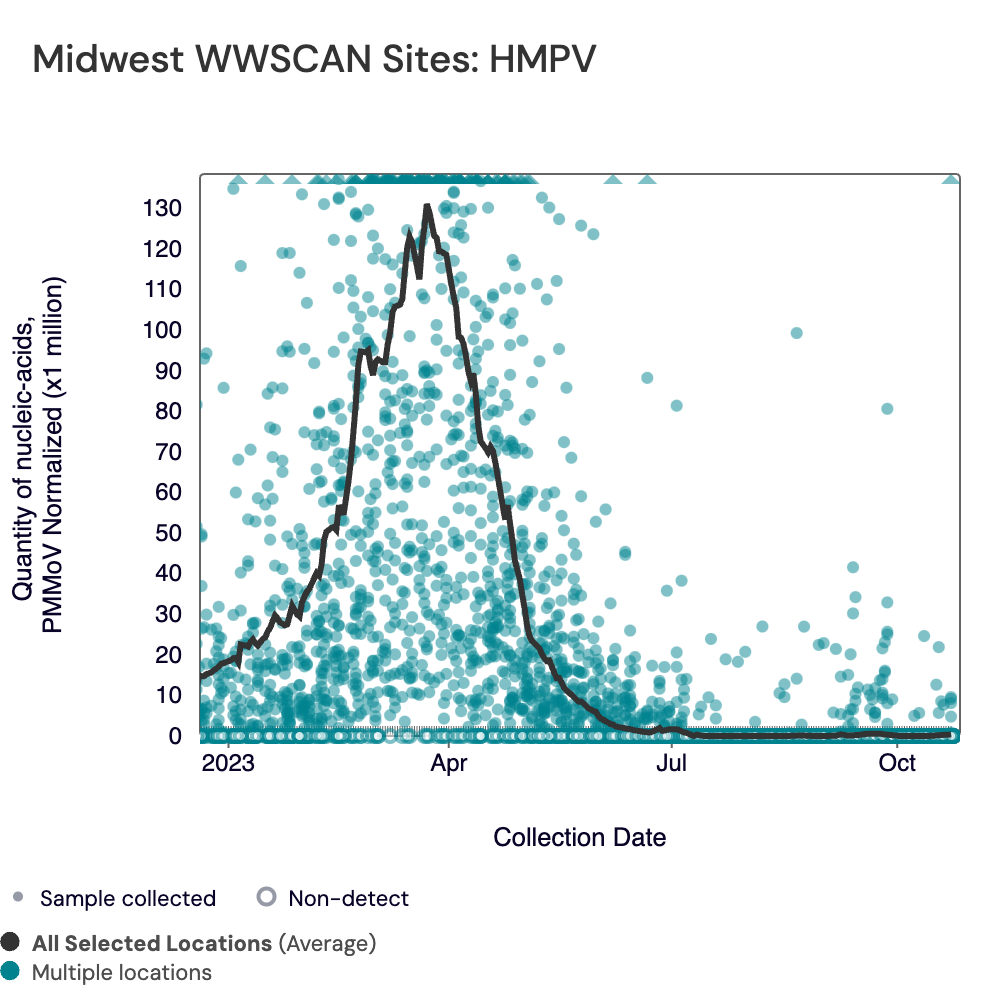
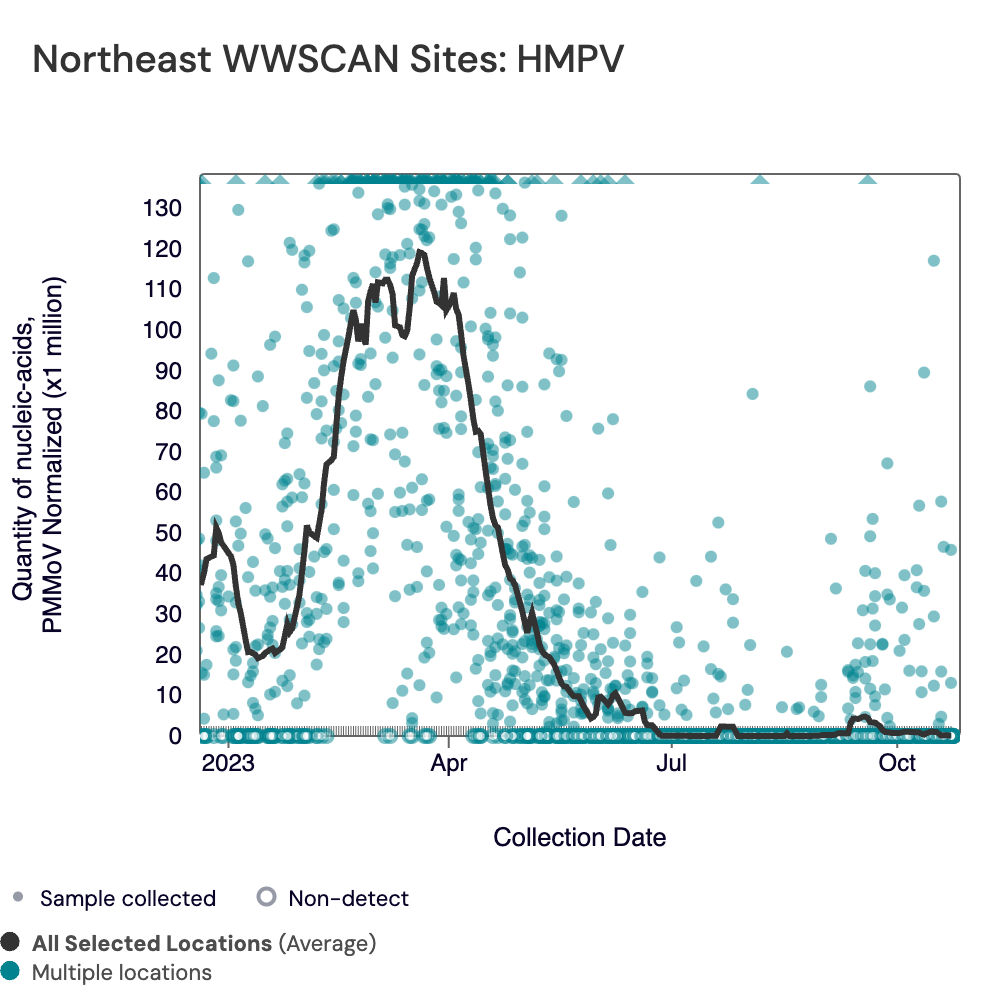
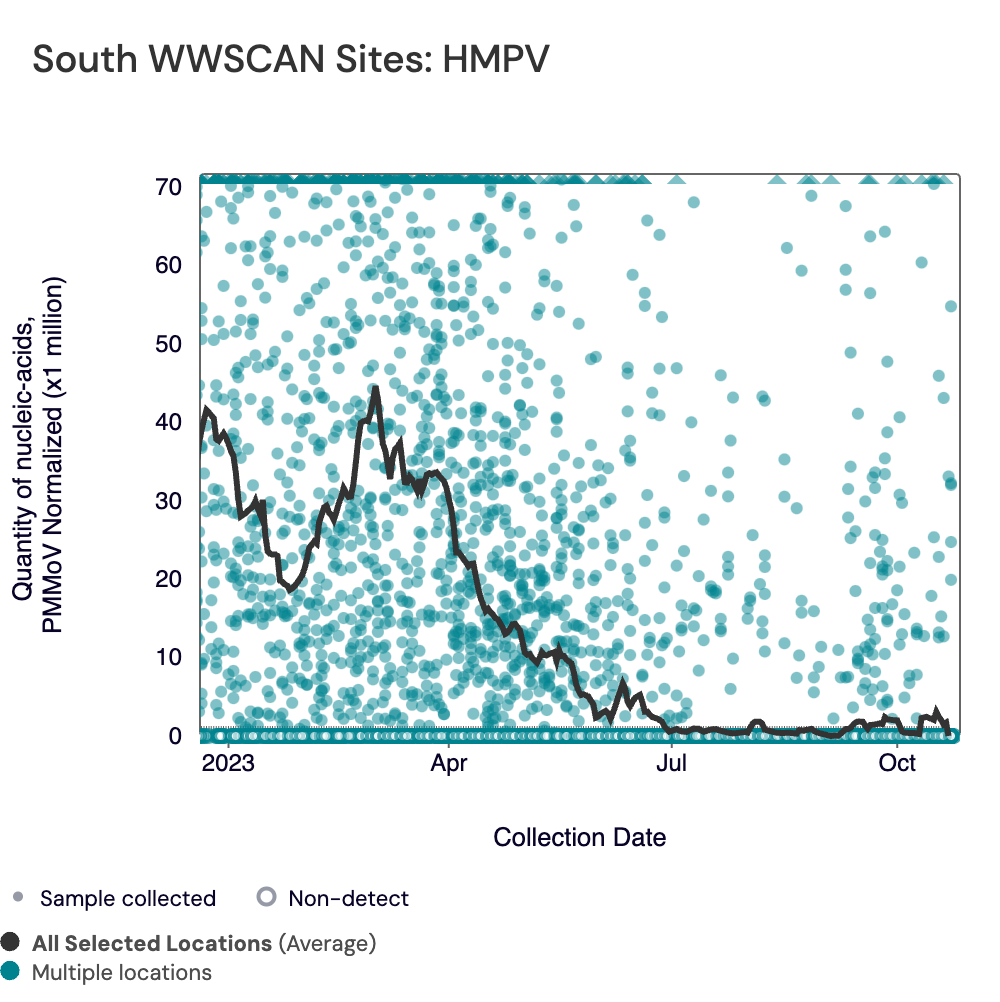
Below are the HMPV RNA concentrations (normalized by PMMoV) from sites in the Midwest US (top left panel), Northeast US (top right panel), Southern US (bottom left panel) and Western US (bottom right panel) since we started monitoring HMPV late December 2022. The population weighted average across regional WWSCAN plants is shown in black, and the raw data are shown as turquoise. Evident in the data is relatively high concentrations across all US regions around the start of the year with very low levels and mostly non-detects presently observed.
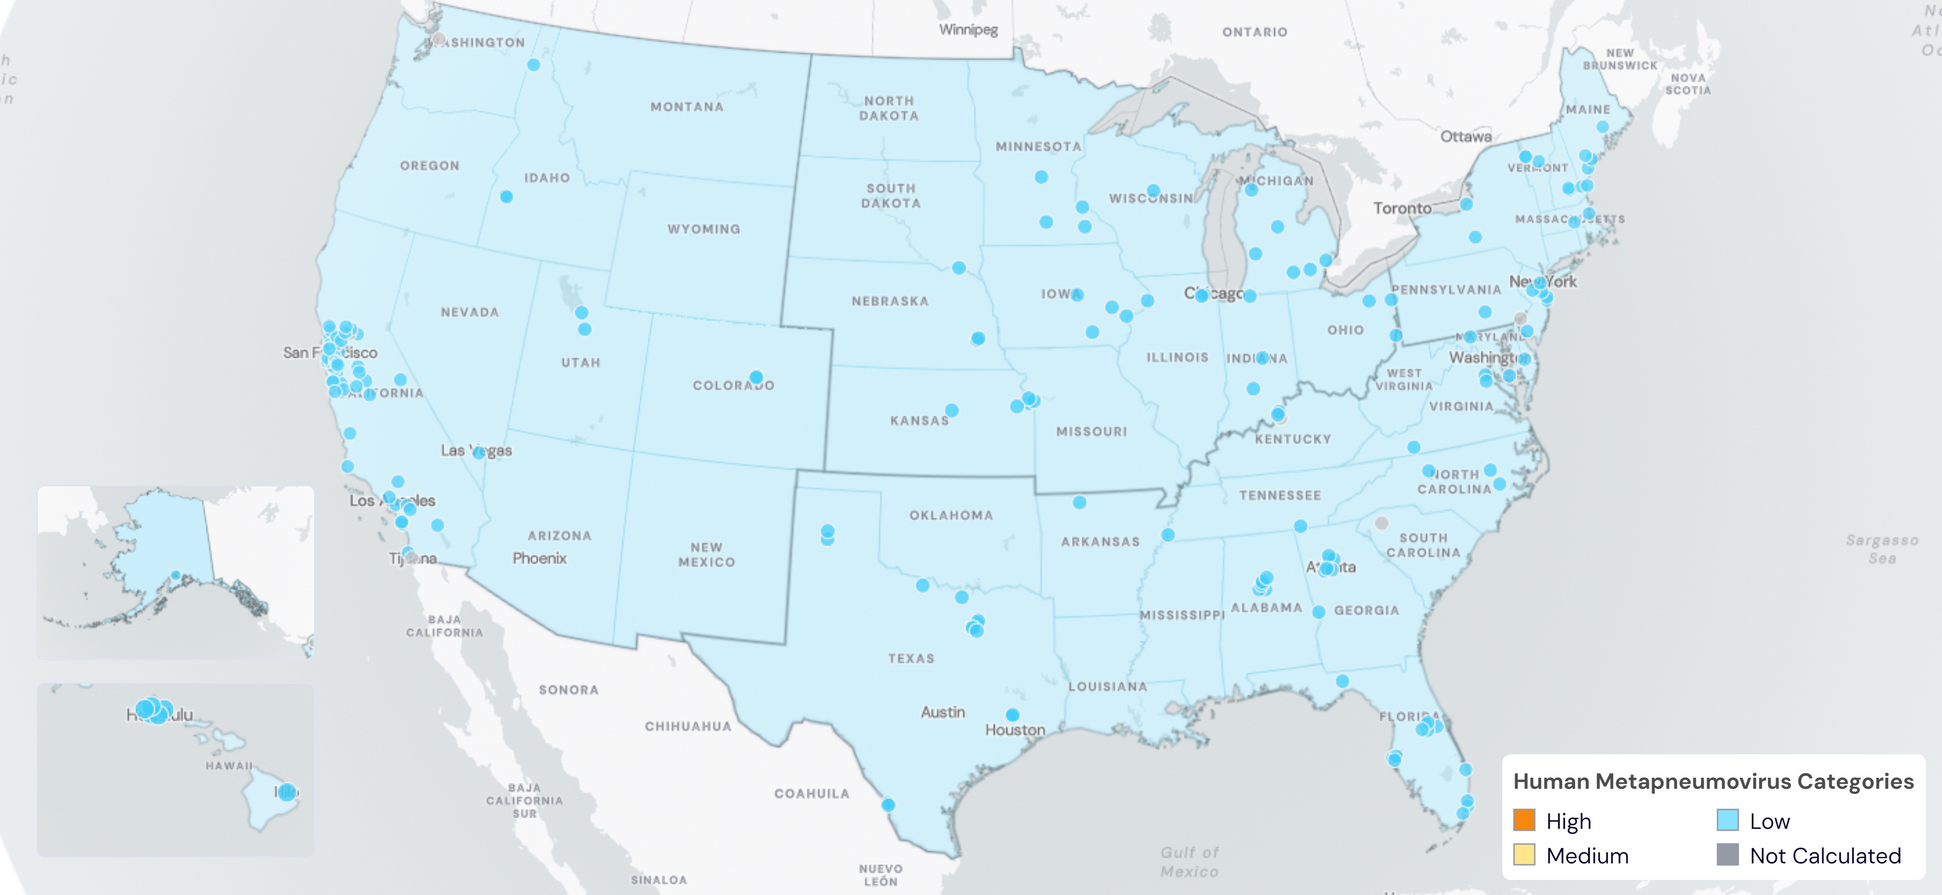
Below are the current HMPV wastewater categories for all WWSCAN sites:
- 179 are in the LOW Wastewater Category
- 0 are in the MEDIUM Wastewater Category
- 0 are in the HIGH Wastewater Category
- 4 do not have enough data to calculate (South San Diego, CA; Louisville, KY; Chester, PA; Snohomish, WA)
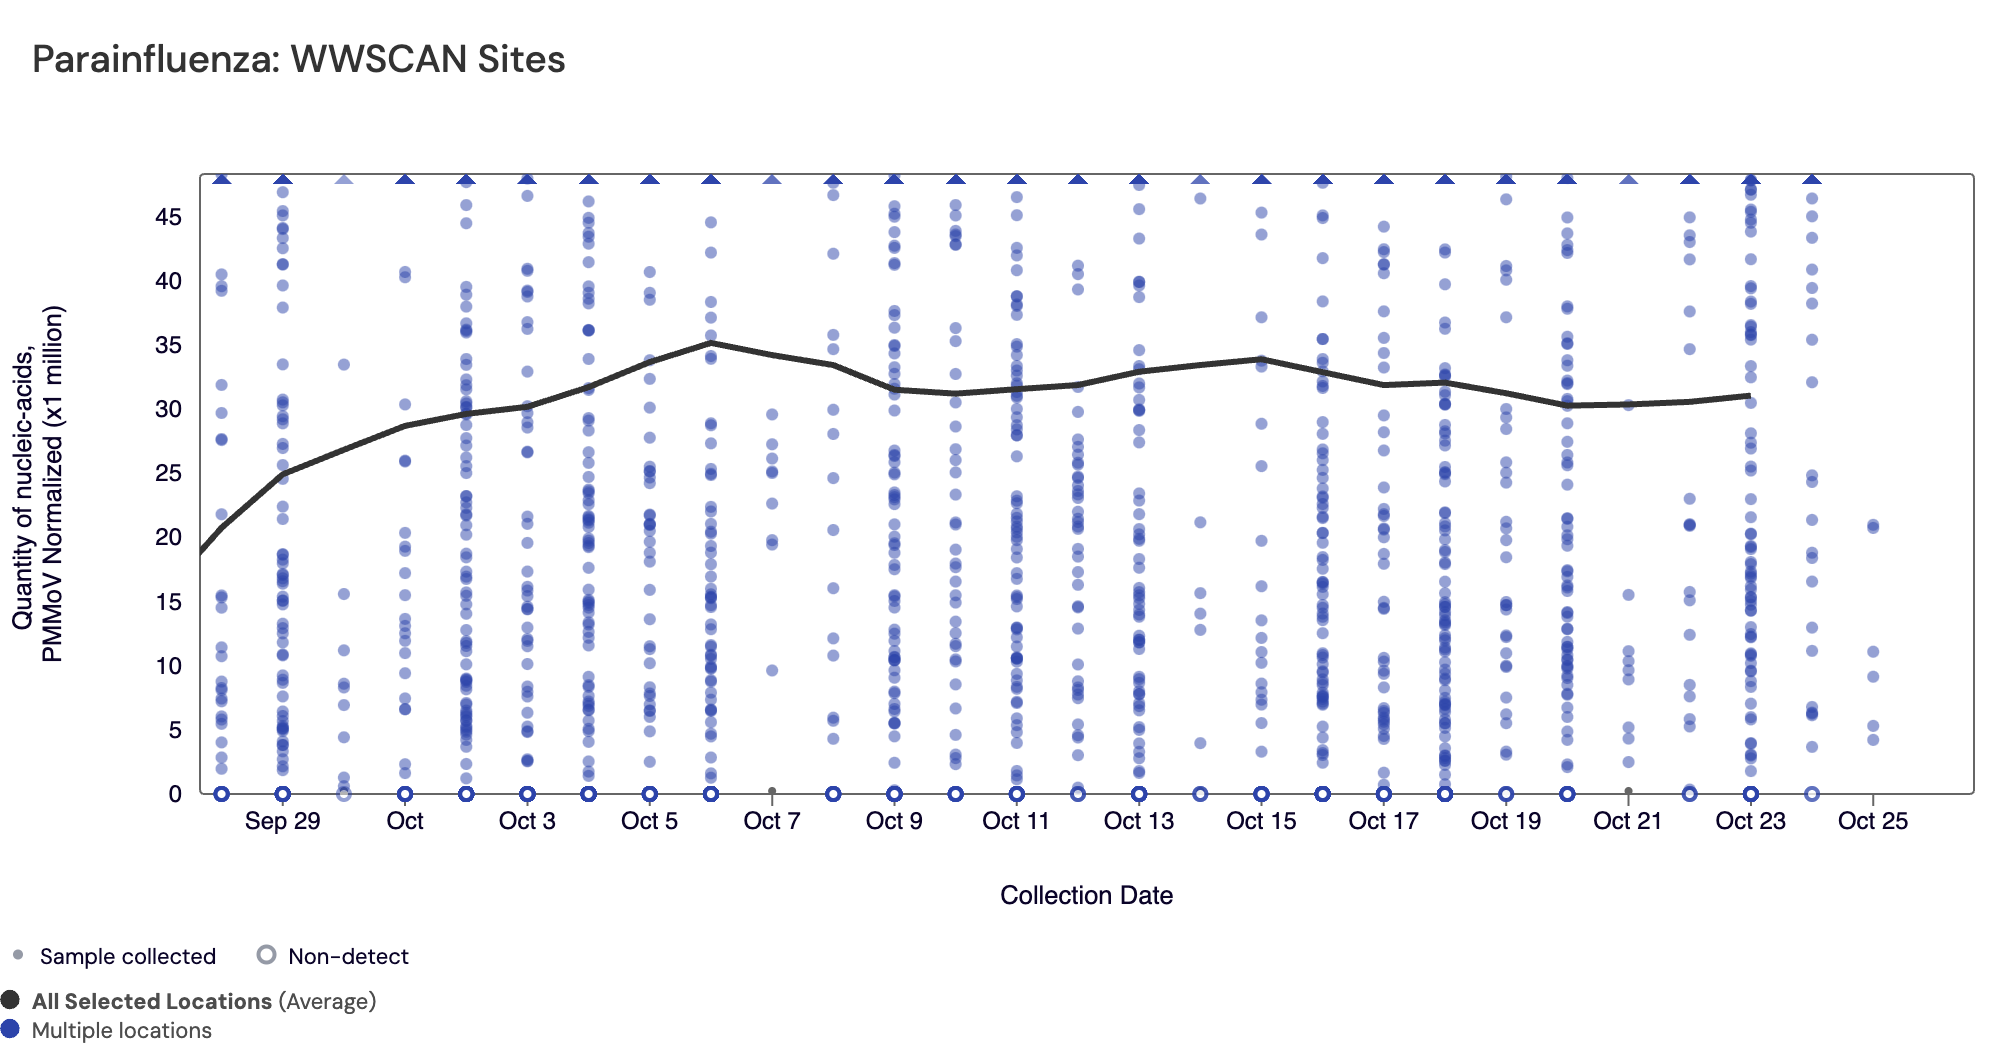
Human Parainfluenza (HPIV) RNA has been detected in 84.9% of samples collected from WWSCAN sites since monitoring began in September 2023. HPIV median concentrations across all sites over the last 21 days is 10,200 copies/gram. The blue dots are the raw data and the population weighted average line is shown in black. You can interact with the chart of all the plants here. These data will become easier to interpret as we collect more data; we do not have enough data currently to start assessing trends or levels.
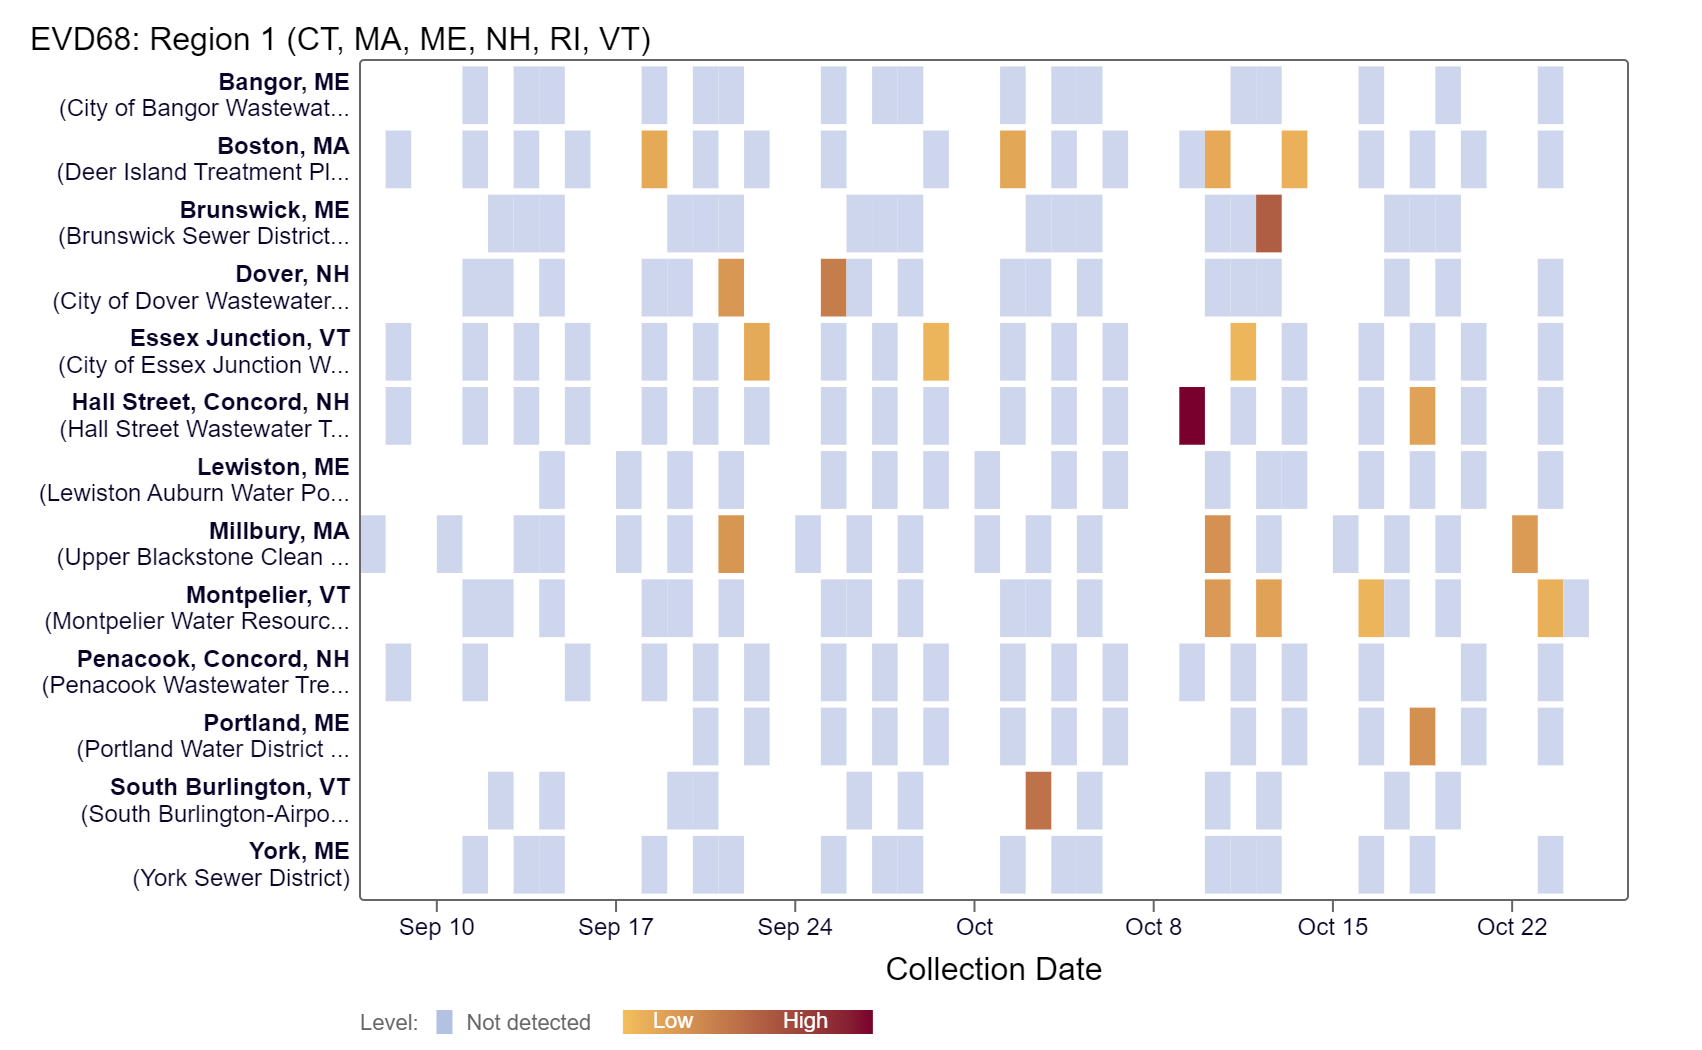
Enterovirus D68 (EV-D68) RNA was sporadically detected in samples collected in the last 21 days at most WWSCAN sites. EV-D68 median concentrations across all sites over the last 21 days is below the level of detection. The heat map below shows all WWSCAN sites in HHS Region 1 as a row, and each date as a column since monitoring began in September 2023. The color blue means the sample was non-detect for EV-D68 RNA and the colors get darker with higher concentrations. White indicates no sample was collected. EV-D68 is believed to occur biennially, and we saw it last year, as described in this article (which was just published in Emerging Infectious Disease). As we collect more data, we will be better able to interpret trends and levels of this pathogen.
Gastrointestinal Pathogens
Norovirus GII, Rotavirus, and Human Adenovirus Group F
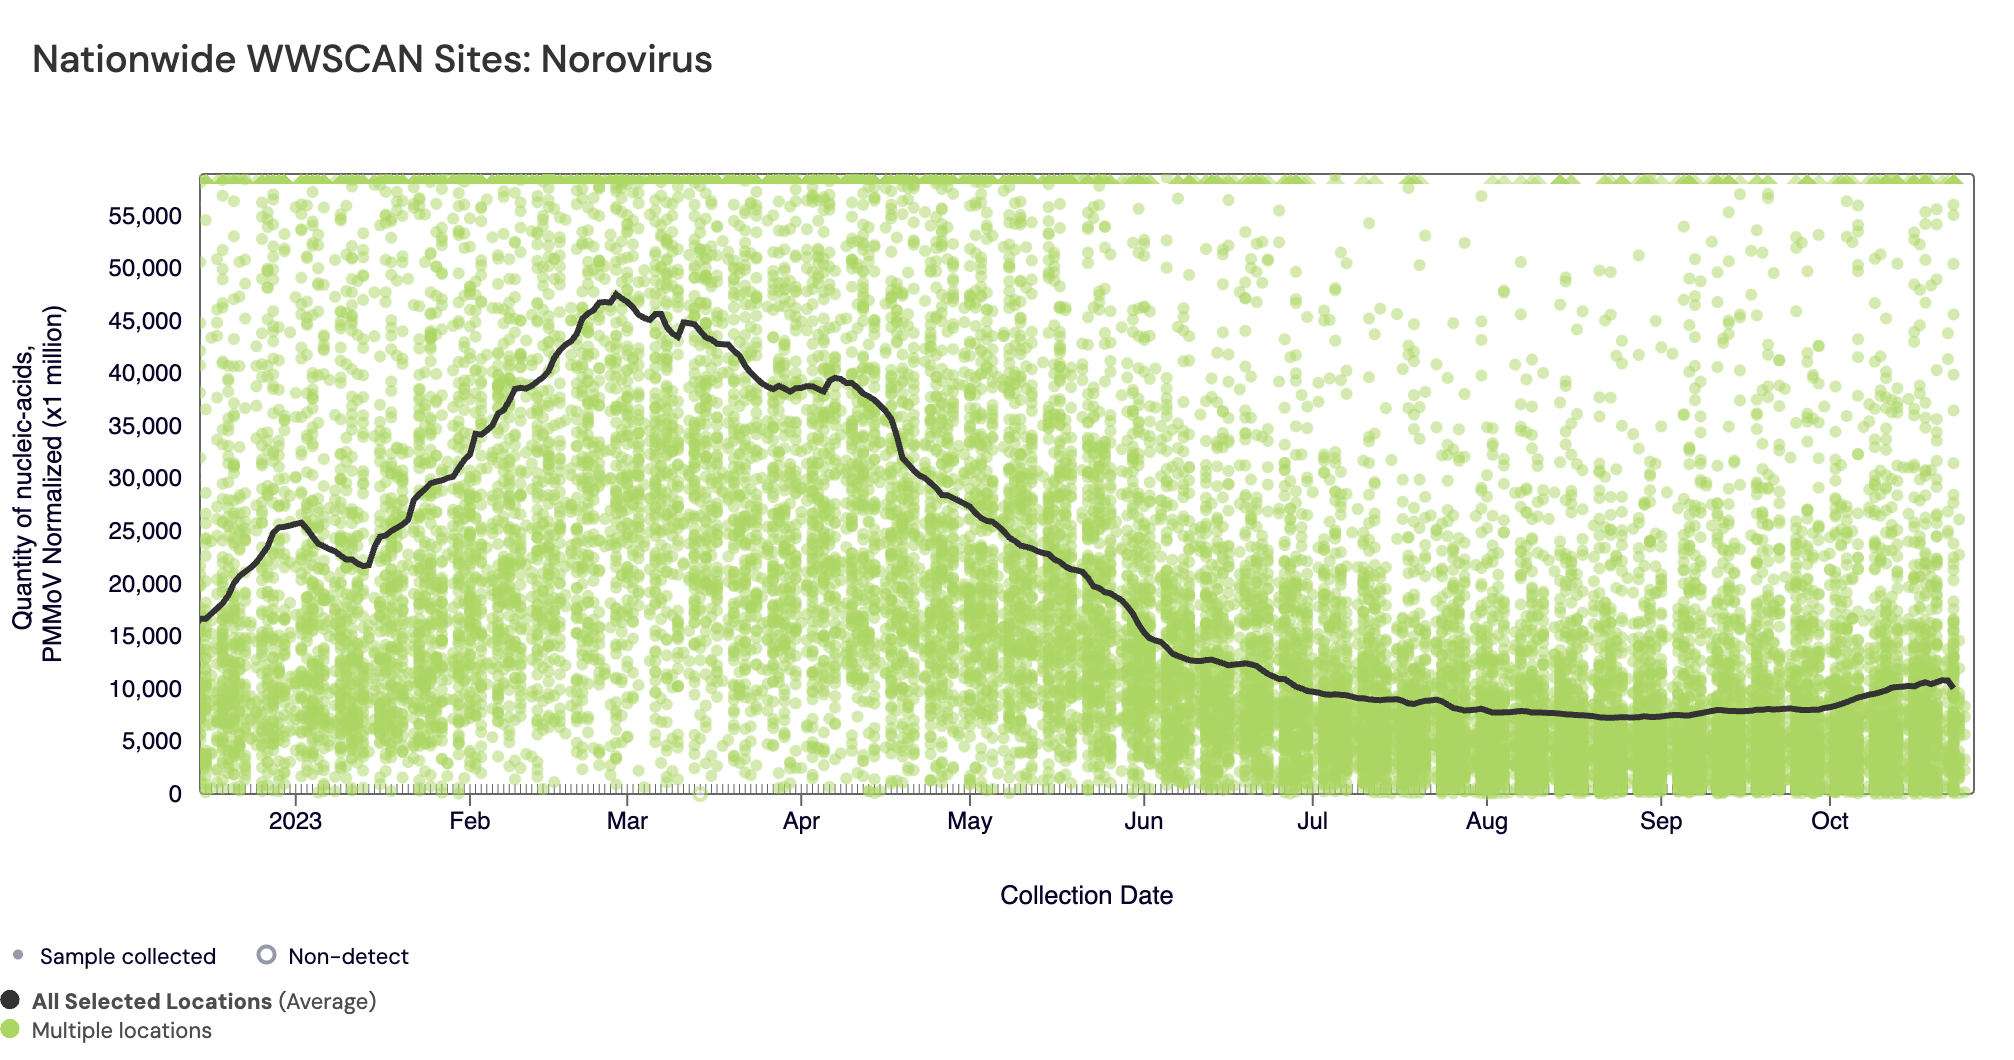
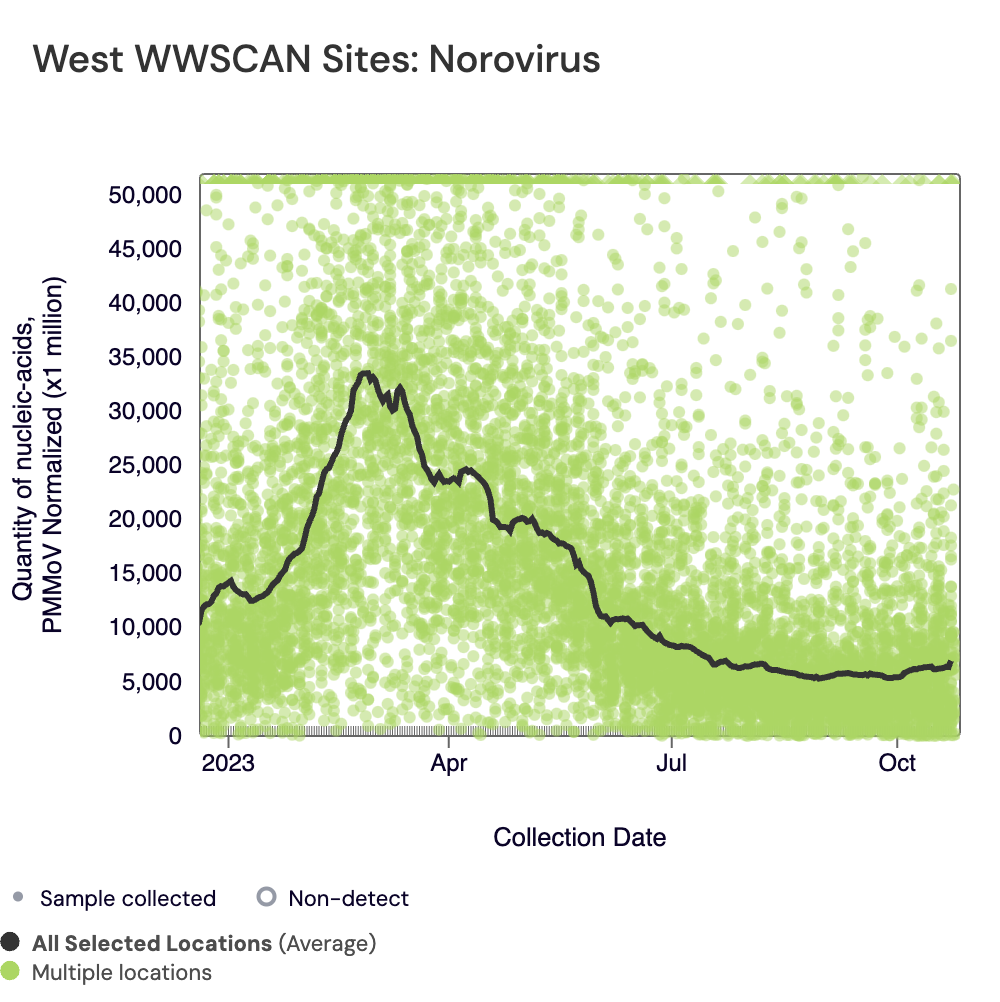
Norovirus GII (HuNoV GII) RNA has been consistently detected at the sites. The median concentration across all sites over the last 21 days is 2,800,000 copies/gram (for reference median concentration in September 2023 was 2,250,000 copies/gram). Below are the HuNoV GII RNA concentrations (normalized by PMMoV) from all participating WWSCAN sites across the country since we started monitoring in late December 2022. The raw data are shown as green dots, and the population weighted average is shown as a black line.
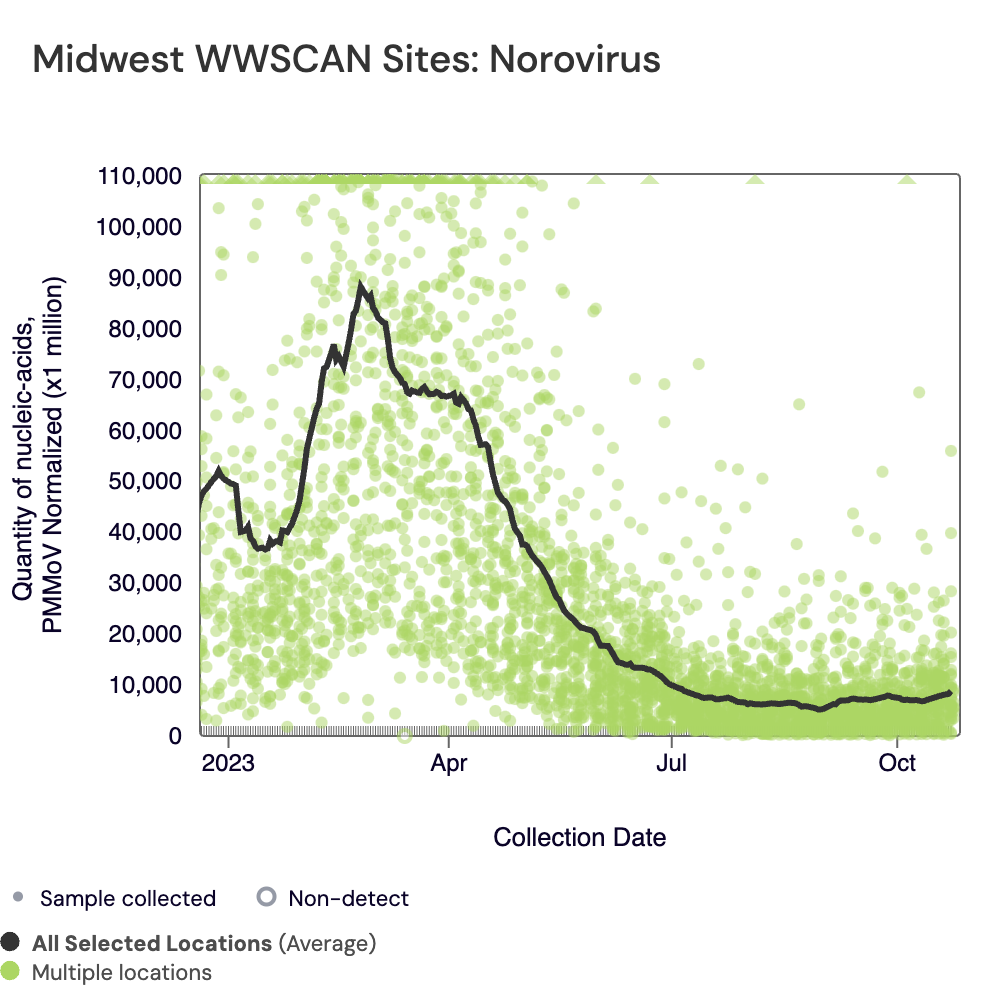
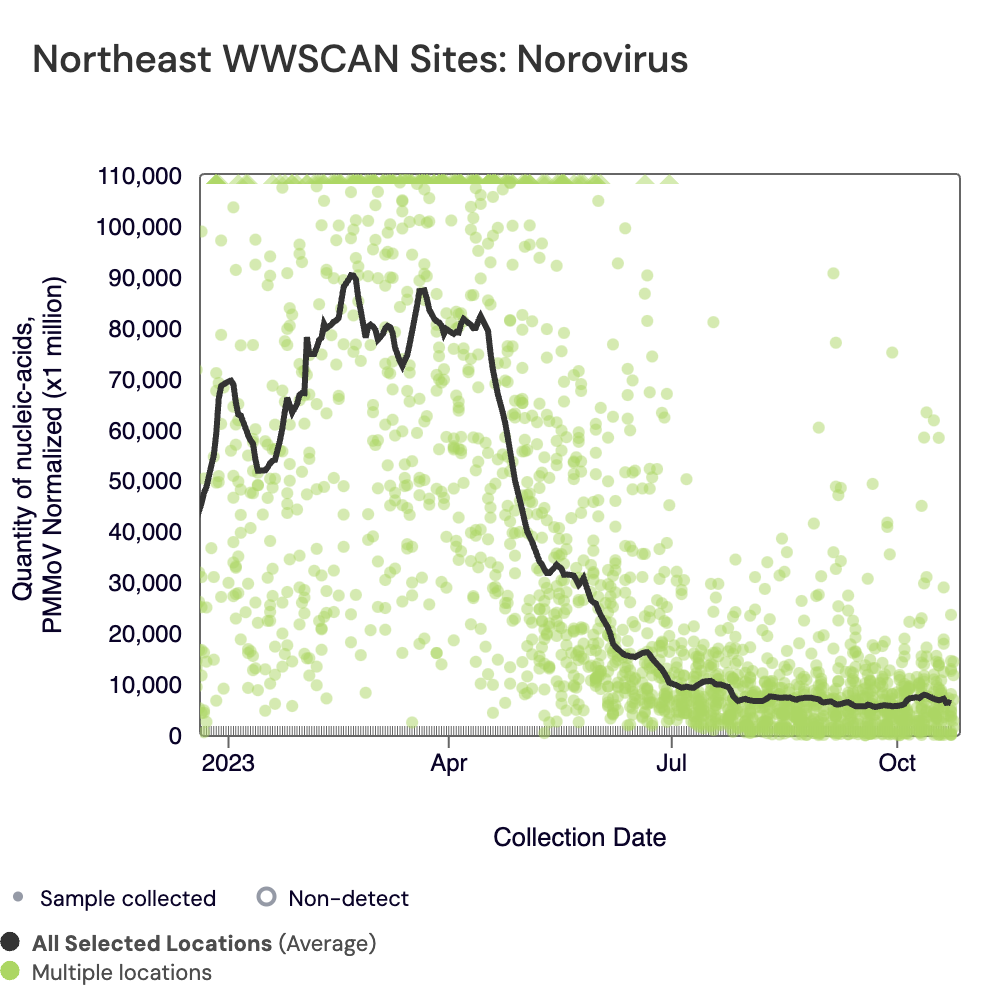
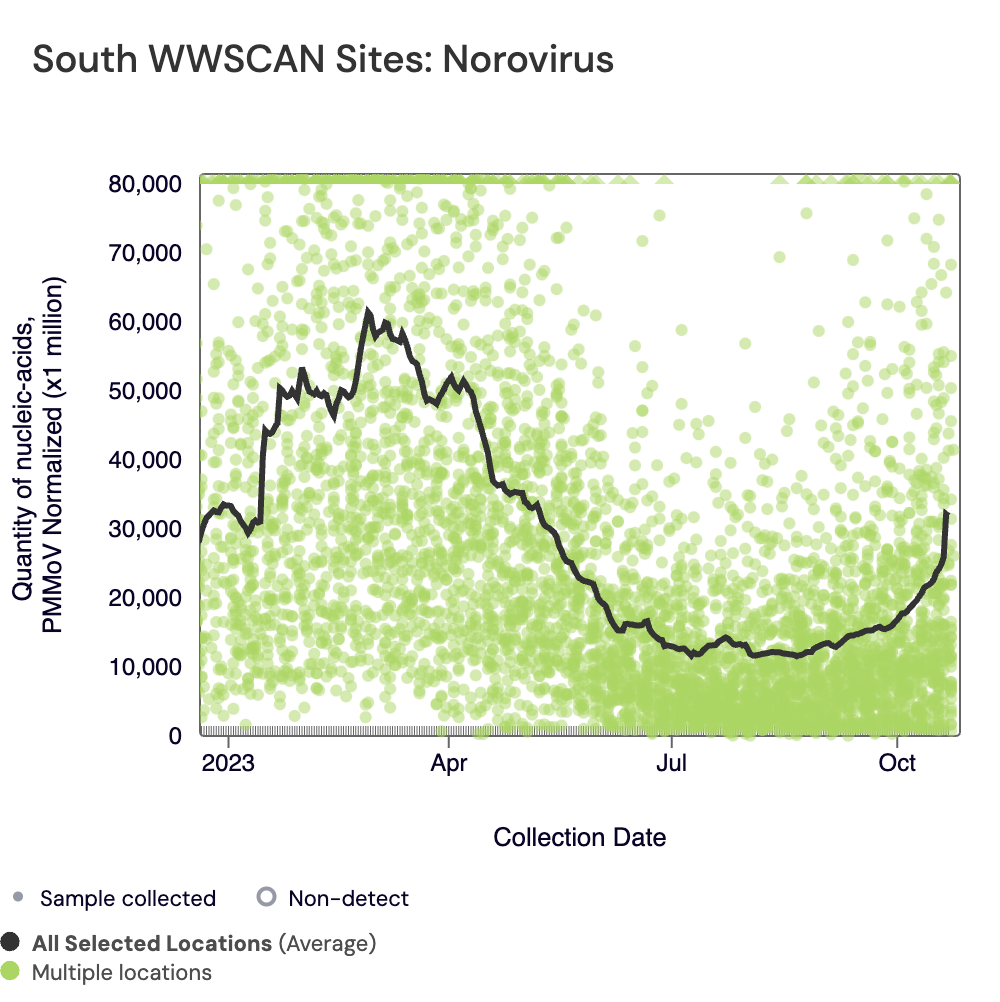
Below are the HuNoV GII RNA concentrations (normalized by PMMoV) from sites in the Midwest US (top left panel), Northeast US (top right panel), Southern US (bottom left panel) and Western US (bottom right panel) since we started monitoring Norovirus late December 2022. The population weighted average across regional WWSCAN plants is shown in black, and raw data are green. Evident in the data is relatively high concentrations across all US regions around the start of the year. In the south, the population-weighted average line suggests that levels have gone up over the last month.
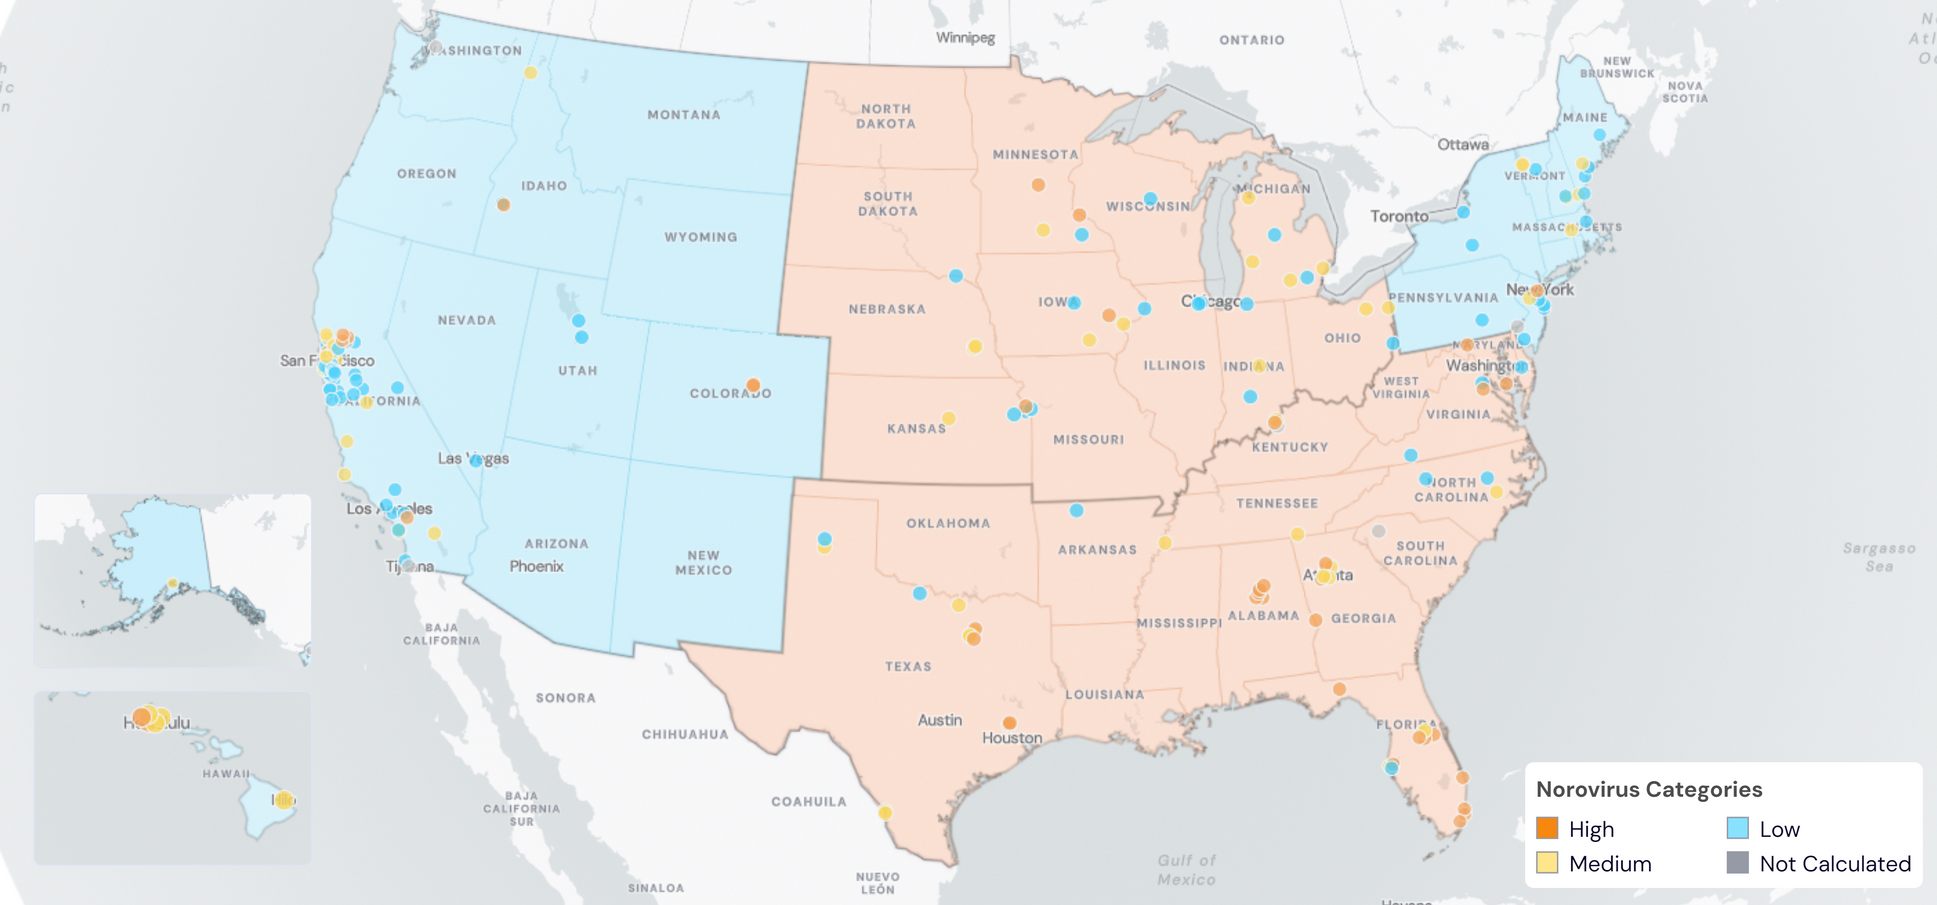
Below are the current Norovirus wastewater categories for ALL WWSCAN sites:
- 76 are in the LOW Wastewater Category
- 58 are in the MEDIUM Wastewater Category
- 45 are in the HIGH Wastewater Category
- 4 do not have enough data to calculate (South San Diego, CA; Louisville, KY; Chester, PA; Snohomish, WA)
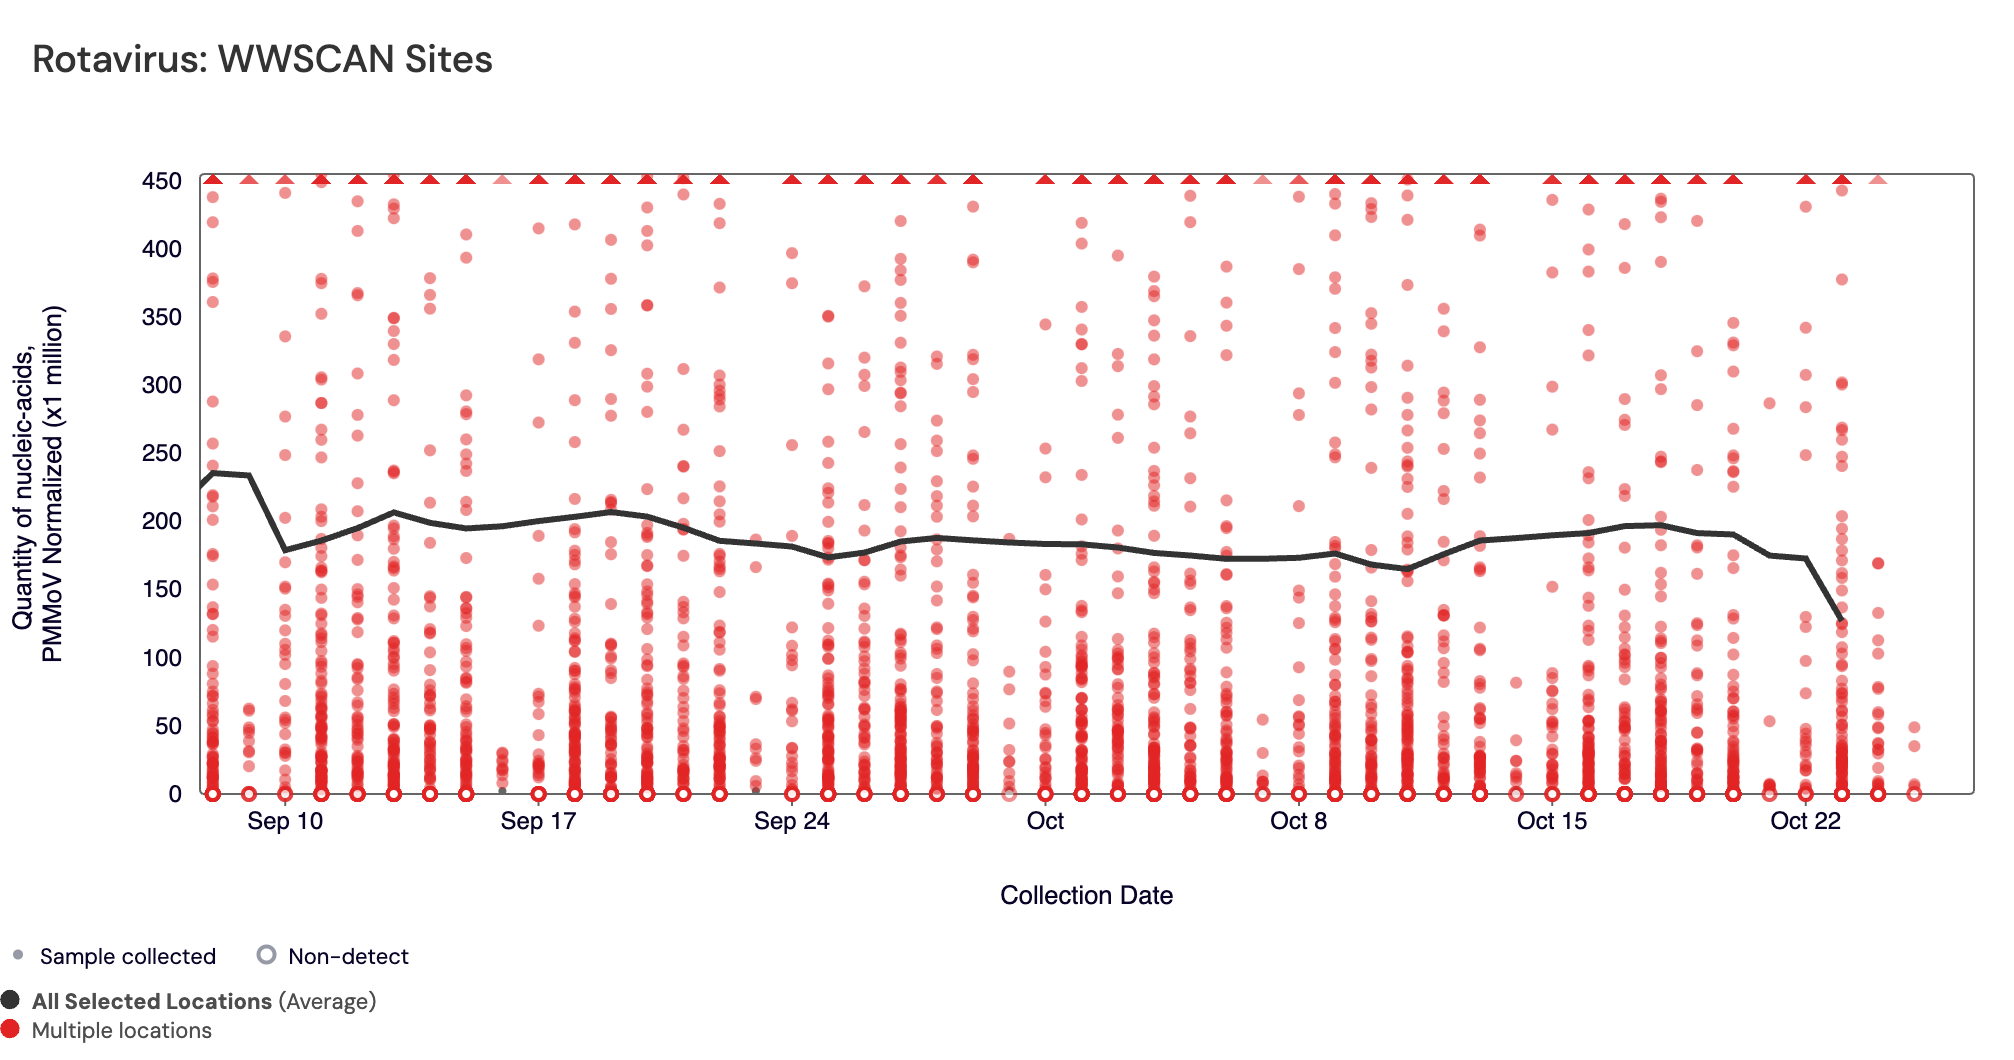
Rotavirus RNA concentrations are shown in the chart below; all the WWSCAN plants are shown together. Rotavirus median concentrations across all sites over the last 21 days is 11,900 copies/gram. The red dots are the raw data and the population weighted average line is shown in black. You can interact with the chart of all the plants here. As we collect more data, we will be better able to interpret trends and levels of this pathogen.
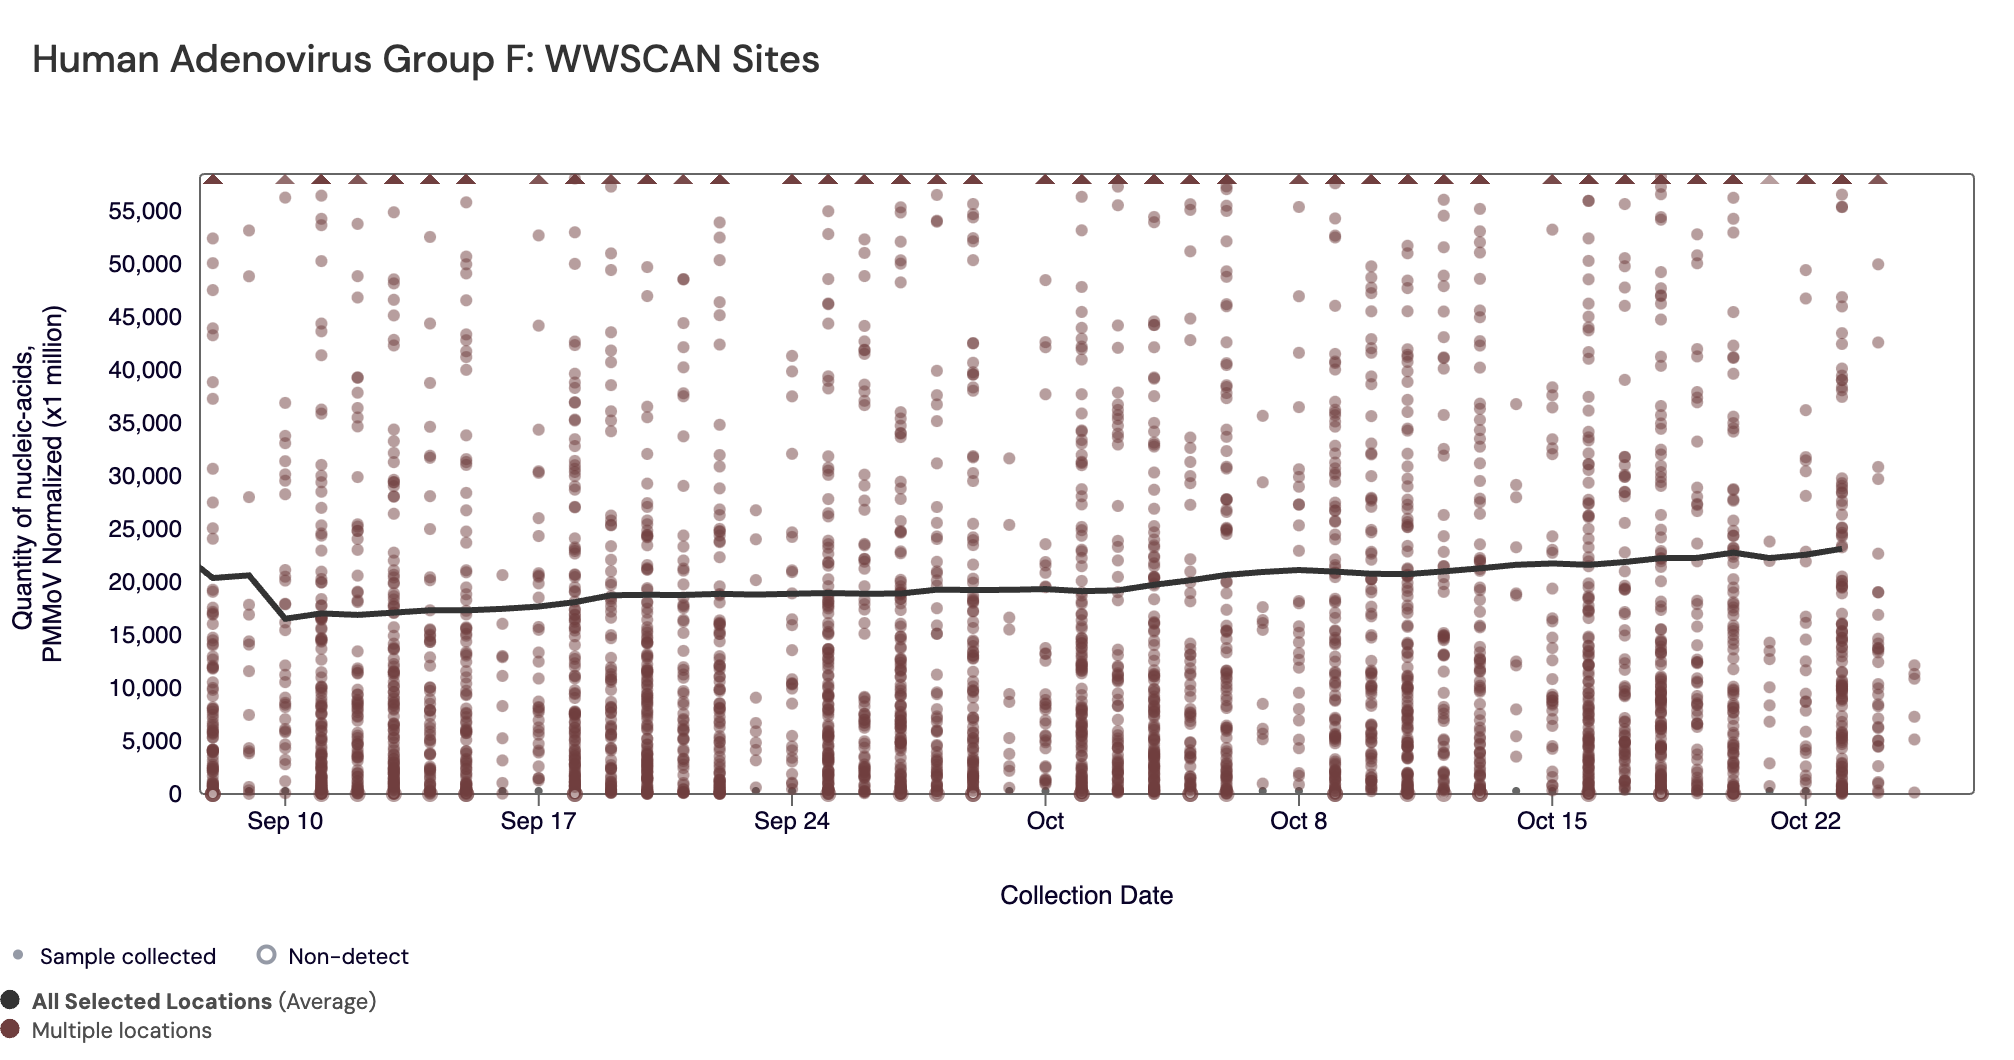
Human Adenovirus Group F DNA has been detected in 99.3 % of samples collected from WWSCAN sites in the past 21 days. Human Adenovirus Group F median concentrations across all sites over the last 21 days is 5,280,000 copies/gram. Concentrations are shown in the chart below; all the WWSCAN plants are shown together. The brown dots are the raw data and the population weighted average line is shown in black. You can interact with the chart of all the plants here. As we collect more data, we will be better able to interpret trends and levels of this pathogen.
Other Pathogens of Concern
Mpox, Candida auris, and Hepatitis A
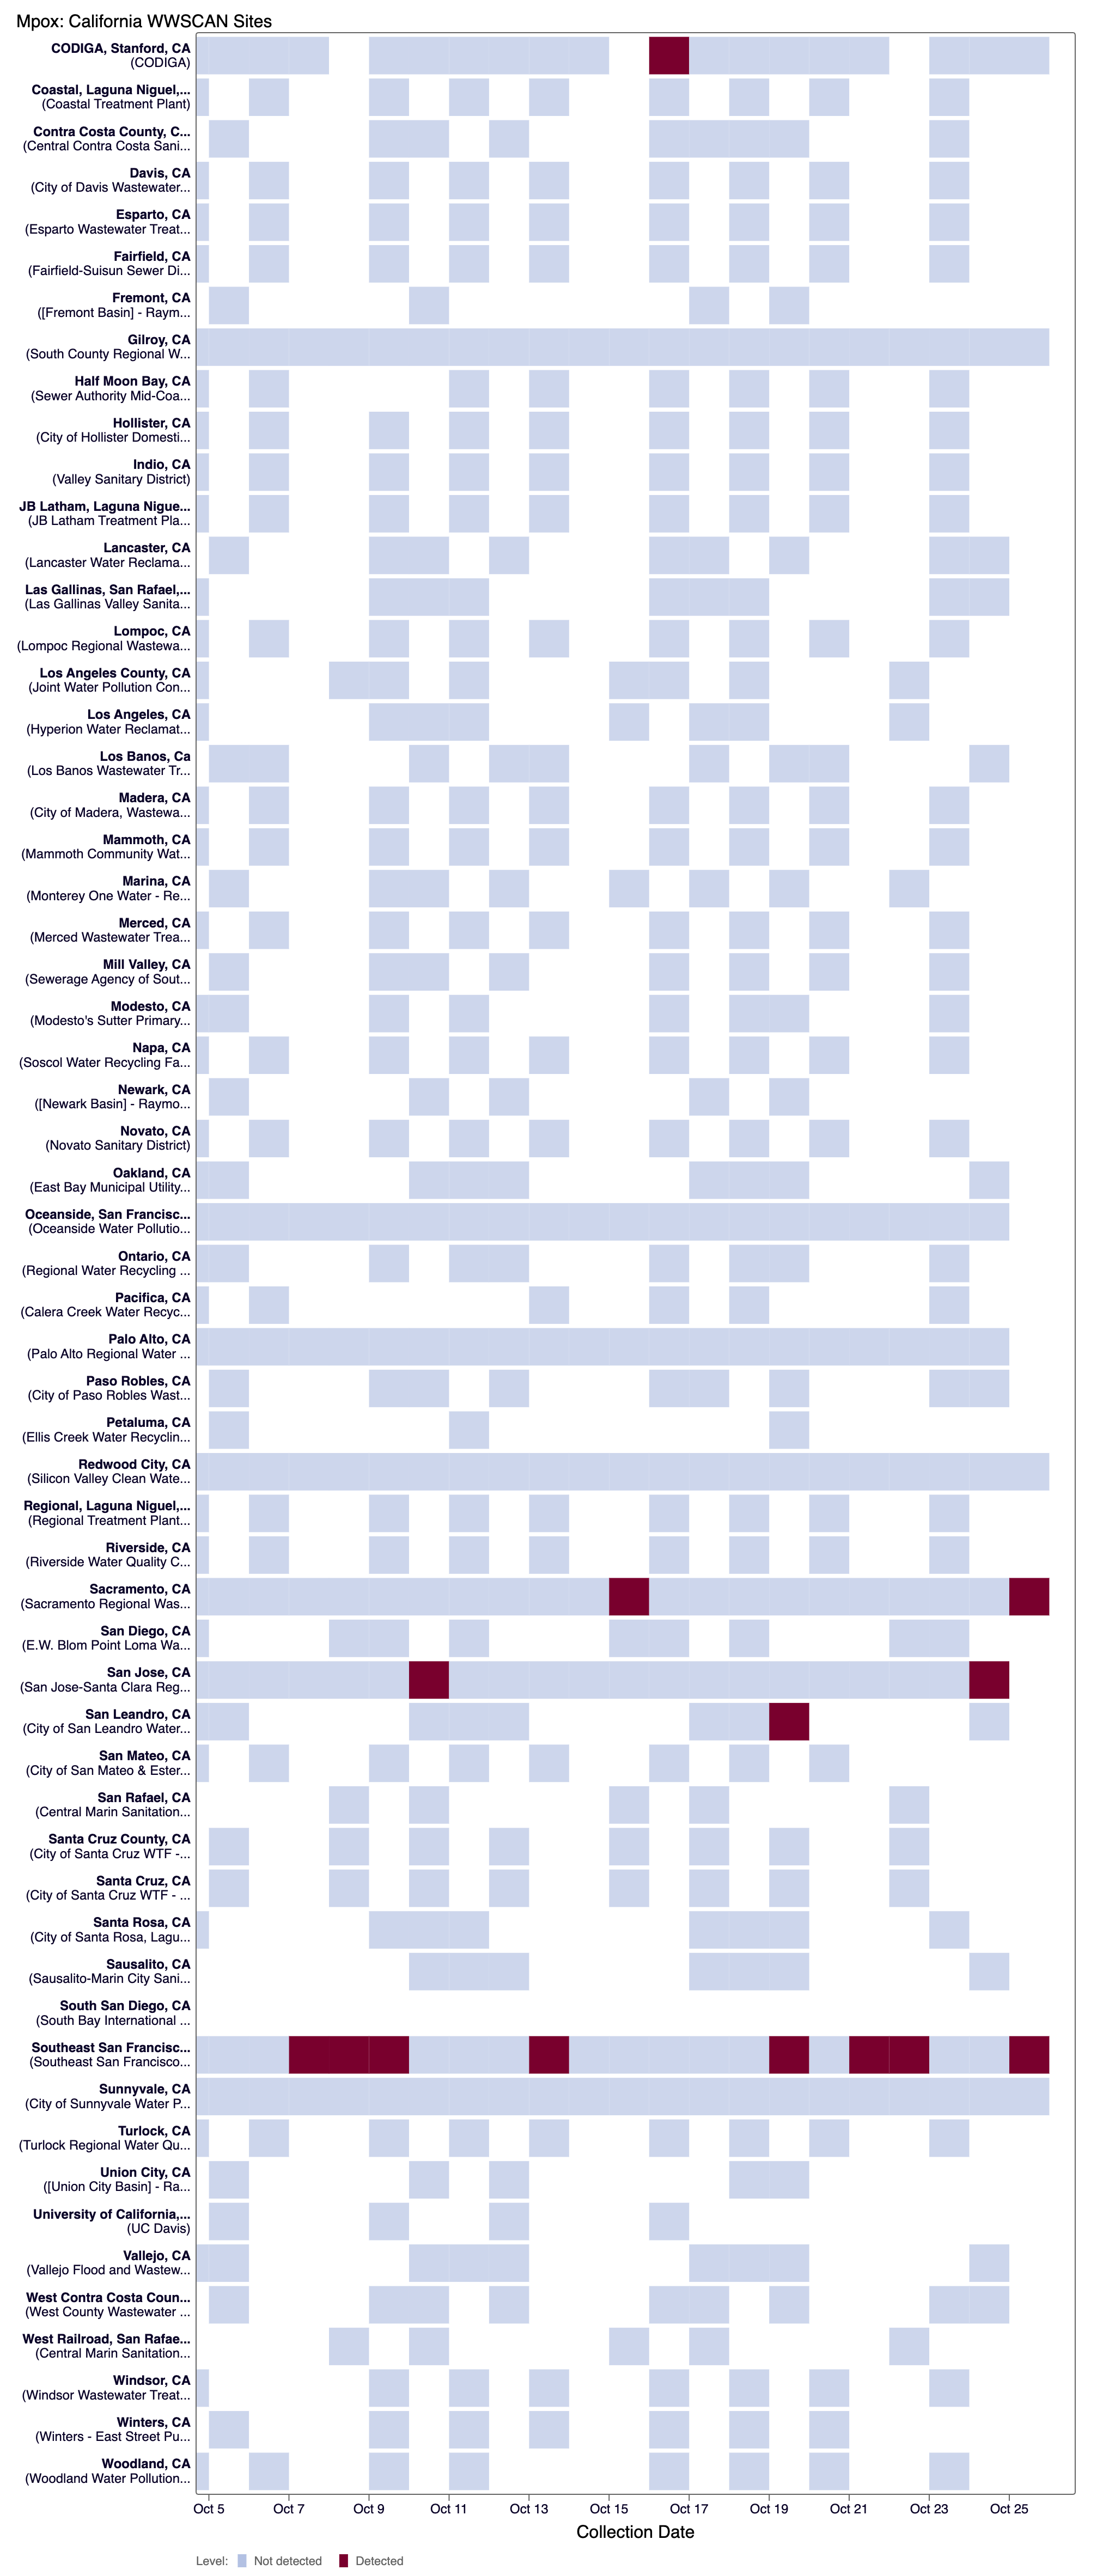
Mpox DNA We have only detected mpox DNA in 16 samples from sites over the past three-weeks. The chart below shows every California plant in WWSCAN as rows, and the last 21 days as columns (labeled at the bottom axis). White indicates no samples, blue is non-detect for mpox DNA and red is detect for mpox DNA. As a reminder, you can access our paper in New England Journal of Medicine about how mpox wastewater monitoring compares to clinical reports of infectious here.
The wastewater categorization for Mpox at 179 sites is LOW. Four sites did not have enough data to calculate a category.
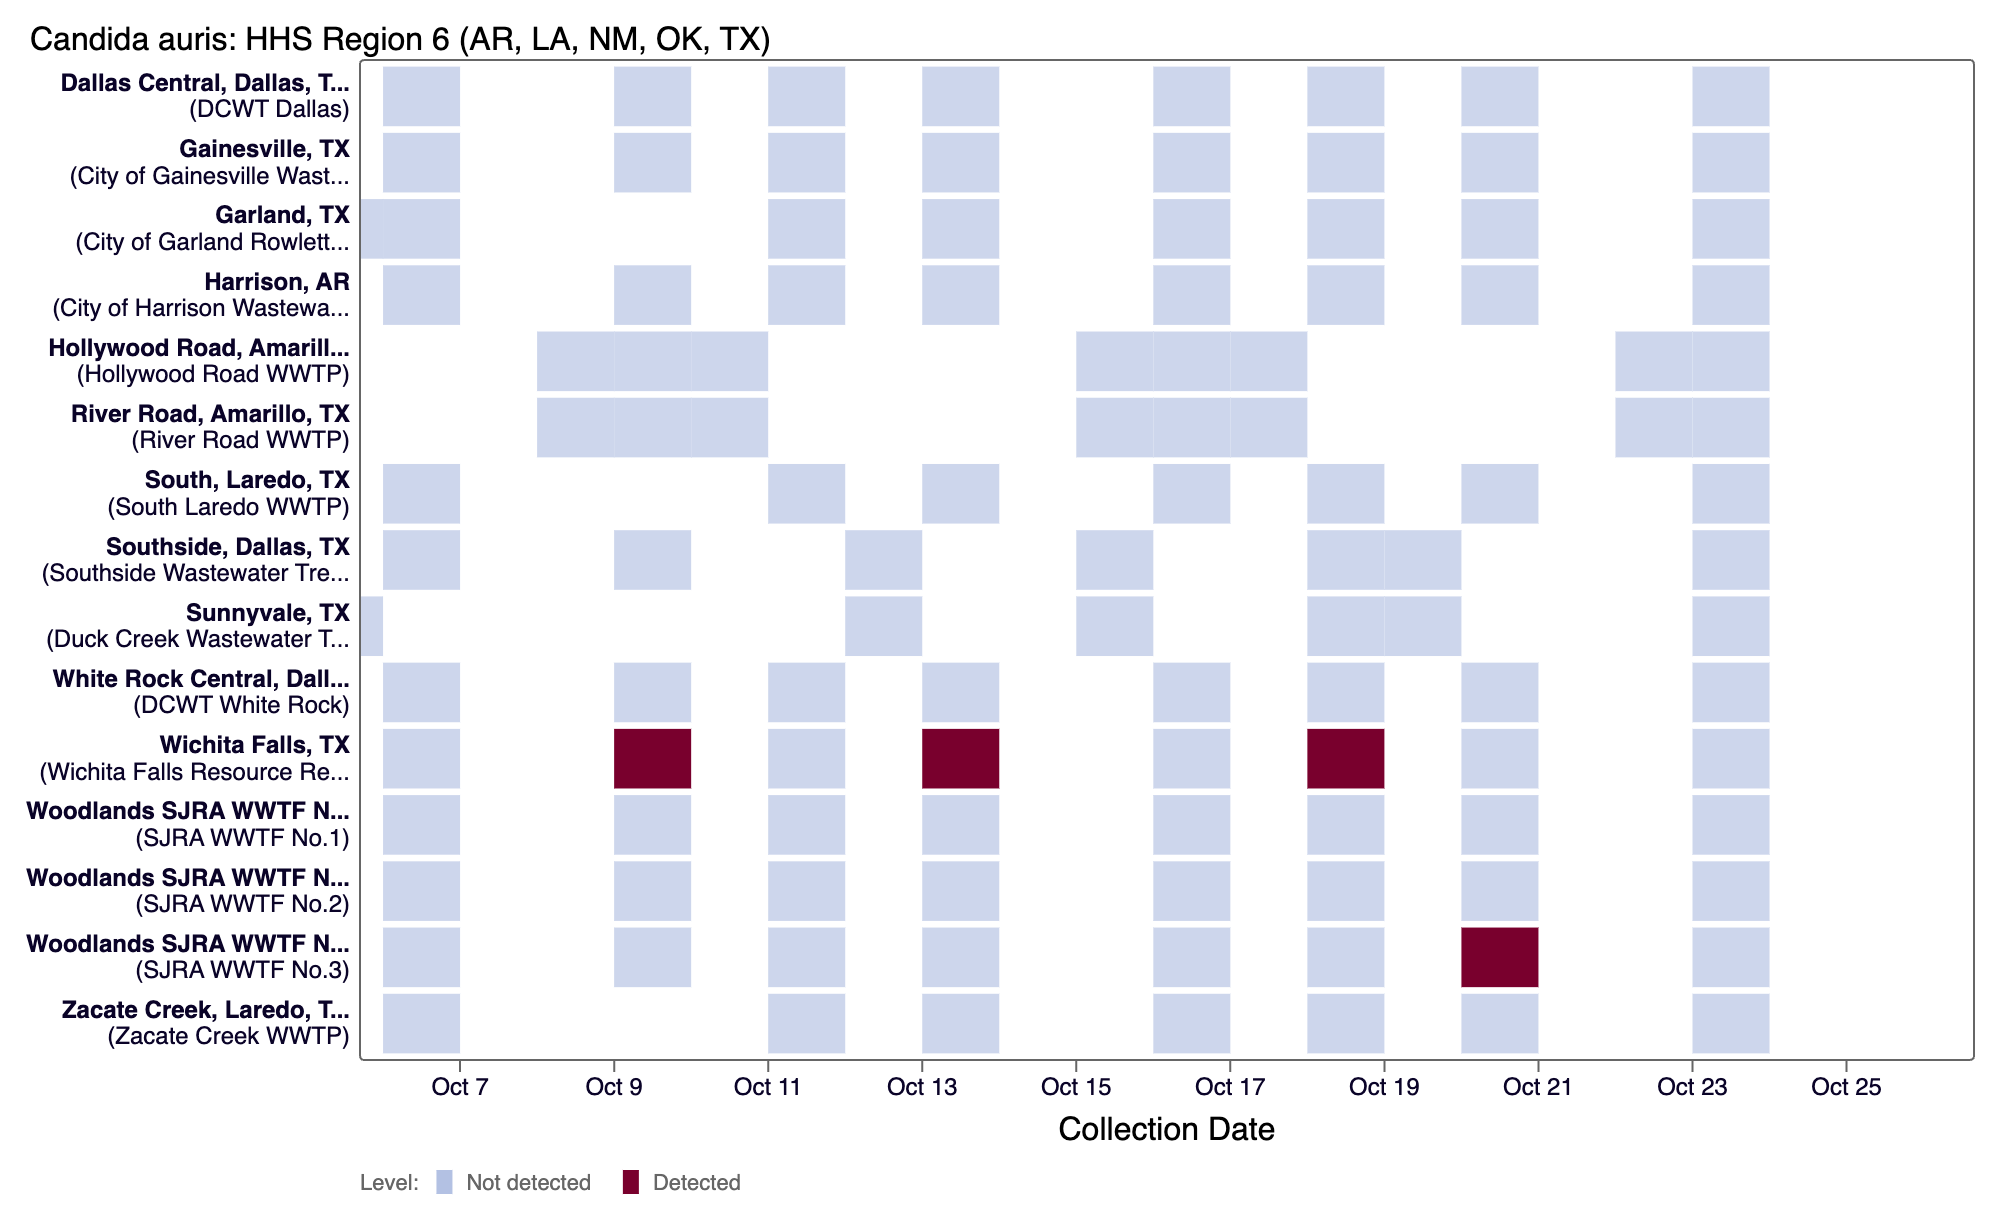
Candida auris (C.auris) DNA - We have detected C. auris DNA in 1.3% of samples from all WWSCAN sites over the past three-weeks. The chart below shows every WWSCAN plant in HHS Region 6 as rows, and the last 21 days as columns (labeled at the bottom axis). White indicates no samples, blue is non-detect for C. auris DNA and red is detect for C. auris DNA.
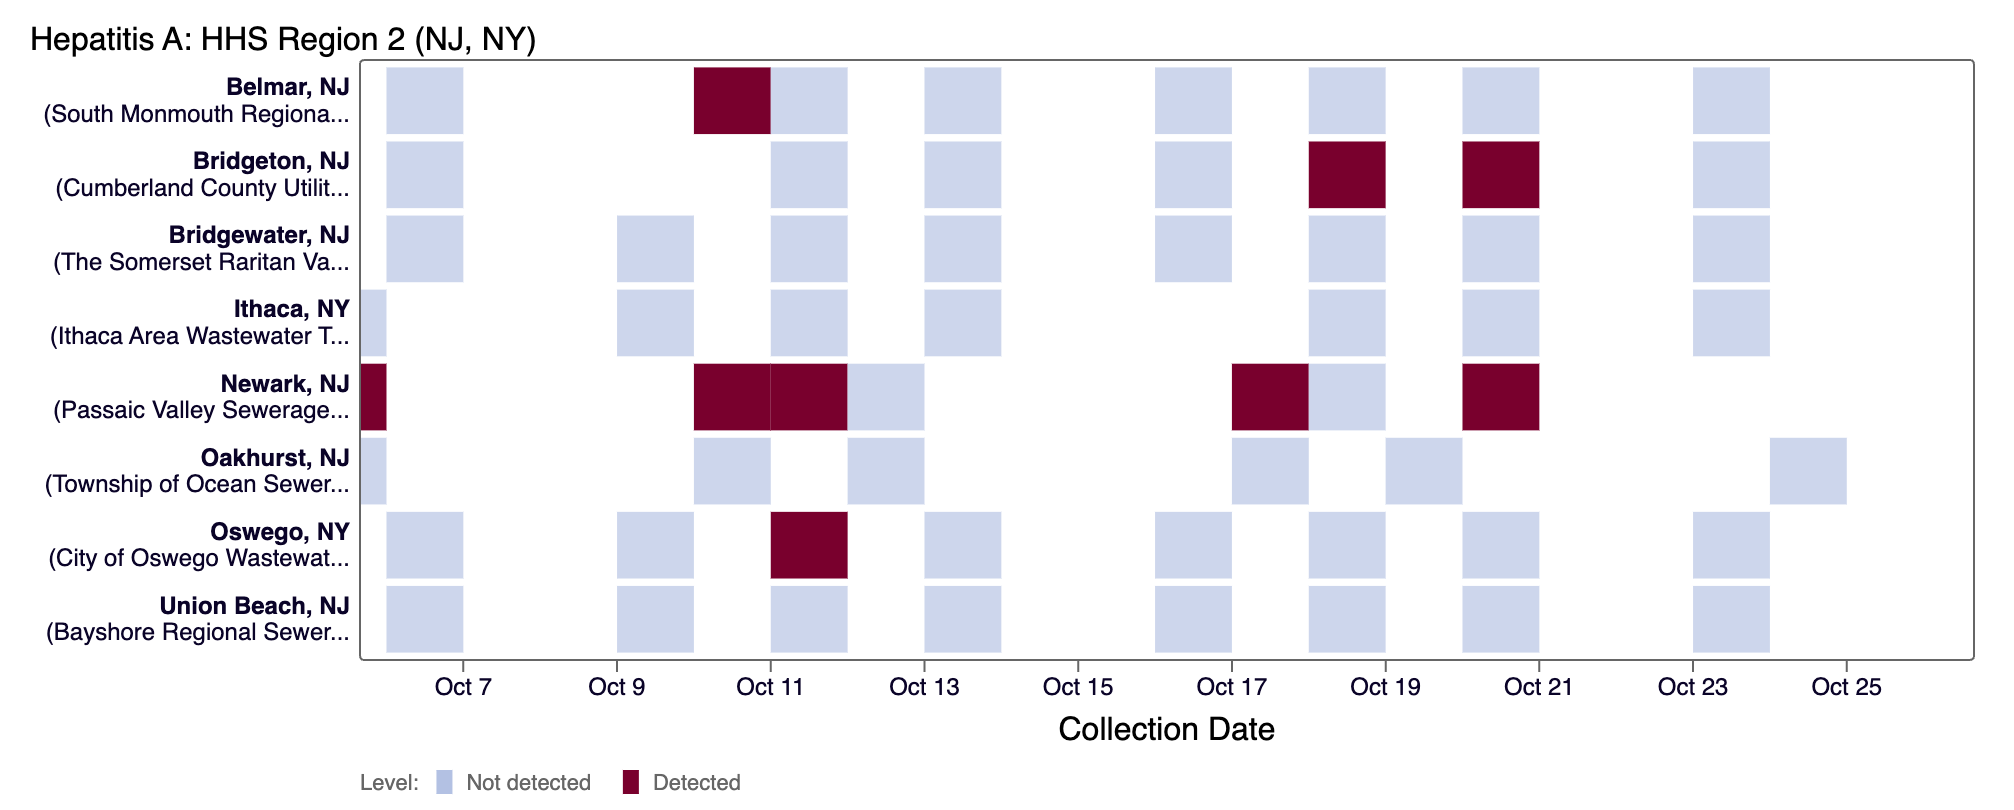
Hepatitis A (Hep A) RNA - We have detected Hep A DNA in 15% of samples from all WWSCAN sites over the past three-weeks. The chart below shows every WWSCAN plant in HHS Region 2 as rows, and the last 21 days as columns (labeled at the bottom axis). White indicates no samples, blue is non-detect for Hep A RNA and red is detect for Hep A RNA.
Recent WWSCAN Scientific Publications
Open source journal links are provided below
Below is a recent papers related to this work that you might be interested in:
Alexandria B. Boehm, Debra A. Wadford, Bridgette Hughes, Dorothea Duong, Alice Chen, Tasha Padilla, Chelsea Wright, Lisa Moua, Teal Bullick, Maria Salas, Christina Morales, Bradley J. White, Carol A. Glaser, Duc J. Vugia, Alexander T. Yu, Marlene K, Wolfe. Trends of enterovirus D68 concentrations in wastewater in two California communities parallel trends of statewide confirmed cases, February 2021-April 2023. Emerging Infectious Disease, 29(11). Link.
As we enter peak respiratory disease season, there have been some recent news articles that have referenced wastewater monitoring efforts, including WWSCAN.
- NPR: Wastewater reveals which viruses are actually circulating and causing colds
- NBC: Flu and RSV starting to tick up nationwide
- HuffPost: Flu and RSV Could be on the Rise Nationwide
Join us at the next WWSCAN Stakeholder call on November 10th, 2023
You can use this zoom link to join. We hope to see you there!
If you have questions about the website or anything else, please email: wwscan_stanford_emory@lists.stanford.edu.