SCAN Weekly Update - 11/01/23
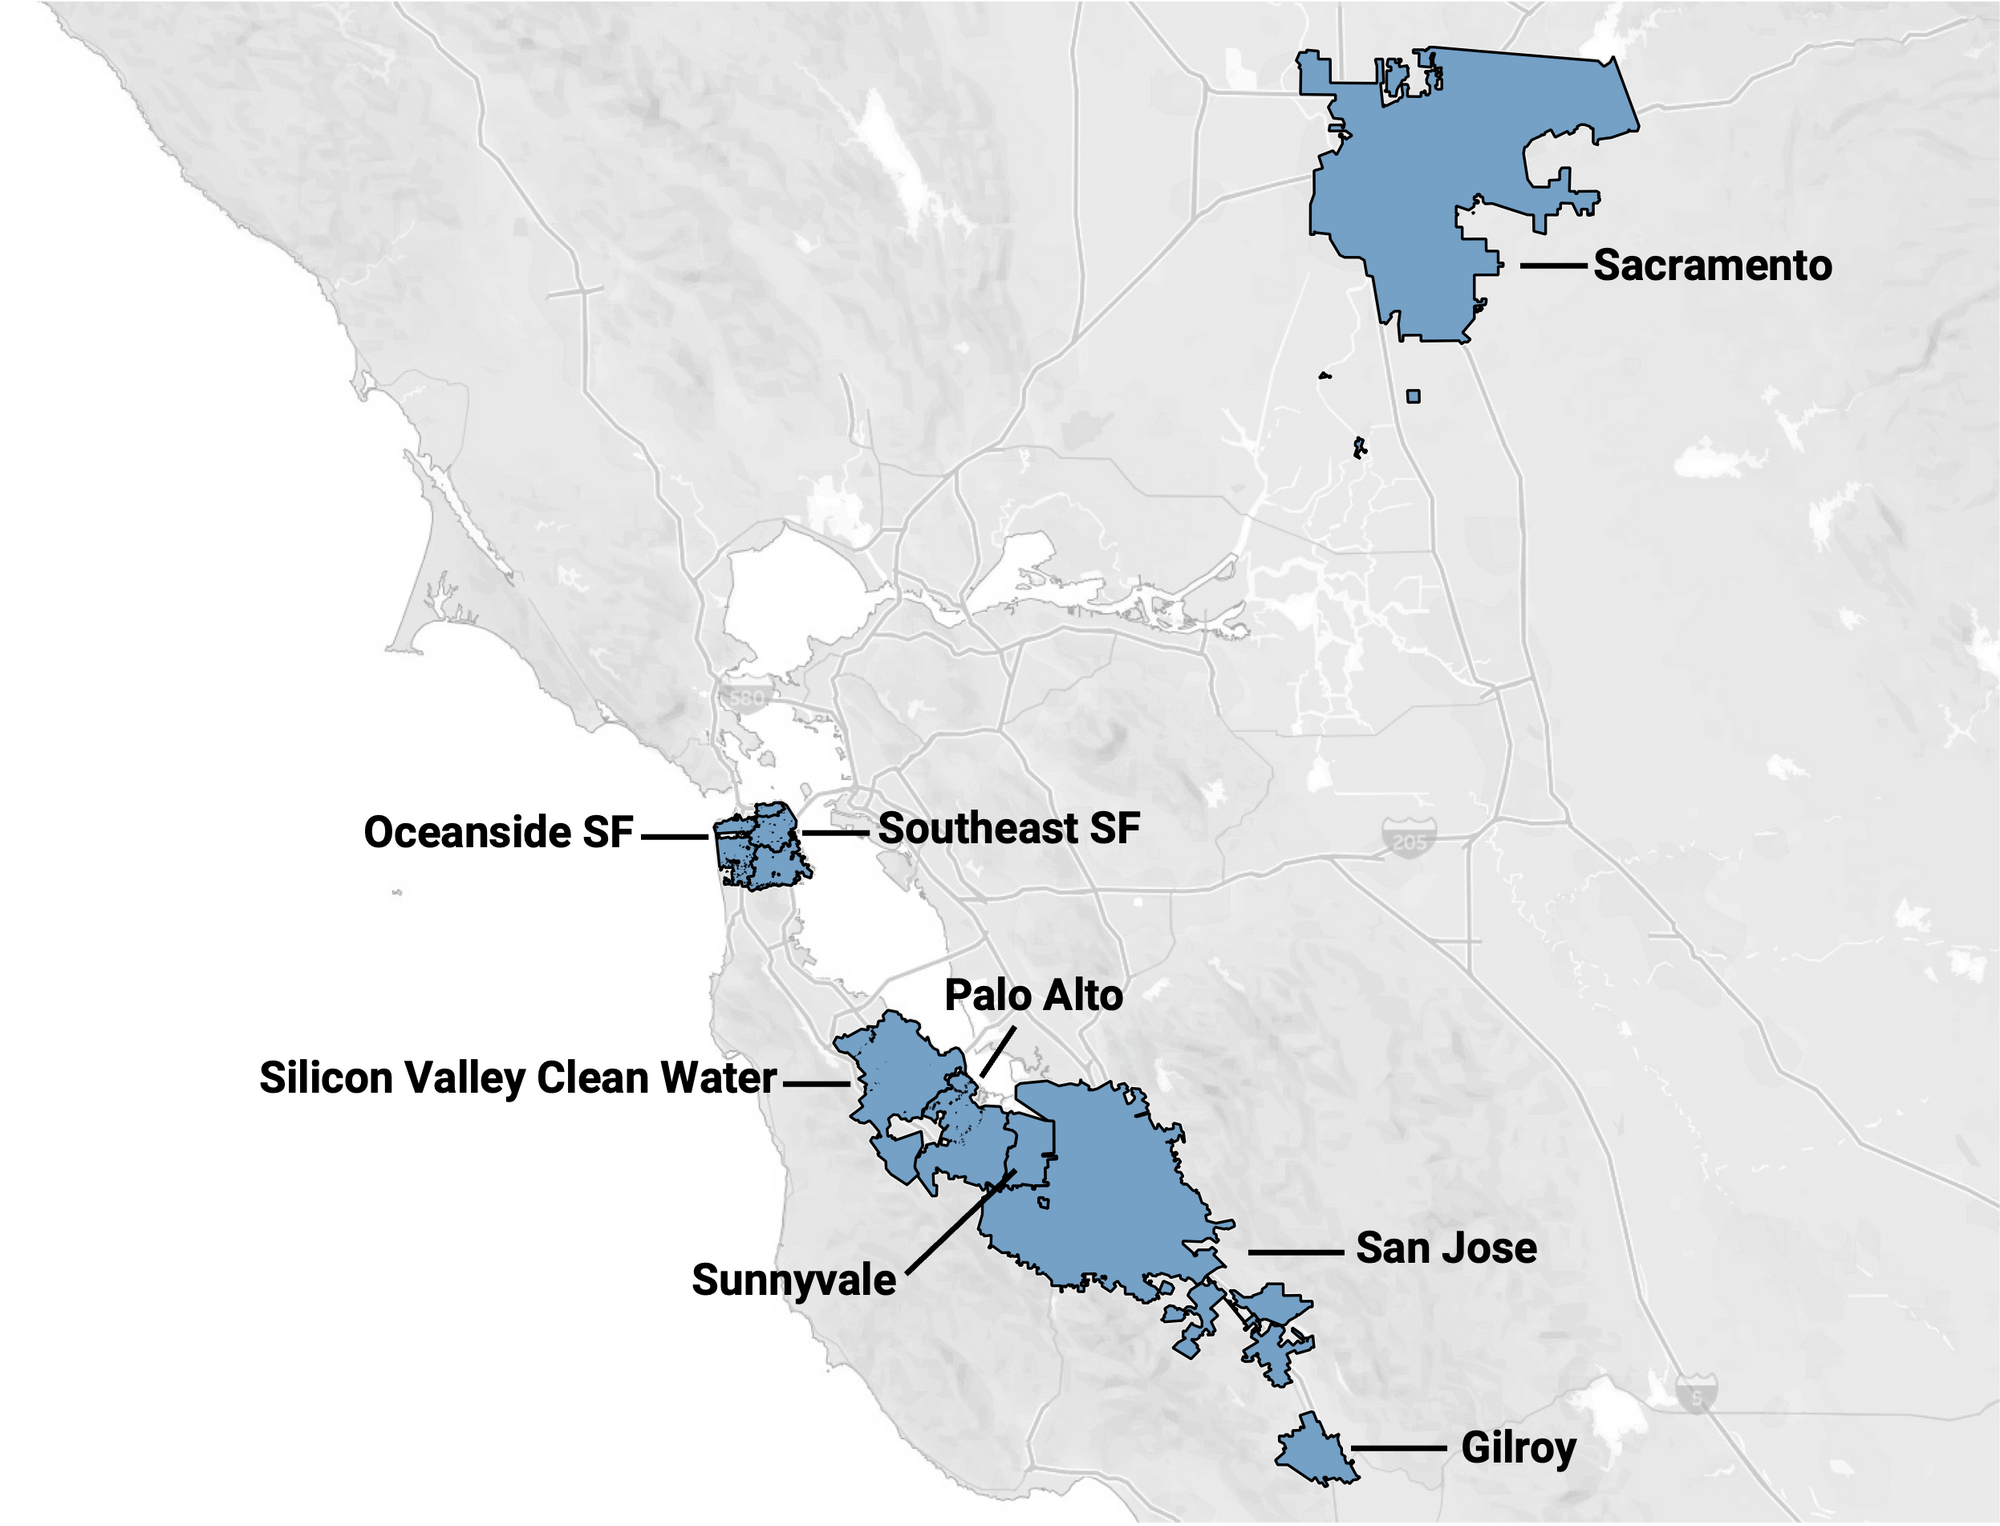
This blog post describes data collected at 8 wastewater treatment plants in the Greater Bay Area of San Francisco, CA, including Sacramento, that are partners in the SCAN project which began in late 2020. The SCAN plants are a subset of the WastewaterSCAN plants.
All samples picked up by the couriers as of 10/30/23 have been processed and their data are on the site: data.wastewaterscan.org. Please email Ali at aboehm@stanford.edu if you identify any bugs on the site.
We have a new publication on enterovirus D68 monitoring in wastewater that uses data from Oceanside and San Jose plants from SCAN:
- Alexandria B. Boehm, Debra A. Wadford, Bridgette Hughes, Dorothea Duong, Alice Chen, Tasha Padilla, Chelsea Wright, Lisa Moua, Teal Bullick, Maria Salas, Christina Morales, Bradley J. White, Carol A. Glaser, Duc J. Vugia, Alexander T. Yu, Marlene K, Wolfe. Trends of enterovirus D68 concentrations in wastewater in two California communities parallel trends of statewide confirmed cases, February 2021-April 2023. Emerging Infectious Disease, 29(11). Link.
Wastewater Categories
Looking at trends, levels, and frequency of detection to categorize wastewater data
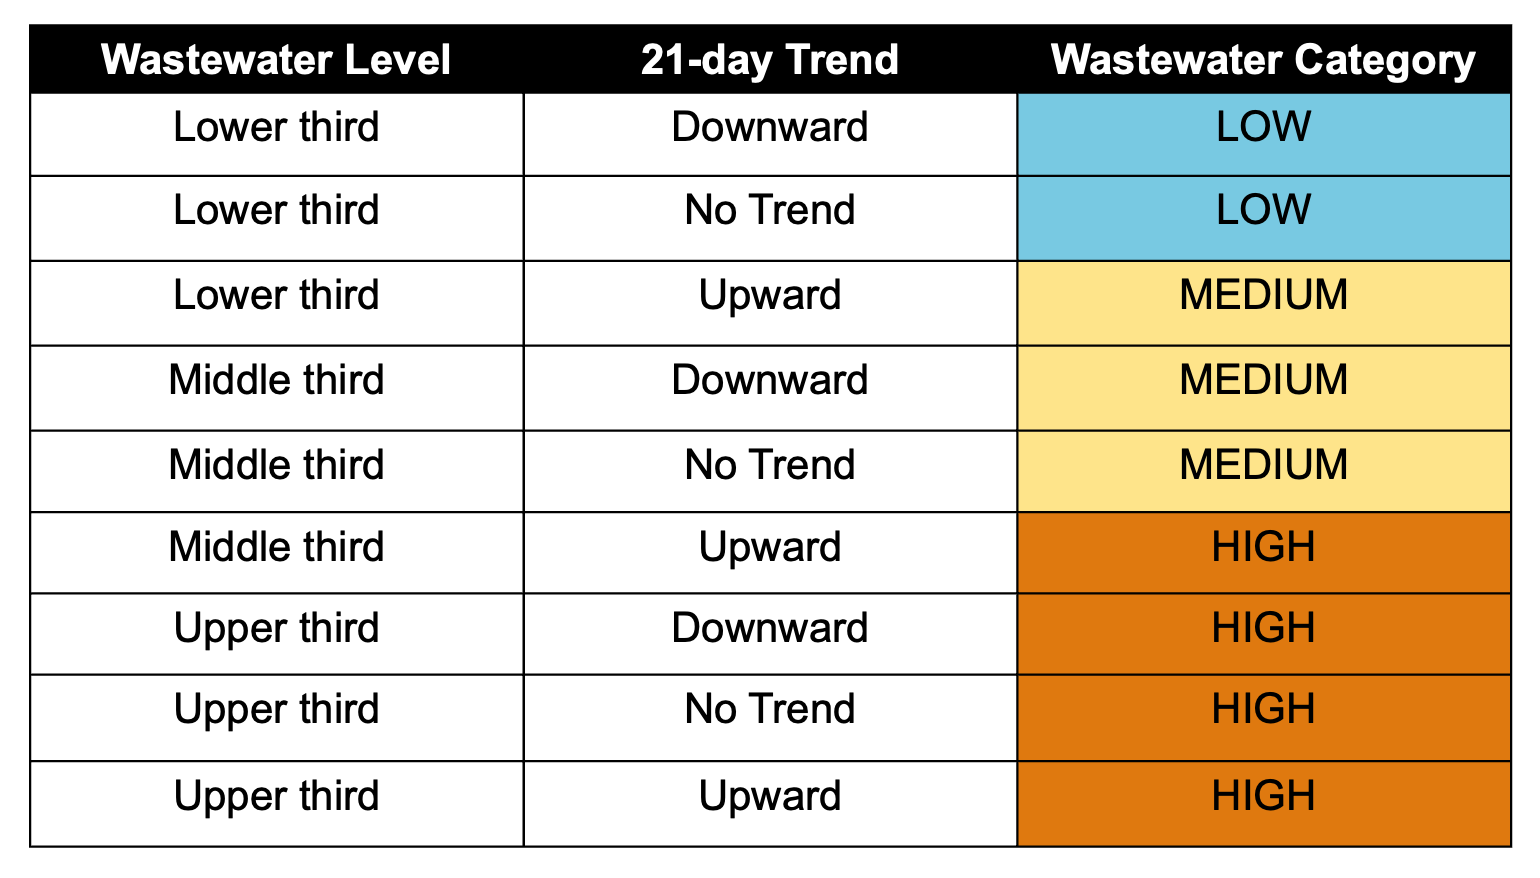
WastewaterSCAN uses a Wastewater Categorization system to communicate insights from recent wastewater results. Research shows that the measurements we make in wastewater are related to disease in the community. The wastewater categorization helps us quickly understand if the recent measurements for a disease fall into a low, medium, or high category and are determined based on a combination of the following variables:
- Trends indicate whether wastewater concentrations of pathogens have been changing significantly (i.e., increasing or decreasing) for each location over the last 21 days
- Levels indicate whether wastewater concentrations are relatively lower or higher at each location compared to national concentrations of each pathogen (i.e., upper third, middle third, or lower third, as measured over the last year)
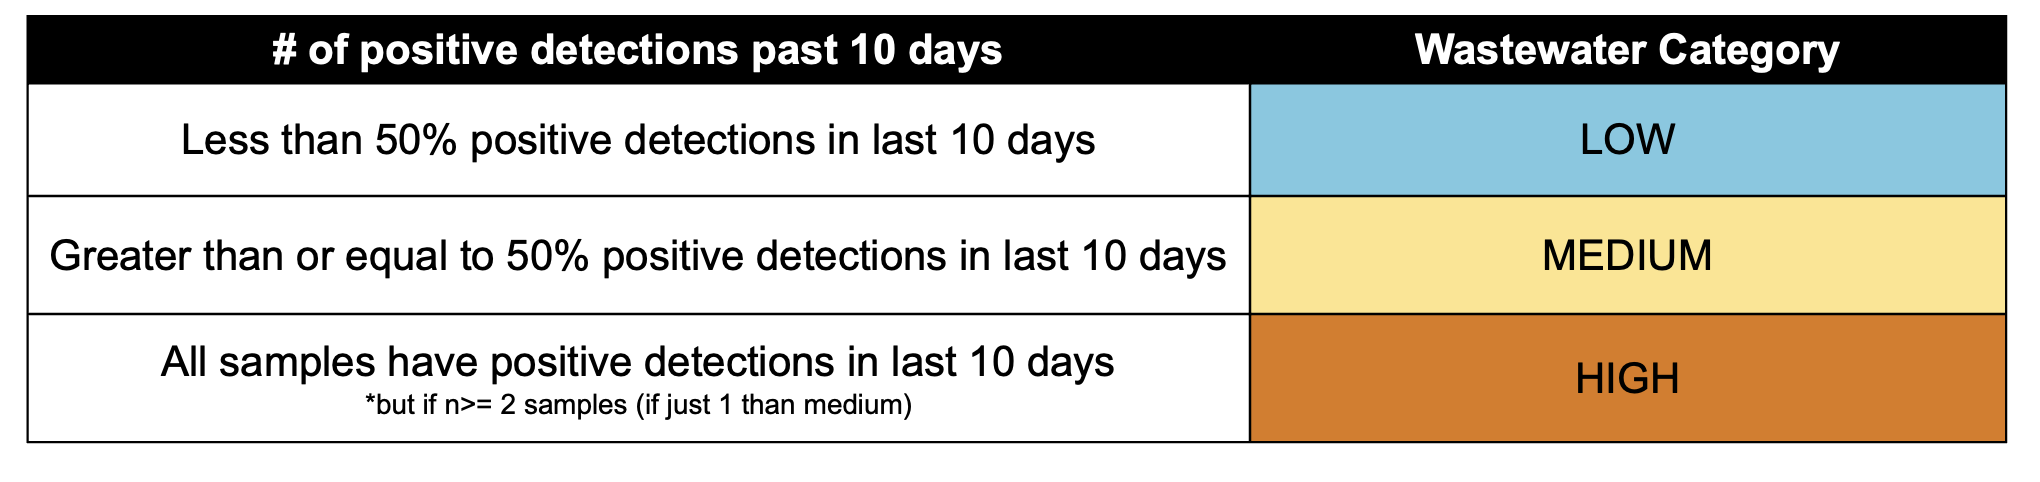
- Frequency of detection indicates how often a pathogen is detected in wastewater for each location over a recent time period (e.g., the last 10 days)
The new Wastewater Categorization system can now be accessed on the map view of the data.wastewaterscan.org site!
The Wastewater Categories are applied slightly differently for three archetypes of diseases:
- Pathogens that are commonly detected (regardless of season) - SARS-CoV-2, Norovirus, and ‘peak season’ Respiratory pathogens (IAV, RSV, HMPV)
- Seasonal pathogens (rarely detected outside of season/outbreaks) - IAV, RSV, HMPV
The methodology used to determine seasonal Onset vs Offset using raw target concentrations (not PMMoV Normalized) for individual sites is as follows:
The onset dates of IAV, RSV, and HMPV wastewater events are identified as the first day for which all samples in a 14 day look back period had concentrations higher than or equal to 2,000 copies/g, which is approximately twice the lowest detectable concentration. Once IAV, RSV, or HMPV are onset, the method for 'commonly detected pathogens' (see above) is used to determine the wastewater categorization.
The offset dates of IAV, RSV, and HMPV wastewater events were identified as the first day after an onset event for which only 50% of samples during a 14-d look back period have concentrations higher than or equal to 2,000 copies/g. When one of these signals is in offset, it is assign a ‘LOW’ categorization.
- Pathogens that are not commonly detected (regardless of season) - Mpox
COVID-19
SARS-CoV-2 and Variants
SARS-CoV-2 N gene concentrations are between 10,000 and ~100,000 copies/g. Below is a chart that highlights the centered, 5-d trimmed average values for all SCAN sites compared to the population weighted average across the SCAN plants (black) since the beginning of June.
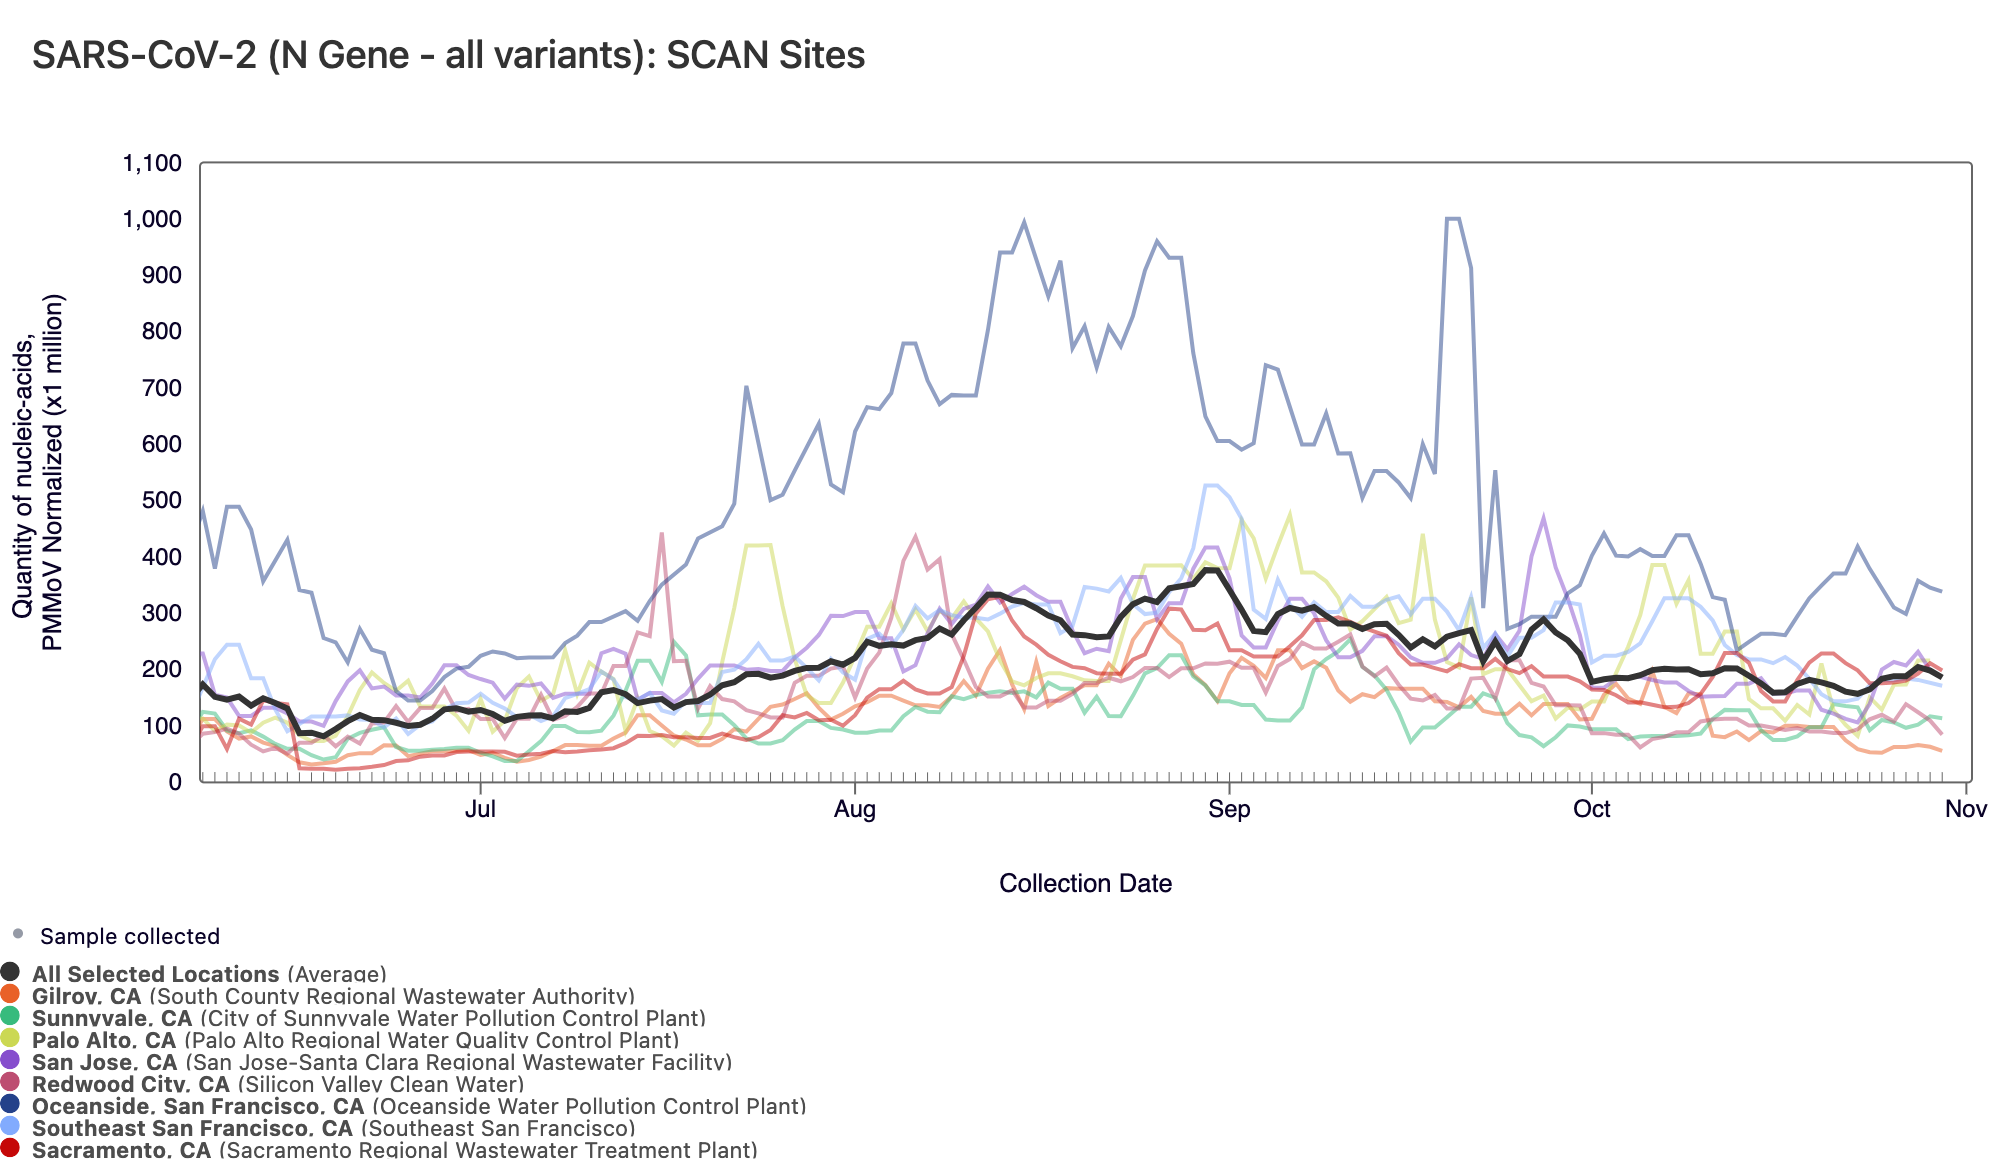
Below are the current SARS-CoV-2 wastewater categories for the SCAN sites (recall the category is determined by both the trend and the level):
Gilroy, SVCW, and Sunnyvale are in the LOW Wastewater CategoryPalo Alto, Sacramento, San Jose, Oceanside SF and Southeast SF are in the MEDIUM Wastewater Category
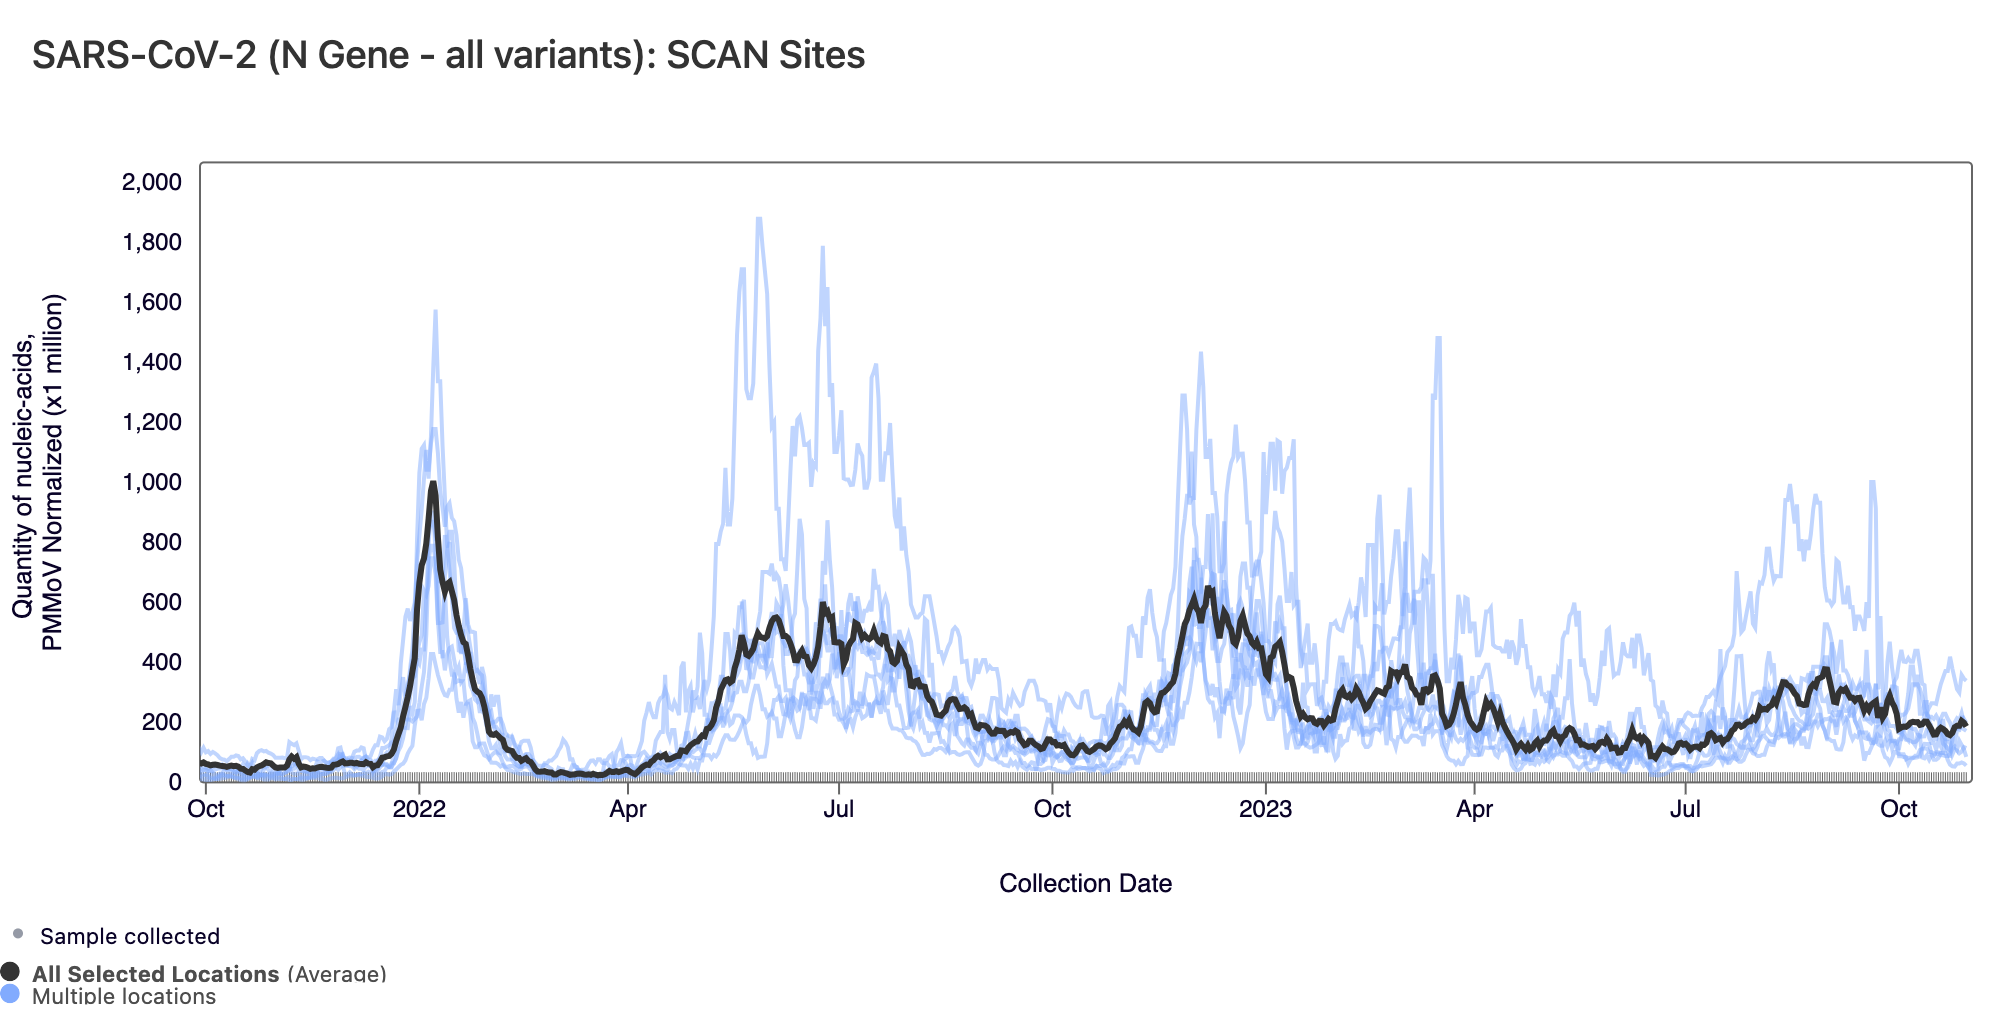
Below are all the data from all the SCAN plants for the last two years. You can access the graph here. The population weighted average across the SCAN plants is shown in black.
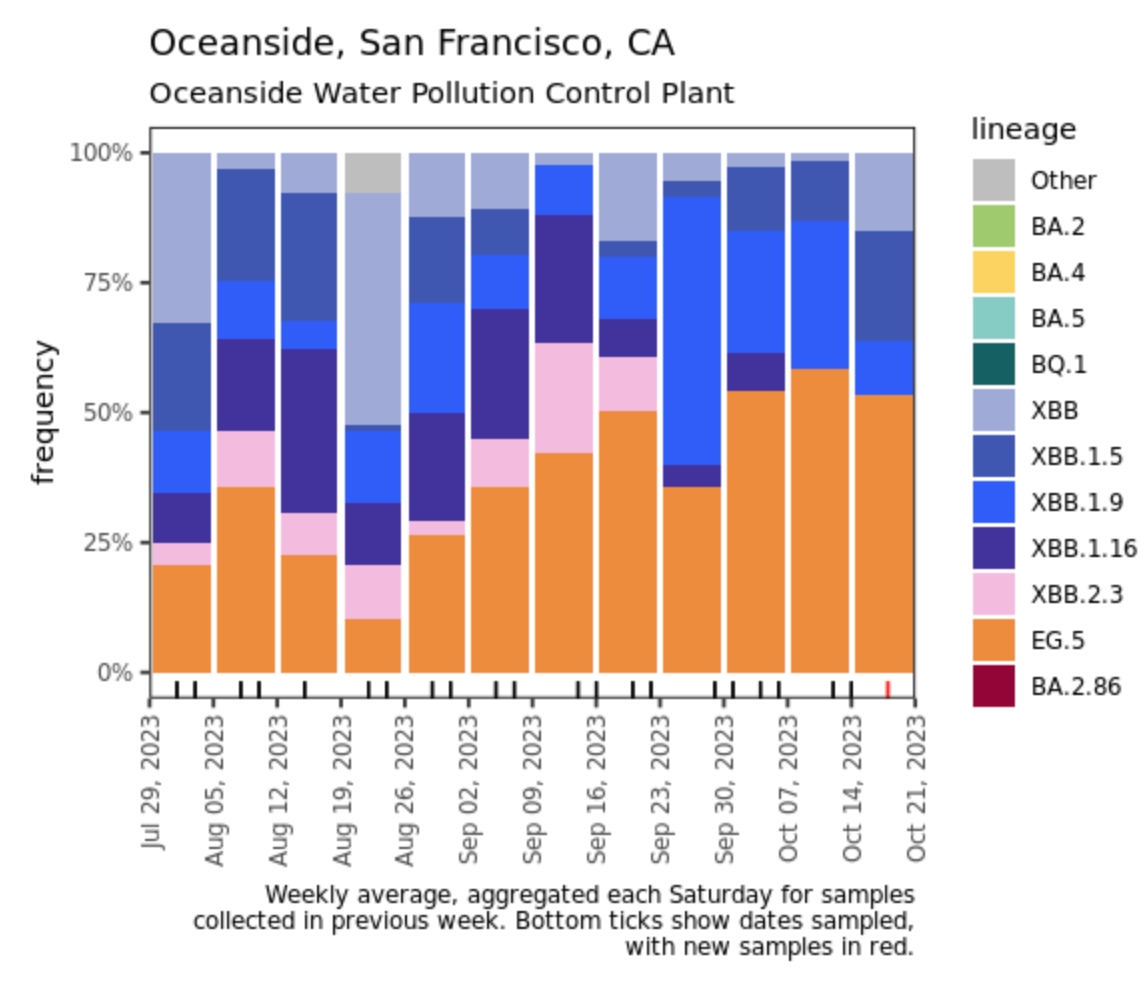
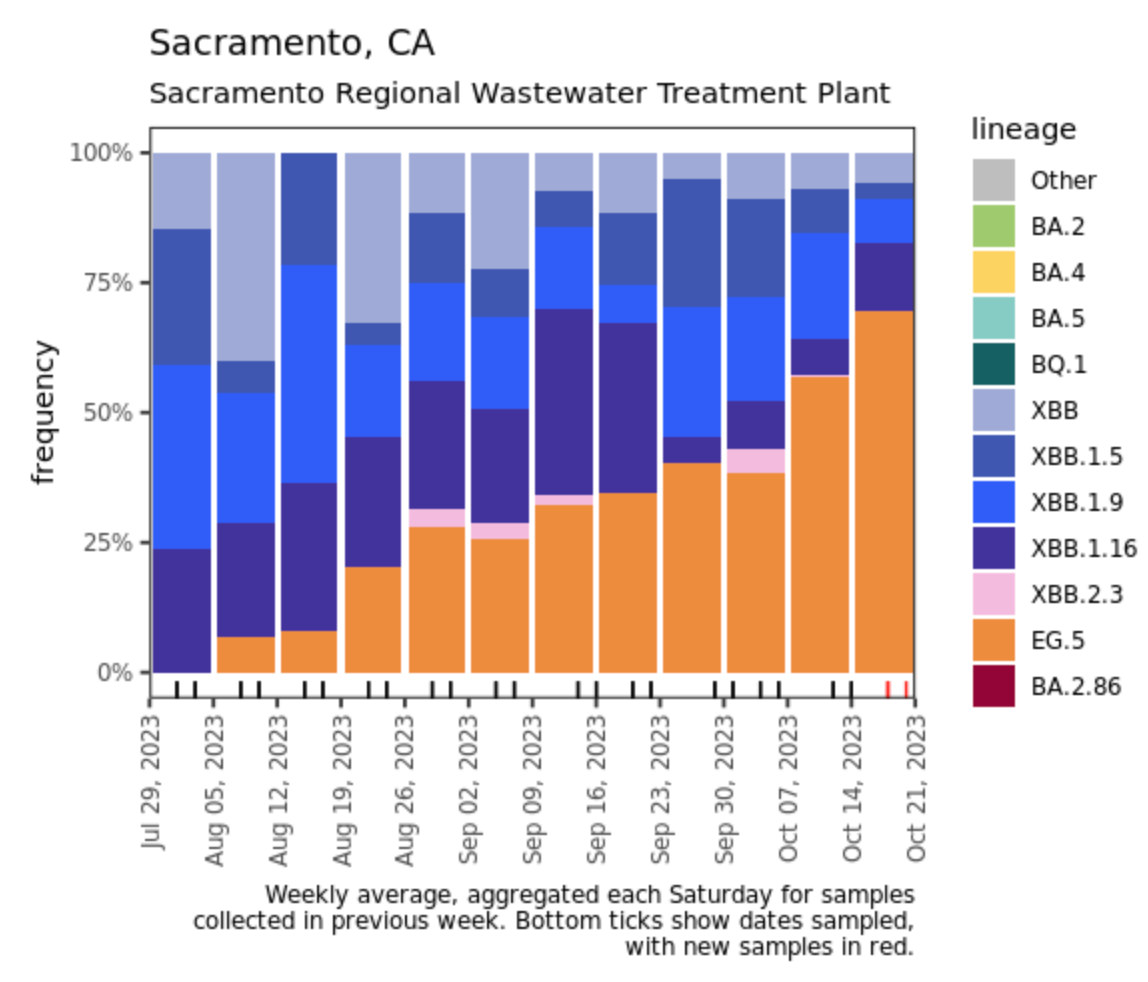
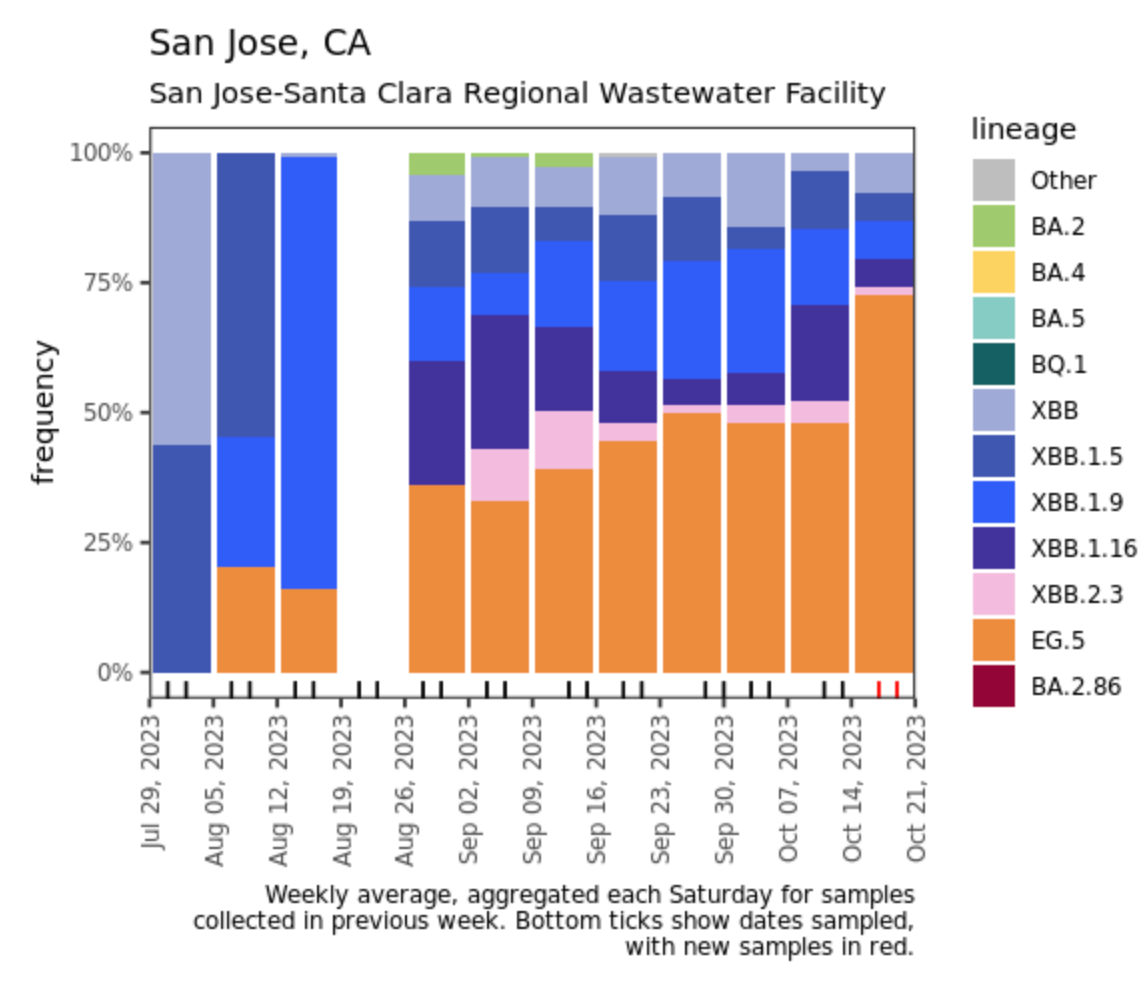
Below are plots from Oceanside, Sacramento, and San Jose showing the relative proportions of different variants inferred from sequencing the entire genome of SARS-CoV-2. Samples with low coverage are not being displayed in the plots (this explains the empty column for San Jose). In the most recent samples, you can see that Sacramento and San Jose were approaching 75% of the sublineage EG.5 (in orange) while Oceanside was ~50% of the sublineage EG.5. In the last sequencing run, we did not detect BA.2.86 in wastewater from any SCAN sites. Note that the sequencing data are always from samples taken between 1- 2 weeks ago.
Other Respiratory Targets
Influenza A & B, RSV, HMPV, EV-D68 and Parainfluenza
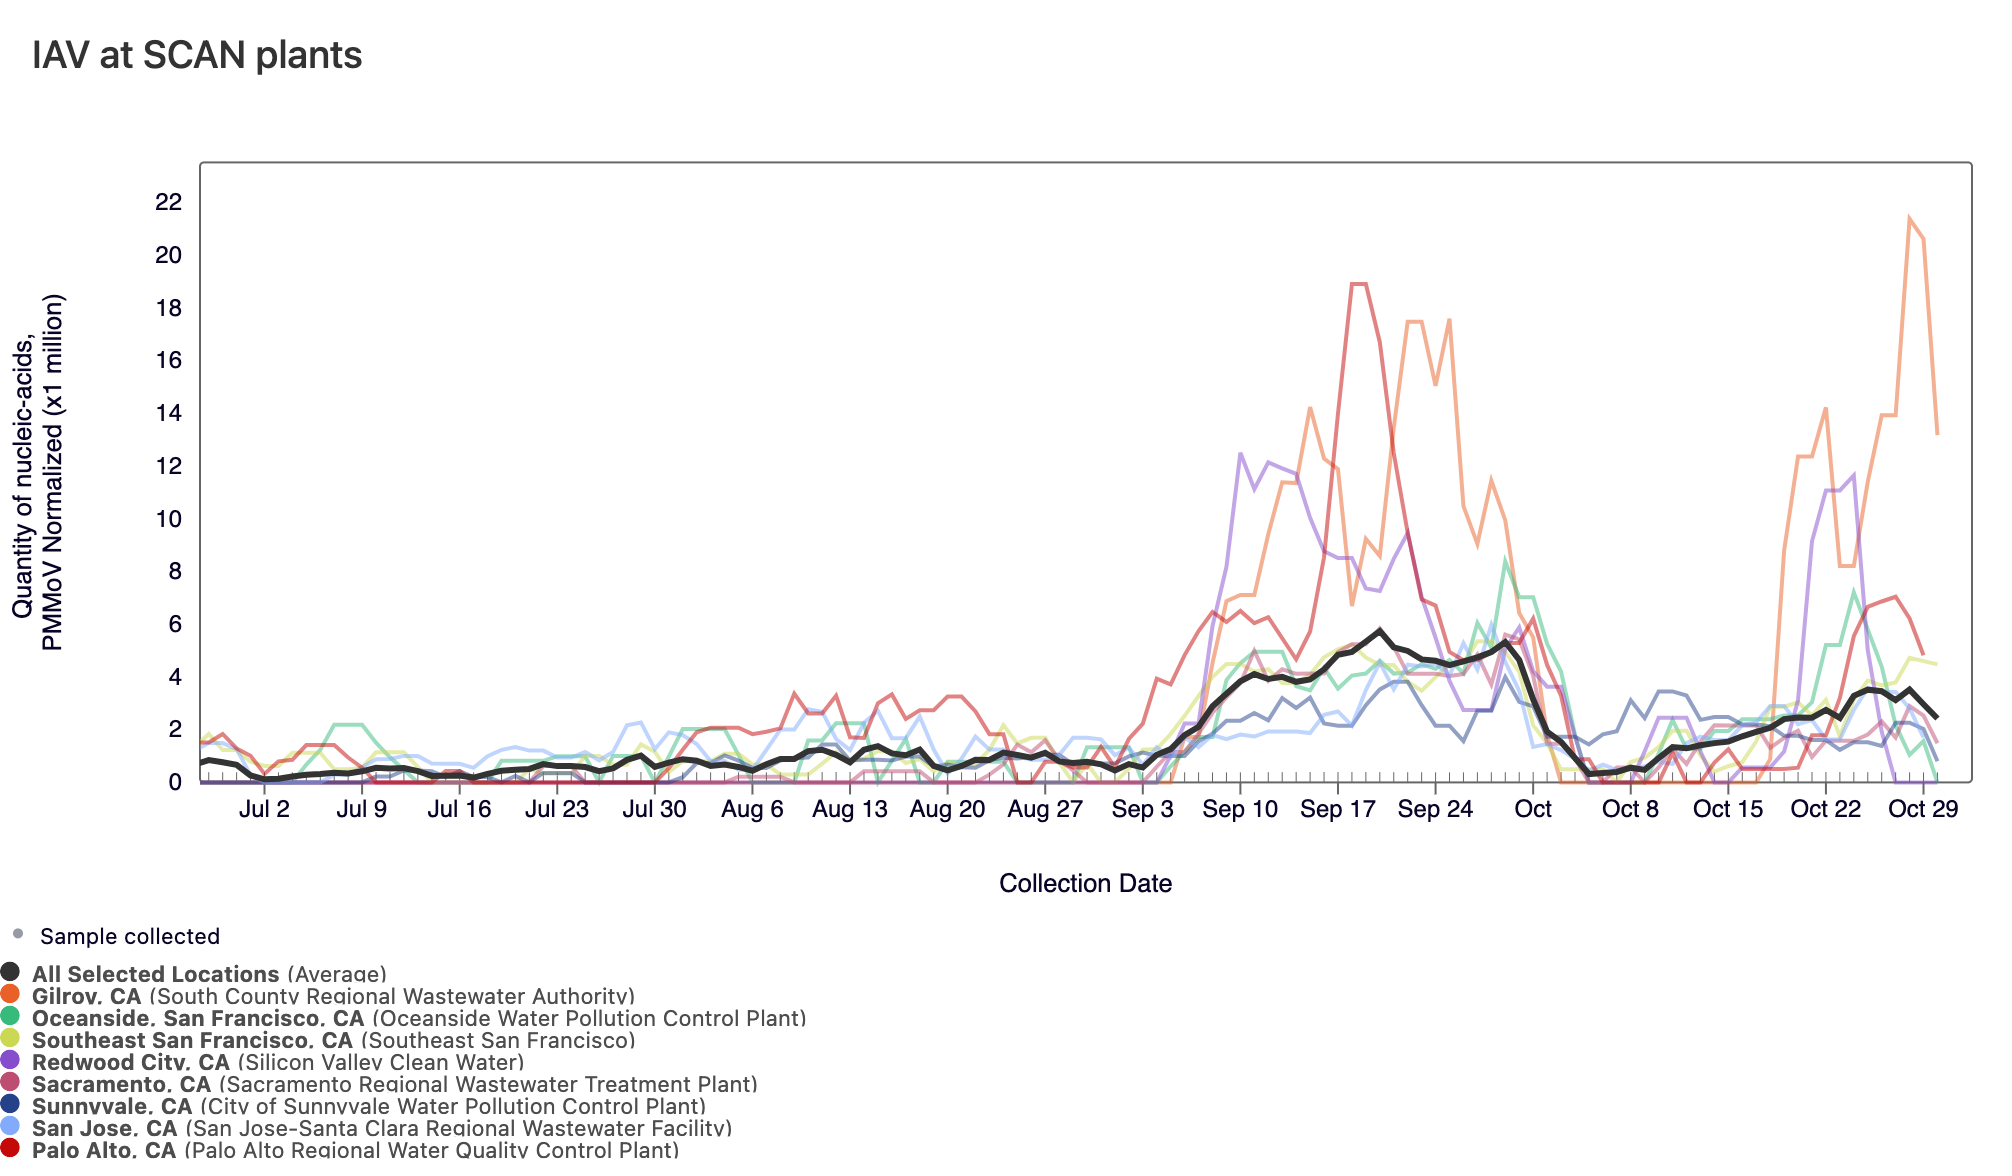
Influenza A (IAV) RNA concentrations are increasing across SCAN sites, as can be seen below, particularly at Gilroy and Redwood City. In the chart below, the population weighted average line across all the SCAN plants is shown in black for all SCAN plants since July. Two sites have met the benchmark for onset (Sacramento and Palo Alto).
Currently all SCAN sites are in the 'LOW' category for IAV
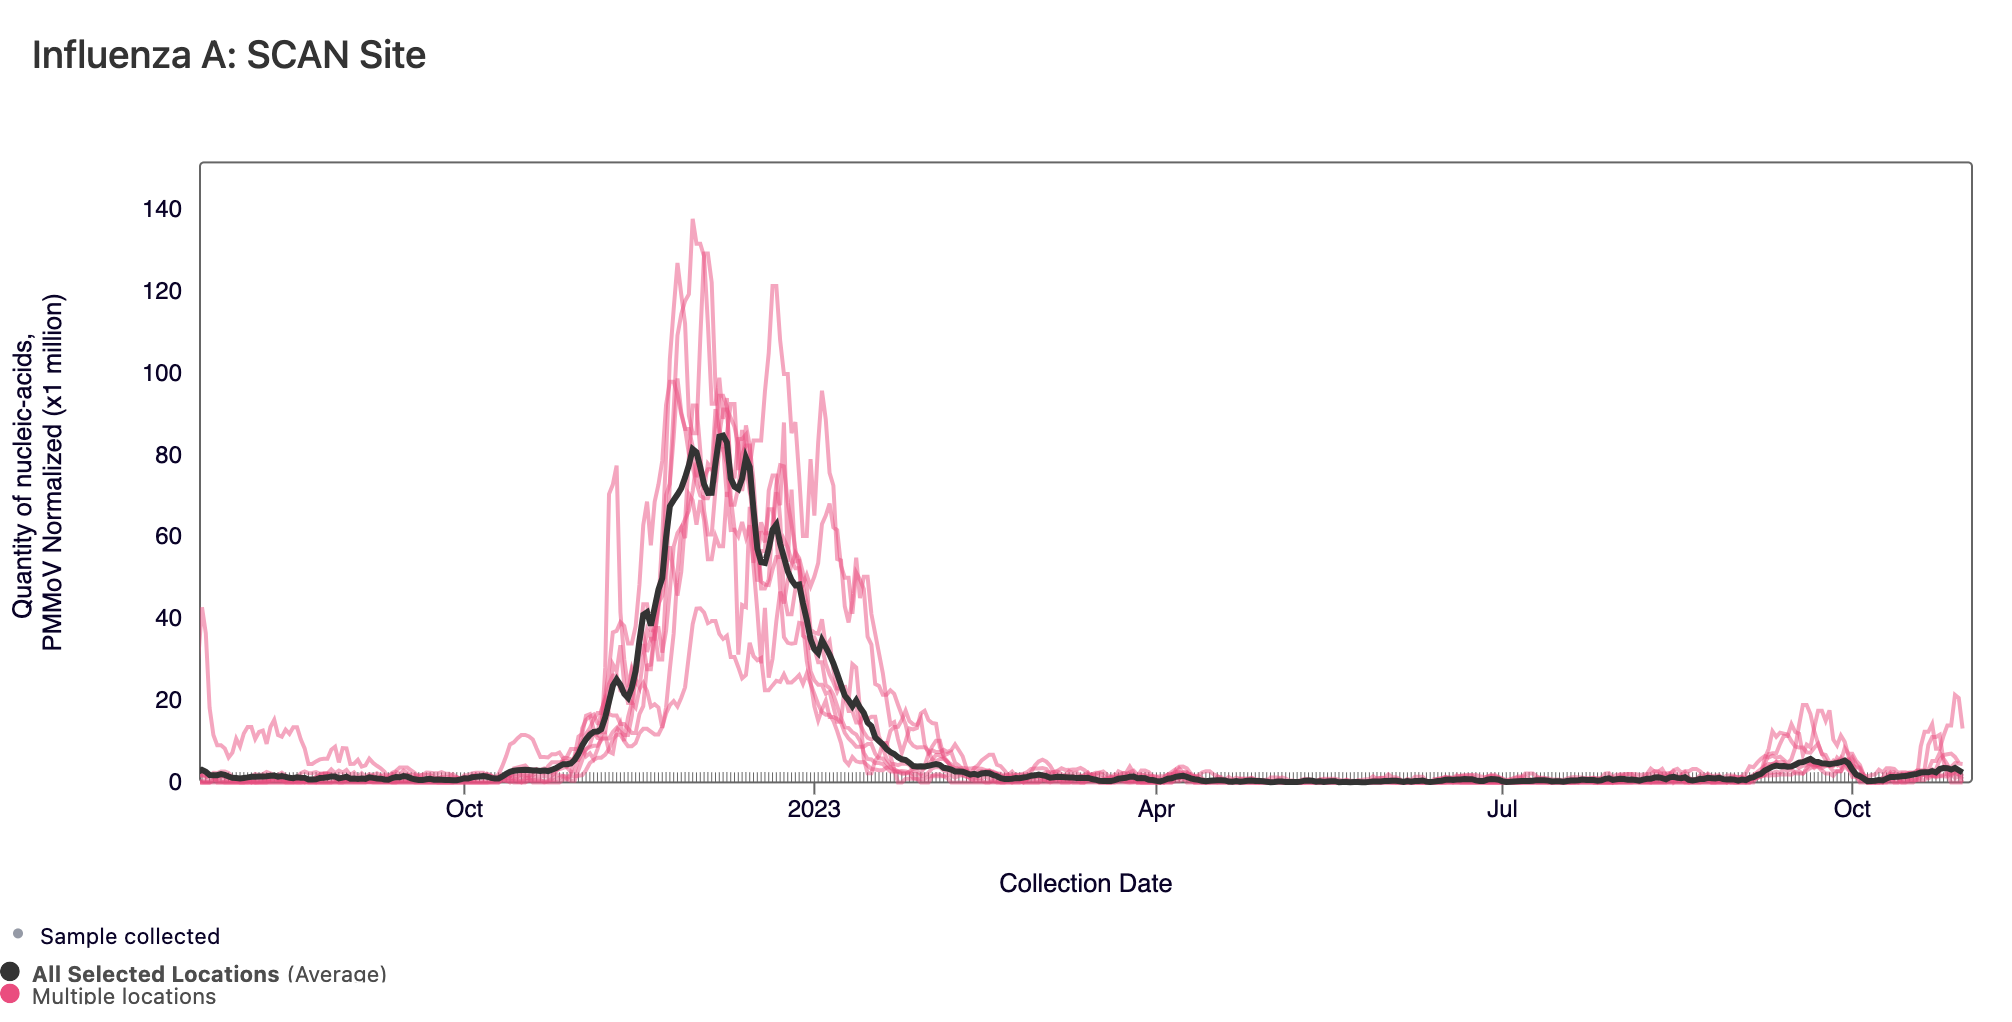
In the chart below, the population weighted average line across all the SCAN plants is shown in black for the full time series. The link to the chart below is here if you would like to interact with it.
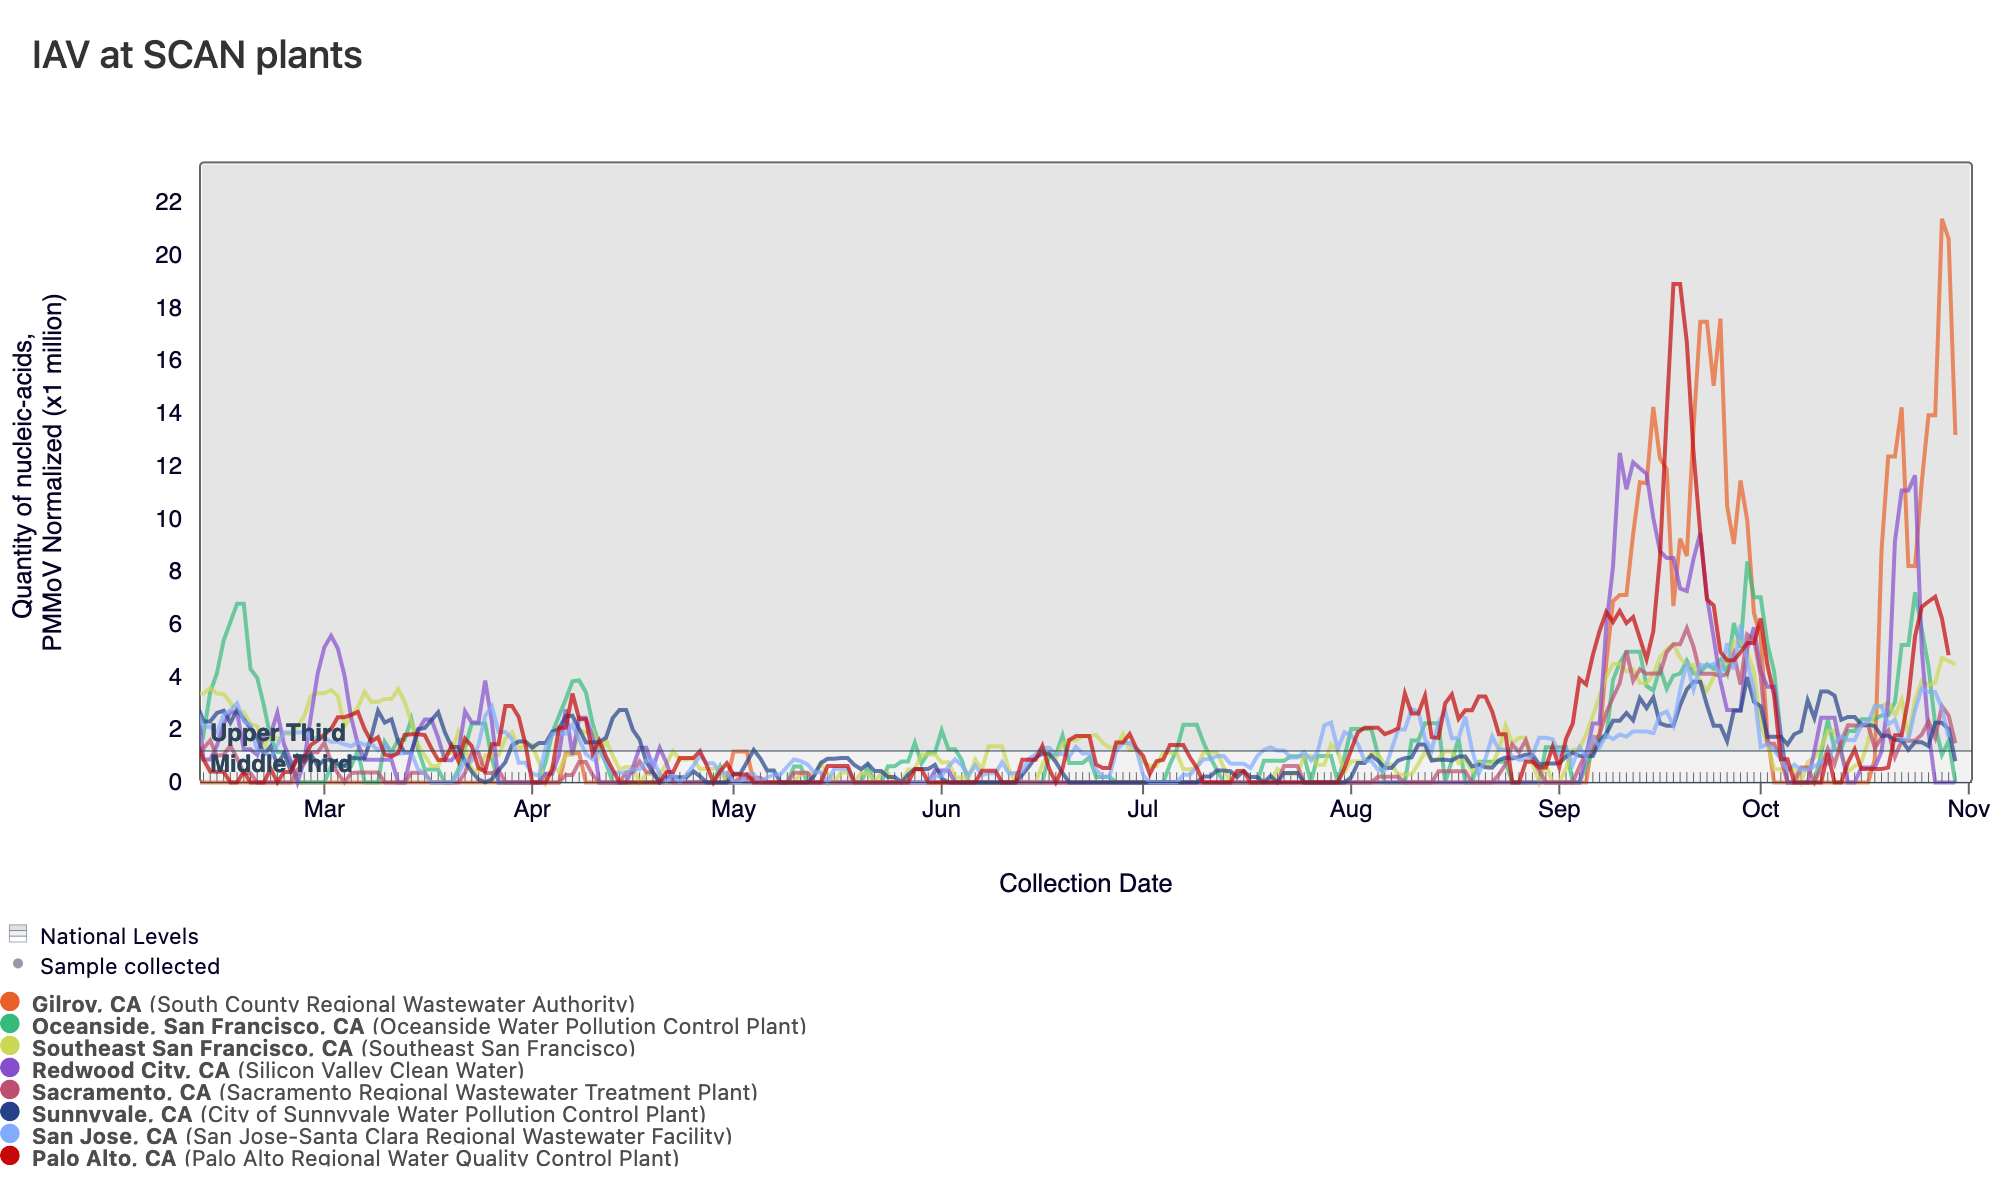
Below is a chart showing the National Levels benchmarks superimposed on the IAV data from the SCAN sites since the beginning of 2023 (you can access this chart here). Currently, Sunnyvale, Oceanside SF, and SVCW have IAV concentrations in the middle third level and all other SCAN sites have IAV concentrations in the upper third level.
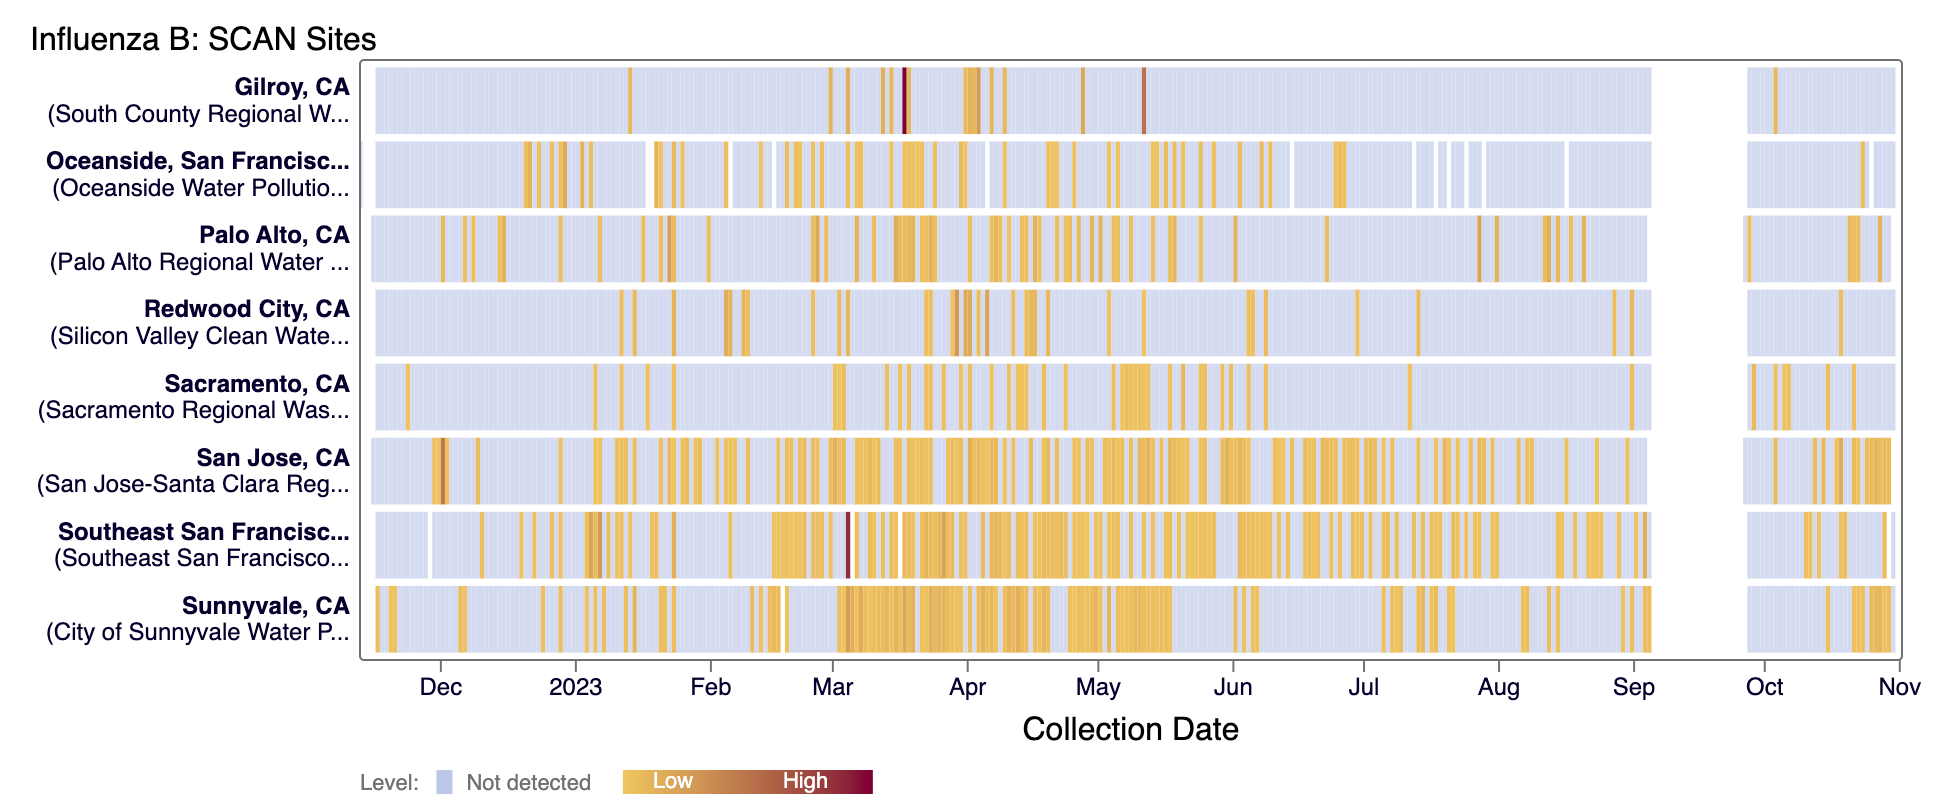
Influenza B (IBV) RNA has been sporadically detected at most SCAN sites in the last 21 days. However, IBV has been detected in the majority of San Jose samples in the last 21 days. The heat map below shows all the SCAN sites as a row and each date as a column. The color blue means the sample was non-detect for IBV RNA and the colors get darker with higher concentrations. White indicates no sample was collected. We briefly stopped monitoring for IBV, which explains gap in data across sites in September. Here is the link to the heat map chart - the linked chart will update automatically as more data are added to the site.
RSV RNA concentrations have increased for most SCAN sites since the beginning of September, as can be seen below. In the chart, the population weighted average line across all the SCAN plants is shown in black for all SCAN plants since June. Five sites have met the benchmark for onset (Palo Alto, San Jose, Southeast SF, Sunnyvale, and Oceanside SF).
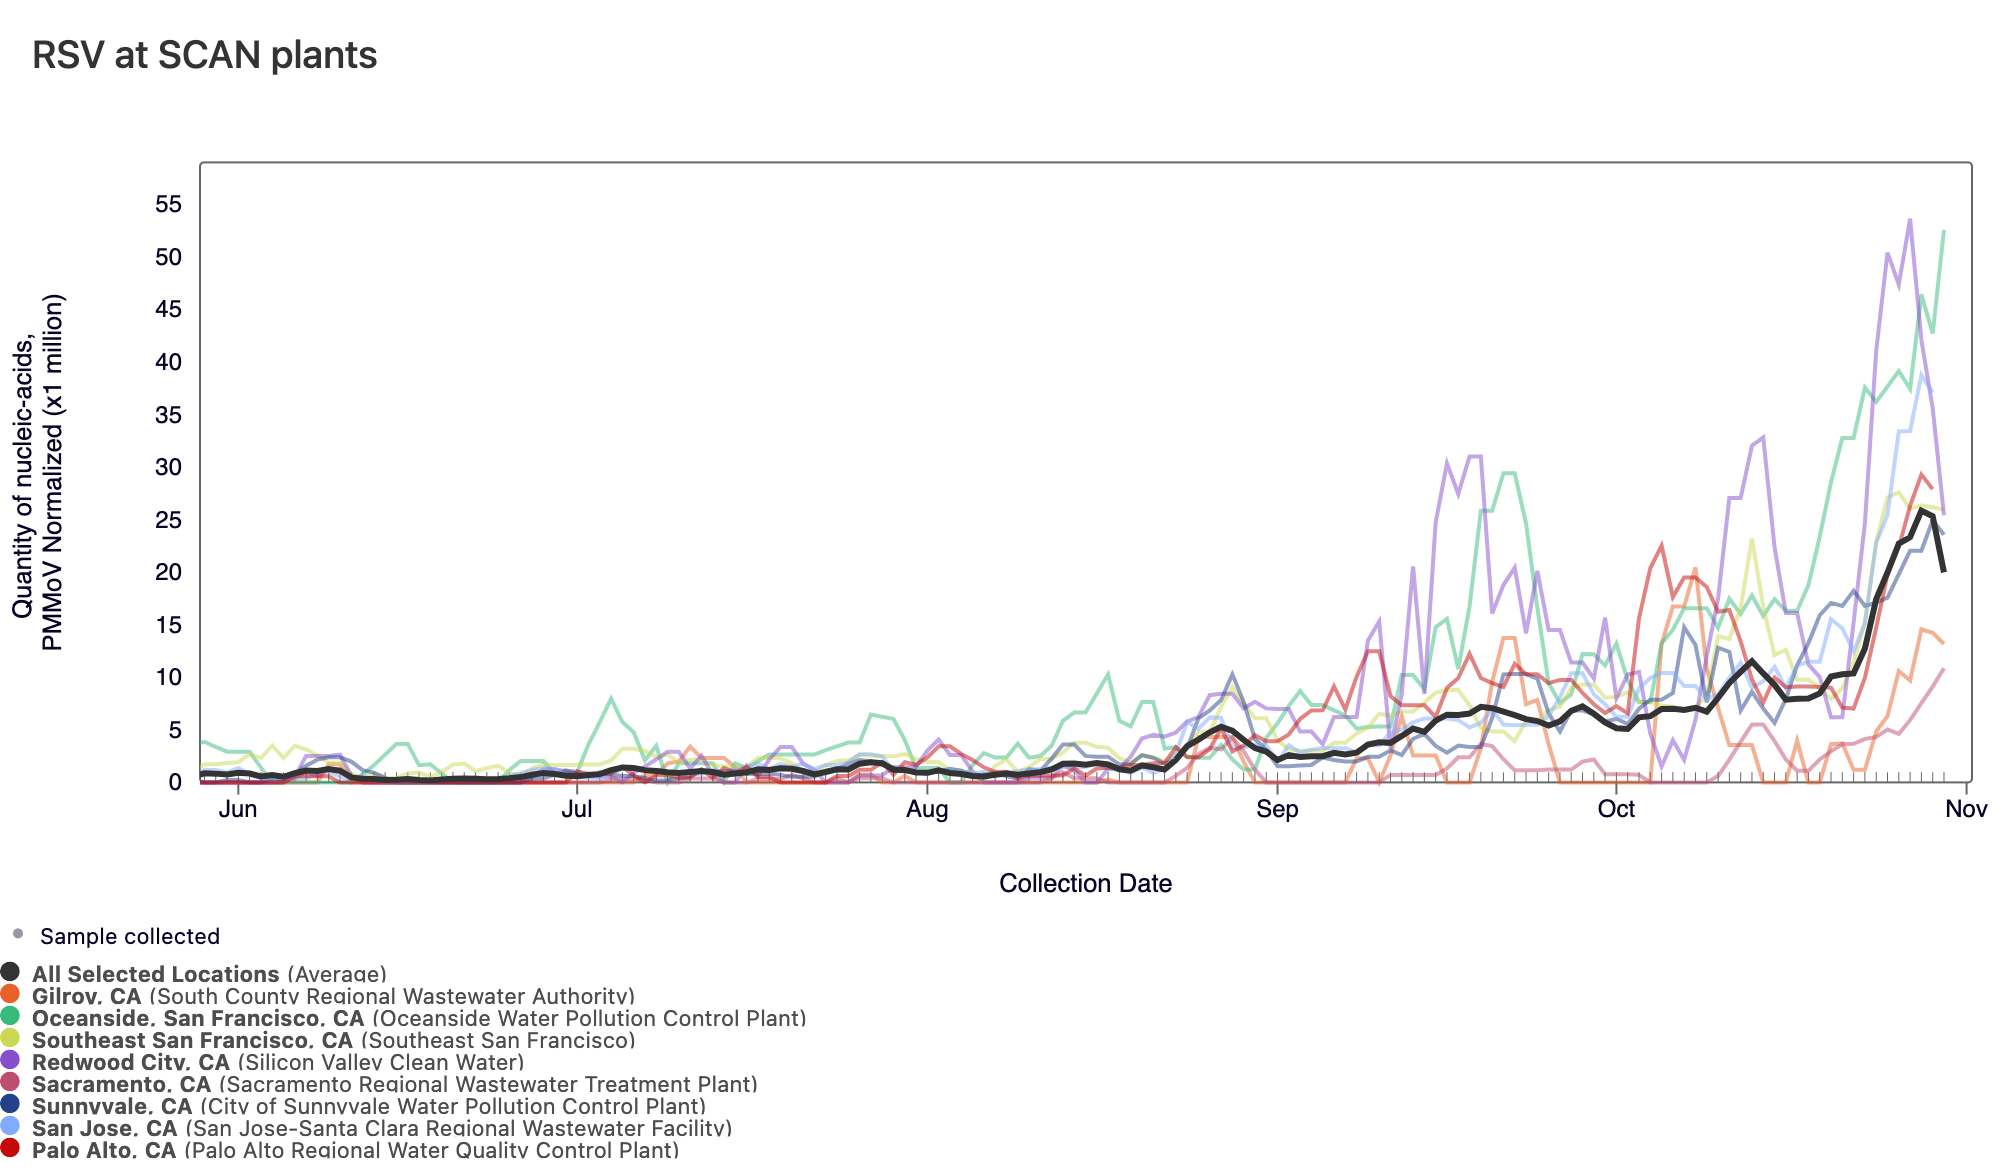
Below are the current RSV wastewater categories for the SCAN sites:
Gilroy, SVCW, and Sacramento are in the LOW Wastewater Category (not in onset)Oceanside SF, Palo Alto, Sunnyvale, San Jose, and Southeast SF are in the HIGH Wastewater Category (in onset)
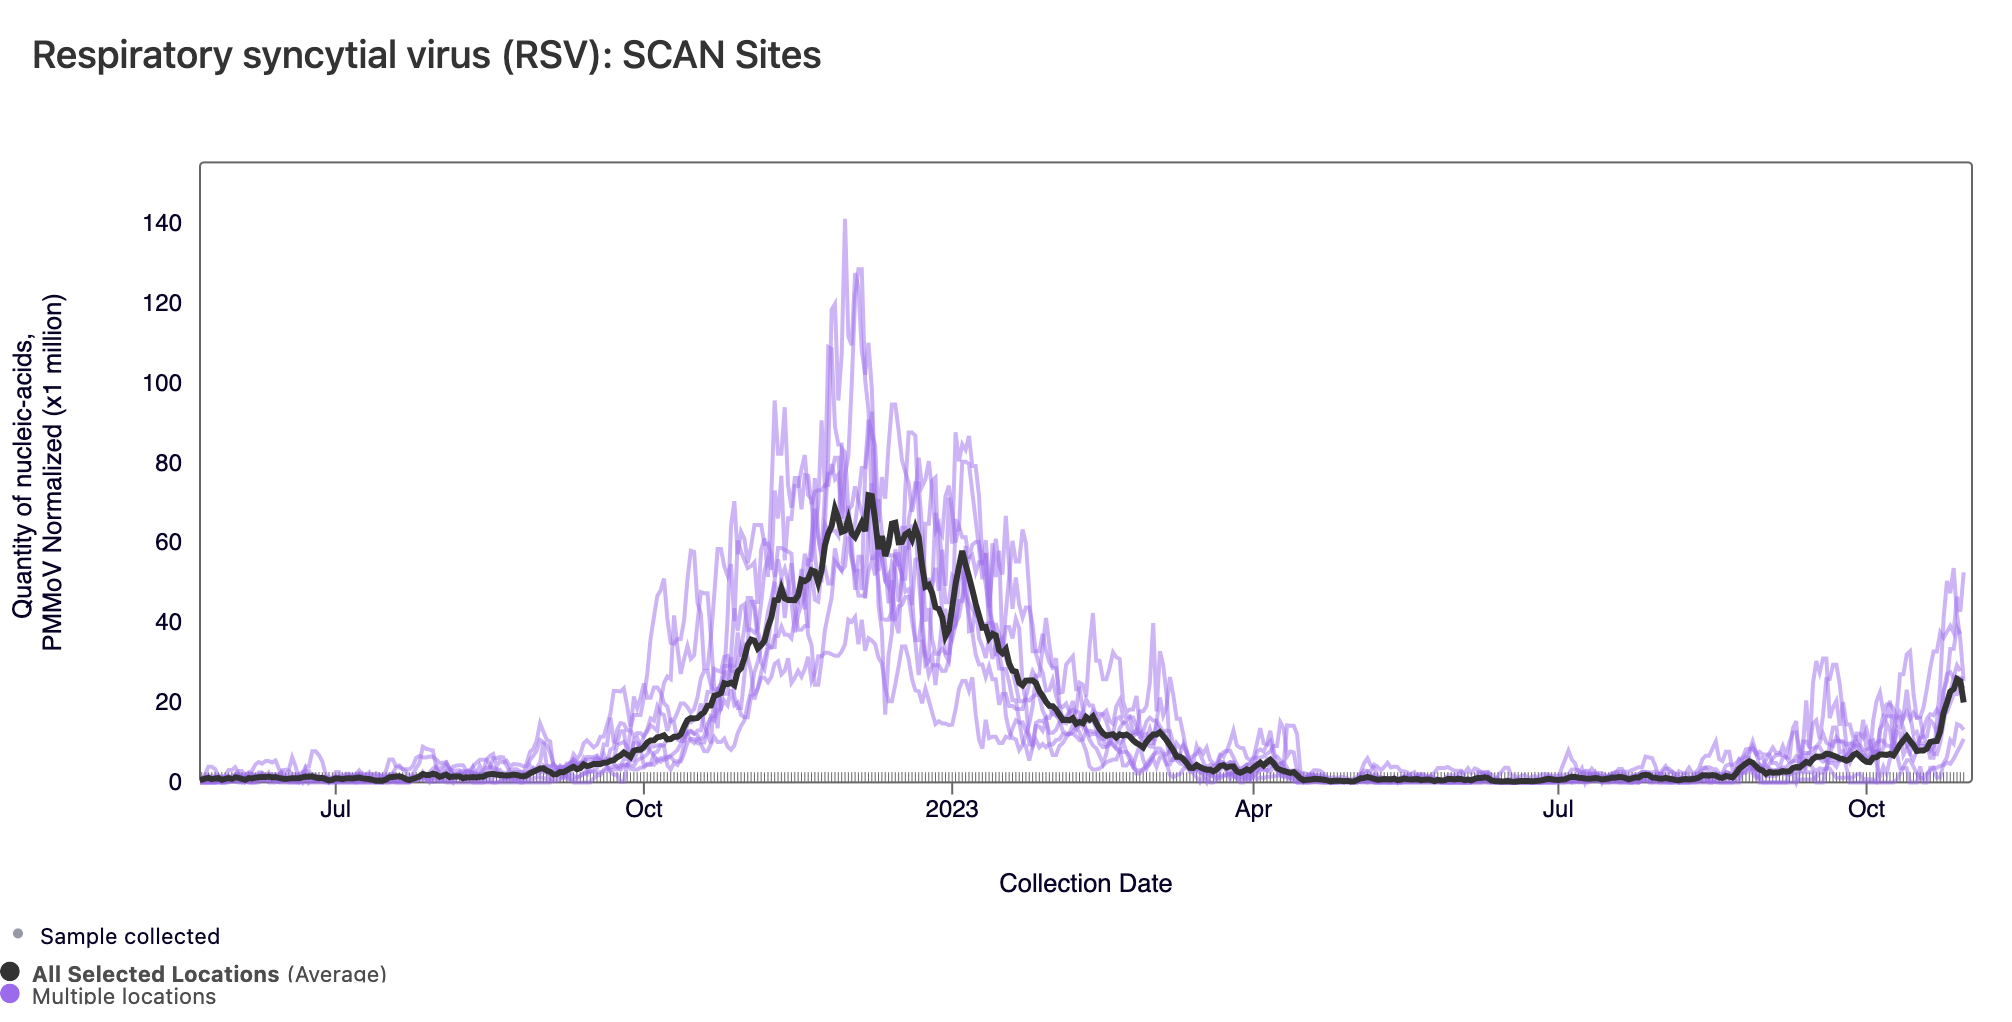
In the chart below, the population weighted average line across all the SCAN plants is shown in black since last winter. The link to the chart below is here if you would like to interact with it.
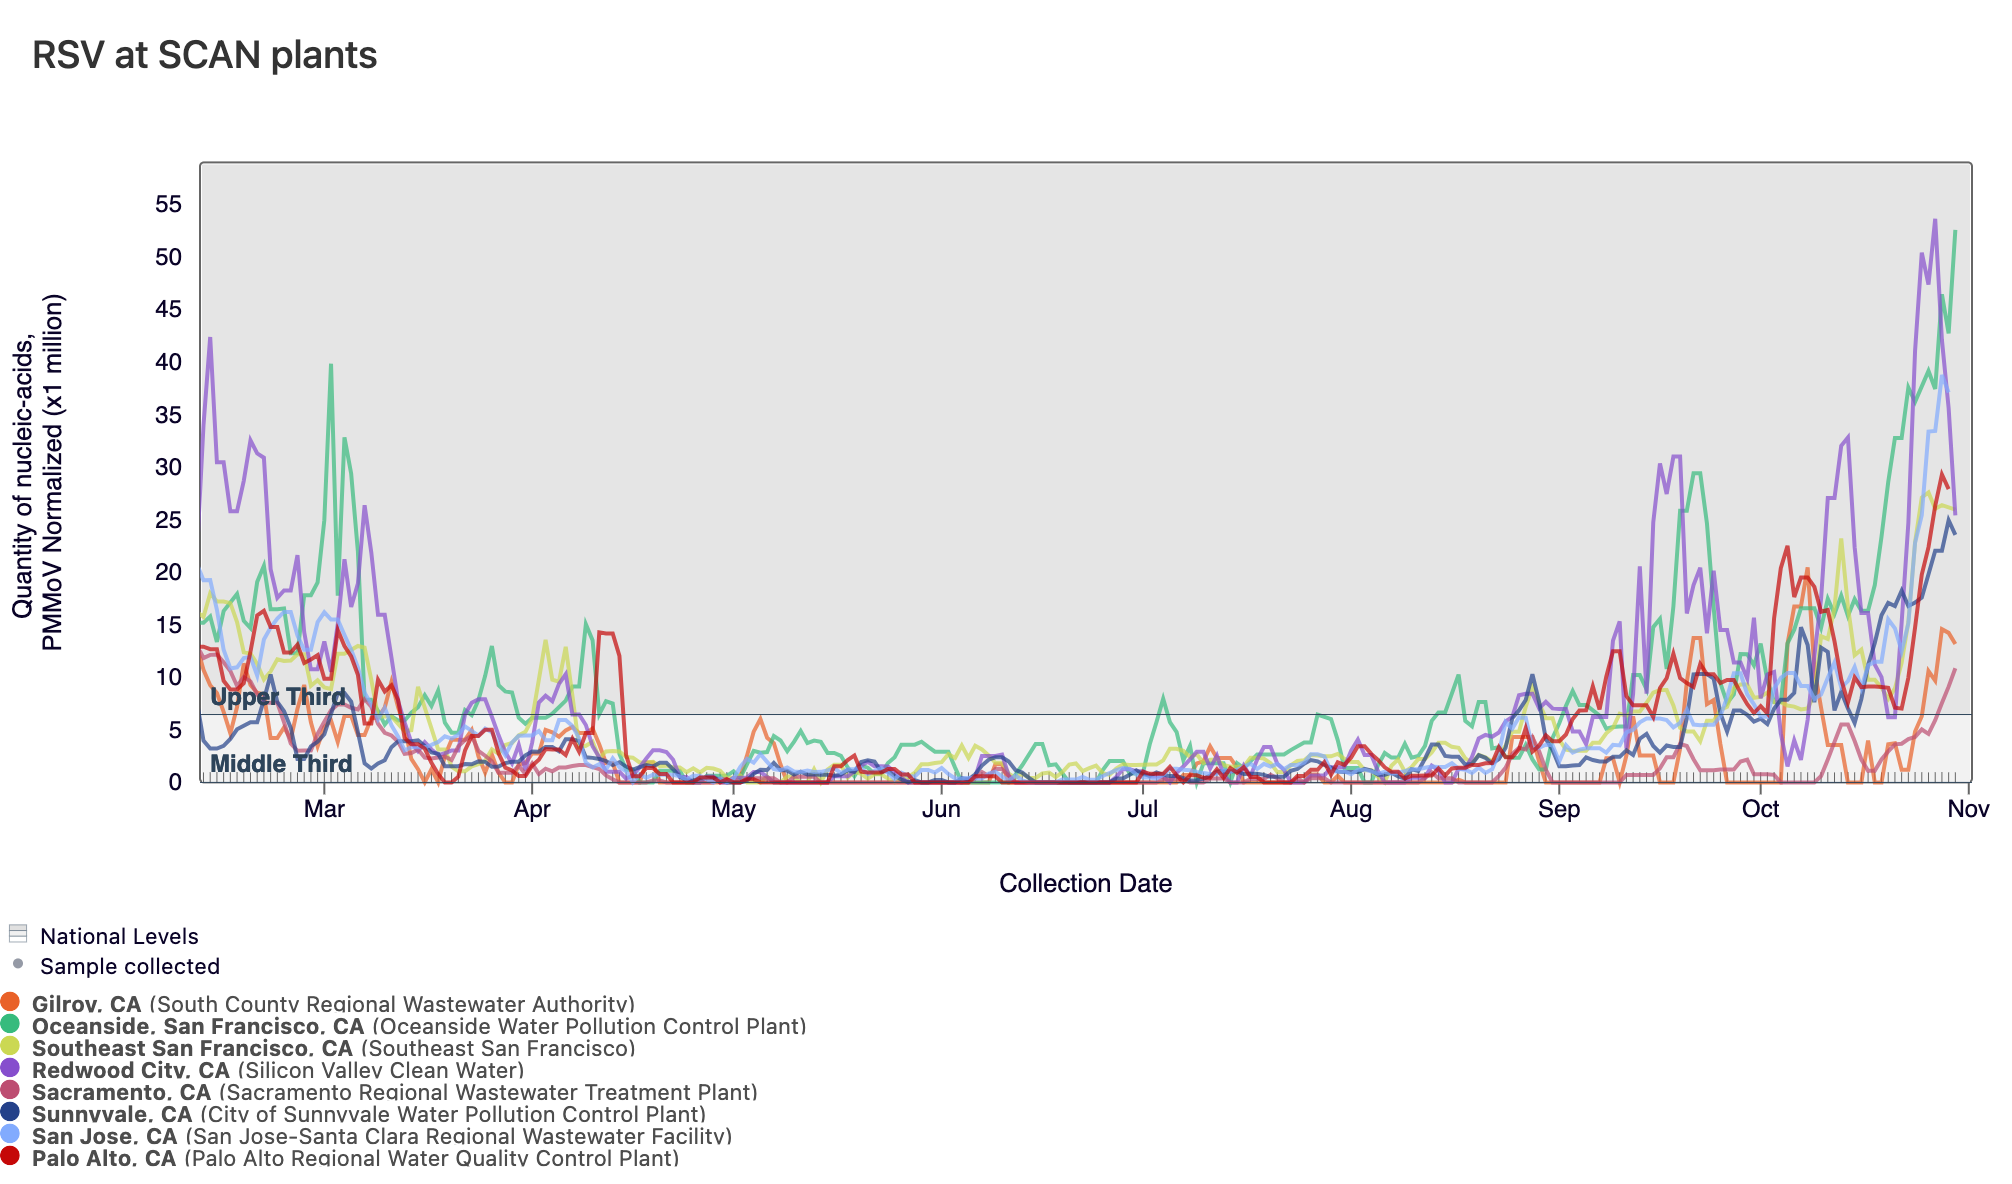
Below is a chart showing the National Levels benchmarks superimposed on the RSV data from the SCAN sites since the beginning of 2023 (you can access this chart here). Currently, Gilroy, Palo Alto, and and Sacramento are in the middle third and all other SCAN sites have RSV concentrations in the upper third level.
HMPV (Human metapneumovirus) RNA concentrations are low at most of plants in SCAN. The population weighted average line is shown in black. Below are charts showing data from all the SCAN plants together (link here to this chart if you want to interact with it).
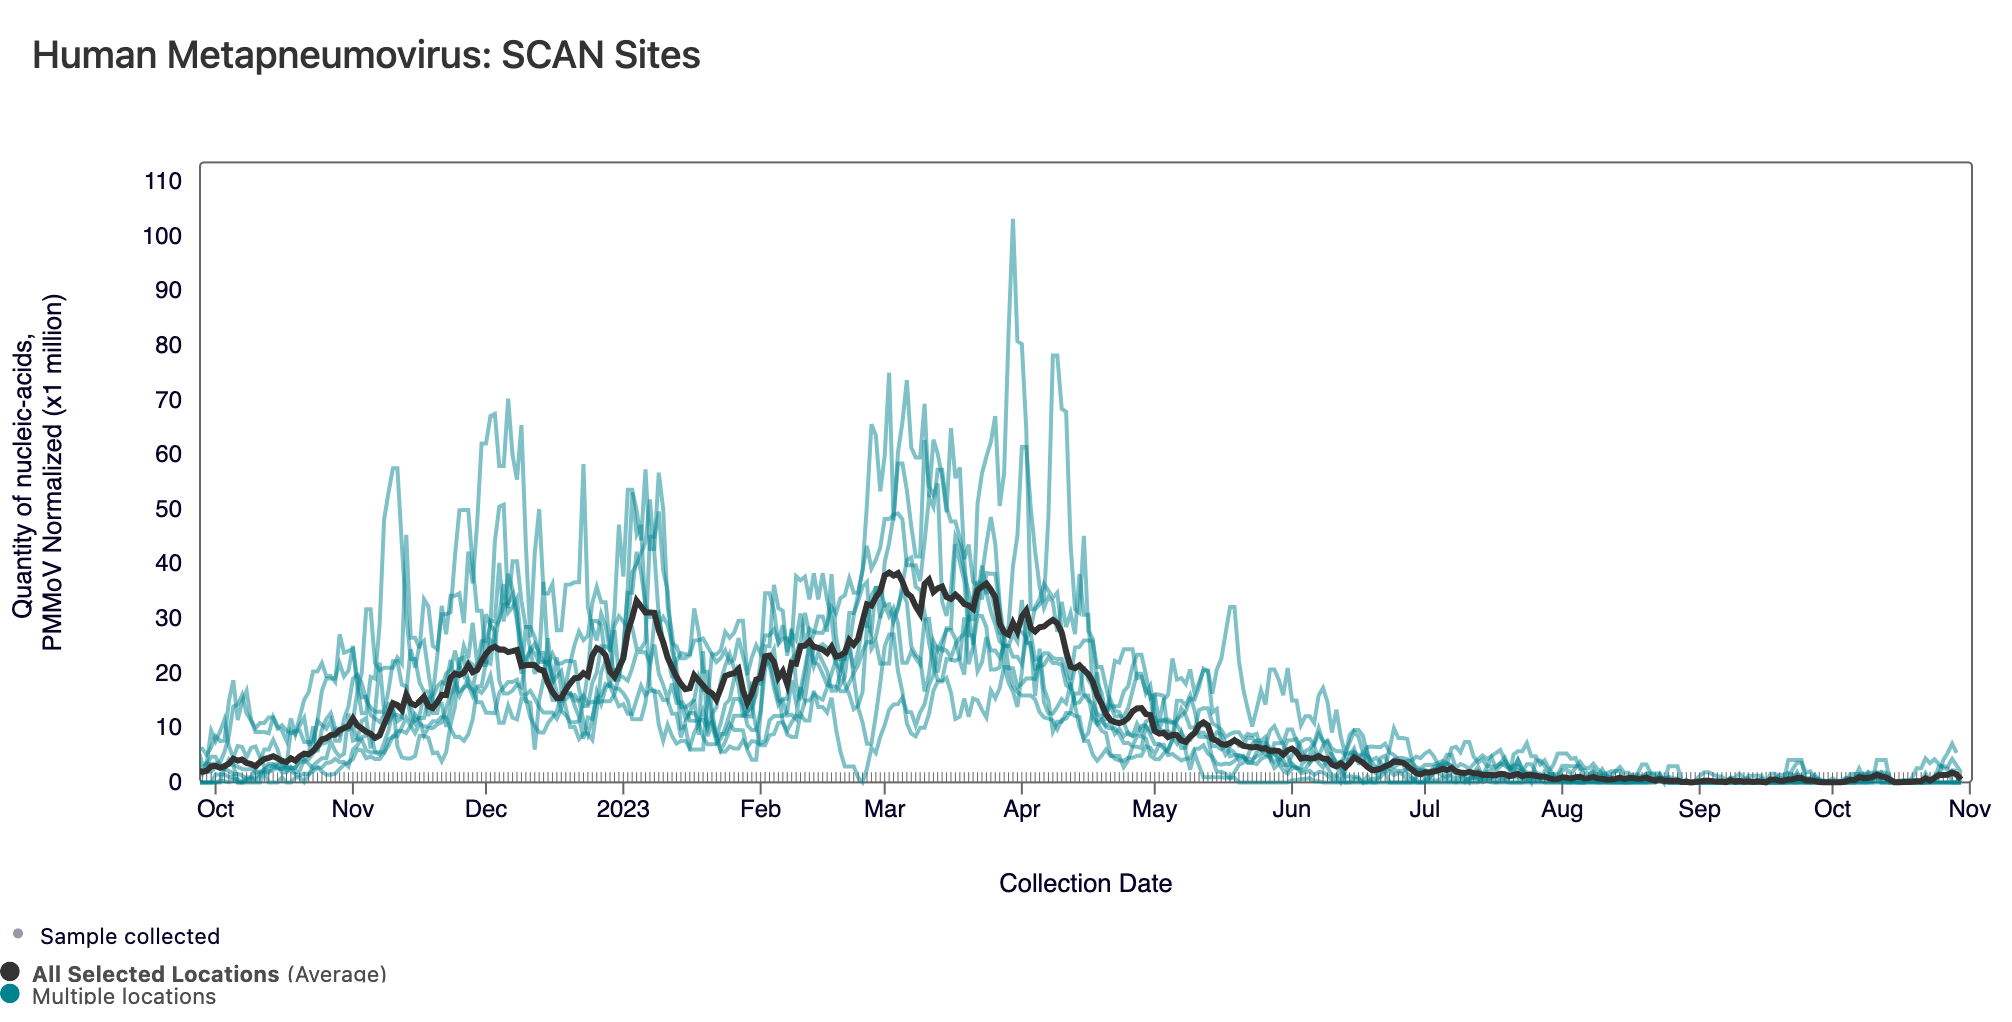
Currently all SCAN sites are in the 'LOW' category for HMPV.
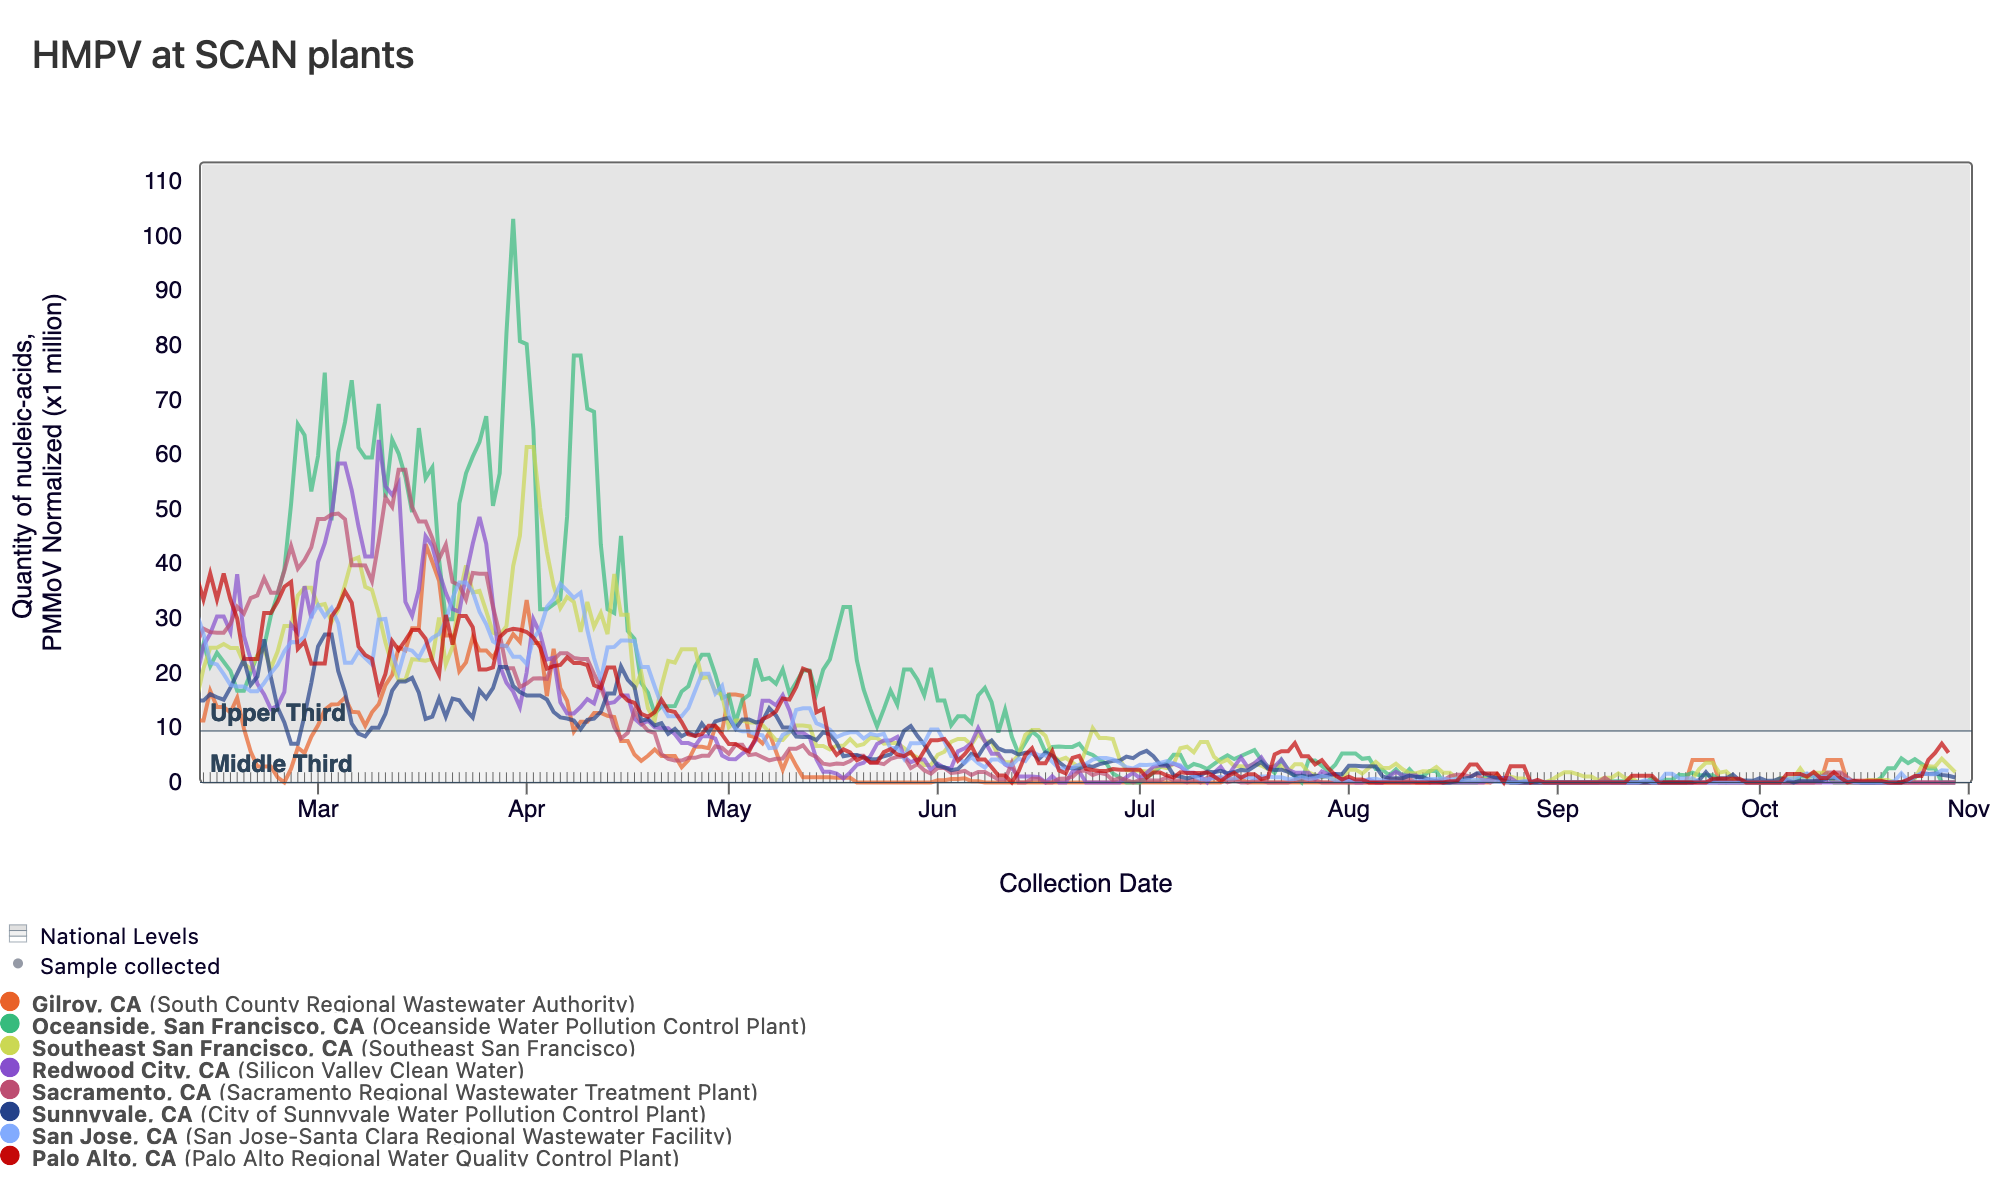
Below is a chart showing the National Levels benchmarks superimposed on the HMPV data from the SCAN sites since the beginning of 2023. (You can access the chart here.) Currently all SCAN sites have HMPV concentrations in the middle third level.
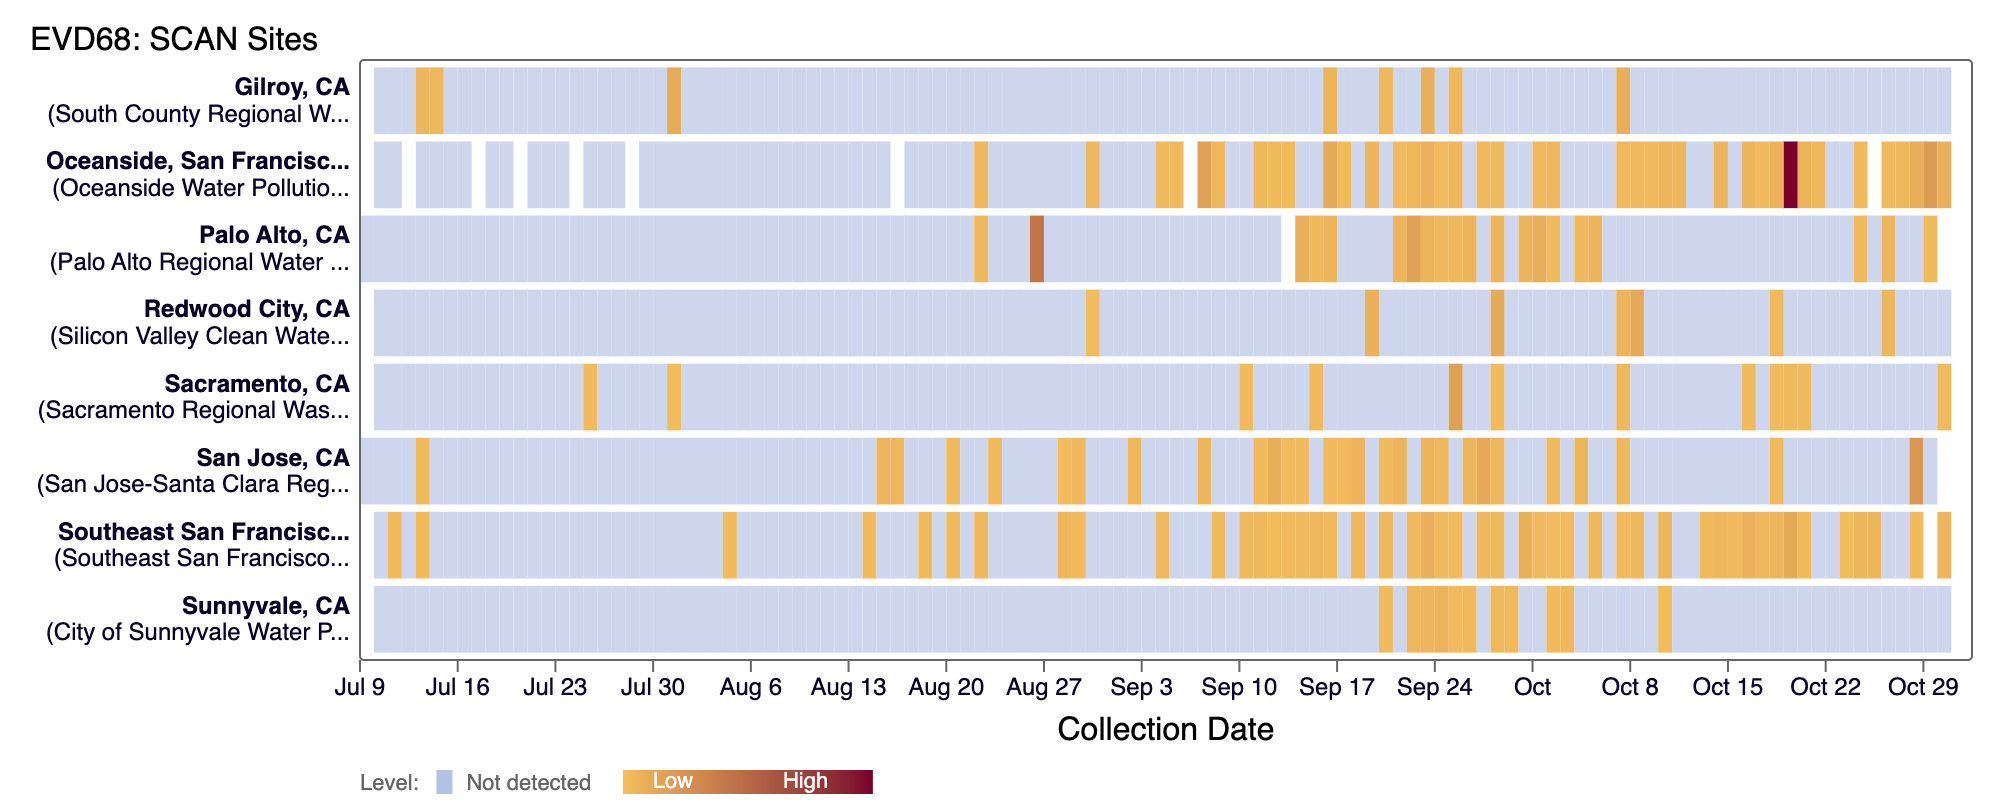
EV-D68 RNA was sporadically detected in samples collected in the last 21 days at most SCAN sites. However, at Oceanside SF and Southeast SF, EV-D68 was detected in most samples collected in the last 21 days. The heat map below shows all the SCAN sites as a row, and each date as a column since monitoring began in July. The color blue means the sample was non-detect for EV-D68 RNA and the colors get darker with higher concentrations. White indicates no sample was collected. You can access the chart here. EV-D68 is believed to occur biennially, and we saw it last year, so perhaps it will not be common this year.
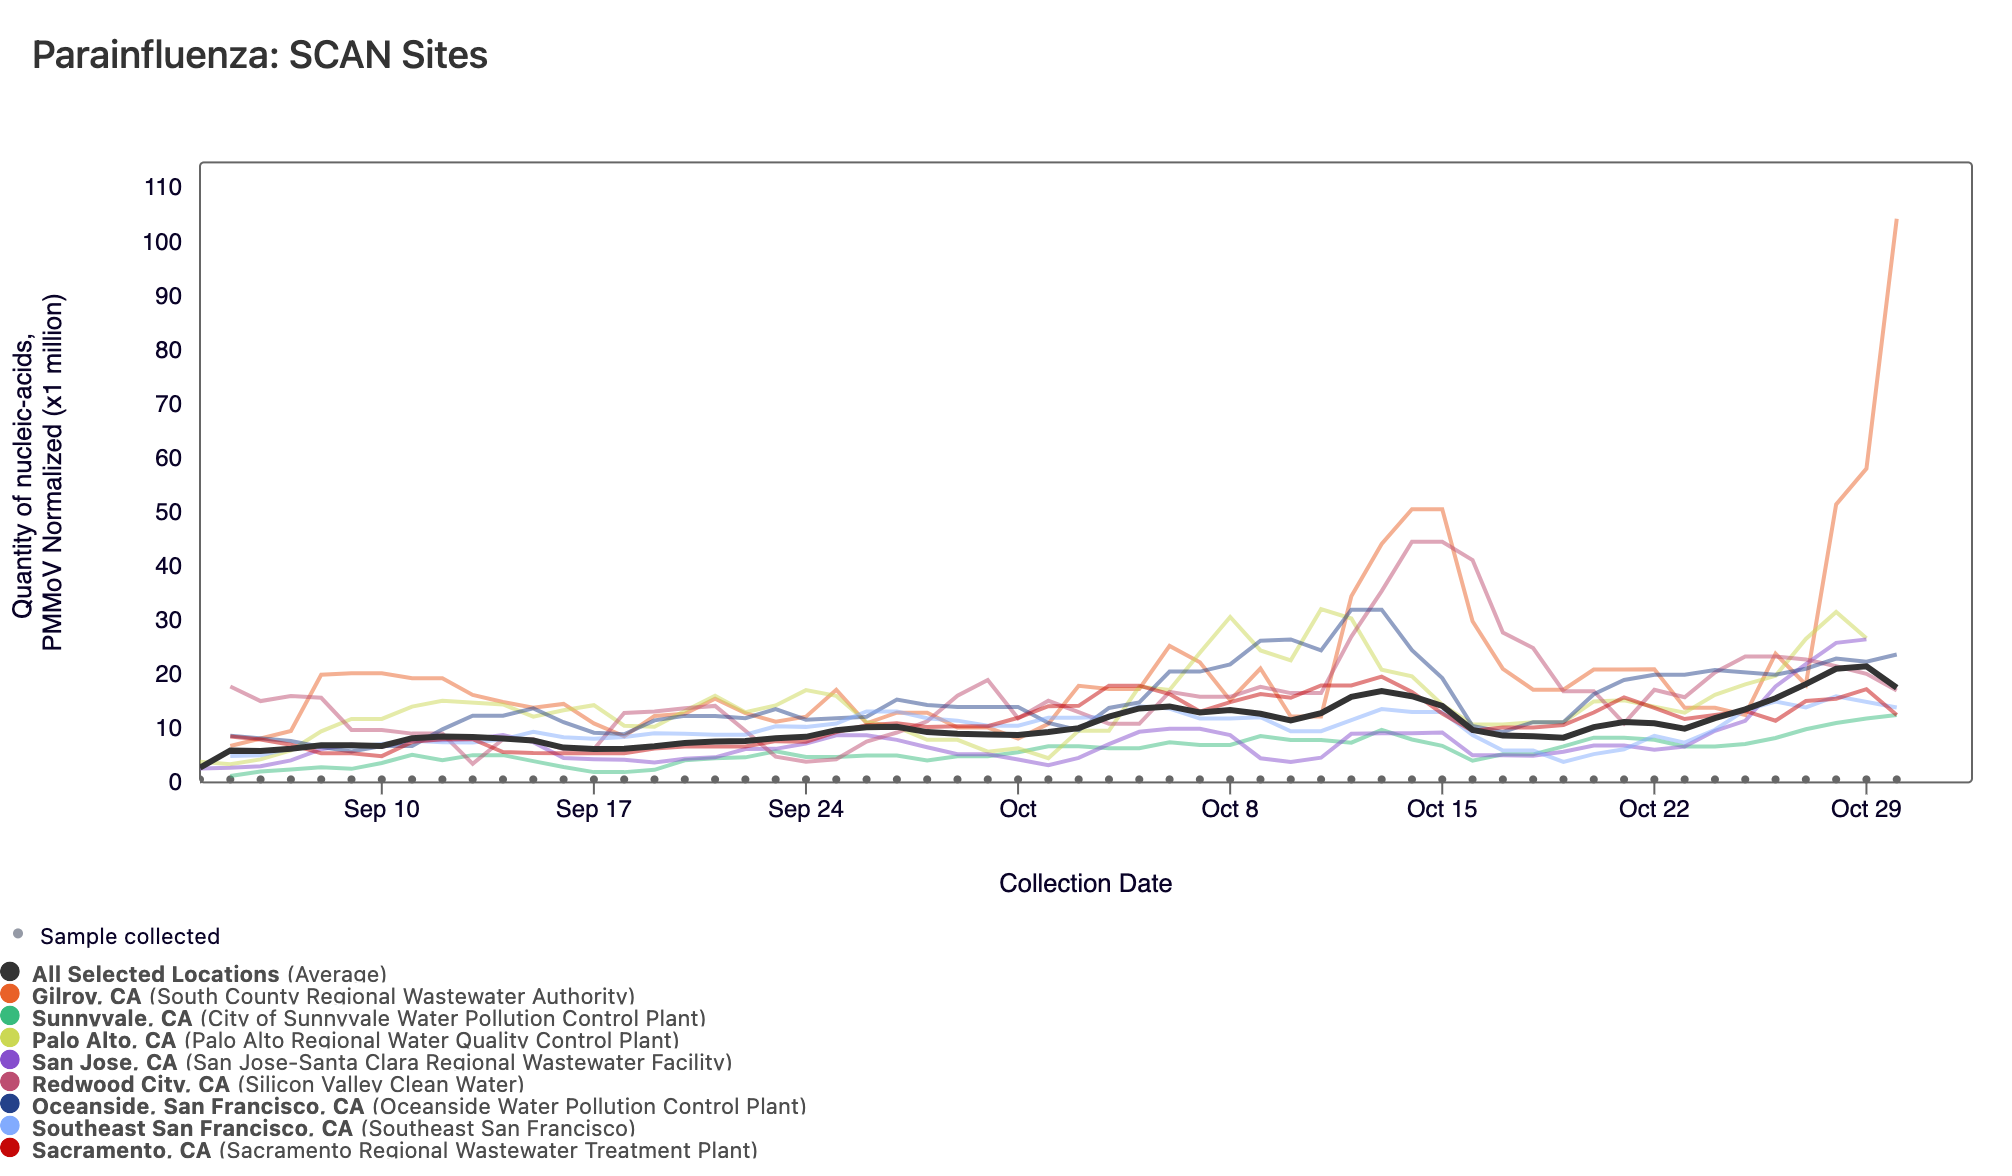
Parainfluenza RNA has been detected in most samples collected from SCAN sites. The population weighted average line is shown in black. You can access the chart here.
Gastrointestinal Targets
Norovirus GII, Rotavirus, and Human Adenovirus Group F
Norovirus GII RNA concentrations are commonly detected at all sites. In the chart below, the population weighted average line across all the SCAN plants for all SCAN plants (black) is shown compared to the Norovirus GII RNA concentrations at Oceanside SF (green) since May.
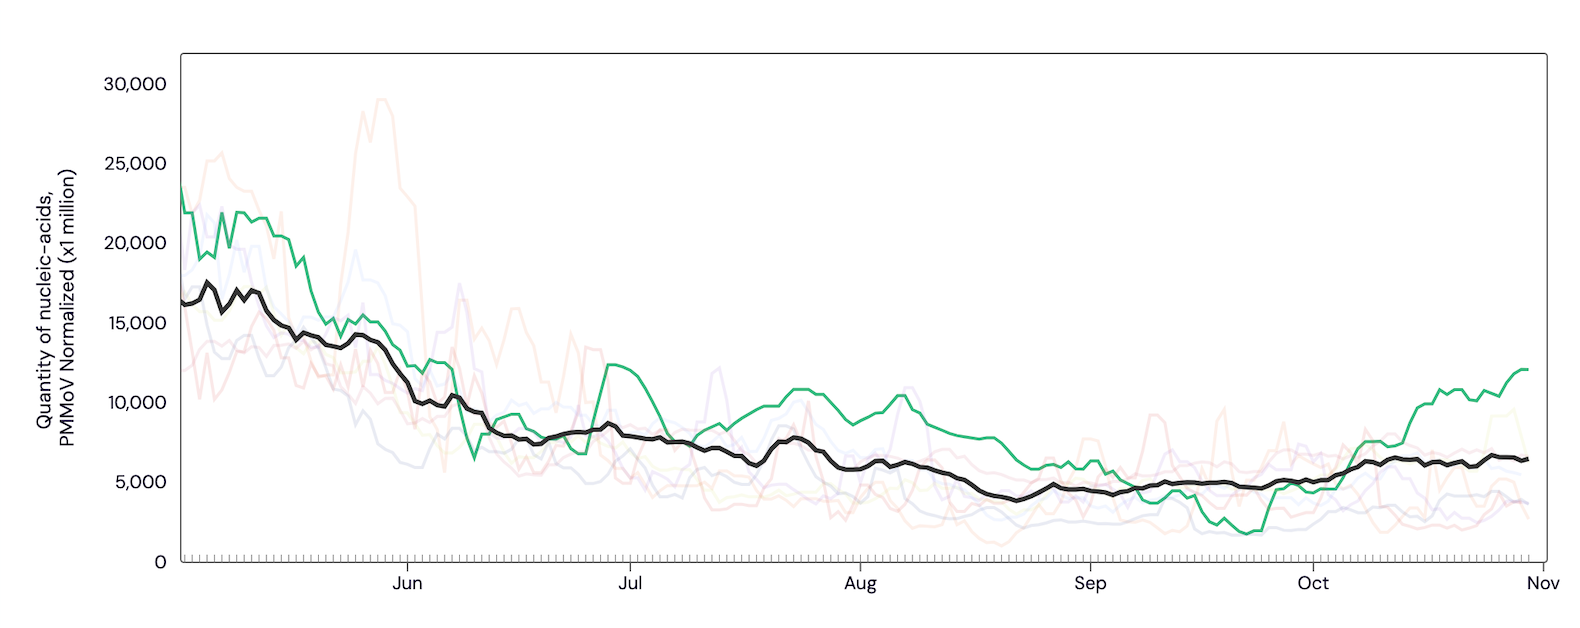
Below are the current Norovirus wastewater categories for the SCAN sites:
SVCW, Gilroy, Palo Alto, San Jose, Southeast SF, Sacramento, and Sunnyvale are in the LOW Wastewater Category Oceanside SF is in the HIGH Wastewater Category
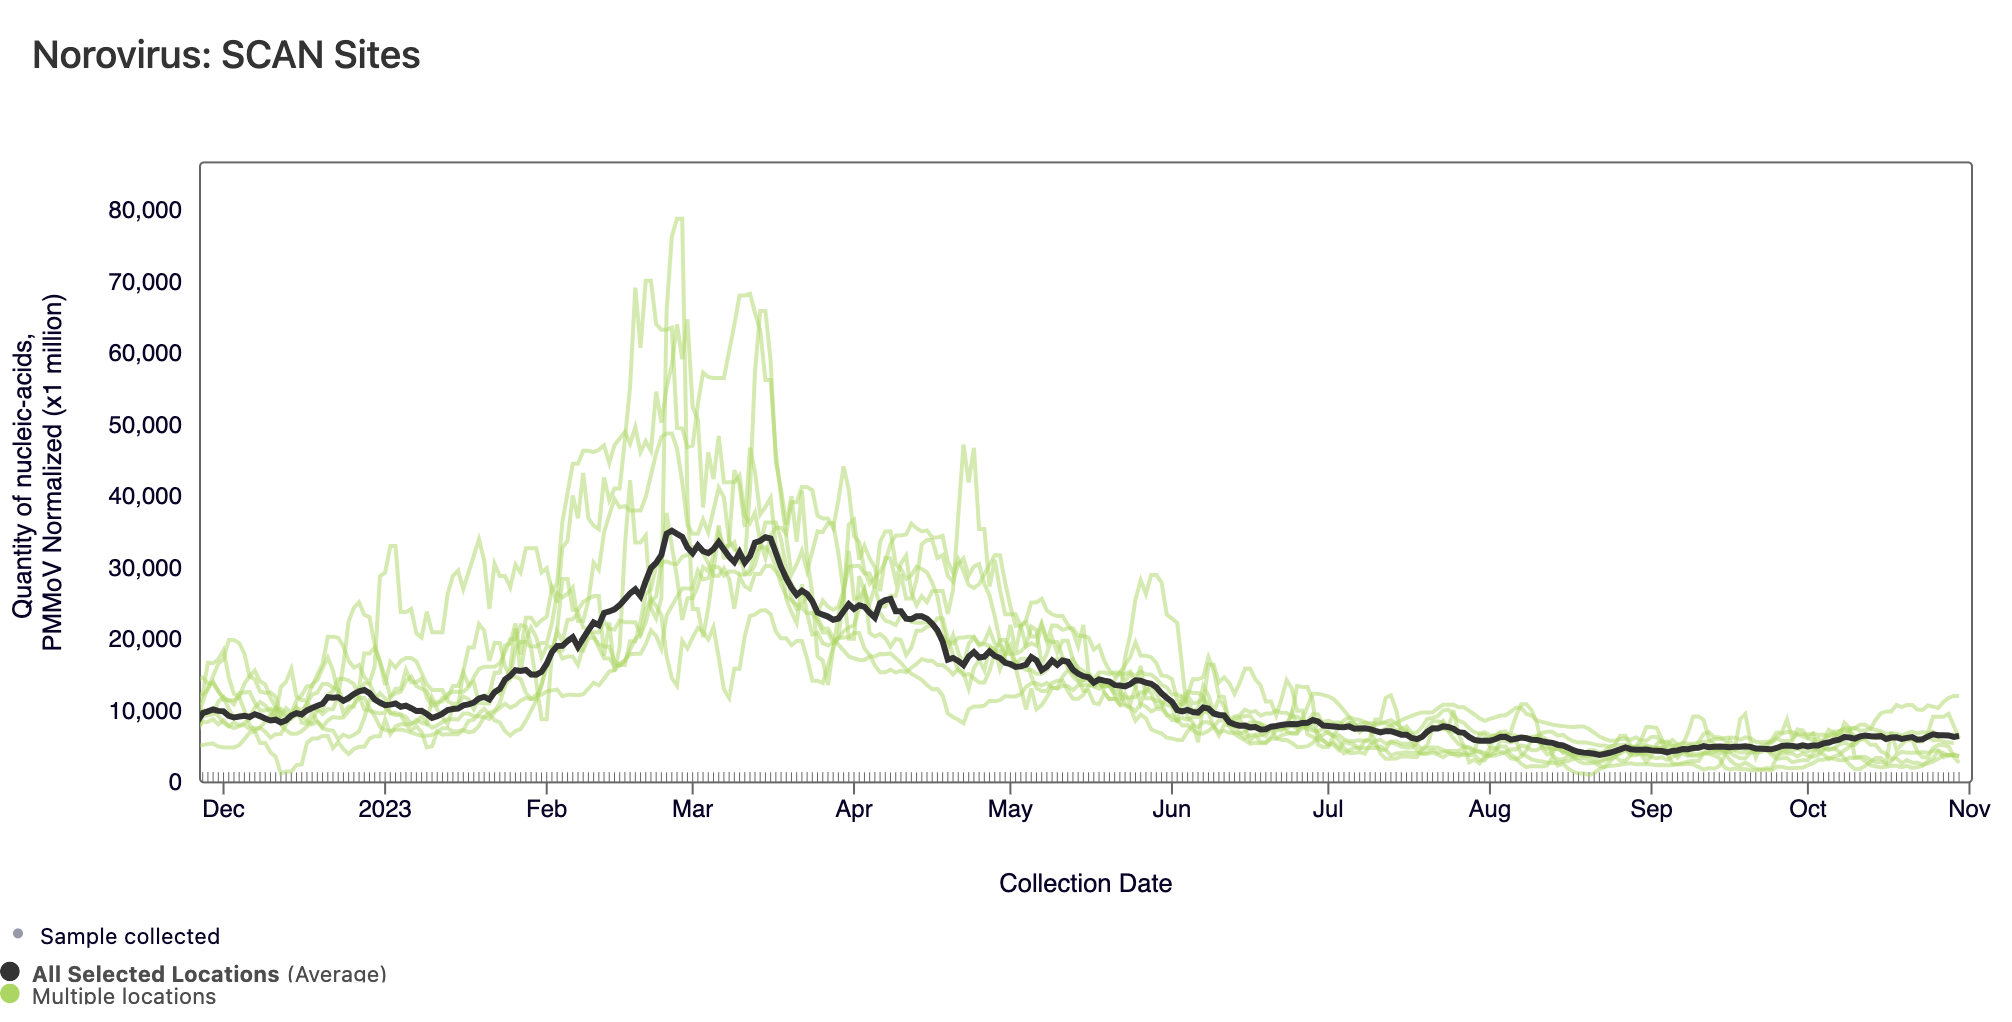
The plot below shows the Norovirus concentrations since last February at the SCAN sites. The population weighted average line is shown in black. You can interact with the chart of all the plants at this link.
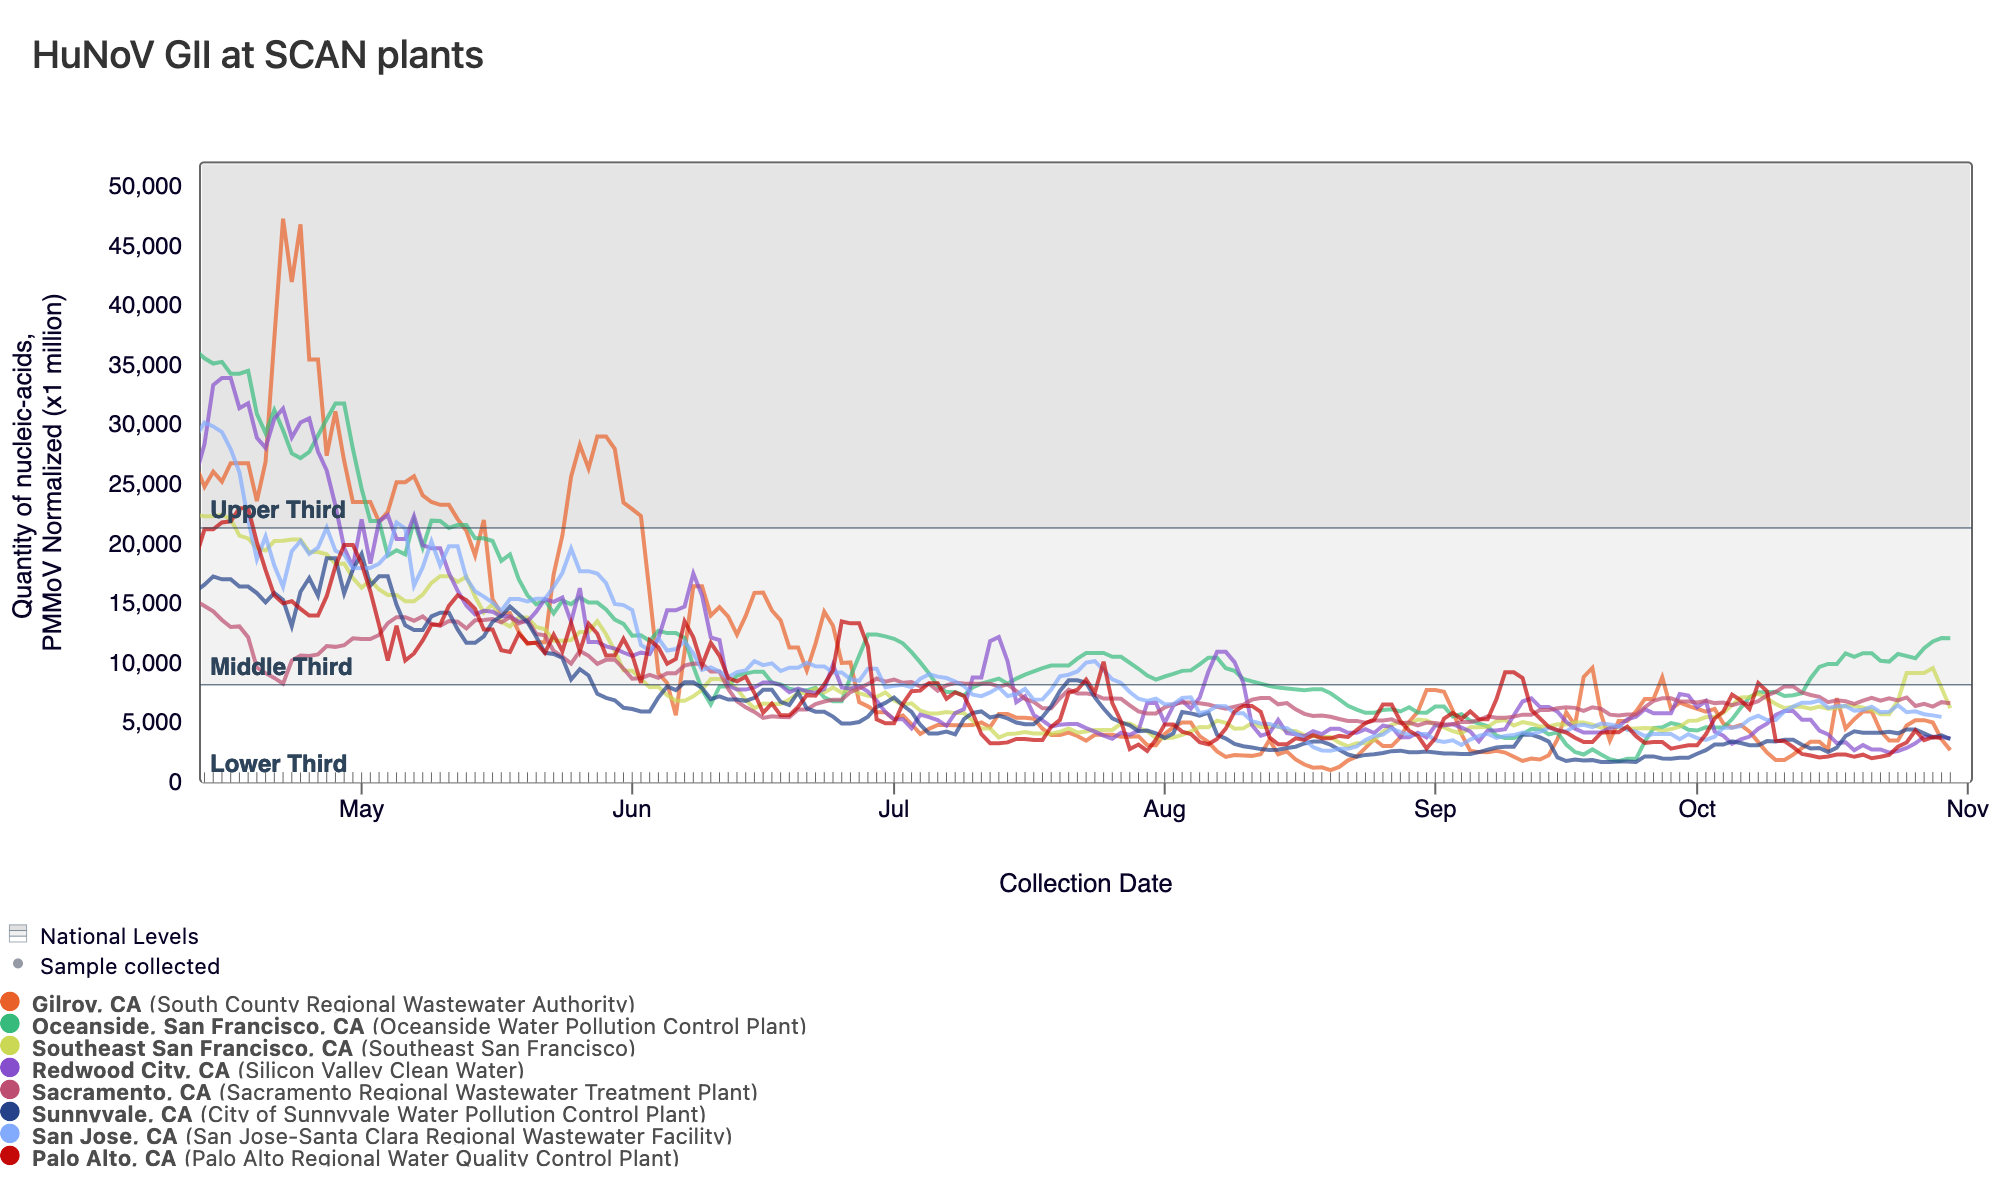
Below is a chart showing the National Levels benchmarks superimposed on the Norovirus concentrations from the SCAN sites since the beginning of 2023. (You can access the chart here.) Currently all SCAN sites HuNoV GII concentrations in the lower third level except for Oceanside SF which is in the middle third.
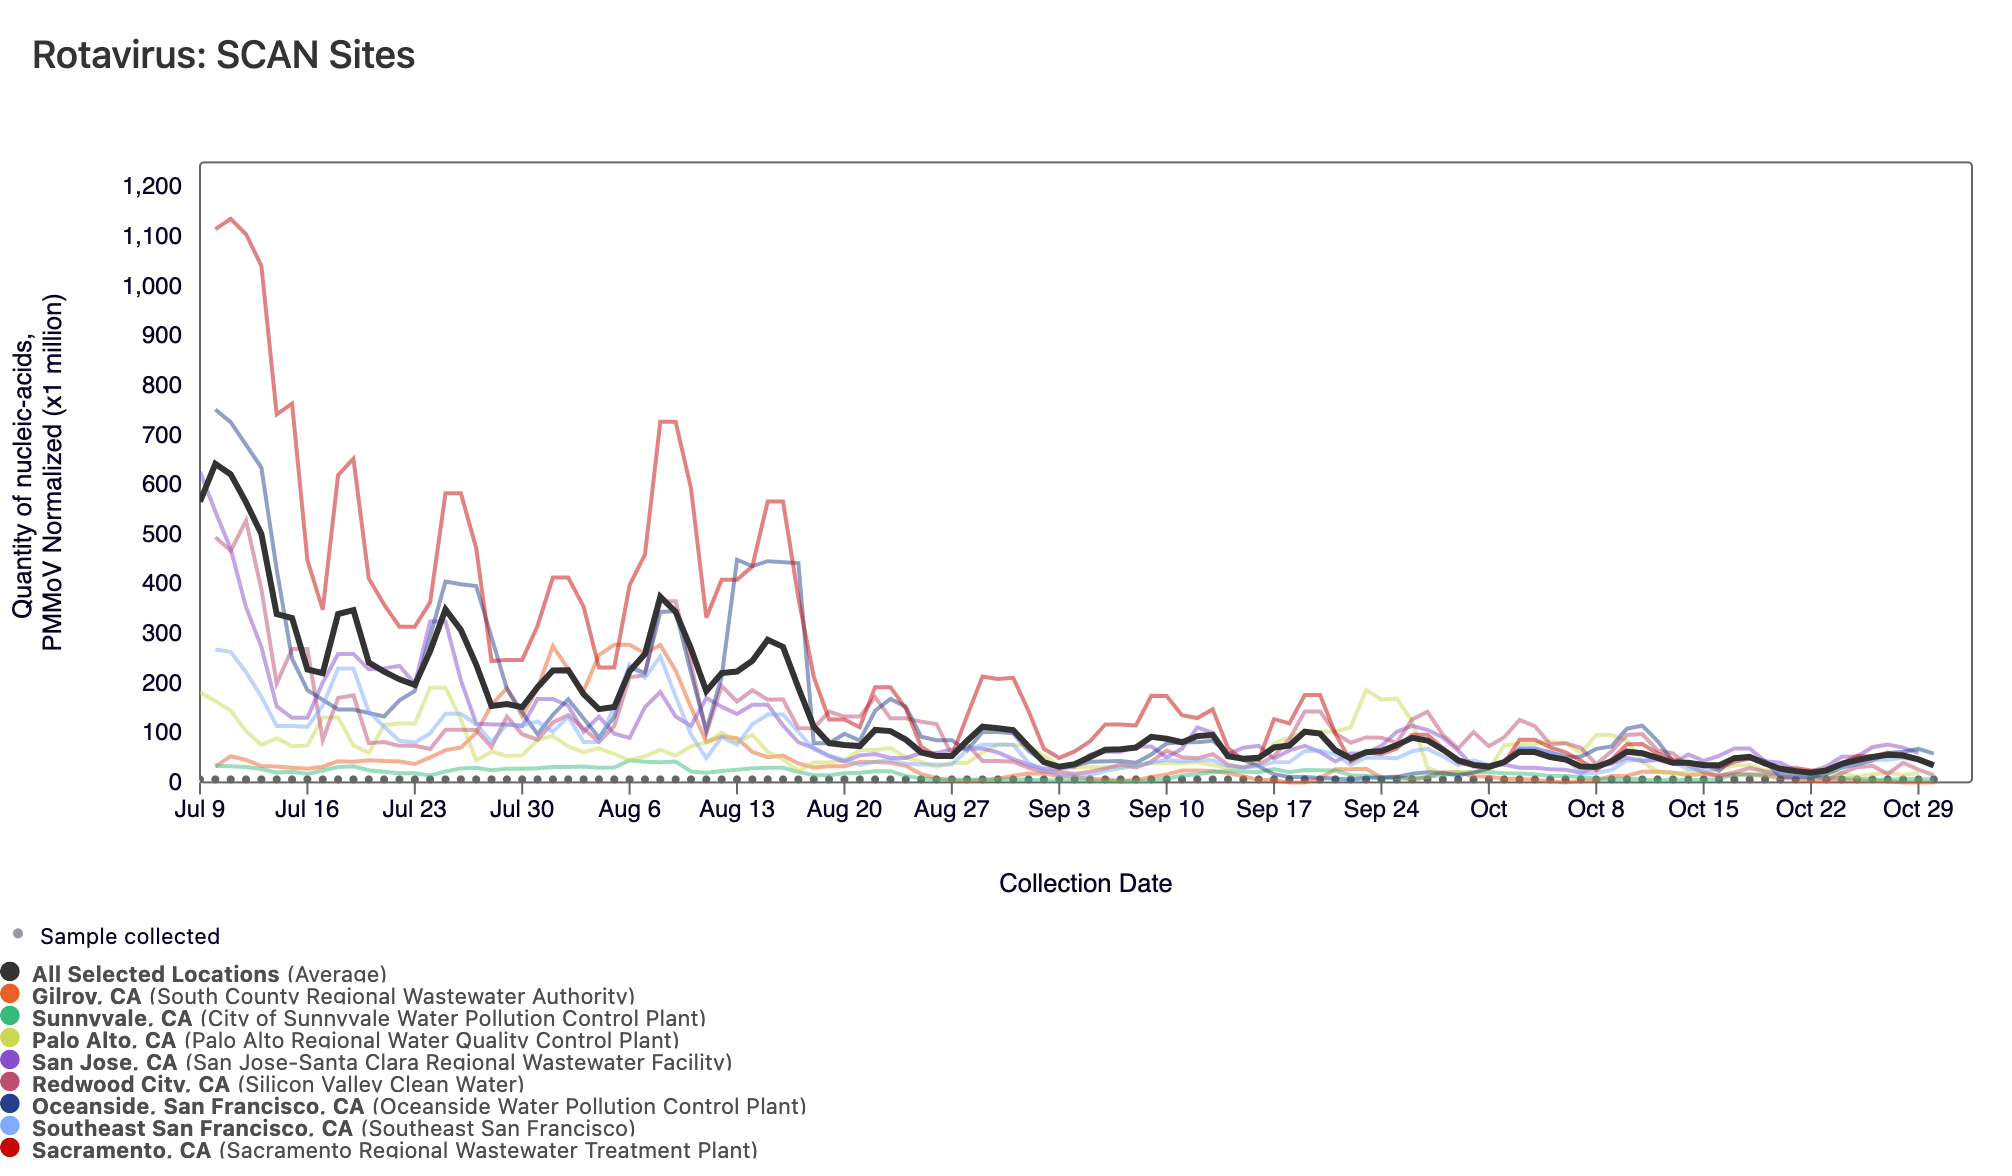
Rotavirus RNA concentrations are shown in the chart below; all the SCAN plants are shown together. The population weighted average line is shown in black. You can interact with the chart of all the plants here.
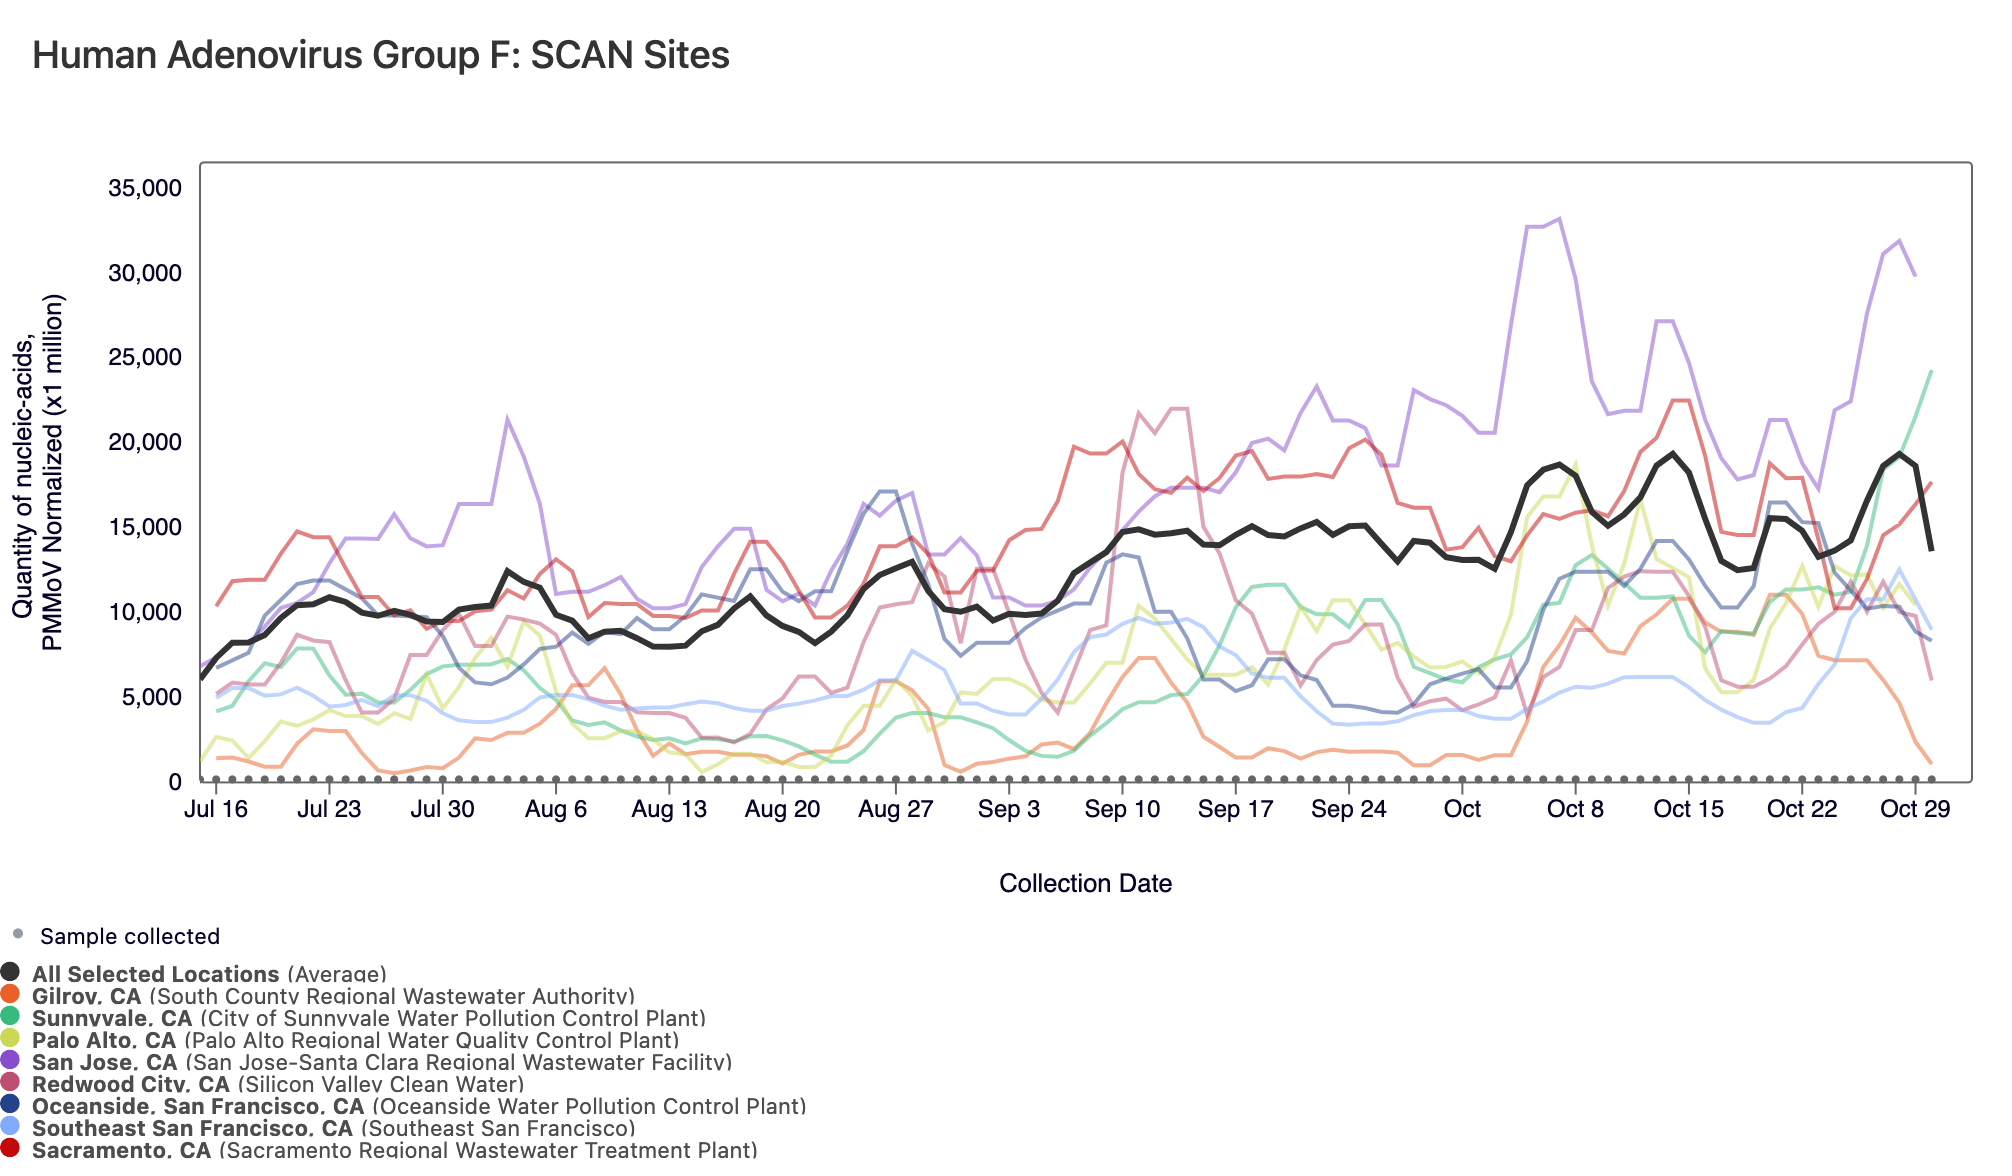
Human Adenovirus Group F DNA concentrations are shown in the chart below; all the SCAN plants are shown together. The population weighted average line is shown in black. You can interact with the chart of all the plants here.
Other Pathogens of Concern
Mpox, Candida auris, and Hepatitis A
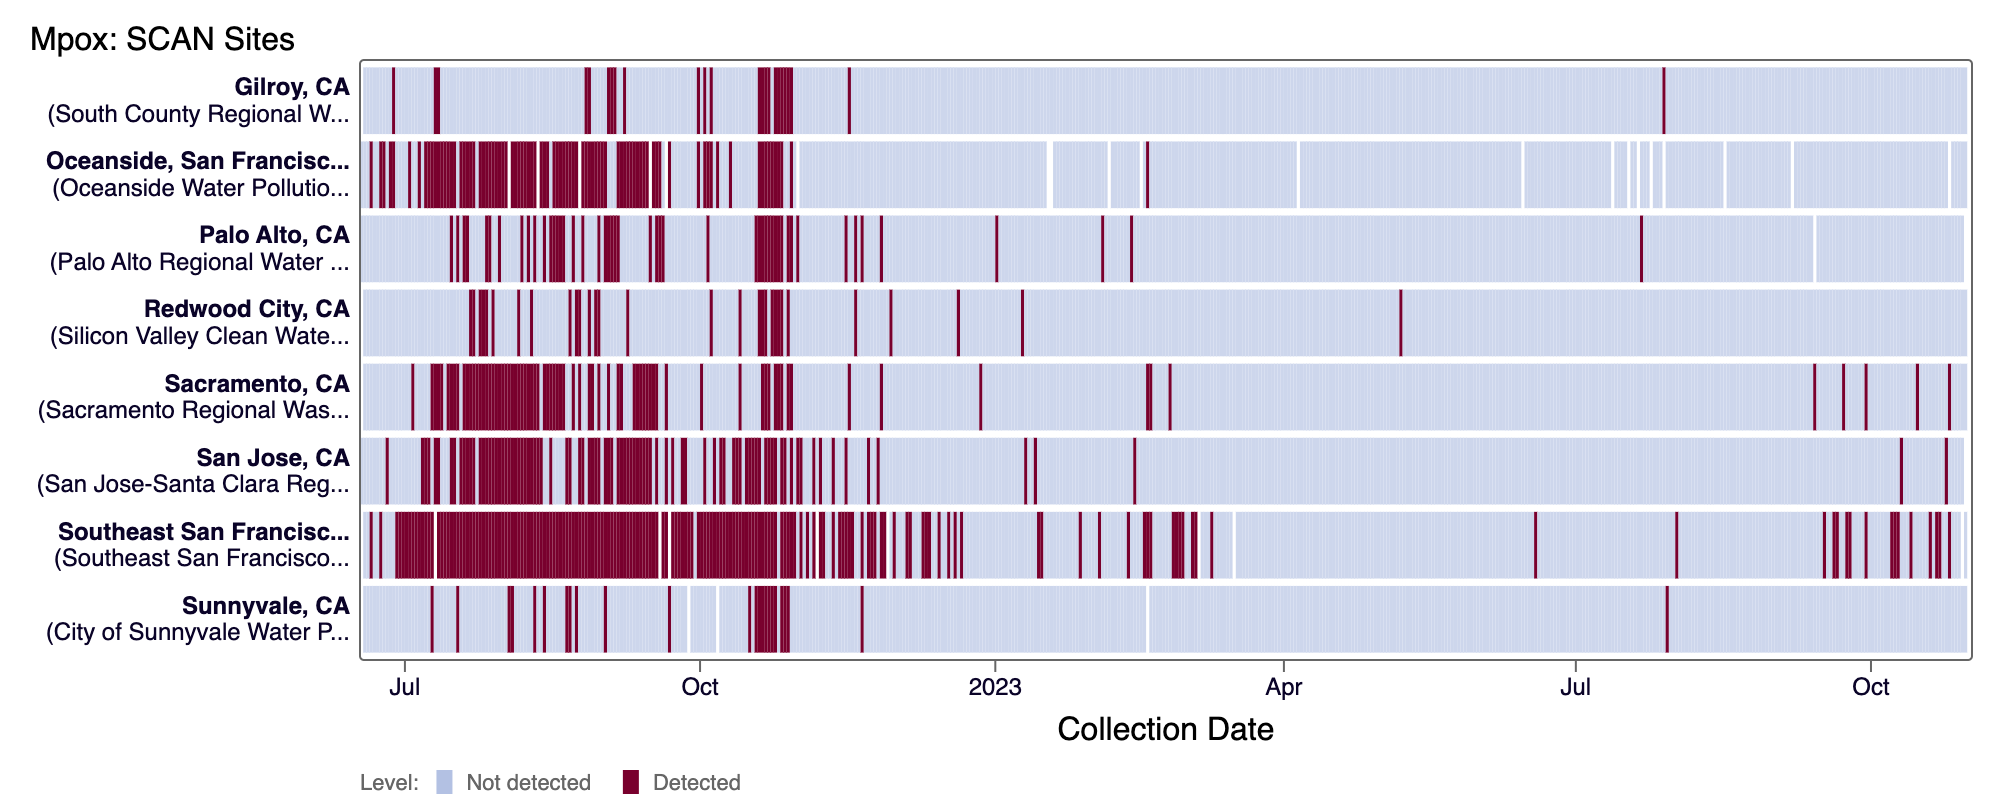
Mpox DNA was was not detected in most samples collected in the last 21 days at most SCAN sites. However, at Southeast SF Mpox DNA was detected sporadically in the last 21 days. The heat map below shows all the SCAN sites as a row, and each date as a column since July 2022. The color blue means that MPXV DNA was not detected in the sample, and the dark purple color means it was detected. White indicates no sample was collected. The chart shows all the data we have collected. You can access the chart here.
Currently all SCAN sites are in the 'LOW' category for Mpox
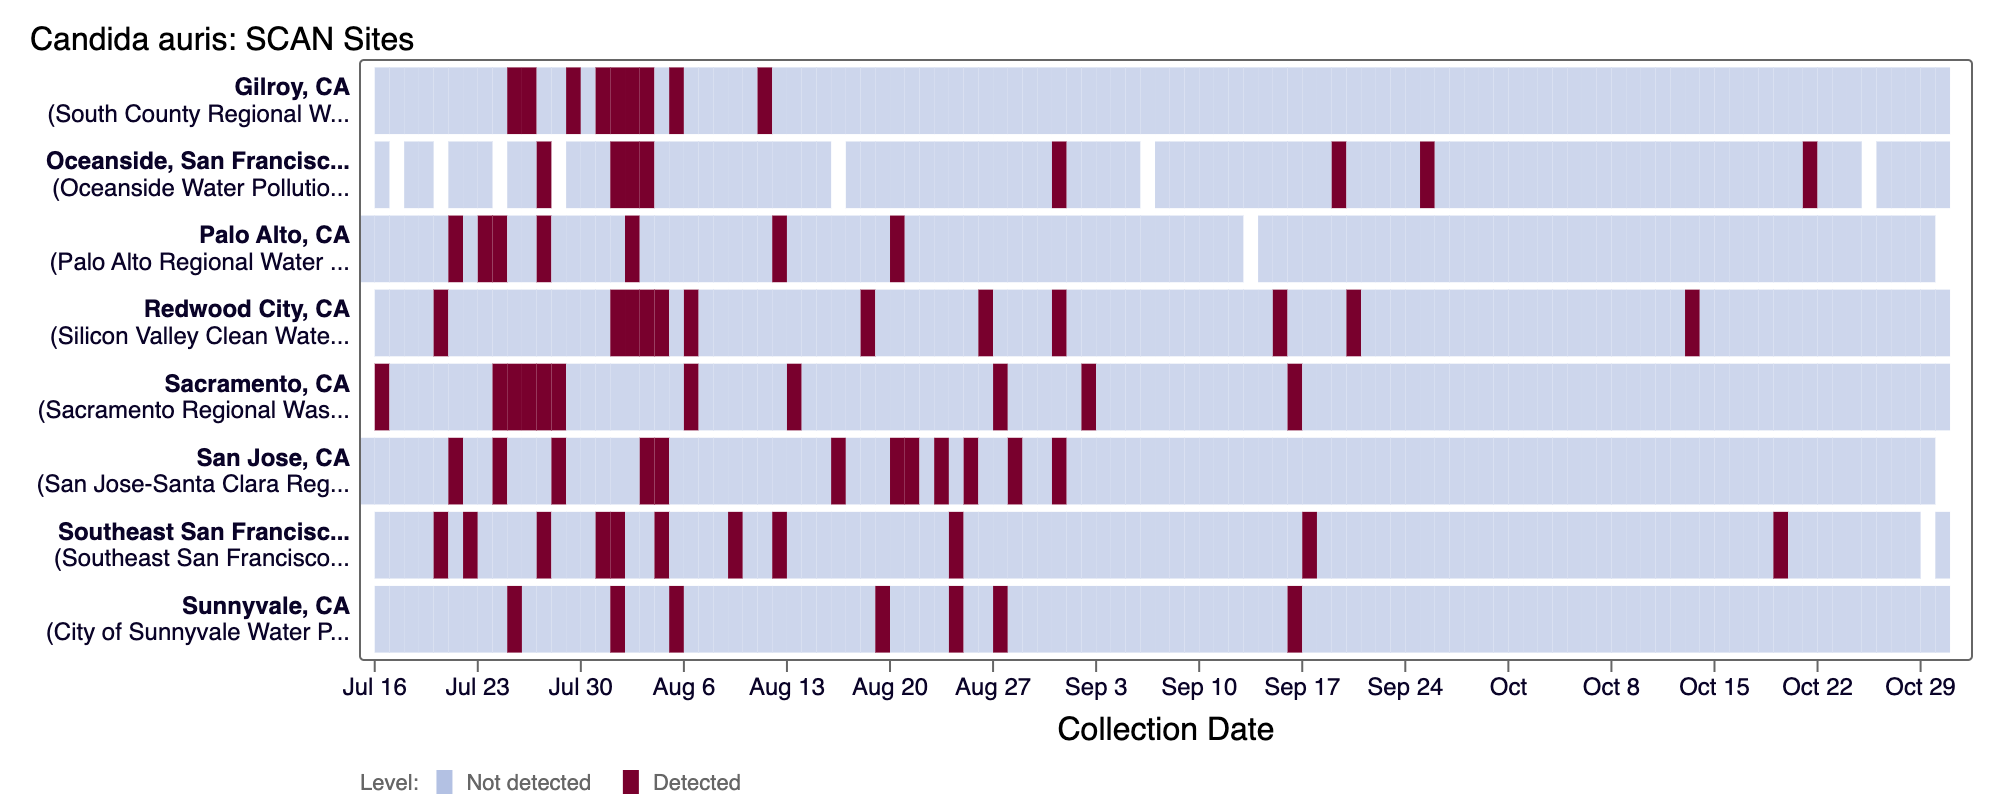
Candida auris DNA was not detected in most samples collected in the last 21 days at SCAN sites. The heat map below shows all the SCAN sites as a row, and each date as a column for all data collected since monitoring began in July. The color blue means that Candida auris DNA was not detected in the sample, and the dark purple color means it was detected. White indicates no sample was collected. You can access the chart here.
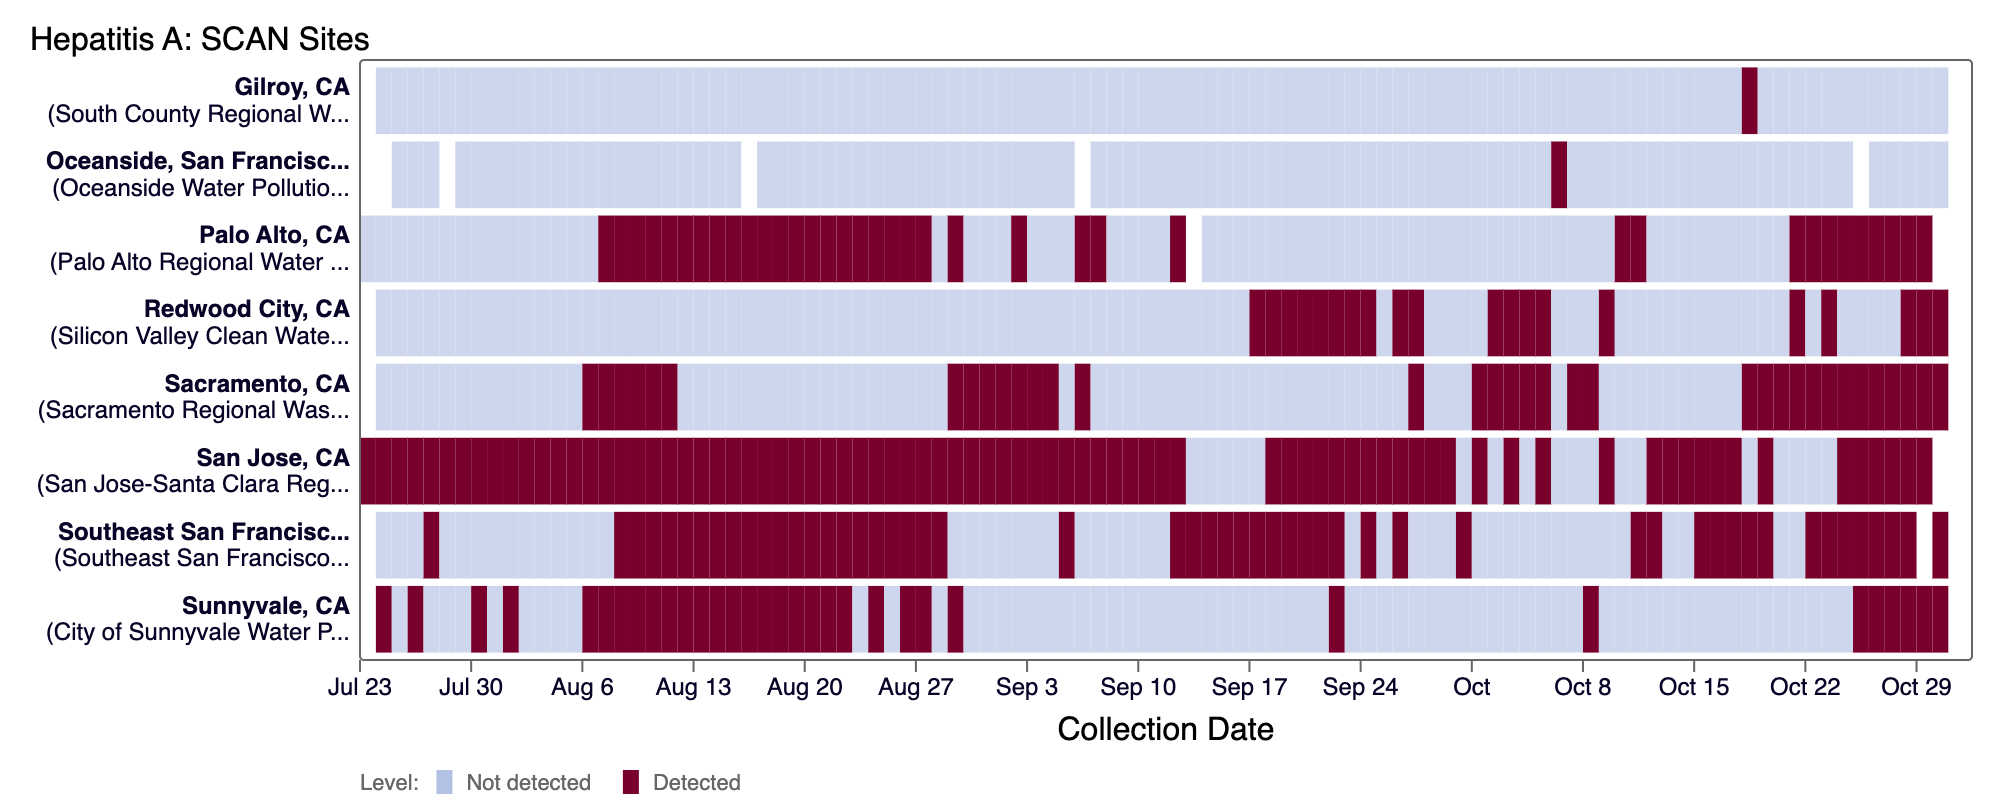
Hepatitis A RNA was detected in most samples from Sacramento, San Jose, and Southeast SF; detected sporadically at Palo Alto, Redwood City, and Sunnyvale; and detected infrequently at Oceanside SF and Gilroy in the last 21 days. The heat map below shows all the SCAN sites as a row, and each date as a column for all data collected since monitoring began in July. The color blue means that Hepatitis A RNA was not detected in the sample, and the dark purple color means it was detected. White indicates no sample was collected. You can access the chart here.