SCAN Weekly Update 9/7/23
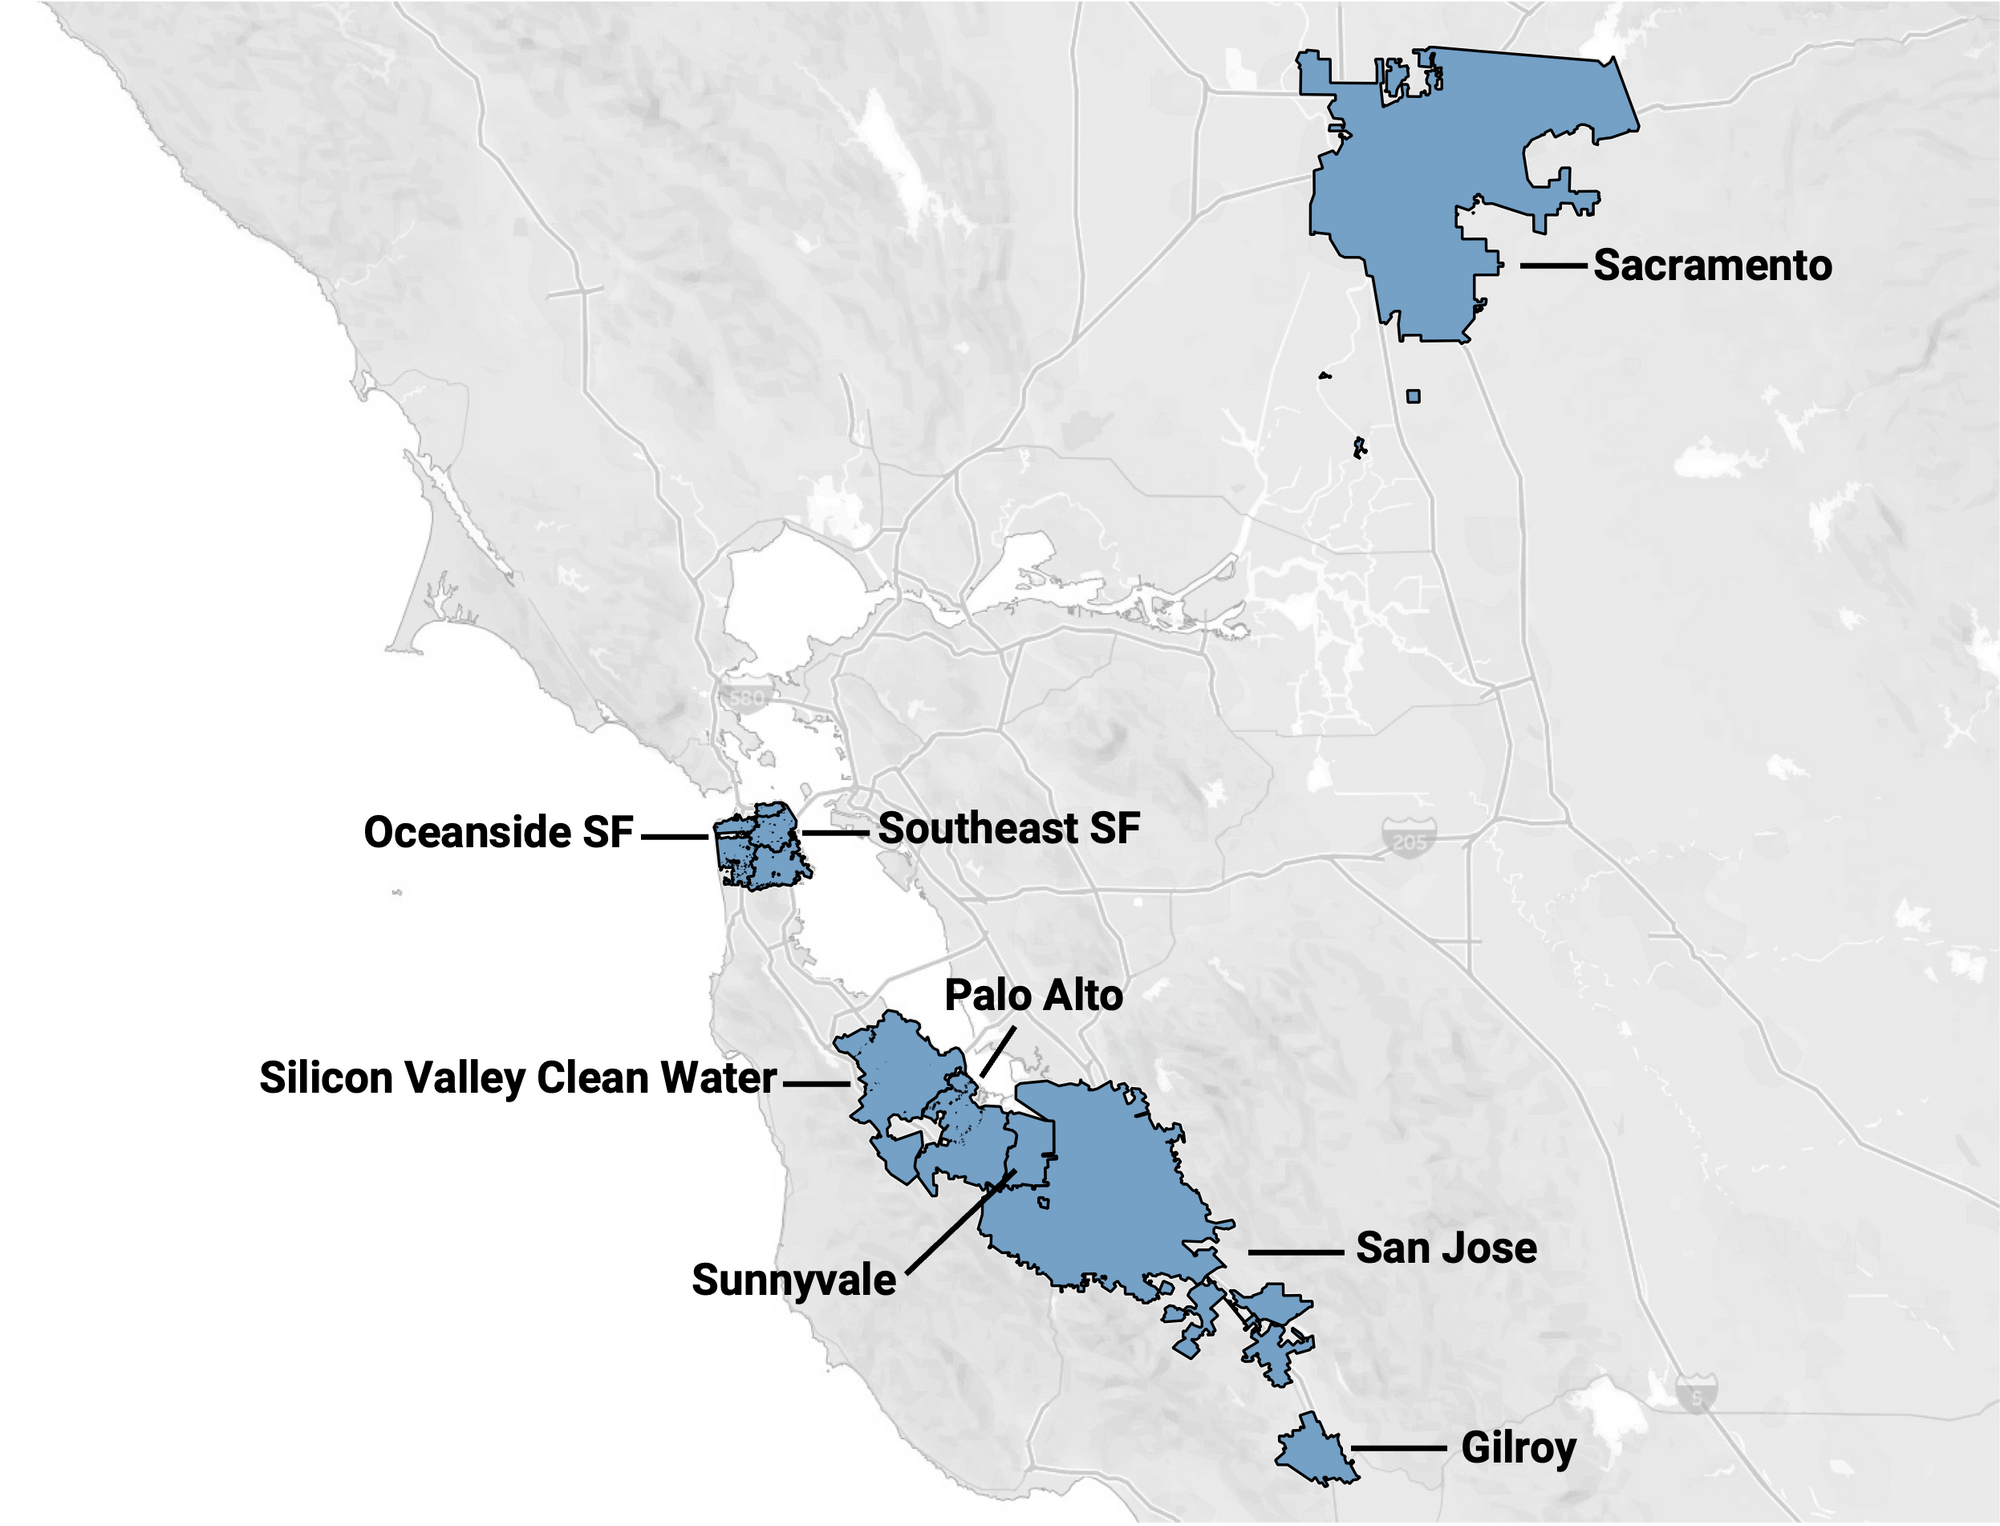
This blog post describes data collected at 8 wastewater treatment plants in the Greater Bay Area of San Francisco, CA, including Sacramento, that are partners in the SCAN project which began in late 2020.
There are three recent papers related to this work that you might be interested in:
L. Roldan-Hernandez and A. B. Boehm. 2023. Adsorption of Respiratory Syncytial Virus, Rhinovirus, SARS-CoV-2, and F+ Bacteriophage MS2 RNA onto Wastewater Solids from Raw Wastewater. Environmental Science & Technology. Link.
A. B. Boehm, M. K. Wolfe, B. J. White, B. Hughes, D. Duong, A. Bidwell. 2023. More than a Tripledemic: Influenza A Virus, Respiratory Syncytial Virus, SARS-CoV-2, and Human Metapneumovirus in Wastewater during Winter 2022 - 2023. Environmental Science & Technology Letters, 10, 8, 622-627. Link.
A. B. Boehm, M. K. Wolfe, B. J. White, B. Hughes, D. Duong, N. Banaei, A. Bidwell. Human norovirus (HuNoV) GII RNA in wastewater solids at 145 United States wastewater treatment plants: Comparison to positivity rates of clinical specimens and modeled estimates of HuNoV GII shedders. Journal of Exposure Science and Environmental Epidemiology. Link.
All samples picked up by the couriers as of 9/5/23 have been processed and their data are on the site: data.wastewaterscan.org. Please email Amanda Bidwell at albidwel@stanford.edu if you identify any bugs on the site.
Please note that we sunset measurement of influenza B virus (IBV) to make room for new targets including enterovirus D68, rotavirus, human adenovirus group F, C. auris, hepatitis A, and parainfluenza. The results of those will be shared on this page in a couple weeks.
COVID-19
SARS-CoV-2 and Variants
SARS-CoV-2 N gene concentrations are between 10,000 and 100,000 copies/g. Below is a chart from all the SCAN plants that highlights the centered, 5-d trimmed average values at Oceanside (green) compared to the population weighted average across the SCAN plants (black).
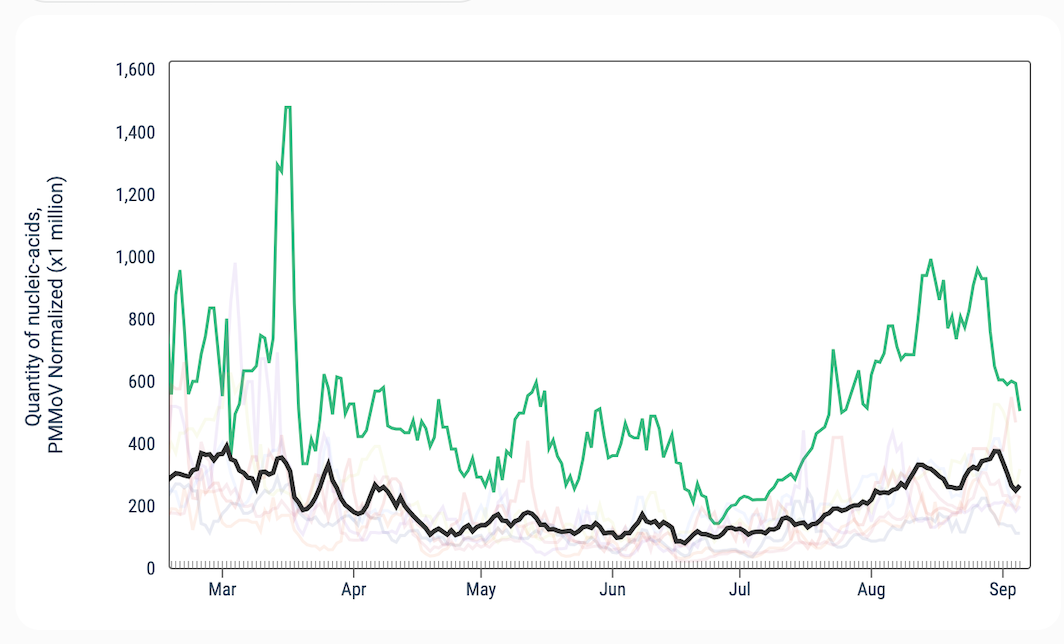
We ran a 3-week look period trend analysis on the plants for the N gene target using methods outlined in this peer-reviewed paper by our team (link to paper). The 3-week look period trend analysis on SARS-CoV-2 at these plants indicates a significant downward trend at Oceanside and no trend at all other individual SCAN plants.
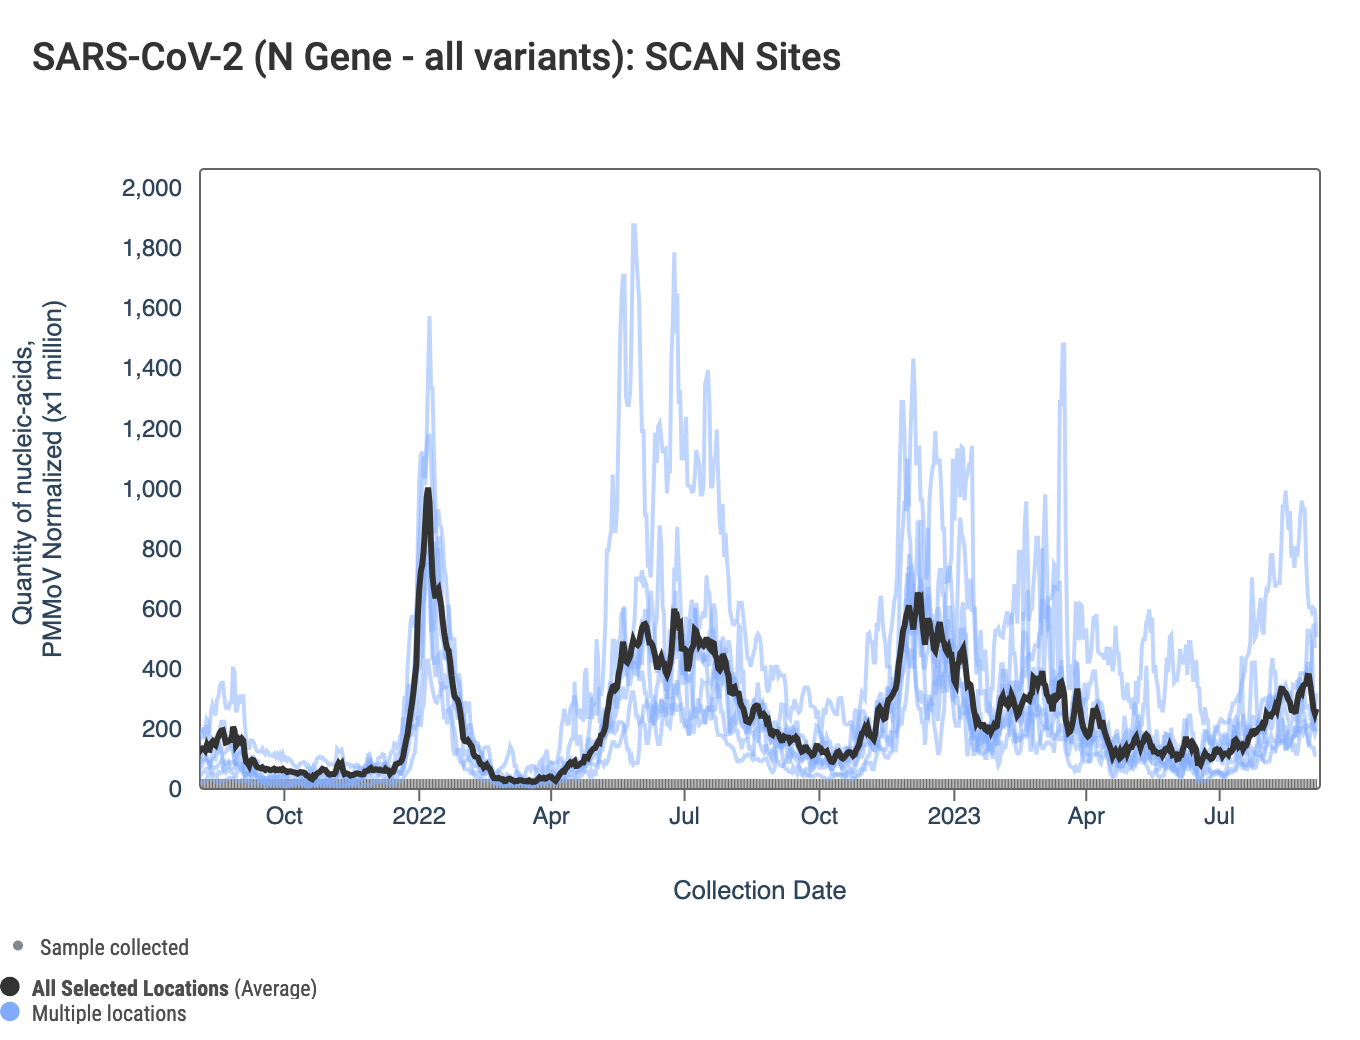
Here are all the data from all the SCAN plants for the last two years. You can access the graph here. The population weighted average across the SCAN plants is shown in black. Oceanside has the highest concentrations represented by the line above the rest.
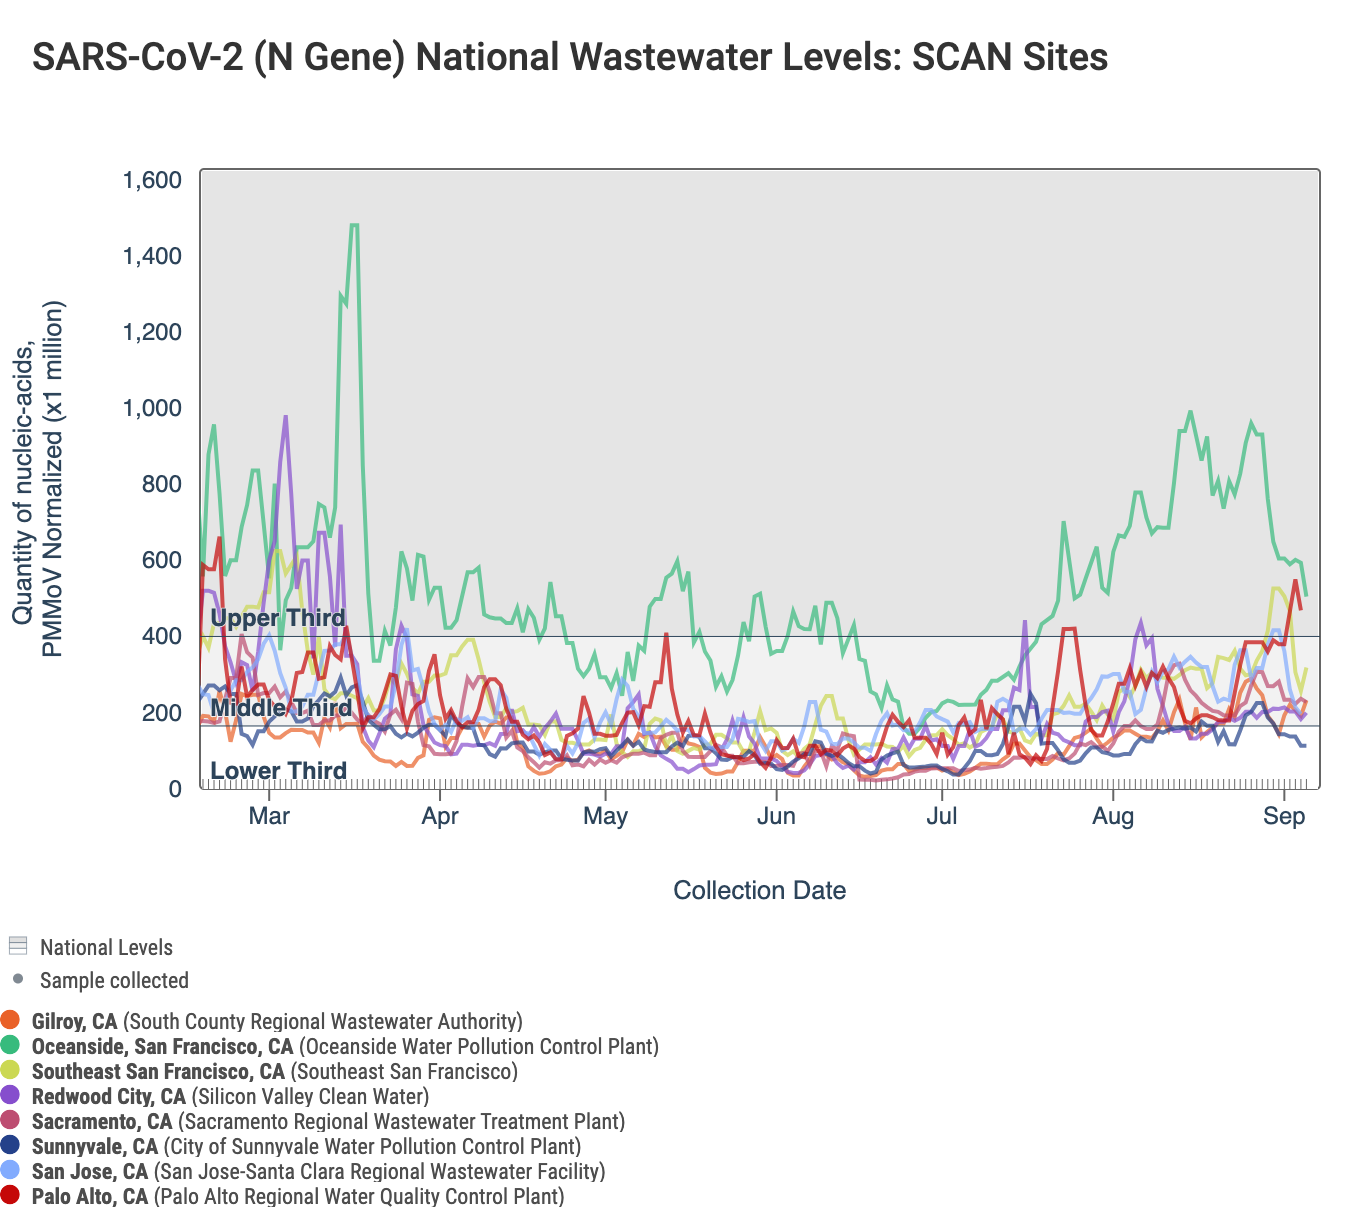
Below is a chart showing the National Levels benchmarks superimposed on the SARS-CoV-2 N gene data from the SCAN sites over the last 6 weeks. Currently SCAN sites SARS-CoV-2 N gene concentrations at Oceanside and Palo Alto are in the top third level, Sunnyvale is in the lower third level, and all other locations are in the middle third level. You can access the graph here.
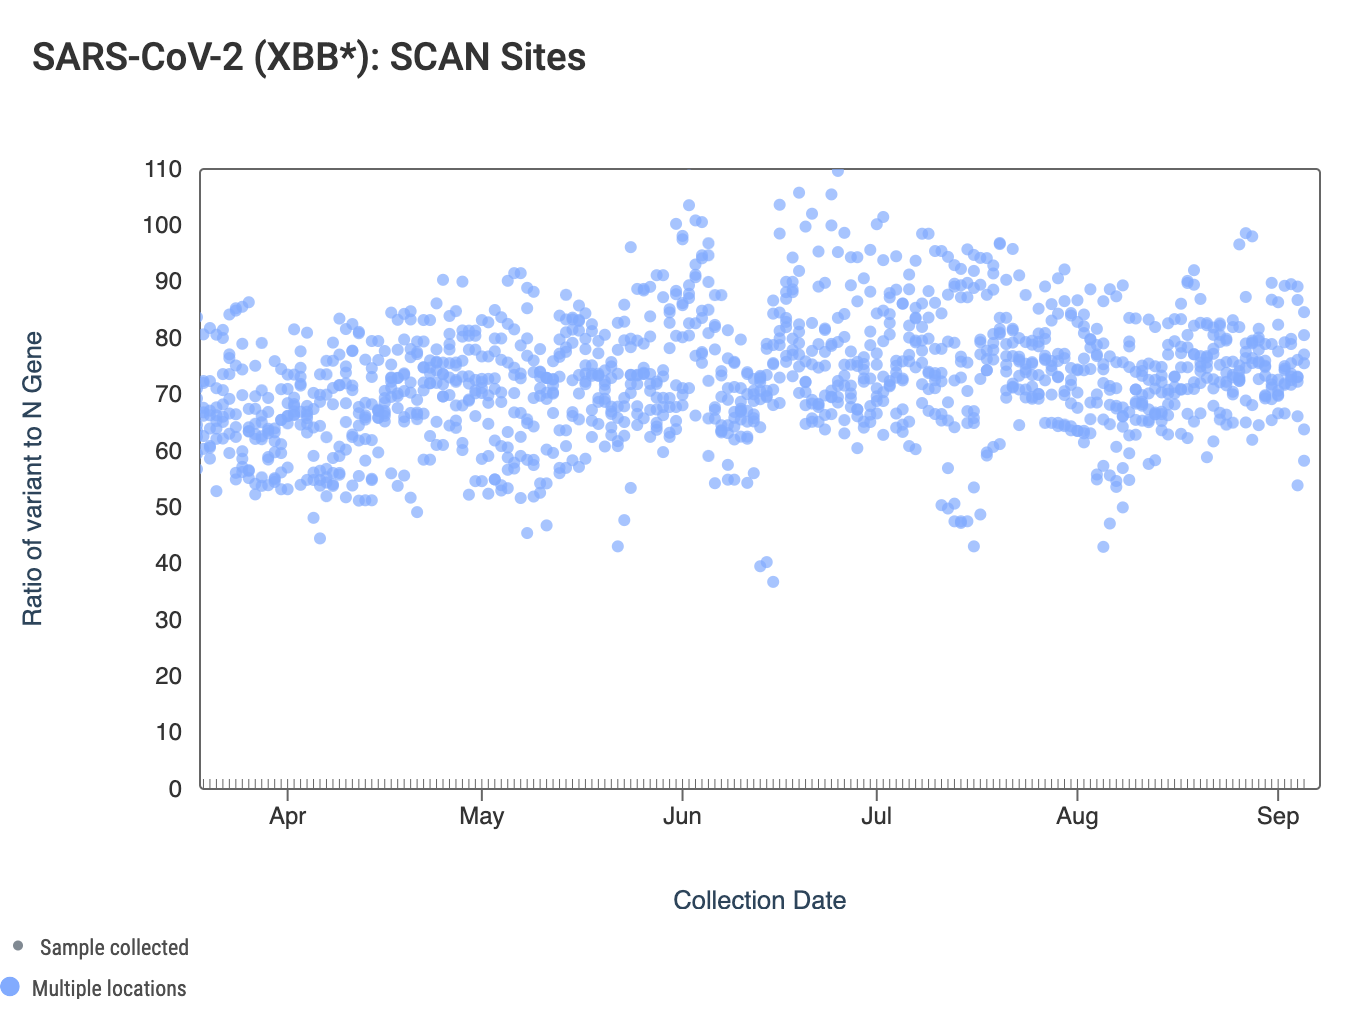
The ratio of the XBB* mutations/N across SCAN plants is shown in the chart below. This chart comes from data.wastewaterscan.org (link here to the chart). As the ratio reaches 100%, it suggests that all the SARS-CoV-2 genomes in wastewater have the XBB* mutations. These data indicate that the regional average ratio XBB* mutations/N is ~50-90%. These data suggest that the majority of infections across the SCAN communities are caused by XBB*. Note that these set of mutations are also present in EG.5 sublineage, but they are not present in BA.2.86.
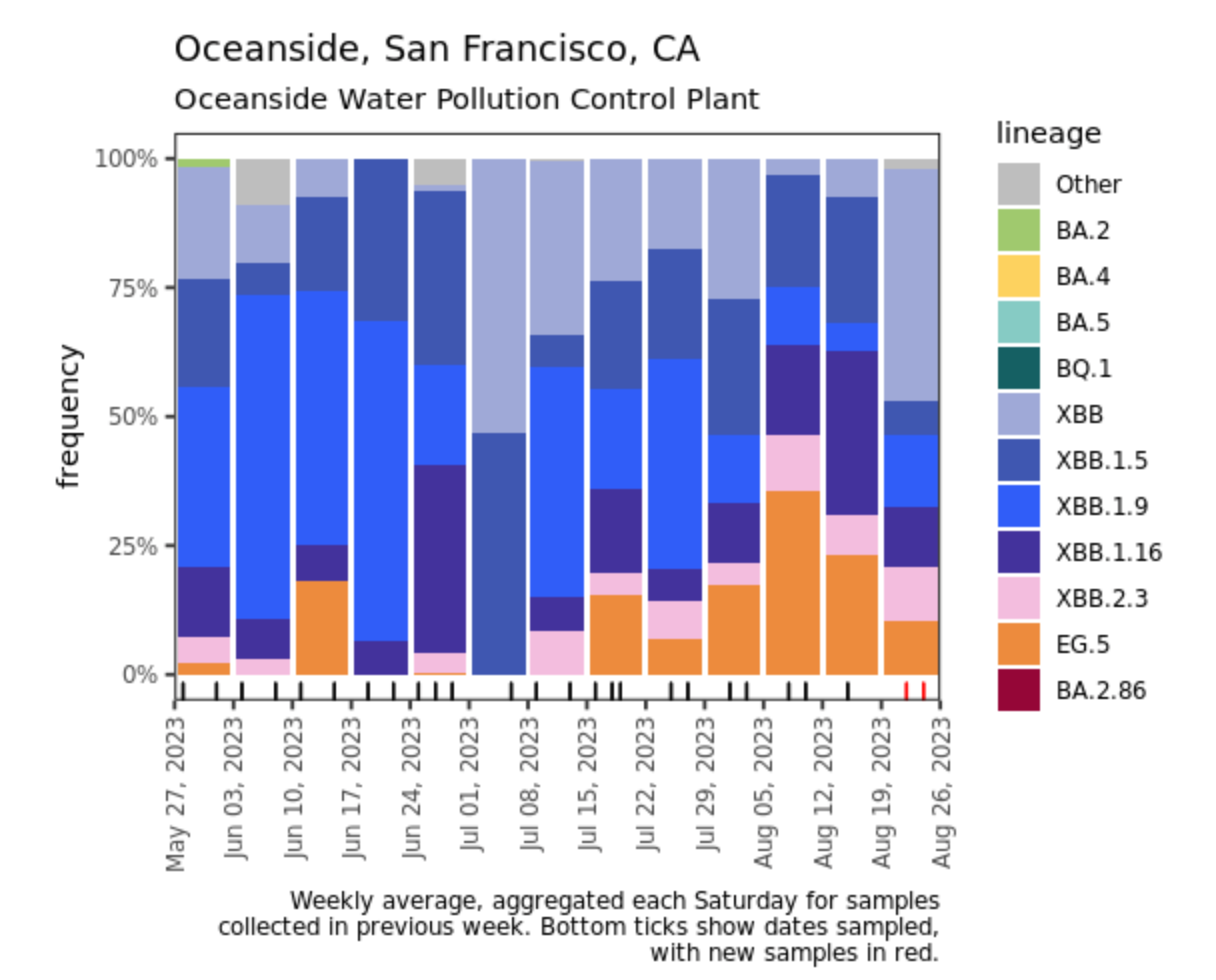
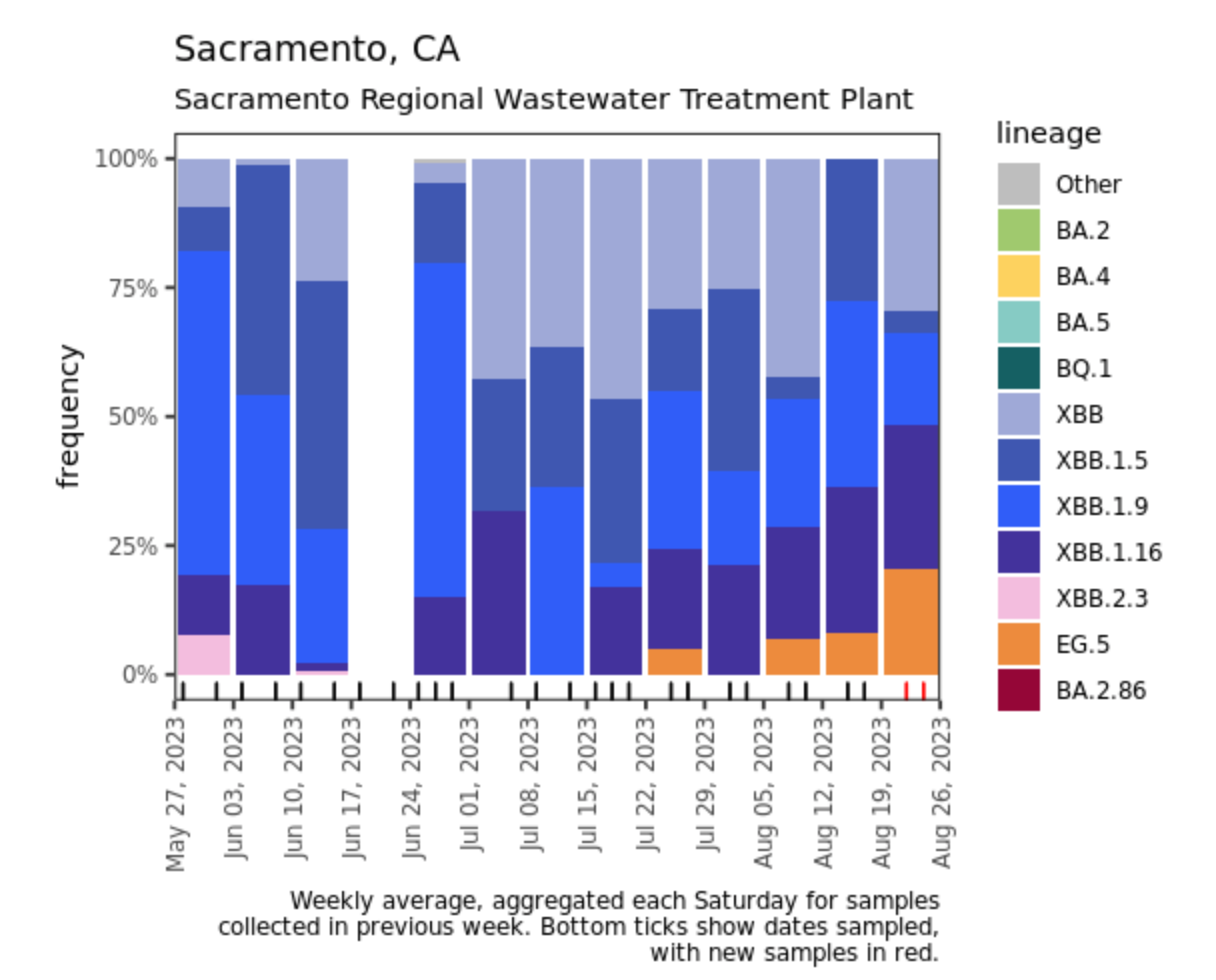
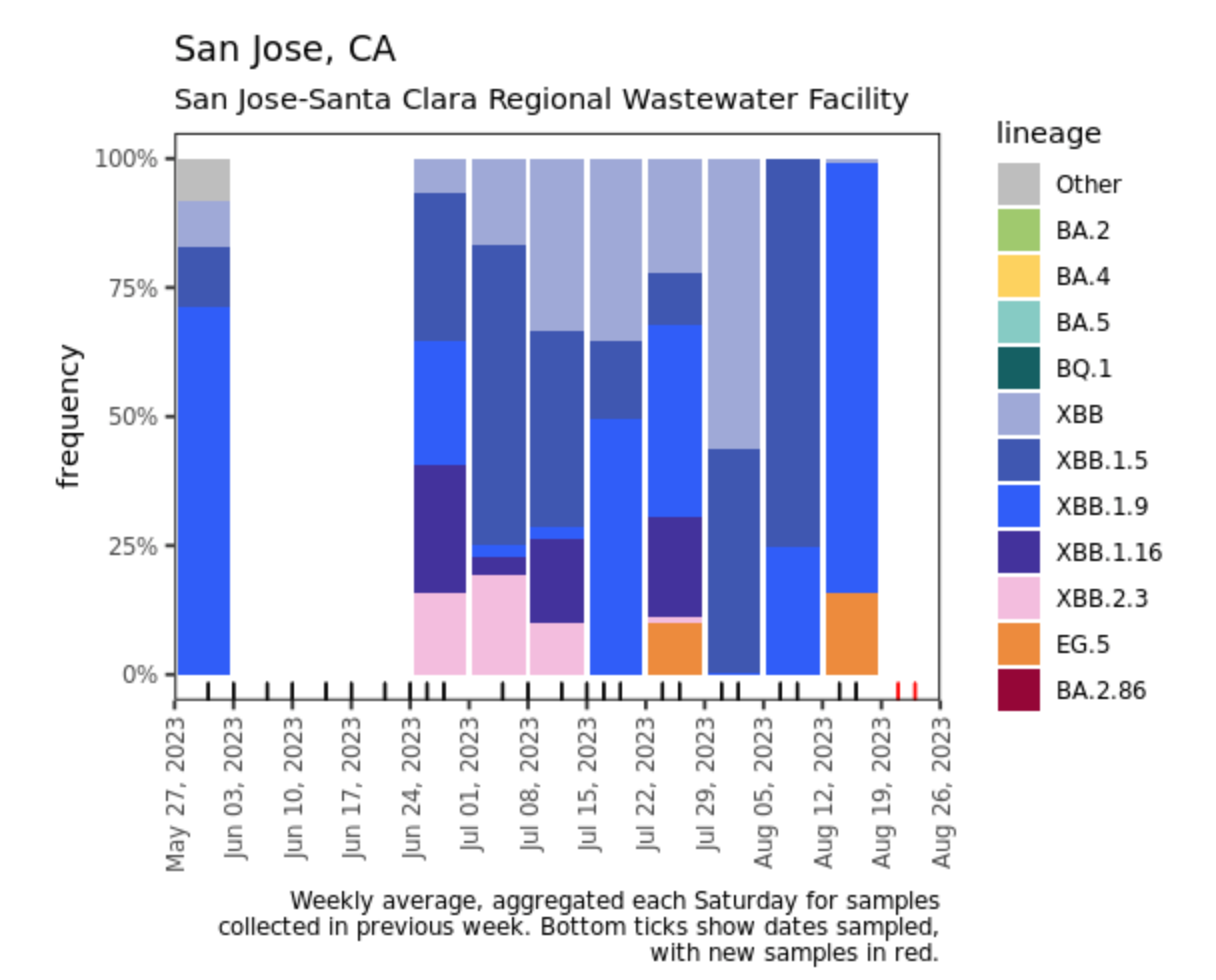
Below are plots from Oceanside, Sacramento, and San Jose showing the relative proportions of different variants inferred from sequencing the entire genome of SARS-CoV-2. Samples with low coverage are not being displayed in the plots (this explains some empty columns for Sacramento and San Jose). You can see that the sublineage EG.5 appearing in the data (in orange), especially in Sacramento which has been detected at a higher proportion of the most recent samples compared to previous weeks. EG.5 is an Omicron sublineage that has emerged in other parts of the world and has been causing infections in the US. You can read more about it here. Note that the sequencing data are always from samples taken between 1- 2 weeks ago. We have not detected BA.2.86 in any samples yet, but it should be easy to detect when it is present because it has some characteristic deletions and a large insertion. BA.2.86 was detected in a wastewater sample somewhere, as describe in this press release from CDC.
Other Respiratory Targets
Influenza A & B, RSV, and HMPV
Influenza A (IAV) RNA concentrations are very low across the SCAN plants. Concentrations are generally non-detects in samples from recent weeks. The link to the chart below is here if you would like to interact with it. The population weighted average line across all the SCAN plants is shown in black.
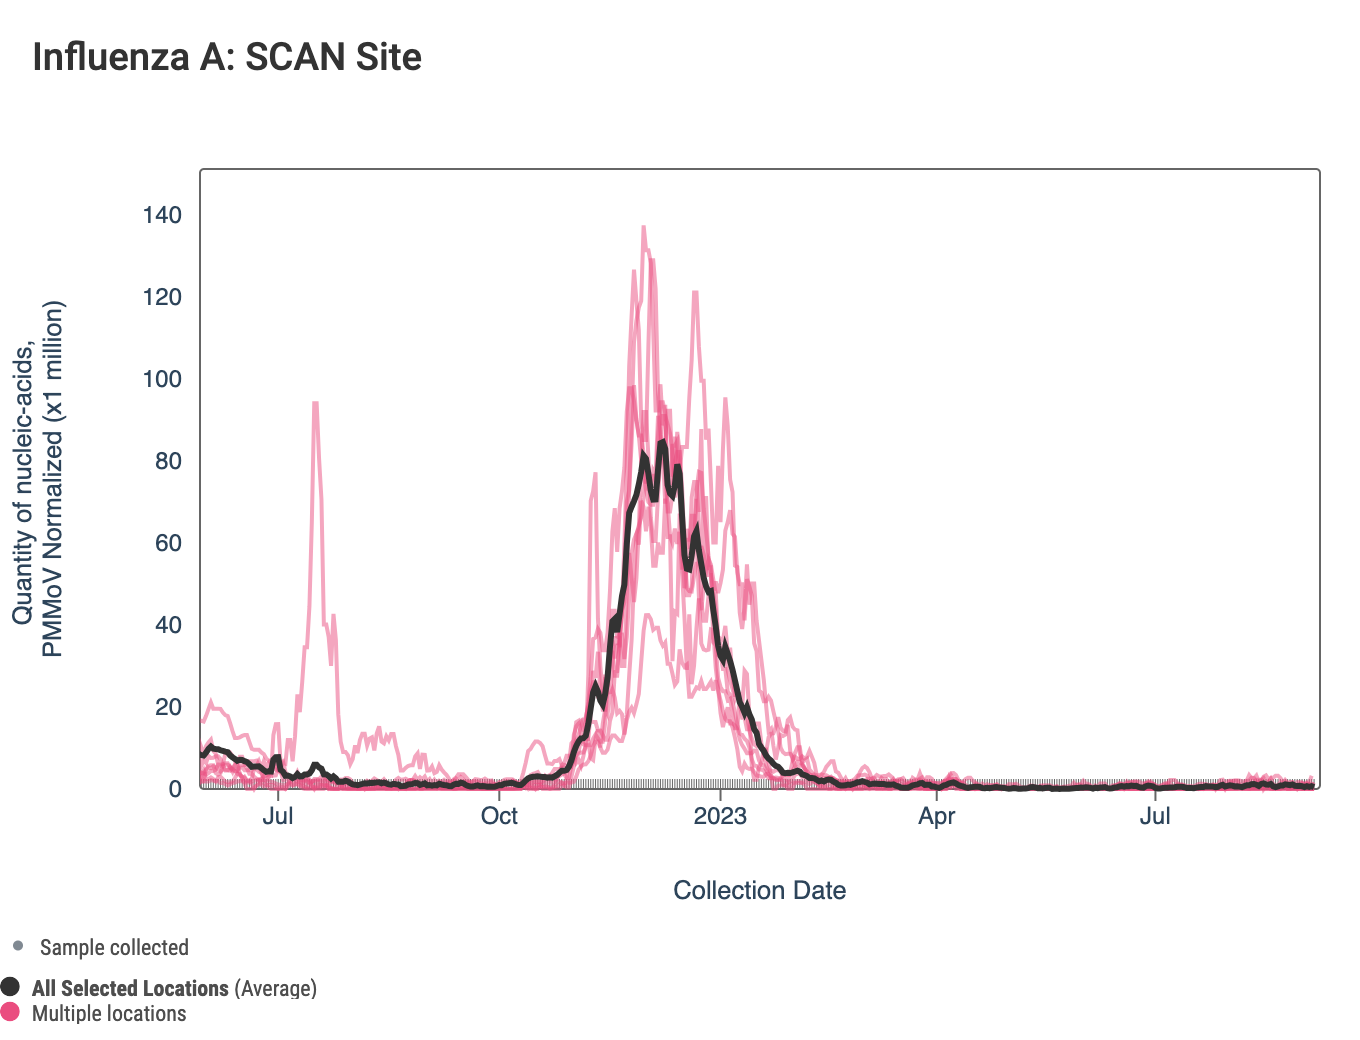
The 3-week look period trend analysis on IAV RNA at these plants indicates no trend at all the SCAN plants.
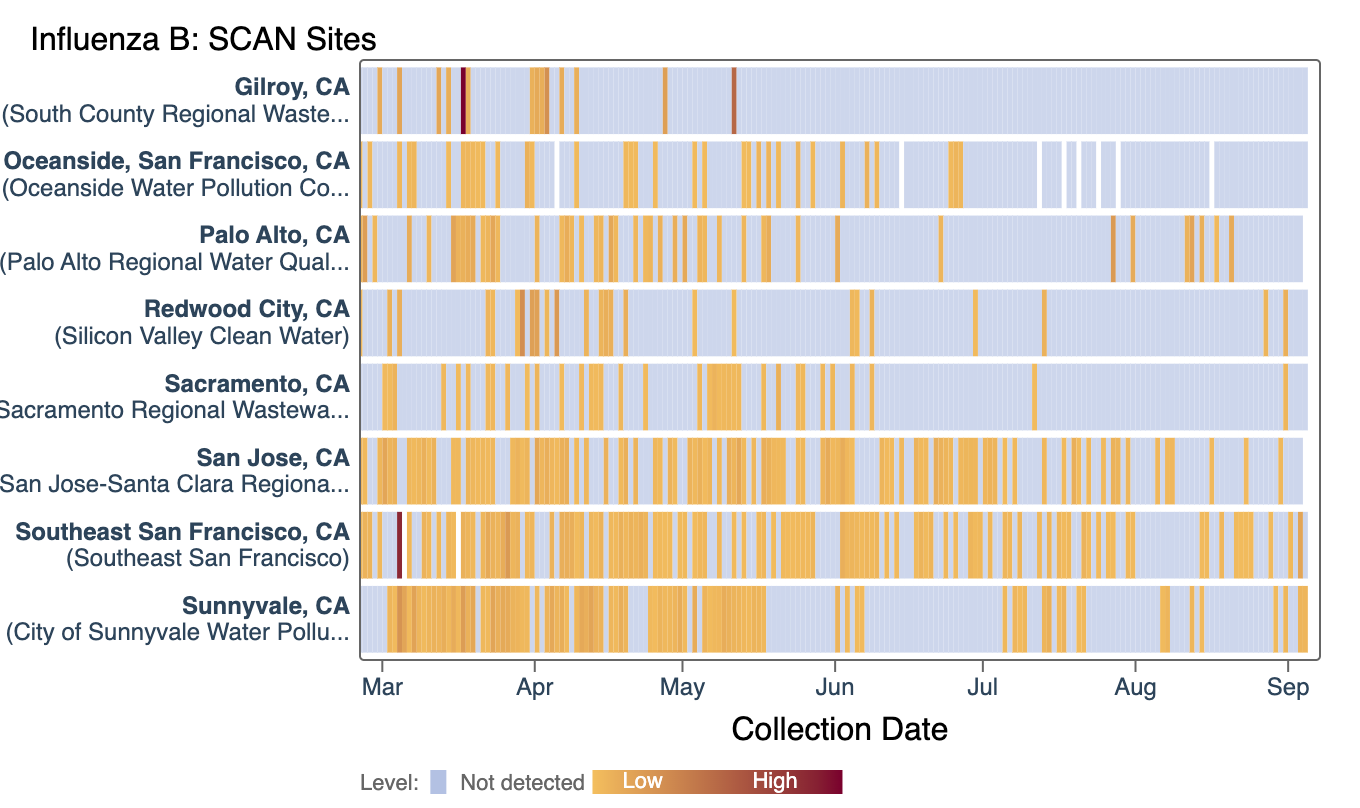
Influenza B (IBV) RNA is sporadically detected at low concentrations at the SCAN plants since early 2023. Each plant is represented by a row (y-axis), and dates are shown along the x-axis. Blue indicates a non-detect, and darker orange/red is proportional to concentration with the highest values being darkest. A white means no sample was collected. Here is the link to the heat map chart - the linked chart will update automatically as more data are added to the site.
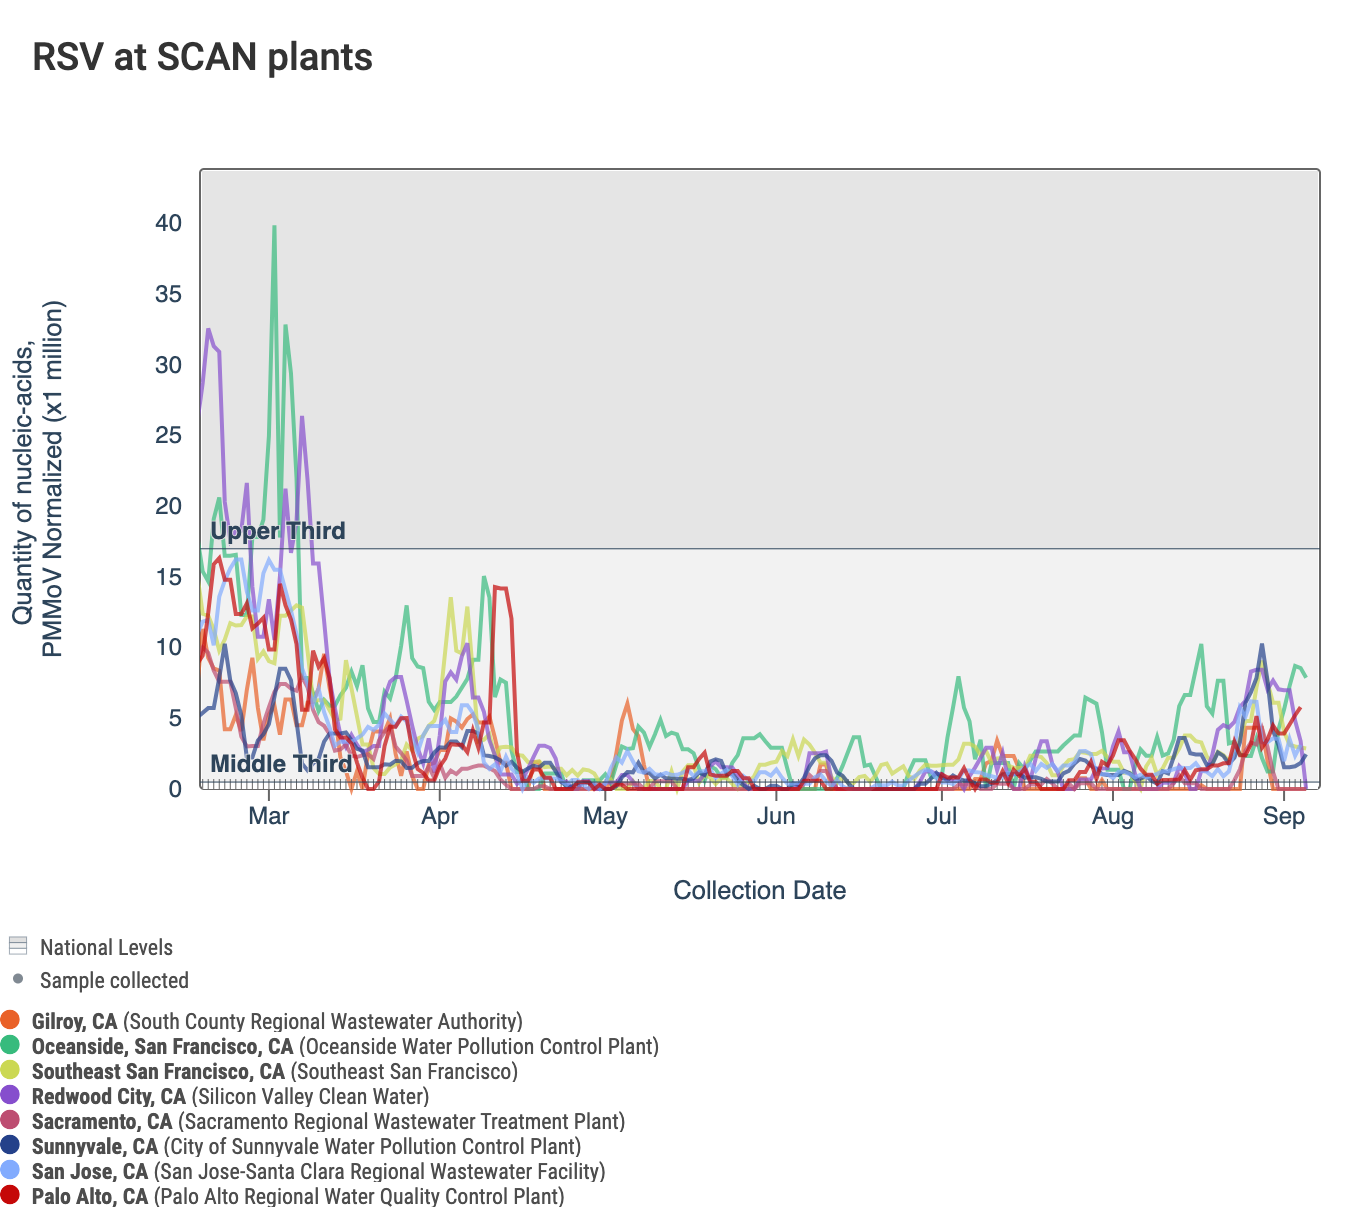
RSV RNA concentrations are shown from all the SCAN sites in the chart below together since last winter and can be access here. The black line is the population weighted average. You can see a small uptick in the population weighted line over the last week.
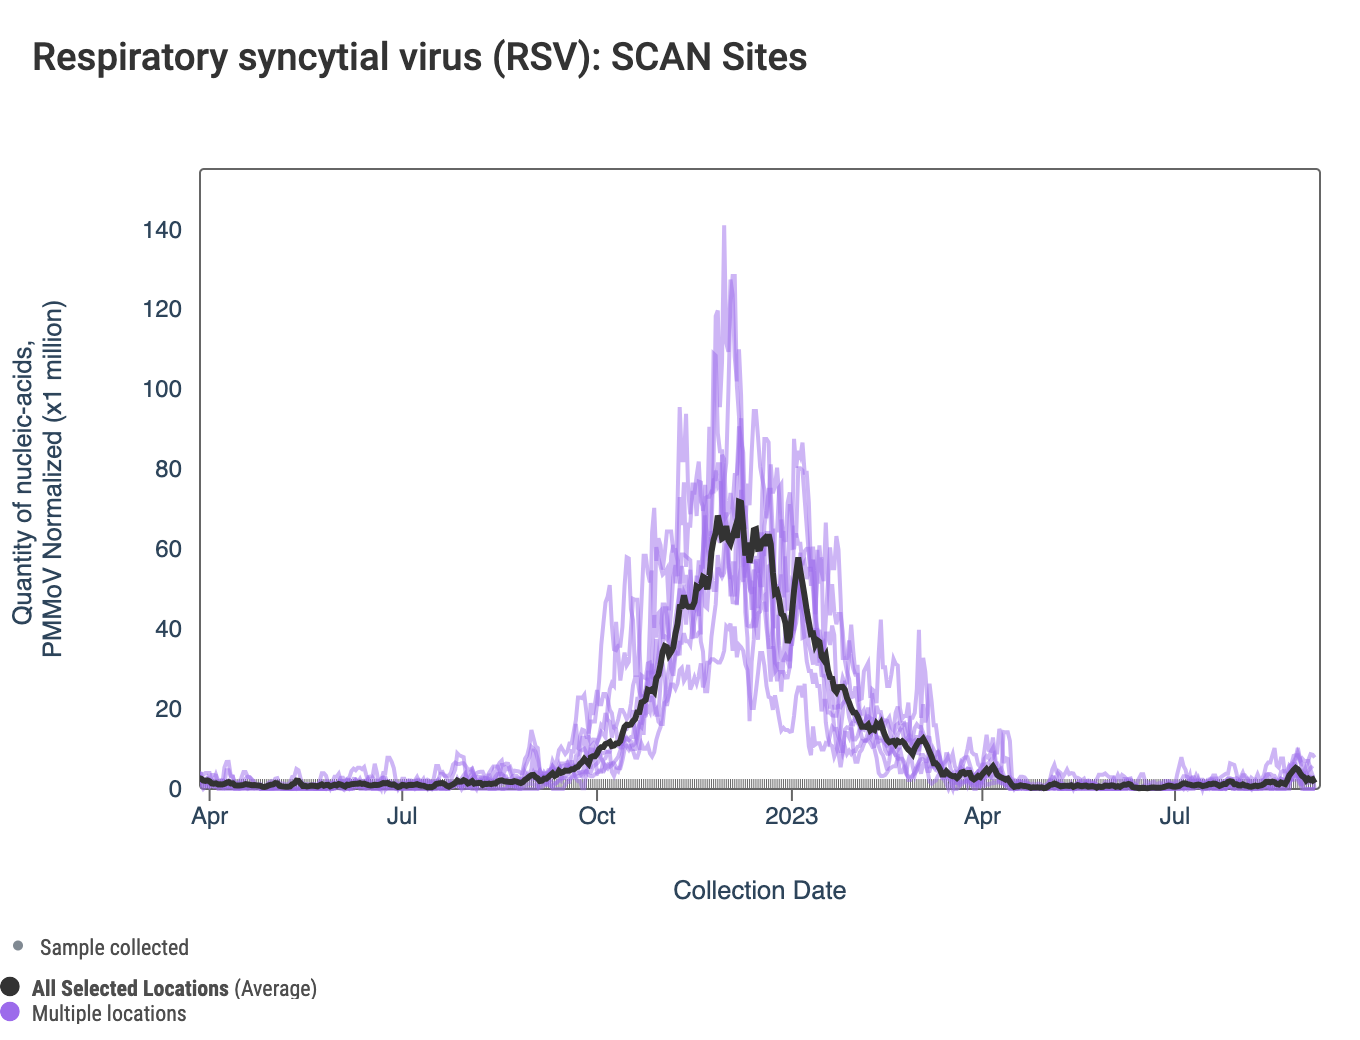
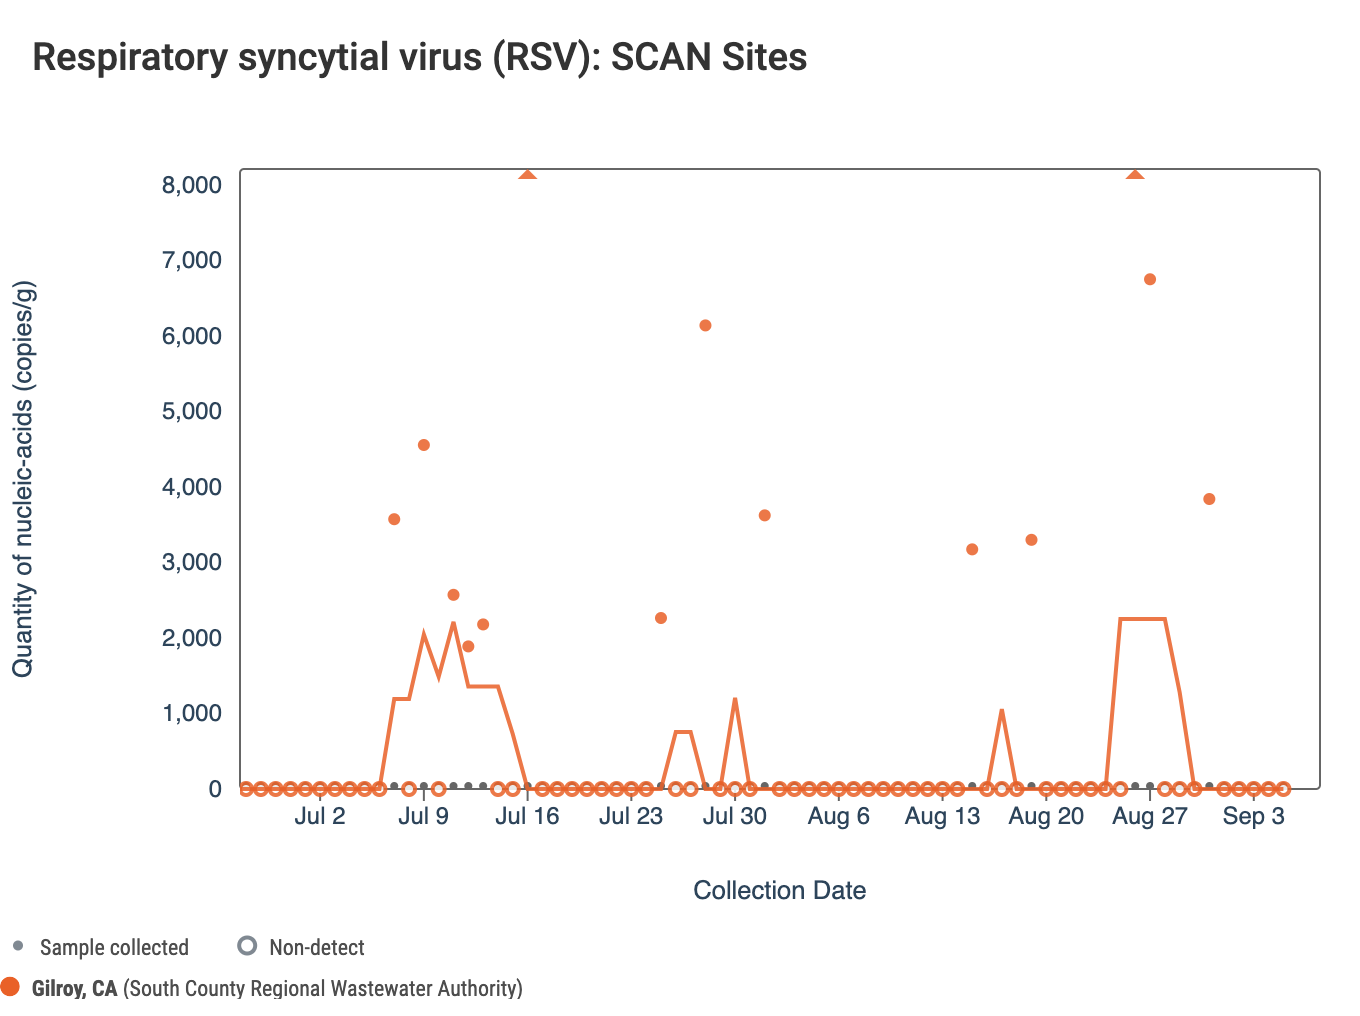
The 3-week look period trend analysis on RSV RNA at these plants indicates a significant upward trend at Gilroy and no trend at all other SCAN plants.
We have defined seasonal onset of RSV wastewater events to occur when for 14 consecutive days, concentrations are over 2000 copies/g. The plot of Gilroy RSV data is shown here, where you can see there has not been an onset of a RSV wastewater event. This metric for onset is defined in the paper we recently published here.
Below is a chart showing the National Levels benchmarks superimposed on the RSV data from the SCAN sites over the last 6 months (you can access this chart here). Currently, the RSV concentration is in the middle third level for all SCAN plants except Gilroy and Sacramento, which is in the lower third level.
HMPV (human metapneumovirus) RNA concentrations are low at most of plants in SCAN. Below are charts showing data from all the SCAN plants together (link here to this chart if you want to interact with it).
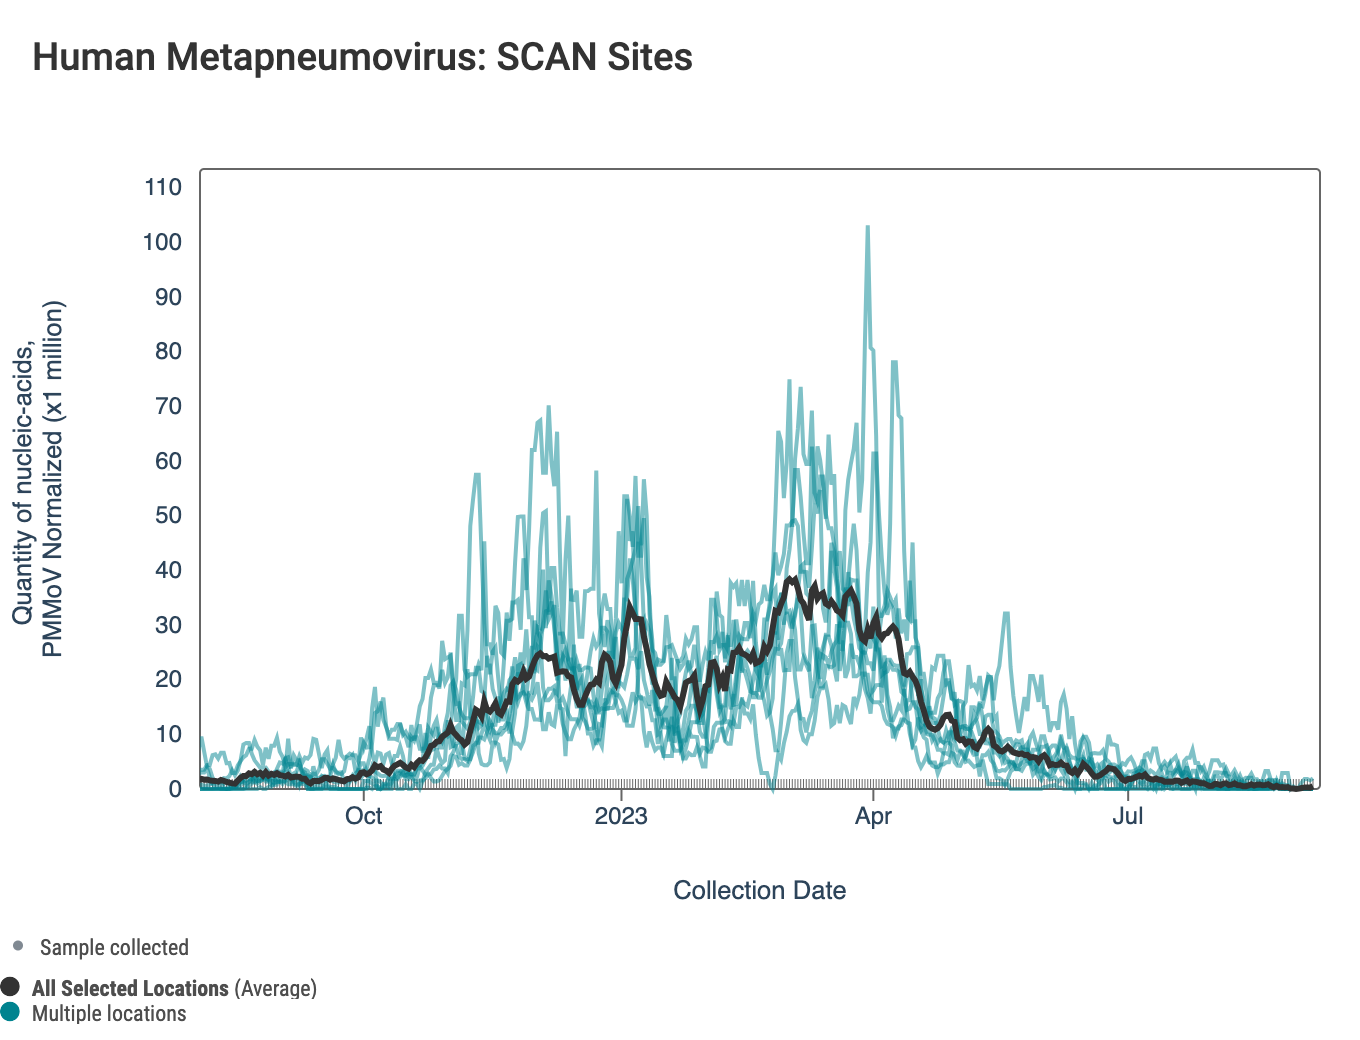
The 3-week look period trend analysis on HMPV RNA shows no significant trends at any SCAN plant.
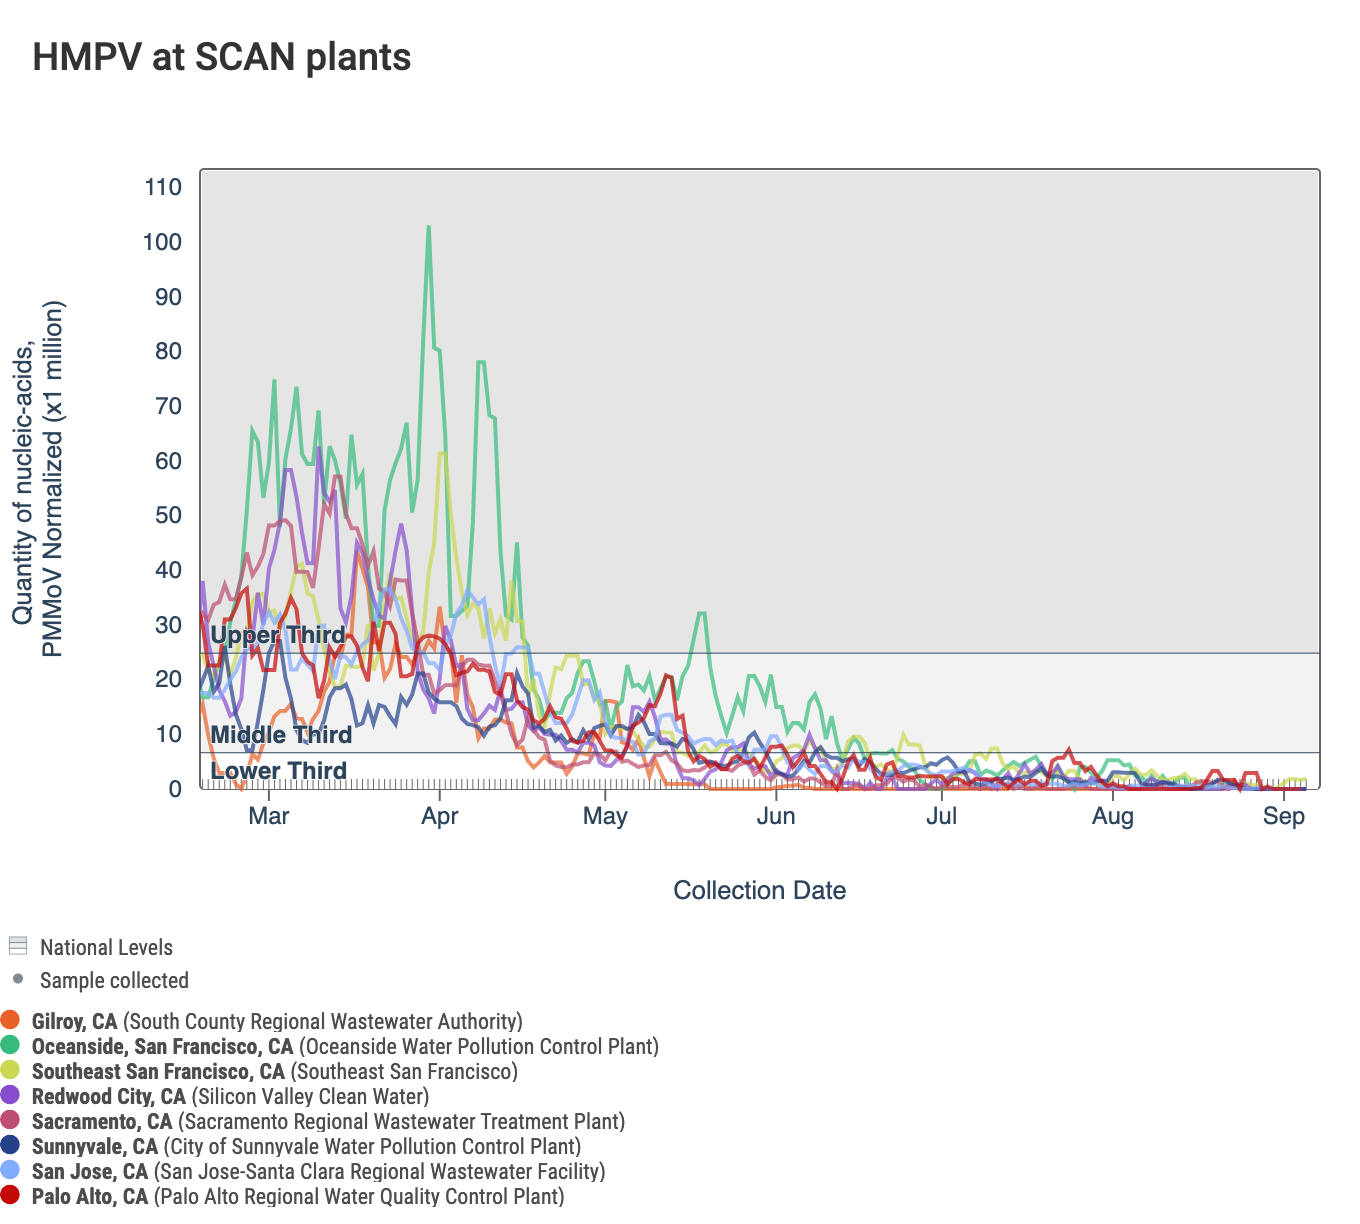
Below is a chart showing the National Levels benchmarks superimposed on the HMPV data from the SCAN sites over the last 6 months (you can access this chart here). Currently, the HMPV concentration is in the lower third level for all other SCAN plants.
Gastrointestinal Targets
Norovirus GII
Norovirus GII RNA concentrations are shown in the chart below; all the SCAN plants are shown together. The population weighted average line is shown in black. You can interact with the chart of all the plants at this link.
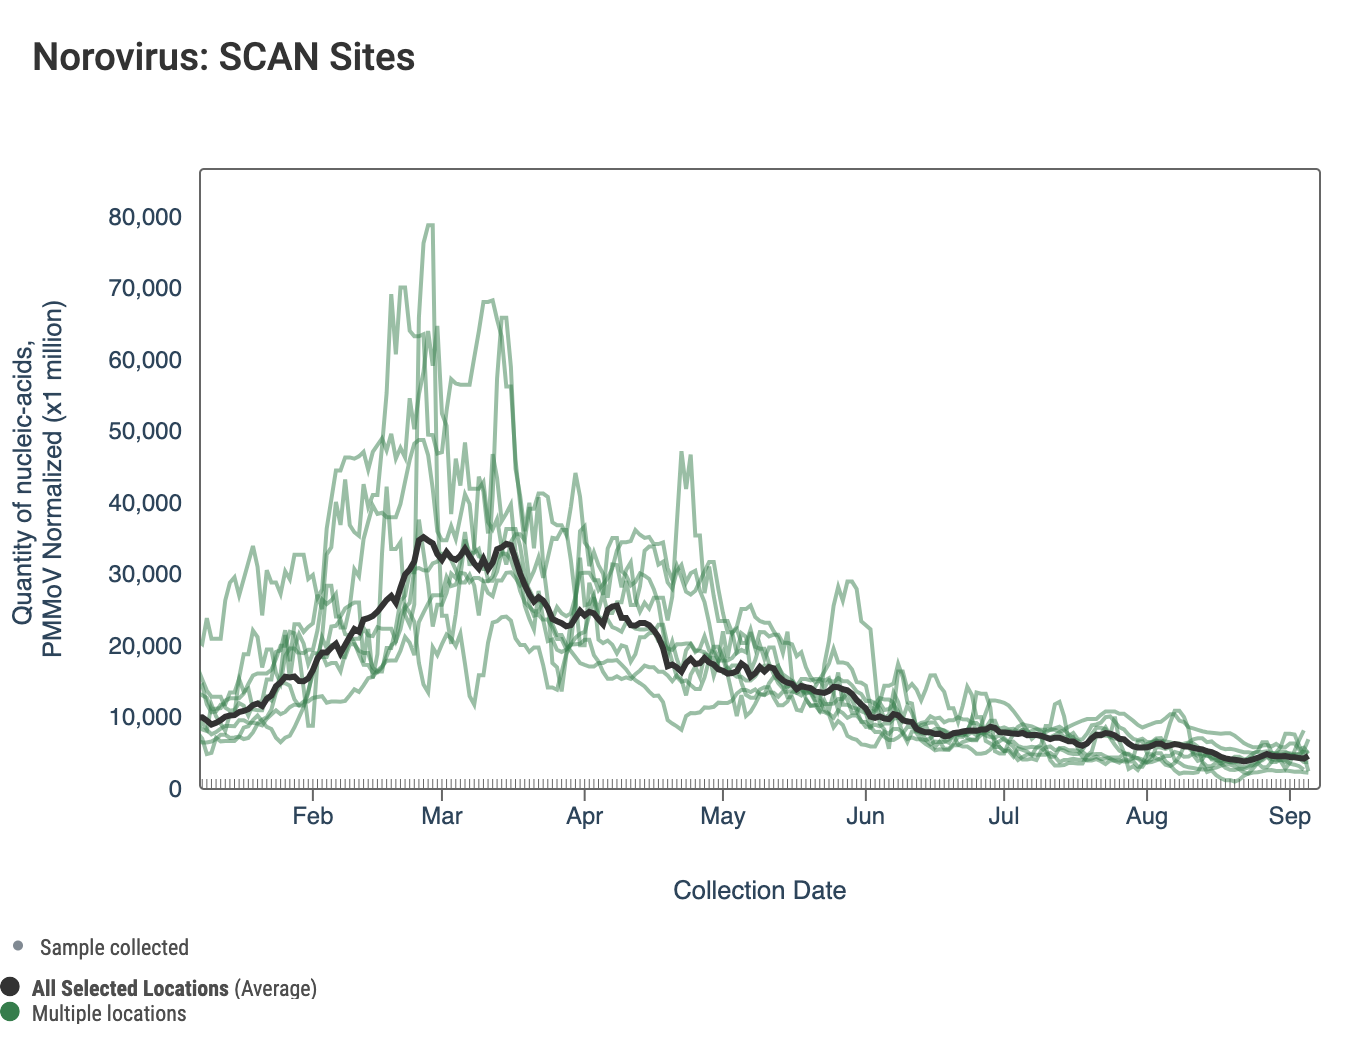
The 3-week look period trend analysis on HuNoV GII RNA at SCAN plants indicates a significant upward trend for Gilroy and Southeast San Francisco, a downward trend for Oceanside and no trend for all the other SCAN plants.
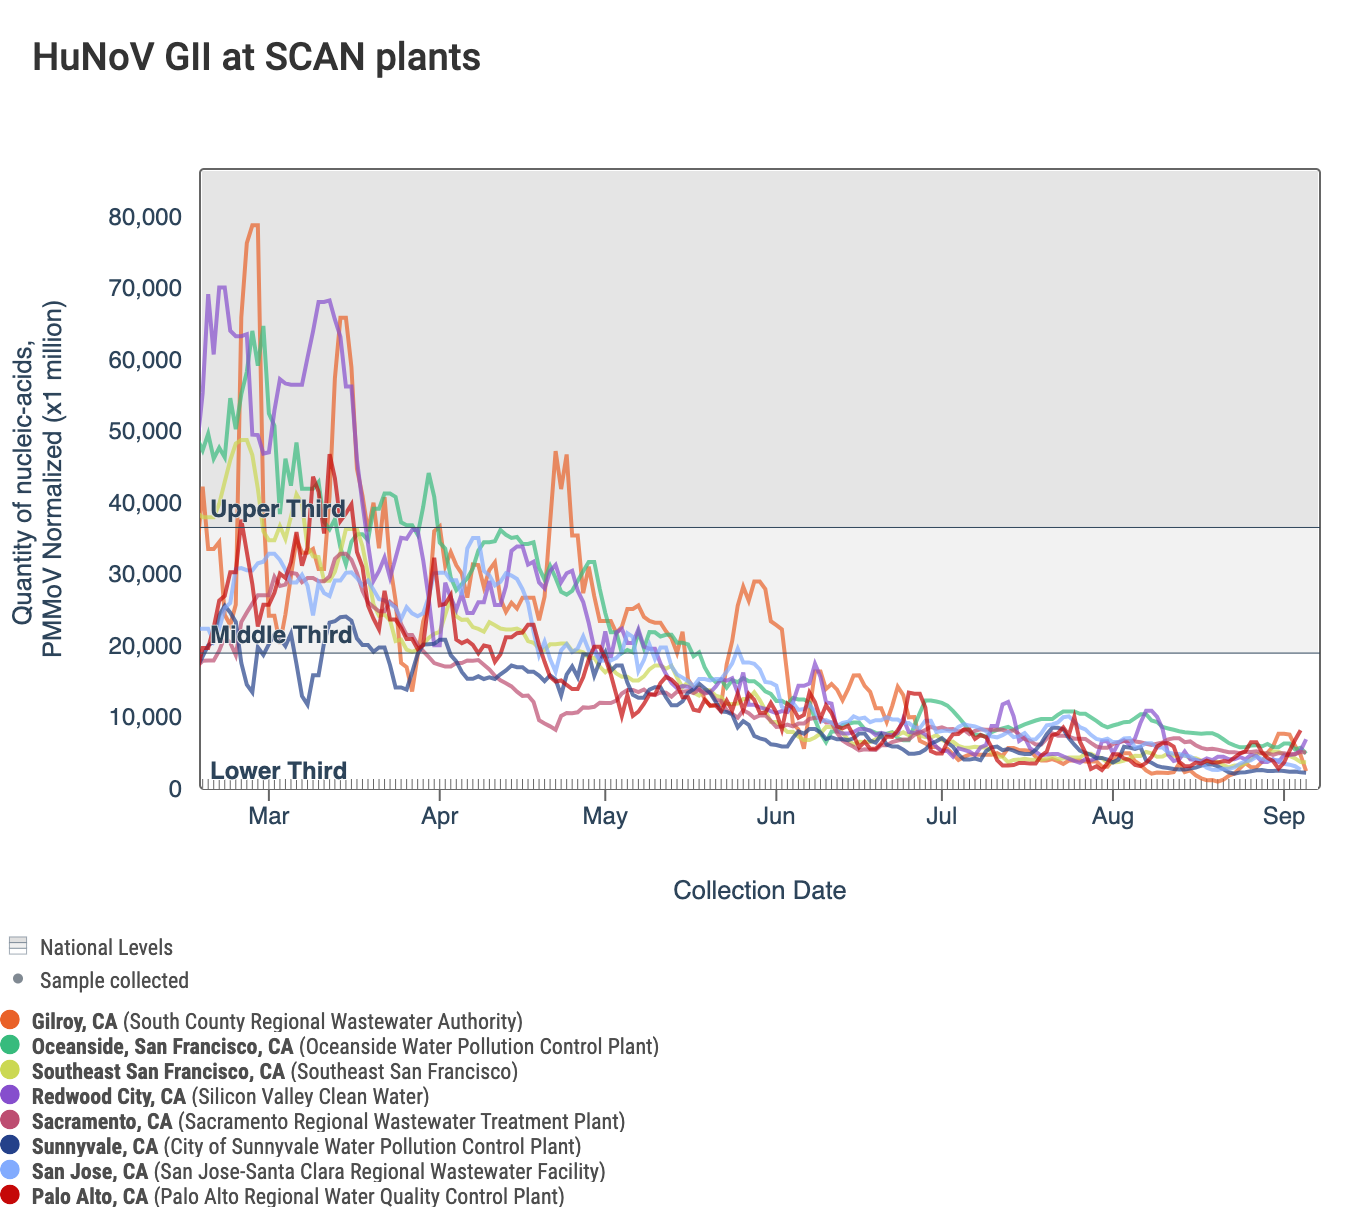
Below is a chart showing the National Levels benchmarks superimposed on the HuNoV GII data from the SCAN sites since the beginning of 2023. (You can access the chart here.) Currently all SCAN sites HuNoV GII concentrations in the lower third level.
Other Pathogens of Concern
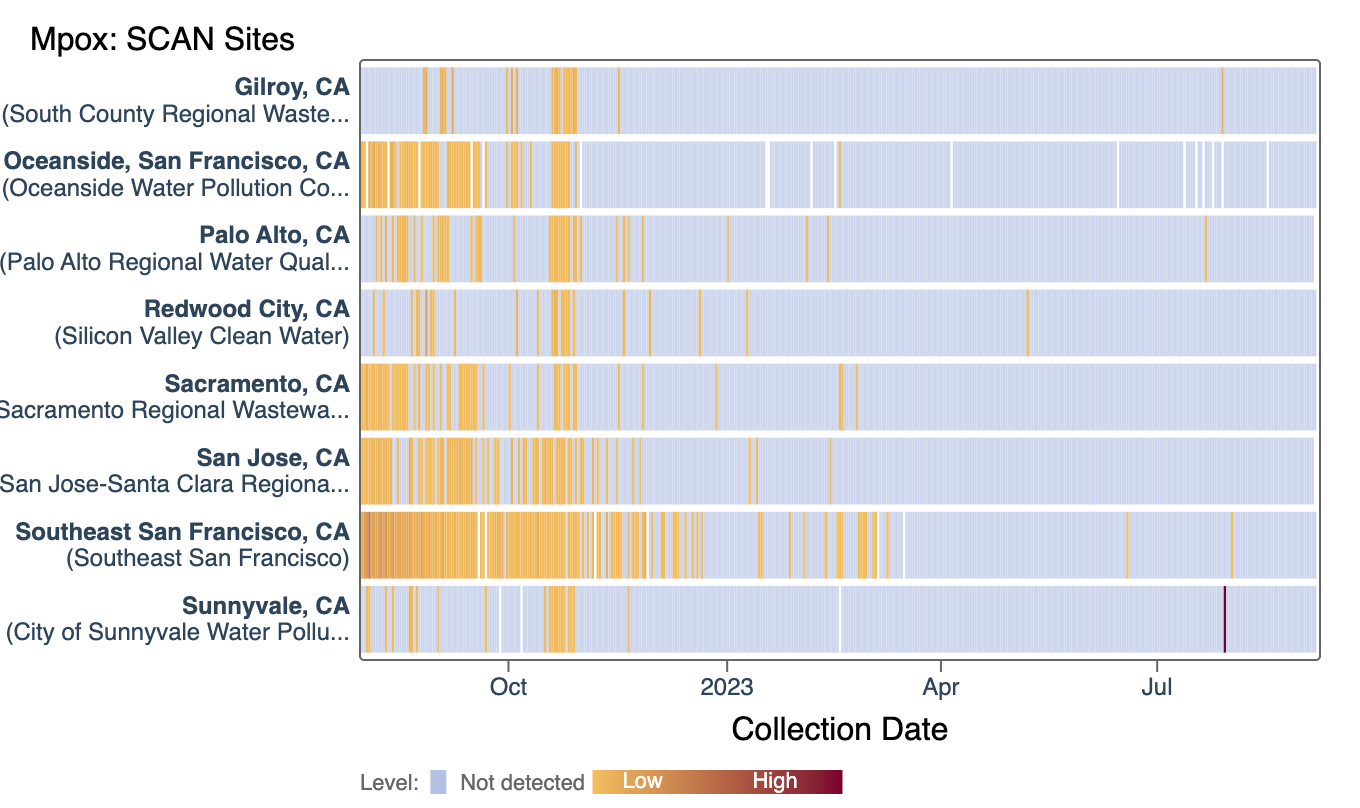
Mpox
We've observed non-detects in the last 14 days for MPXV DNA at the SCAN plants. The heat map show all the SCAN sites as a row, and each date as a column. The color blue means the sample was non-detect for MPXV DNA and the colors get darker with higher concentrations. White indicates no sample was collected. The charts shows all the data we have collected, almost a year's worth of data. You can access the chart here.