Nationwide WWSCAN Update 3/24/23
Hi everyone,
This newsletter contains updates on the WastewaterSCAN program with wastewater data processed by the lab through Tuesday March 21, 2023. Below you will find information on the program in terms of participating partners, review of targets being measured, as well as trends in concentrations of infectious disease targets.
Reminder: We officially began using an assay to track mutations present in the SARS-CoV-2 XBB* lineage and ceased tracking using an assay measuring the SARS-CoV-2 S gene. You can now see XBB* results along with all the data on data.wastewaterscan.org.
We also wanted to share that our paper on respiratory viruses in wastewater solids was published in Lancet Microbe this week. The article is open access and you can read it here.
Enjoy your weekend,
Ali & Marlene
Participating Plants
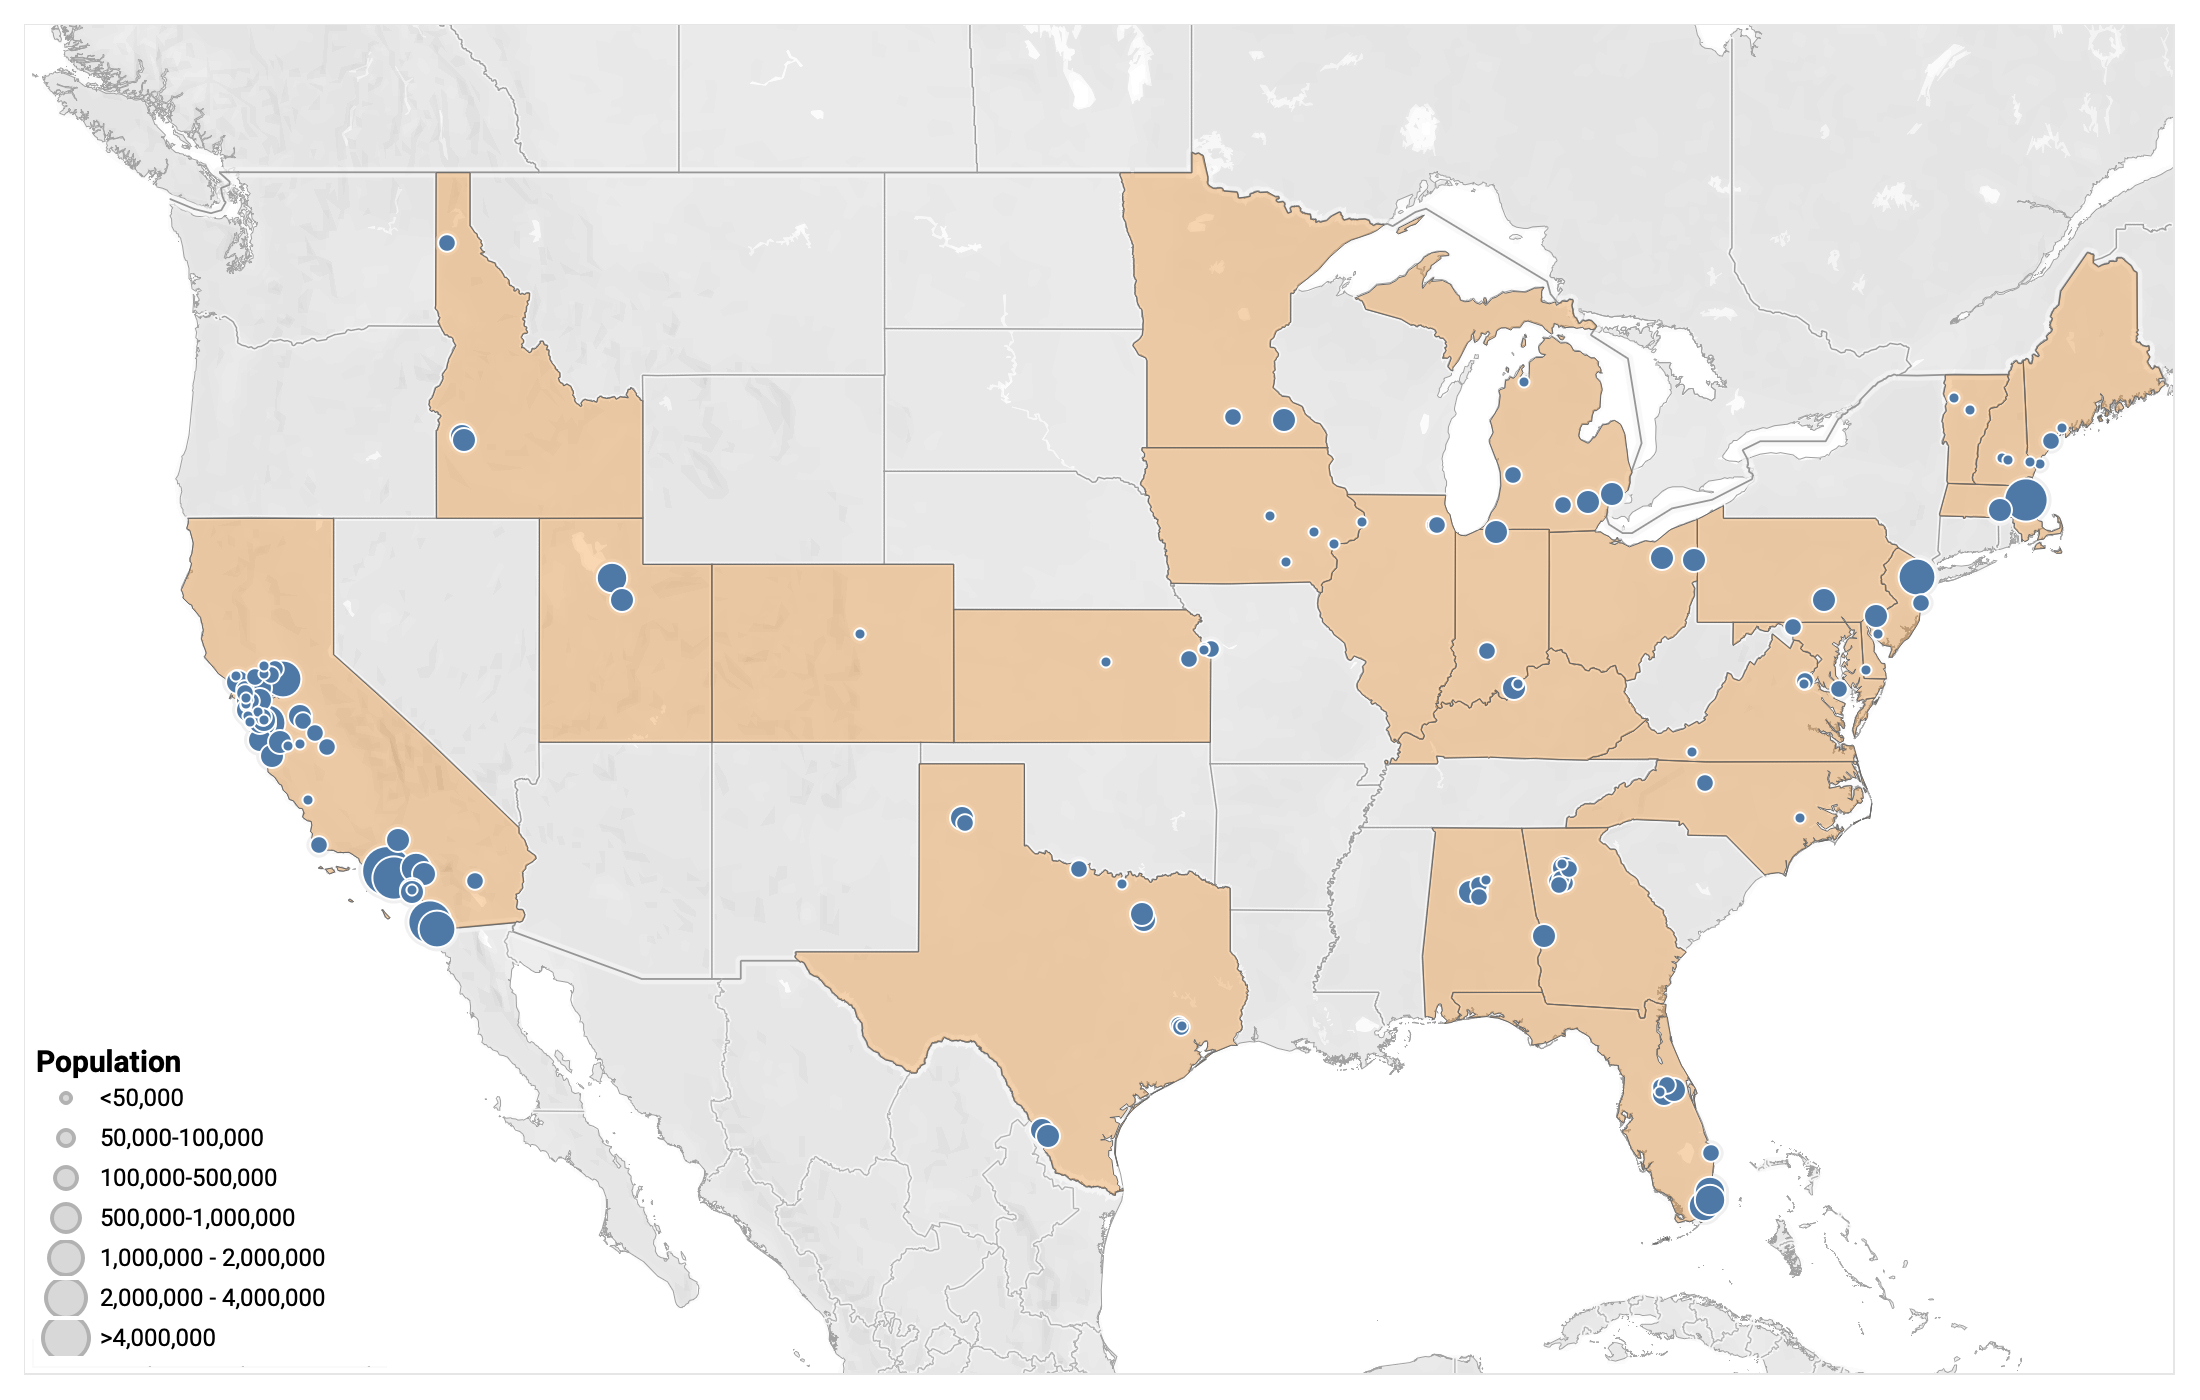
148 plants from 27 states are sampling, which represents >10% of the US population
Participants:
- 148 plants sampling
- 10.73% US population represented (35,348,769 people)
- 27 states represented
Welcome, New Plants!
- Oakhurst, NJ
- Union Beach, NJ
- Las Vegas, NV
- South Burlington, VT
Infectious Disease Target Review
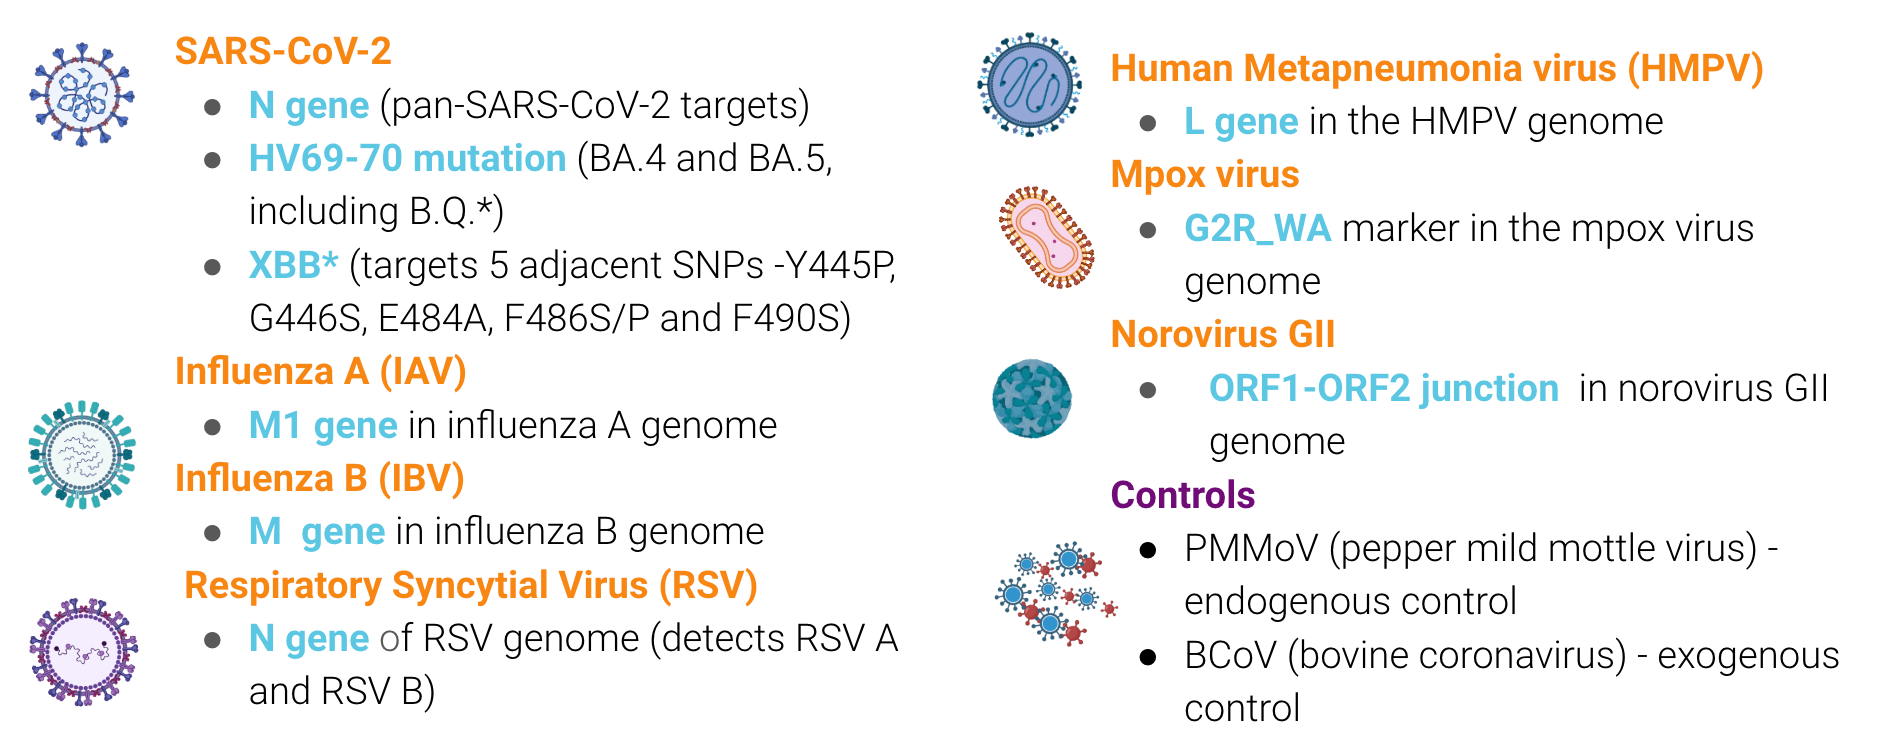
The methods for our assays are in the public domain. You can access them using these QR codes:

SARS-CoV-2 & Variants Trends
21-day nationwide wastewater trends
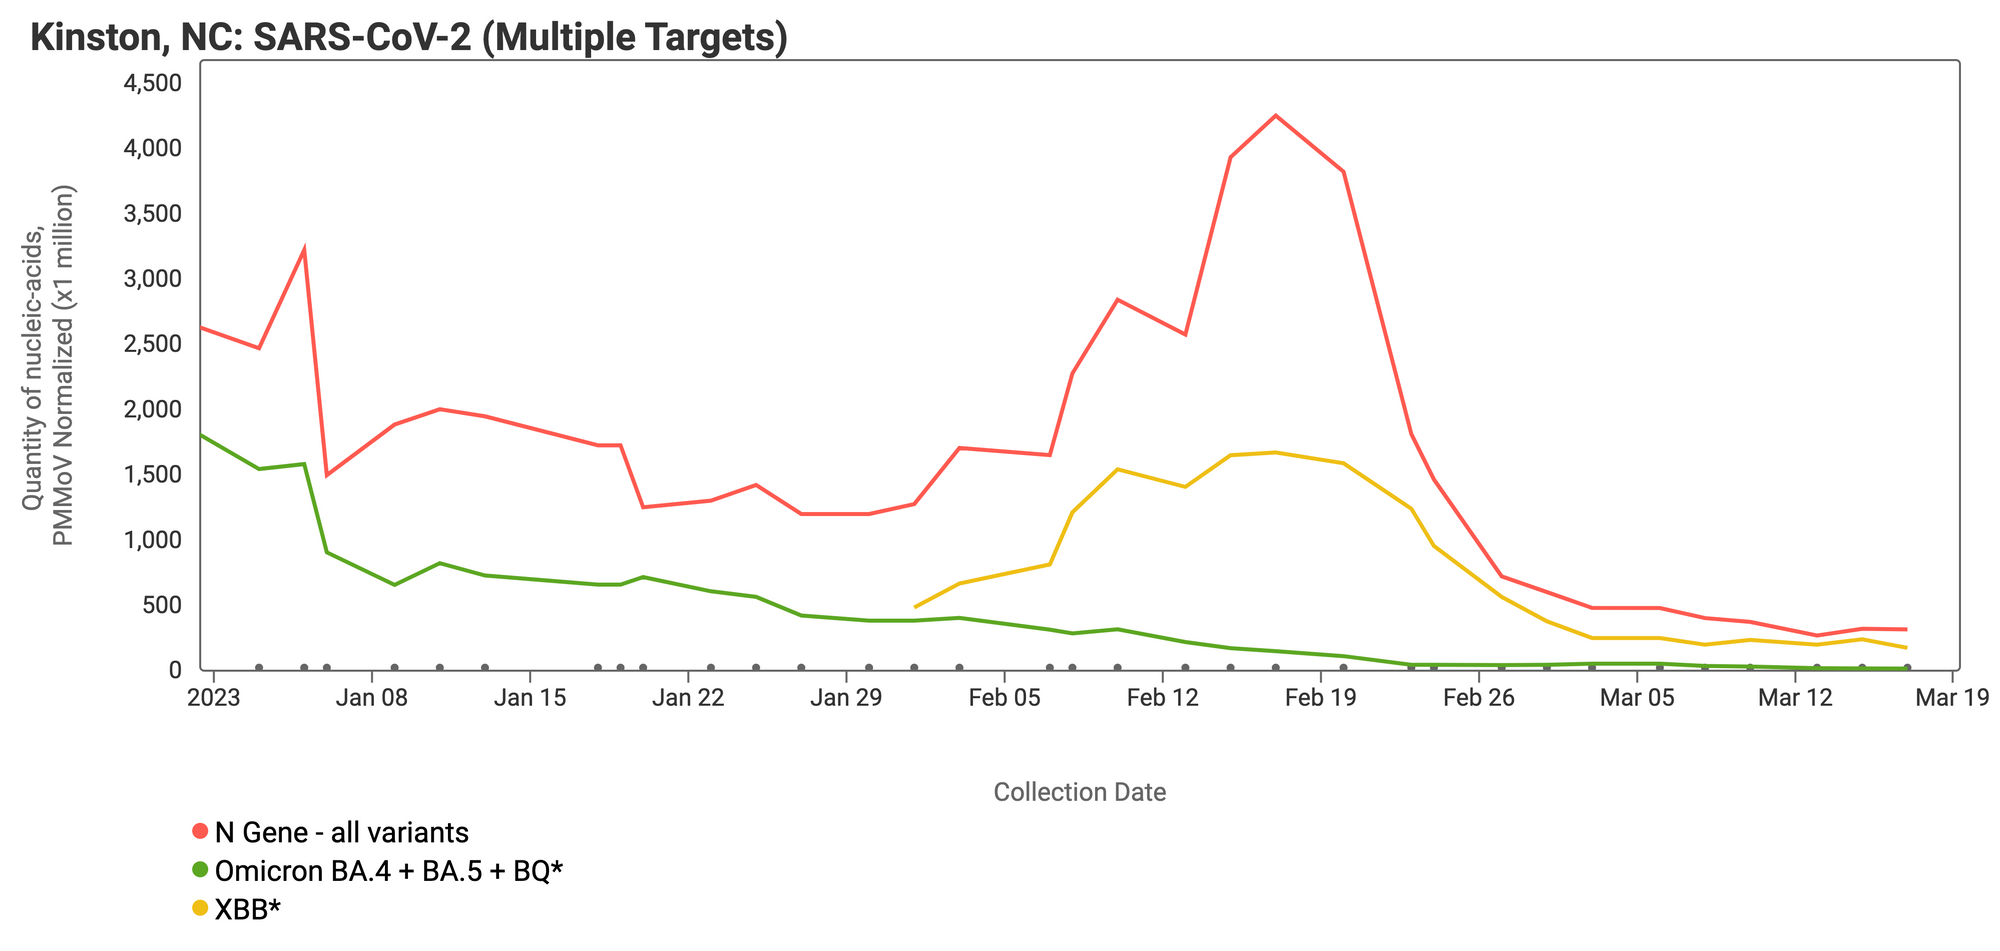
In late January 2023 we started testing for XBB* and these results are now available to view by selecting 'SARS-CoV-2 View by Variant' on data.wastewaterscan.org. See the example plot for Kinston, NC below. The N gene (present in all variants) is shown in red, XBB* mutations are shown in yellow, and the HV69-70 mutation (present in the BA.4, BA.5 and BQ* sublineages) is shown in green. You can see that in the month of February, the yellow line is increasing and is approaching the red line, while the green line is falling off to non-detect. This can be interpreted to mean that more of the SARS-CoV-2 genomes in wastewater solids from this site have the XBB* mutations than the mutation characteristic of the BA.4, BA.5, and BQ* variants. This is consistent with what we know from recent sequencing of clinical specimens, which is that XBB* (and XBB.1.5 in particular) is replacing other variants.
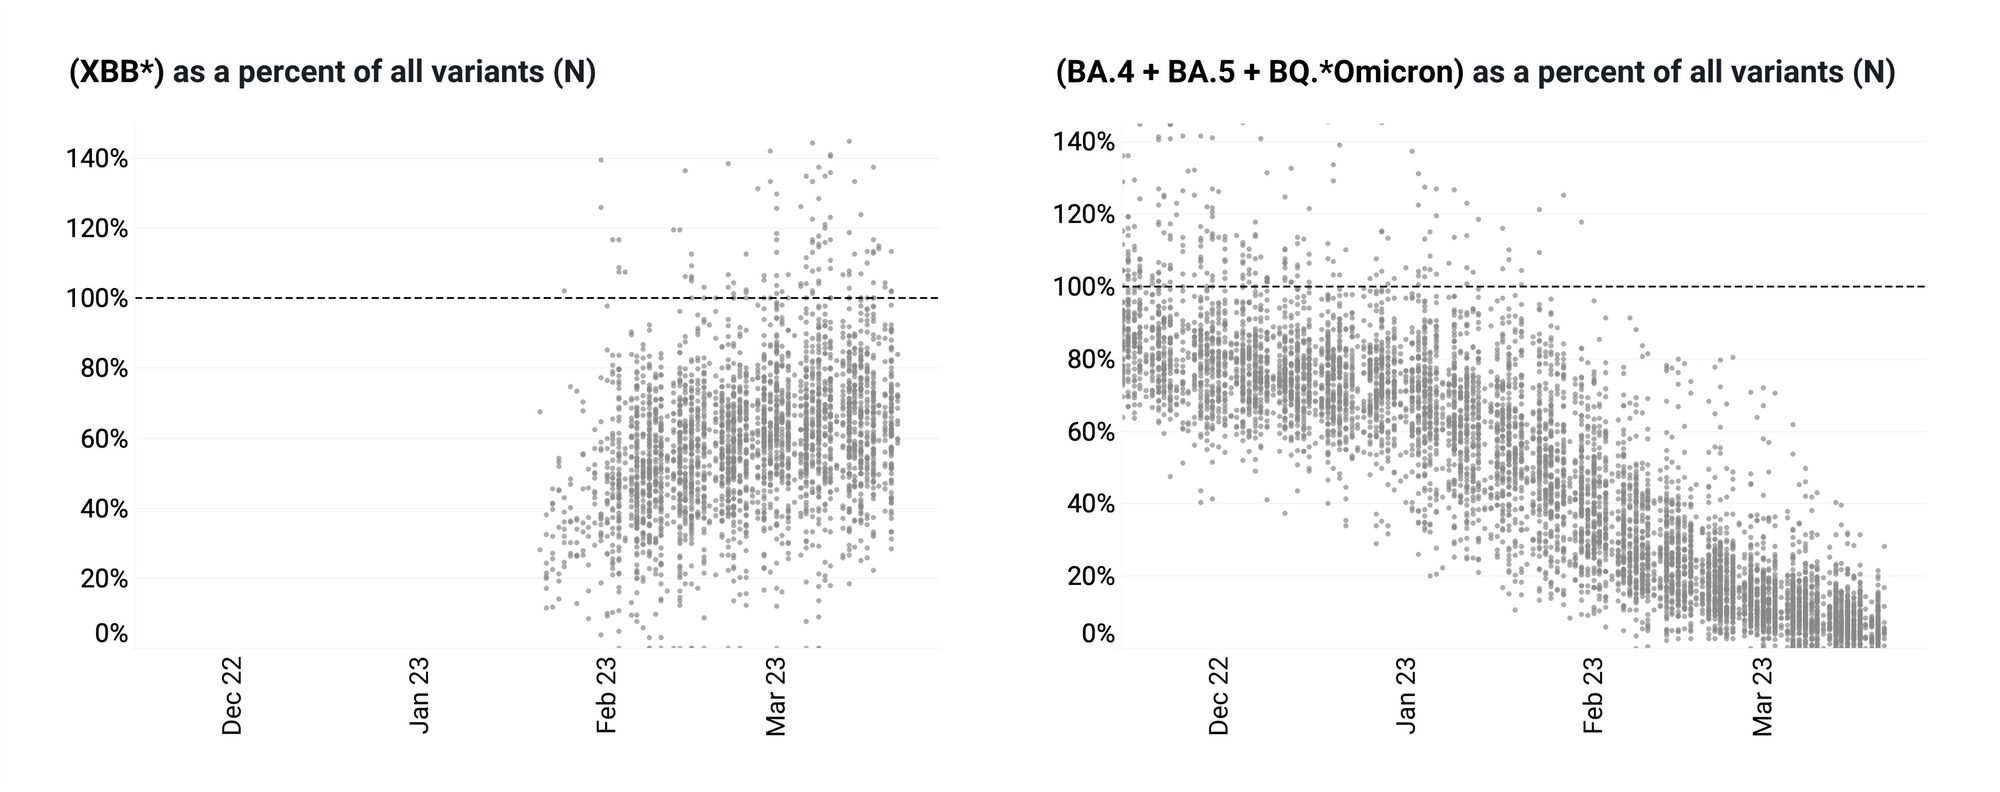
The ratio of the XBB* mutations/N across all WWSCAN plants is shown in the chart below on the left. As the ratio reaches 100%, it suggests that all the SARS-CoV-2 genomes in wastewater have the XBB* mutations. These data indicate that the average ratio XBB* mutations/N is ~60% but some places show levels as high as 70-90%, and there is an increasing trend. This suggests 60%-80% of infections across the communities are caused by XBB or XBB.1.5 and the percentage is increasing. The chart on the right shows the ratio of the BA.5, BA.4, and BQ* mutation/N across all WWSCAN plants. It can be read the same way as the XBB* chart. The average ratio is about 10-20% and has a decreasing trend.
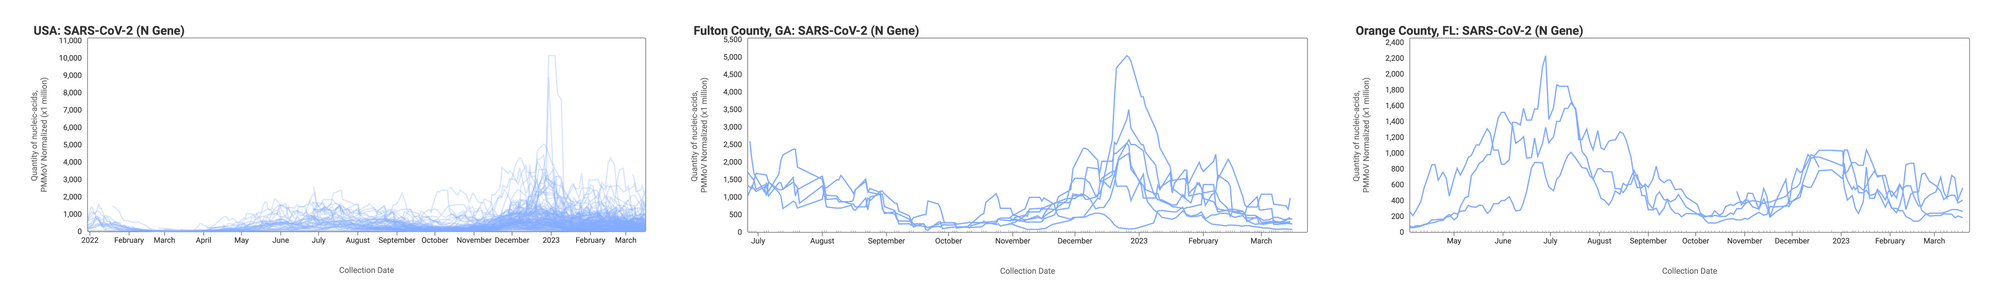
Below are the SARS-CoV-2 N gene concentrations (normalized by PMMoV) from all participating WWSCAN sites across the country (left panel), those in Fulton County, GA representing the Atlanta area (middle panel), and those in Orange County, FL representing the Orlando area (right panel). The lines you see represent 5-point trimmed averages. Evident in the data are relatively high concentrations around the start of the year with lower levels presently observed.
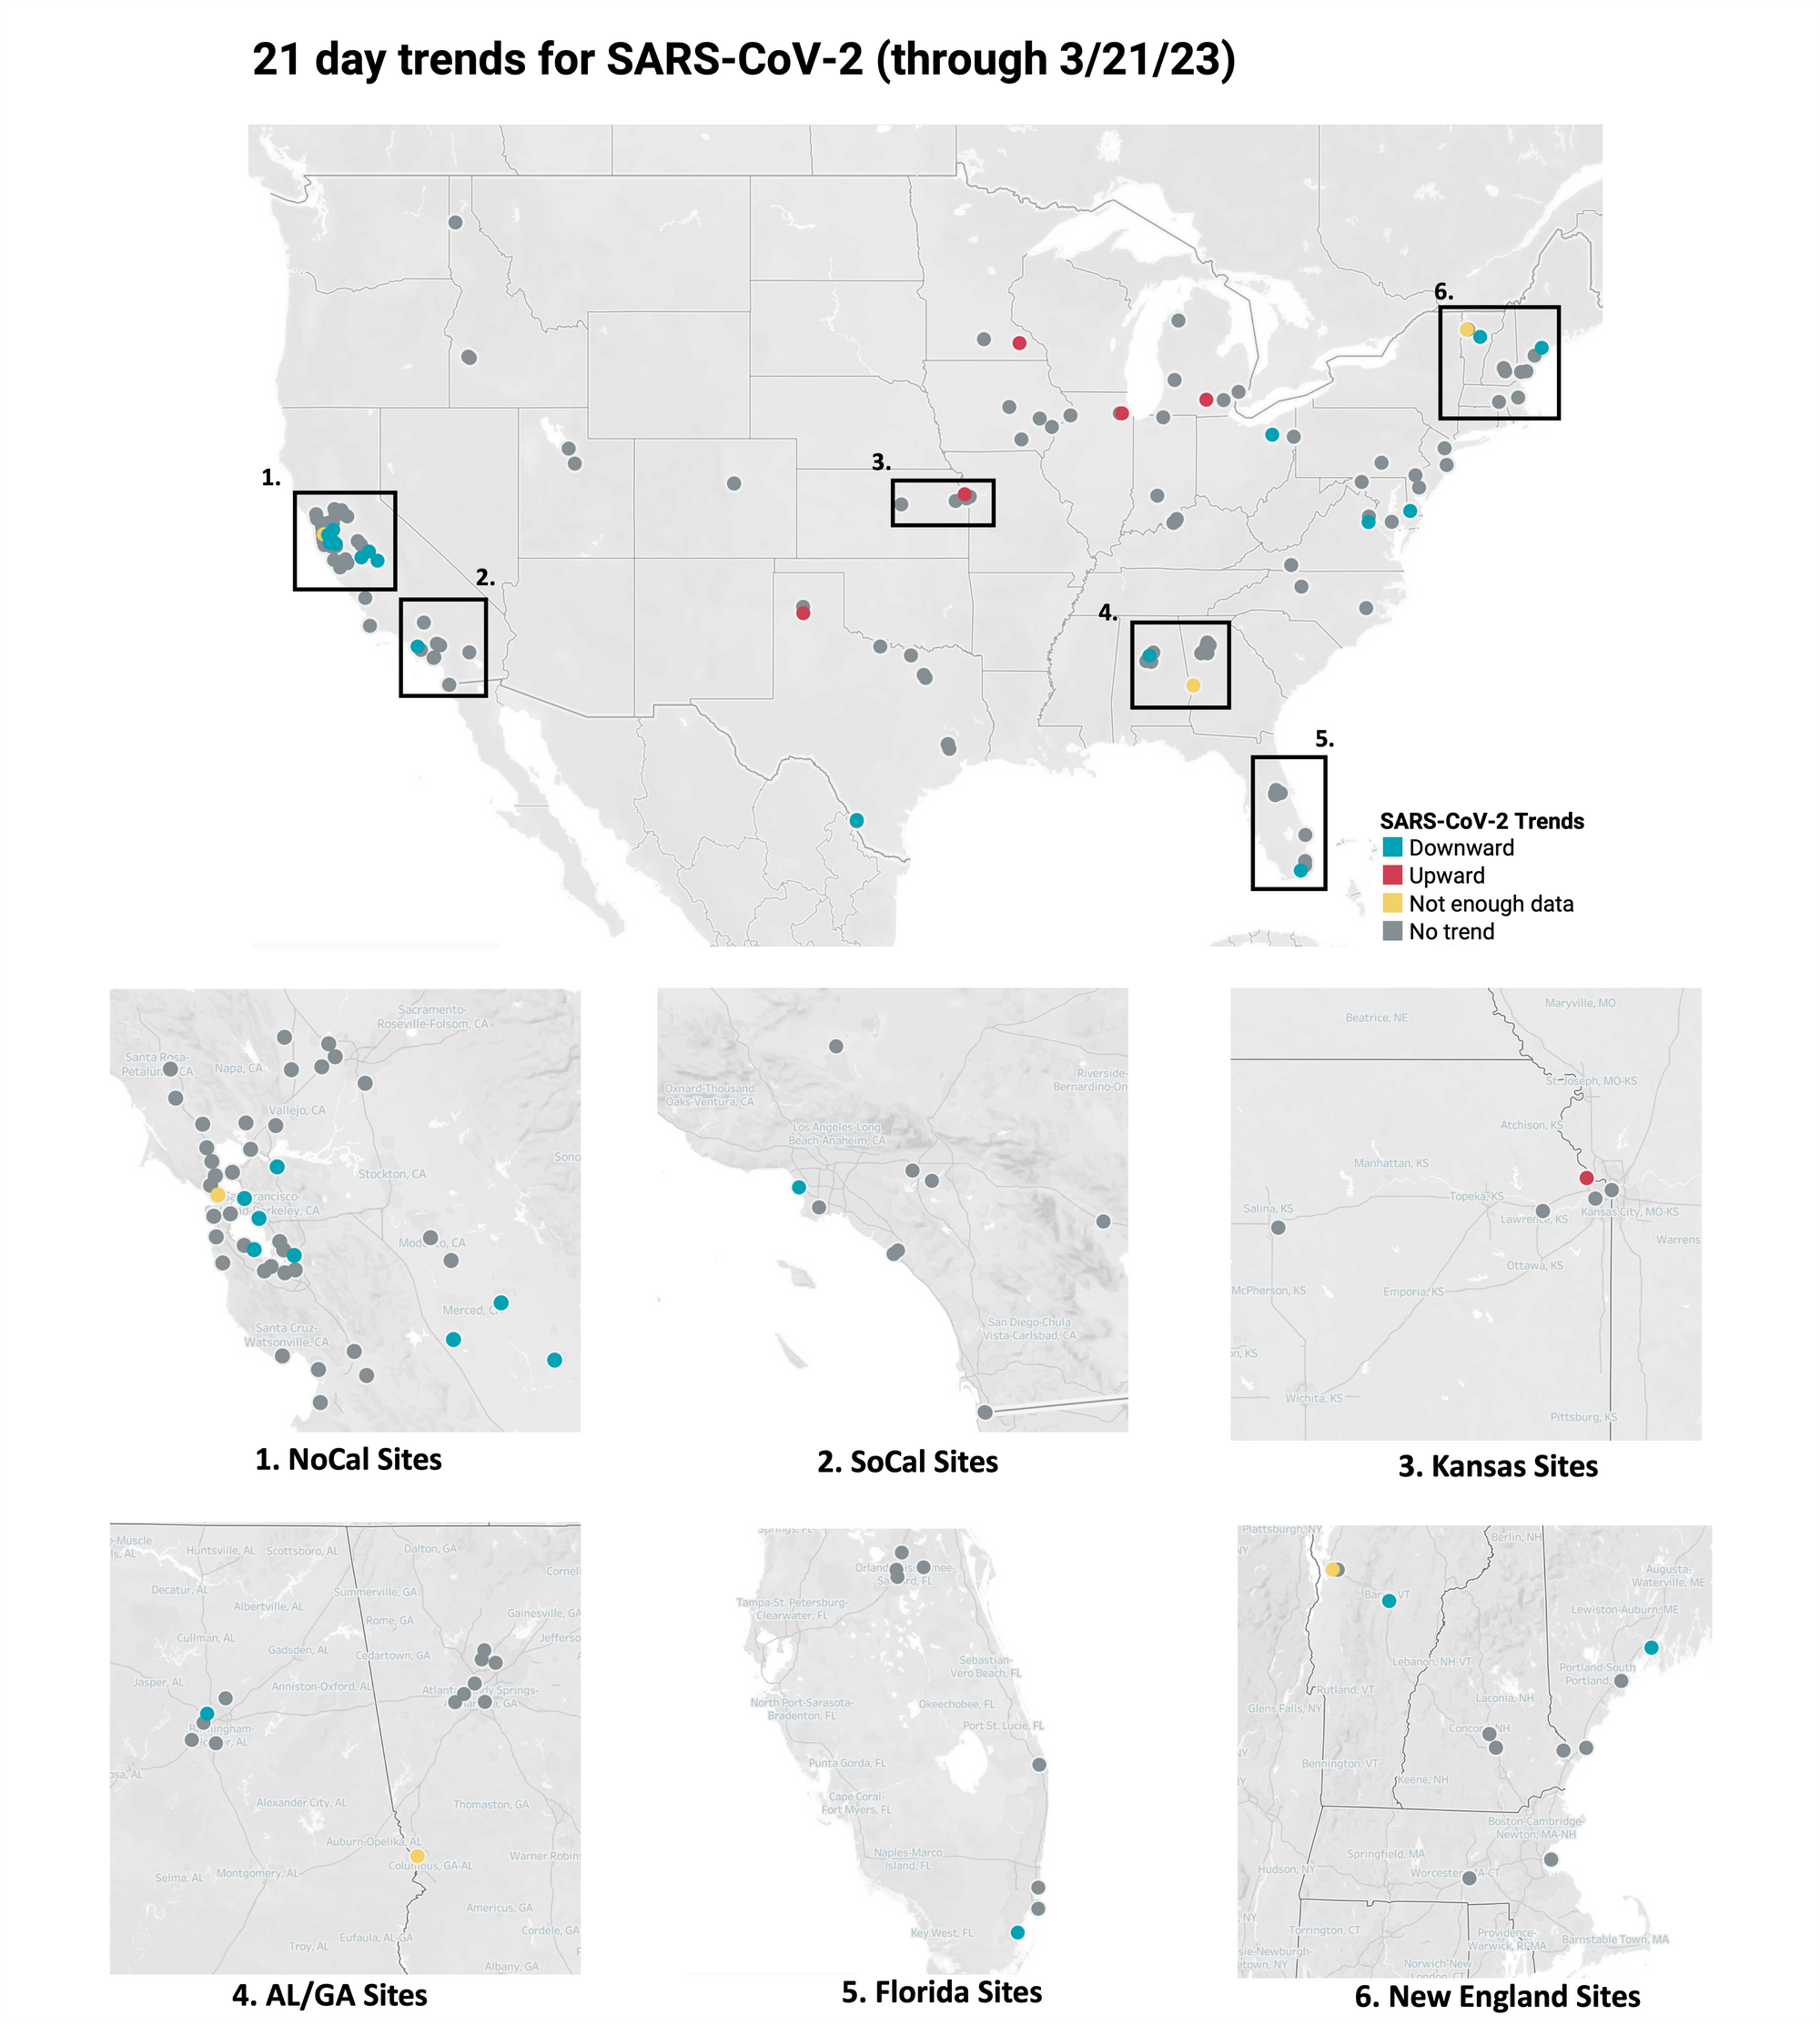
Below is the trend analysis for the SARS-CoV-2 RNA concentrations (N gene concentrations normalized by PMMoV) in wastewater solids at all participating plants. Red indicates a significant upward trend, blue is a significant downward trend, and dark grey is no trend. Yellow indicates that there were not enough data points to calculate a trend (we required 3 points over the last 21 days). You can read about our methods for trend analysis here. In short, we test for linear trends between log10-transformed concentration (target/PMMoV) and time; the trend must be classified as statistically significant (p<0.1). Of the 148 sites, 5 show an upward trend, 123 show no trend, and 17 show a decreasing trend. The remaining 3 do not have enough data to calculate a trend. This can be interpreted to mean that over the last 21 days, that concentrations of SARS-CoV-2 have generally not changed at most sites.
Influenza Trends
21-day nationwide wastewater trends
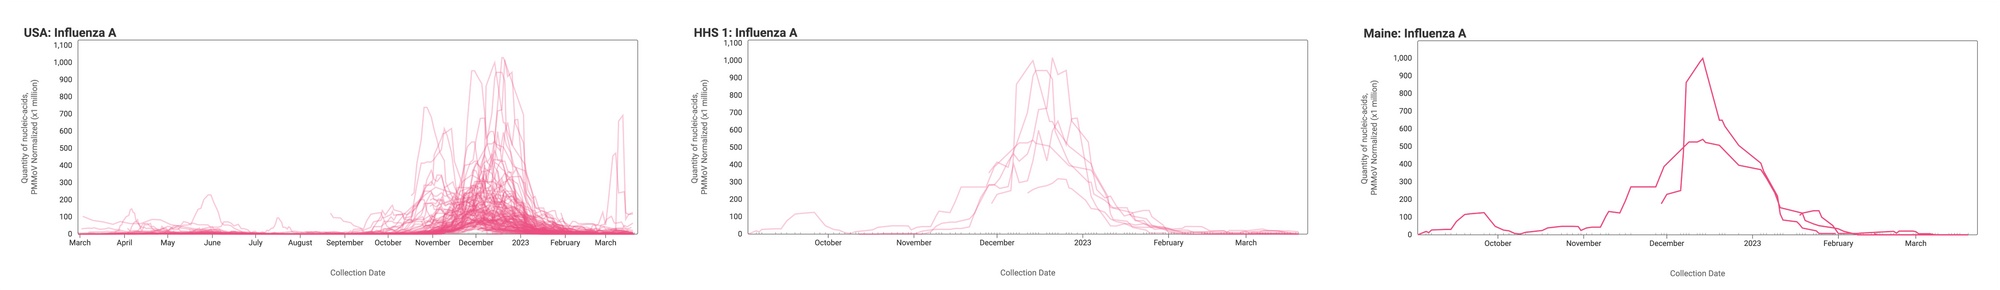
Influenza A (IAV) RNA concentrations (normalized by PMMoV) are generally lower now than they were at the height of Influenza A cases earlier this winter at most sites. The median concentration across all sites over the last 21 days is 0 copies/gram (non-detect). Examples below are from all participating sites across the nation (left panel), HHS Region 1 representing the Northeast (middle panel), and Maine (right panel).
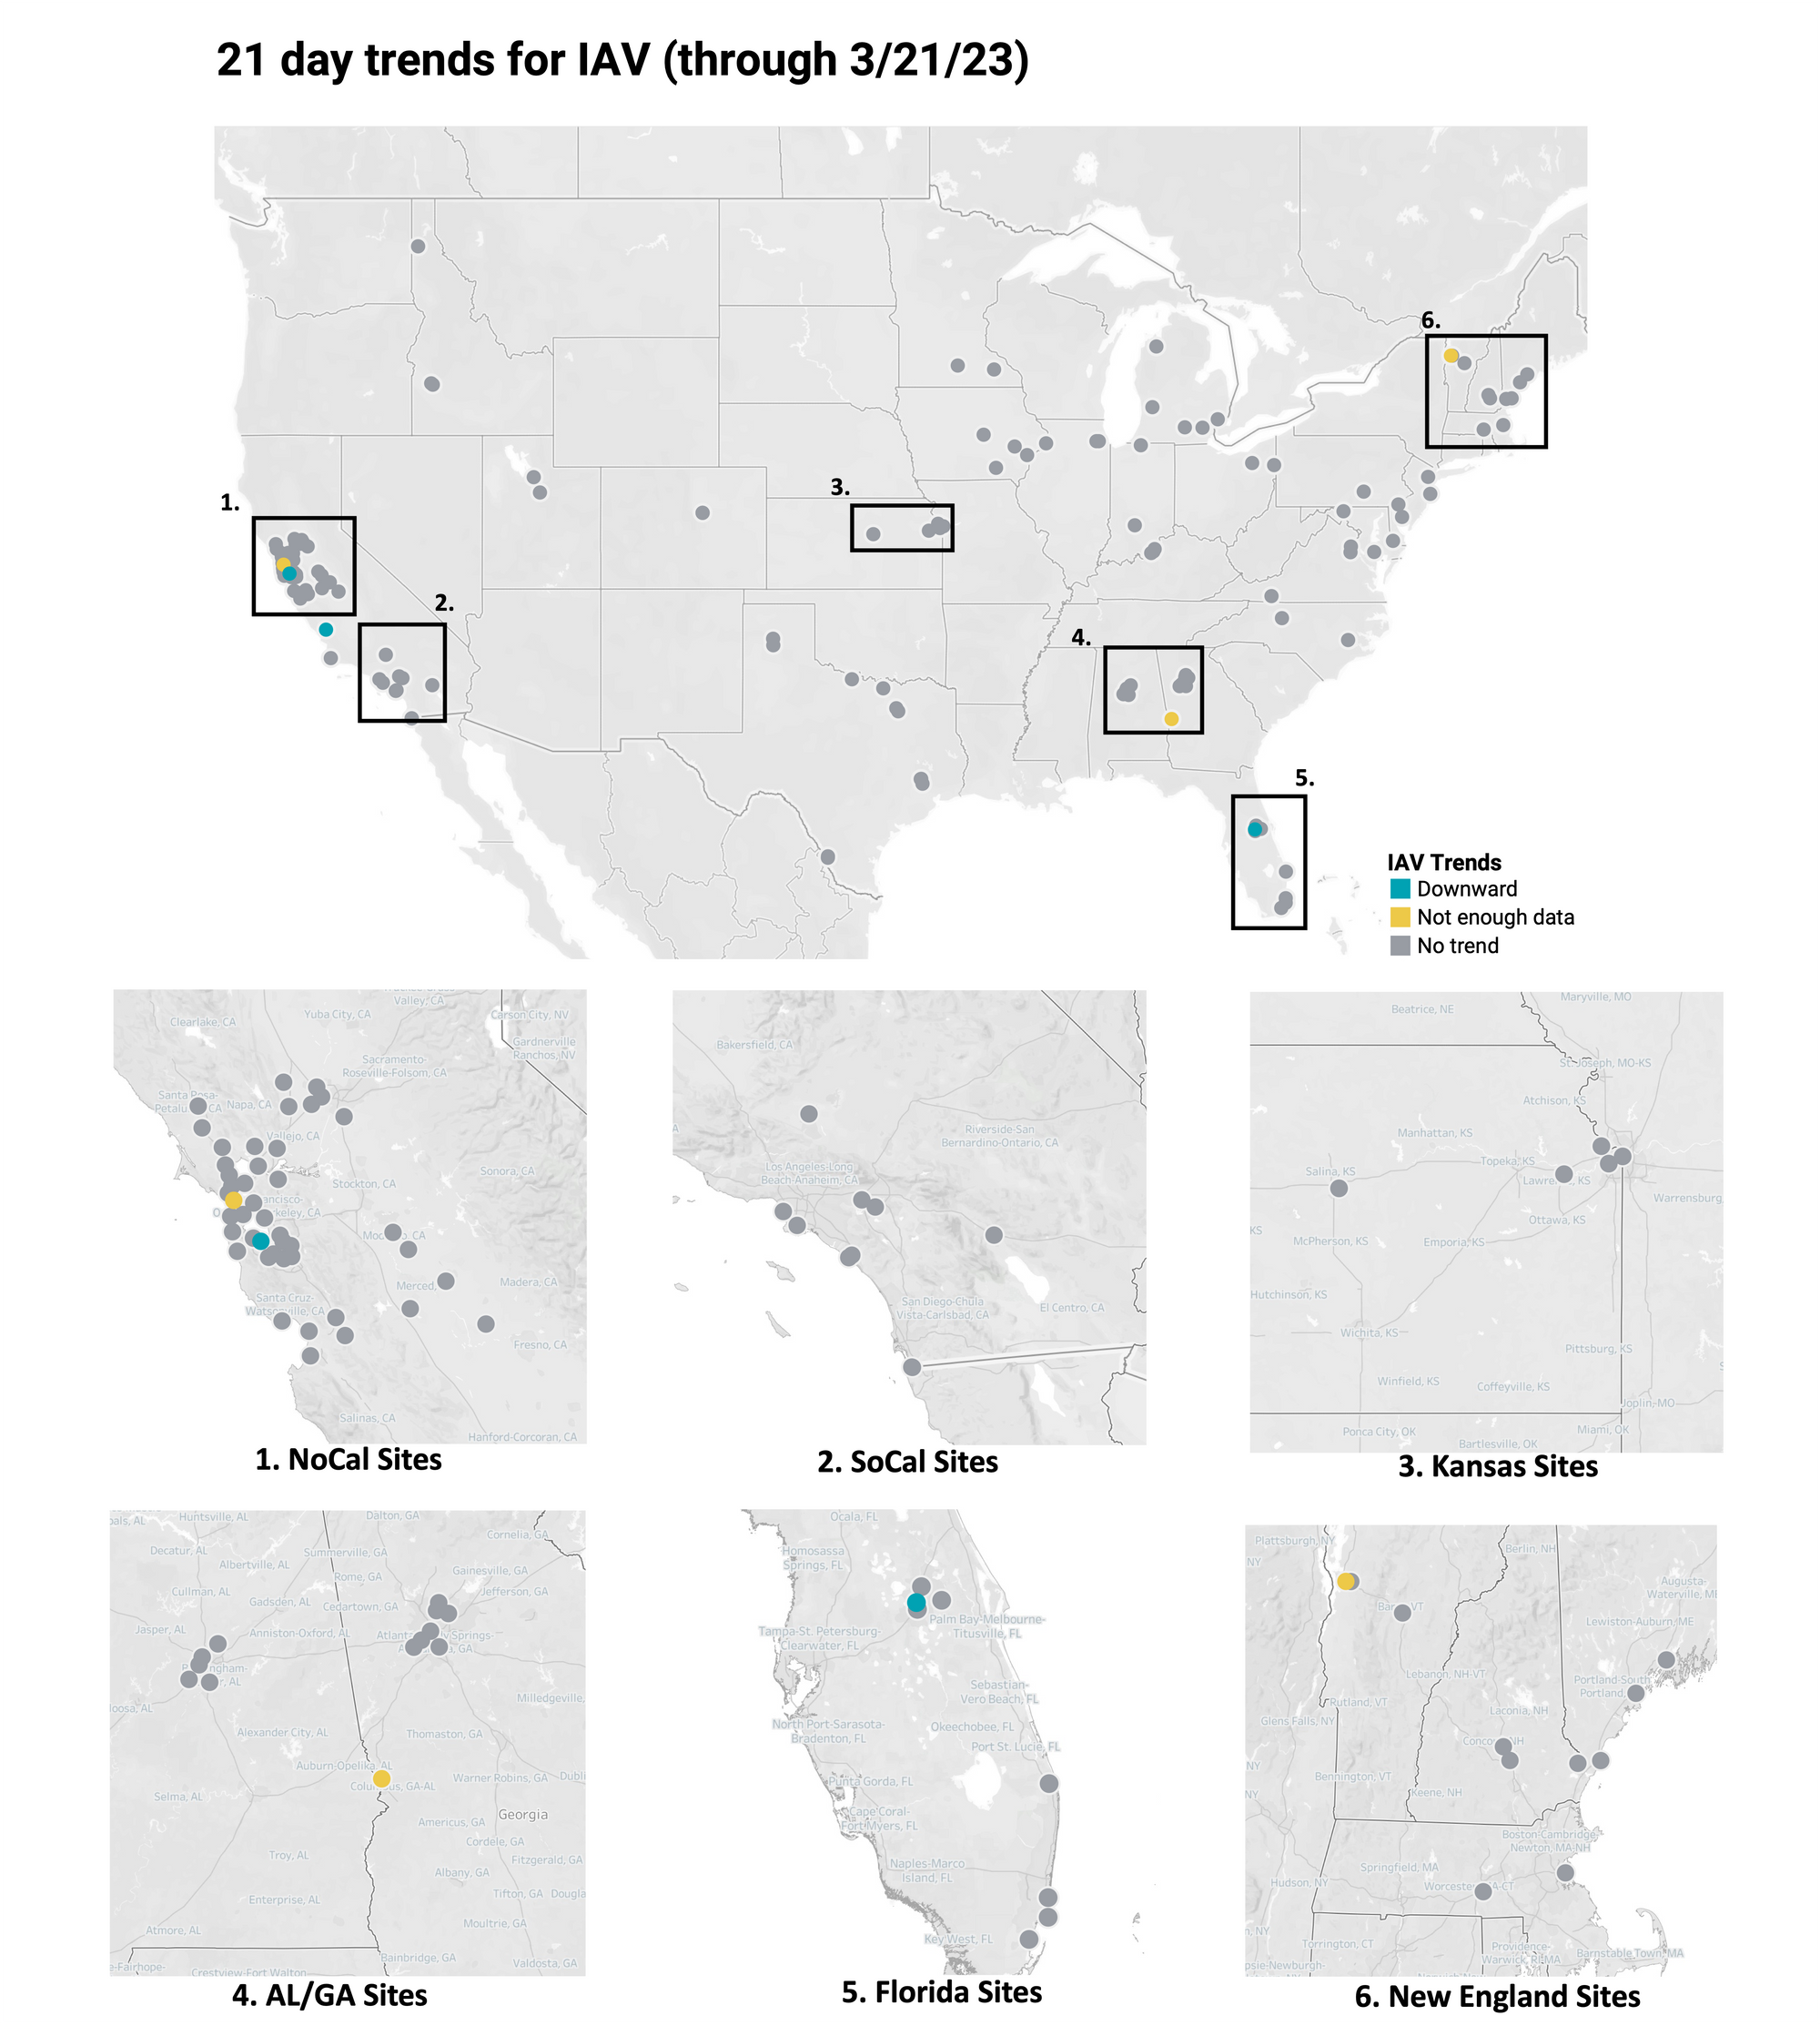
Below is the trend analysis for the IAV RNA concentrations (normalized by PMMoV) in wastewater solids at all participating plants. Red indicates a significant upward trend, blue is a significant downward trend, and dark grey is no trend. Yellow indicates that there were not enough data points to calculate a trend. Of the 148 sites, 0 shows an upward trend, 142 show no trend, and 3 show a decreasing trend. The remaining 3 do not have enough data to calculate a trend.
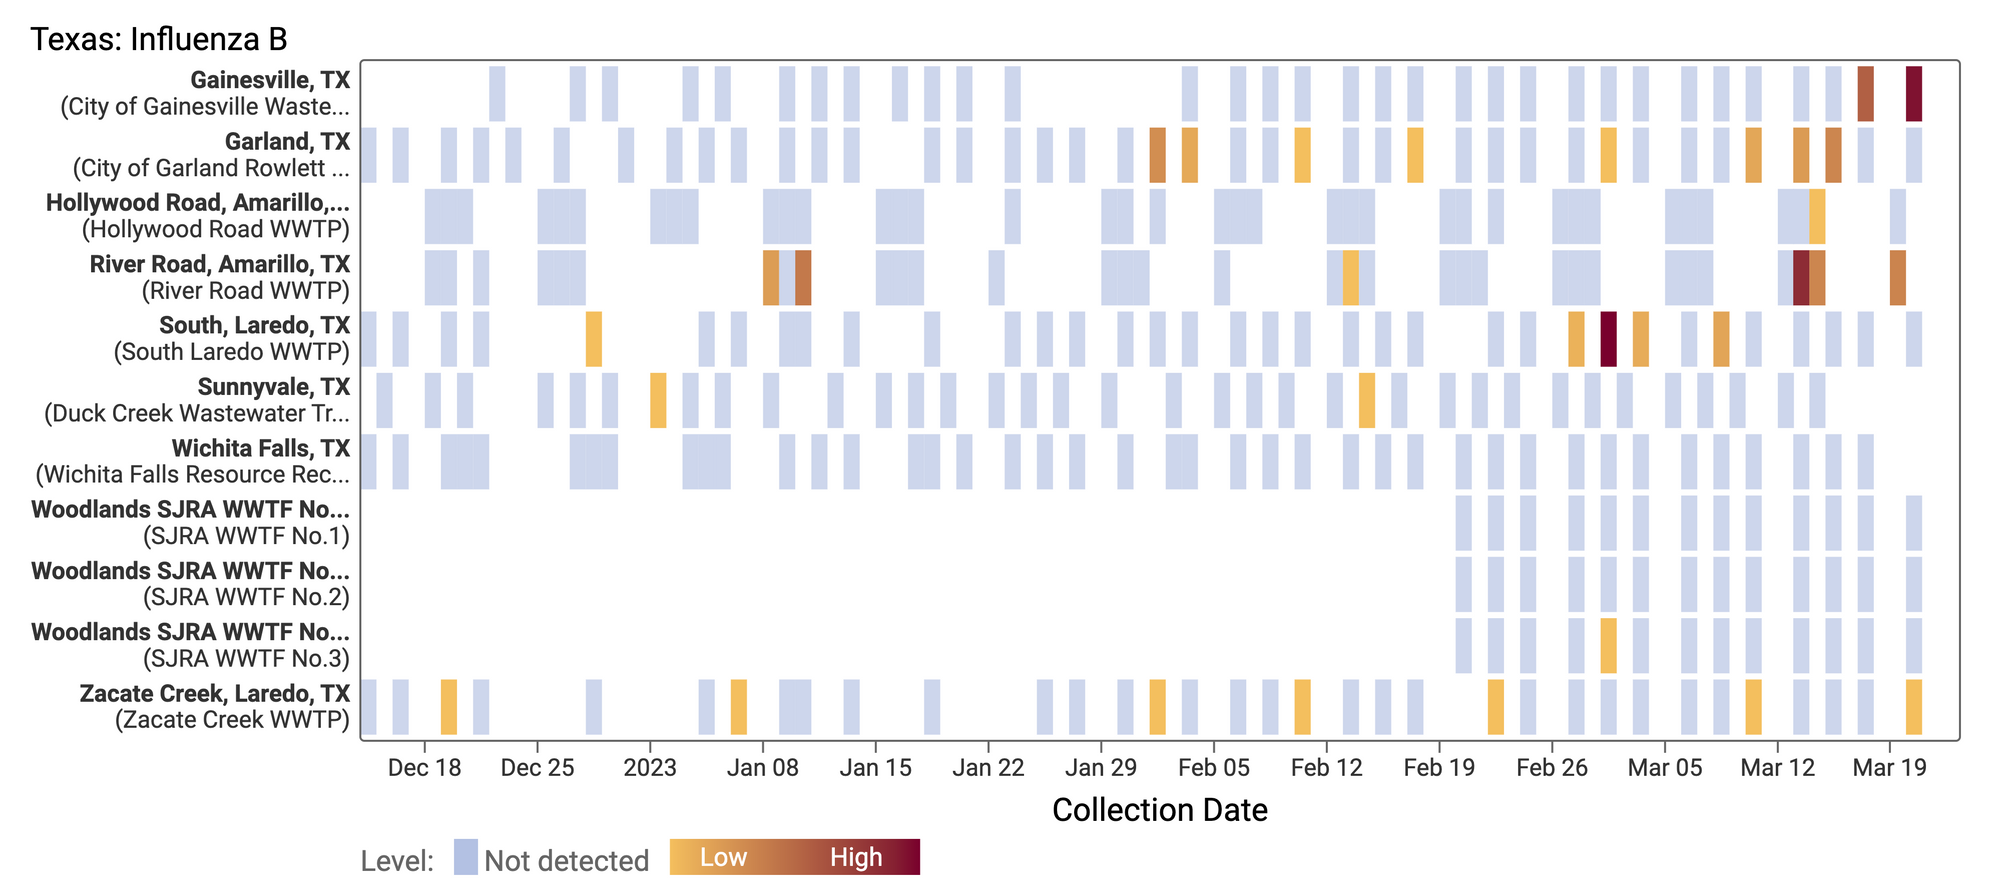
Influenza B (IBV) RNA concentrations are mostly non-detect at WWSCAN sites. There have only been 202 positive samples out of 1,286 samples during the past 21 days. Below is a heat map showing IBV detections at all the plants in WWSCAN in Texas. Each location is a row, and the date is a column. White indicates no sample, blue indicates non-detect, and the orange to red show variable concentrations if IBV. You can see how IBV RNA is rarely detected since we began measuring it in mid December 2022 at these sites.
RSV Trends
21-day nationwide wastewater trends
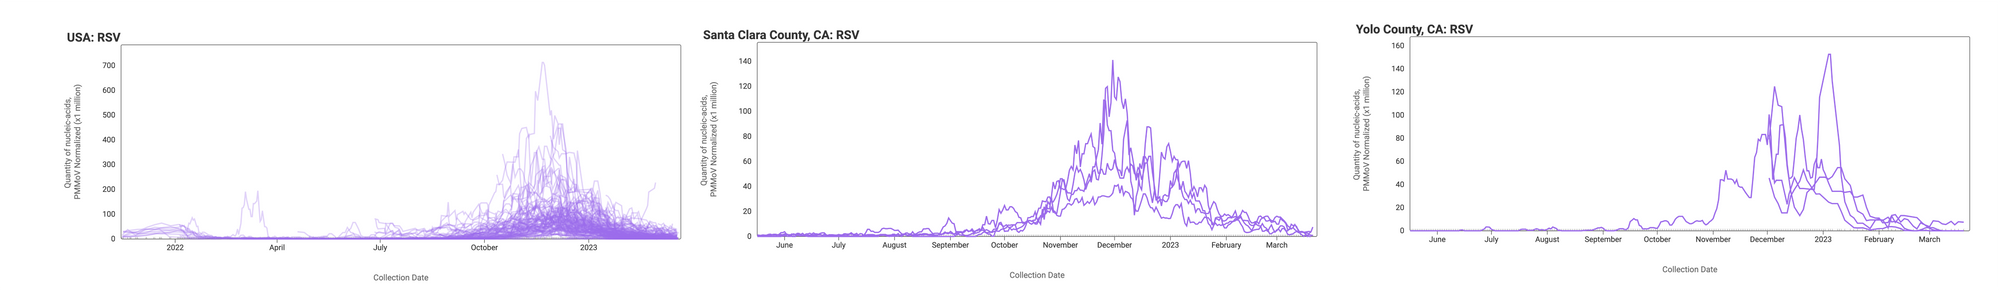
RSV RNA is still detectable in wastewater solids at participating sites, suggesting continued inputs into the wastewater system by RSV shedders. The median concentration across all sites over the last 21 days is 2,121 copies/gram. This is distinct to what we are seeing with influenza A, where the most common result from tests is non-detect. Examples below are from all participating sites across the country (left panel), Santa Clara County, CA (middle panel), and Yolo County, CA (right panel).
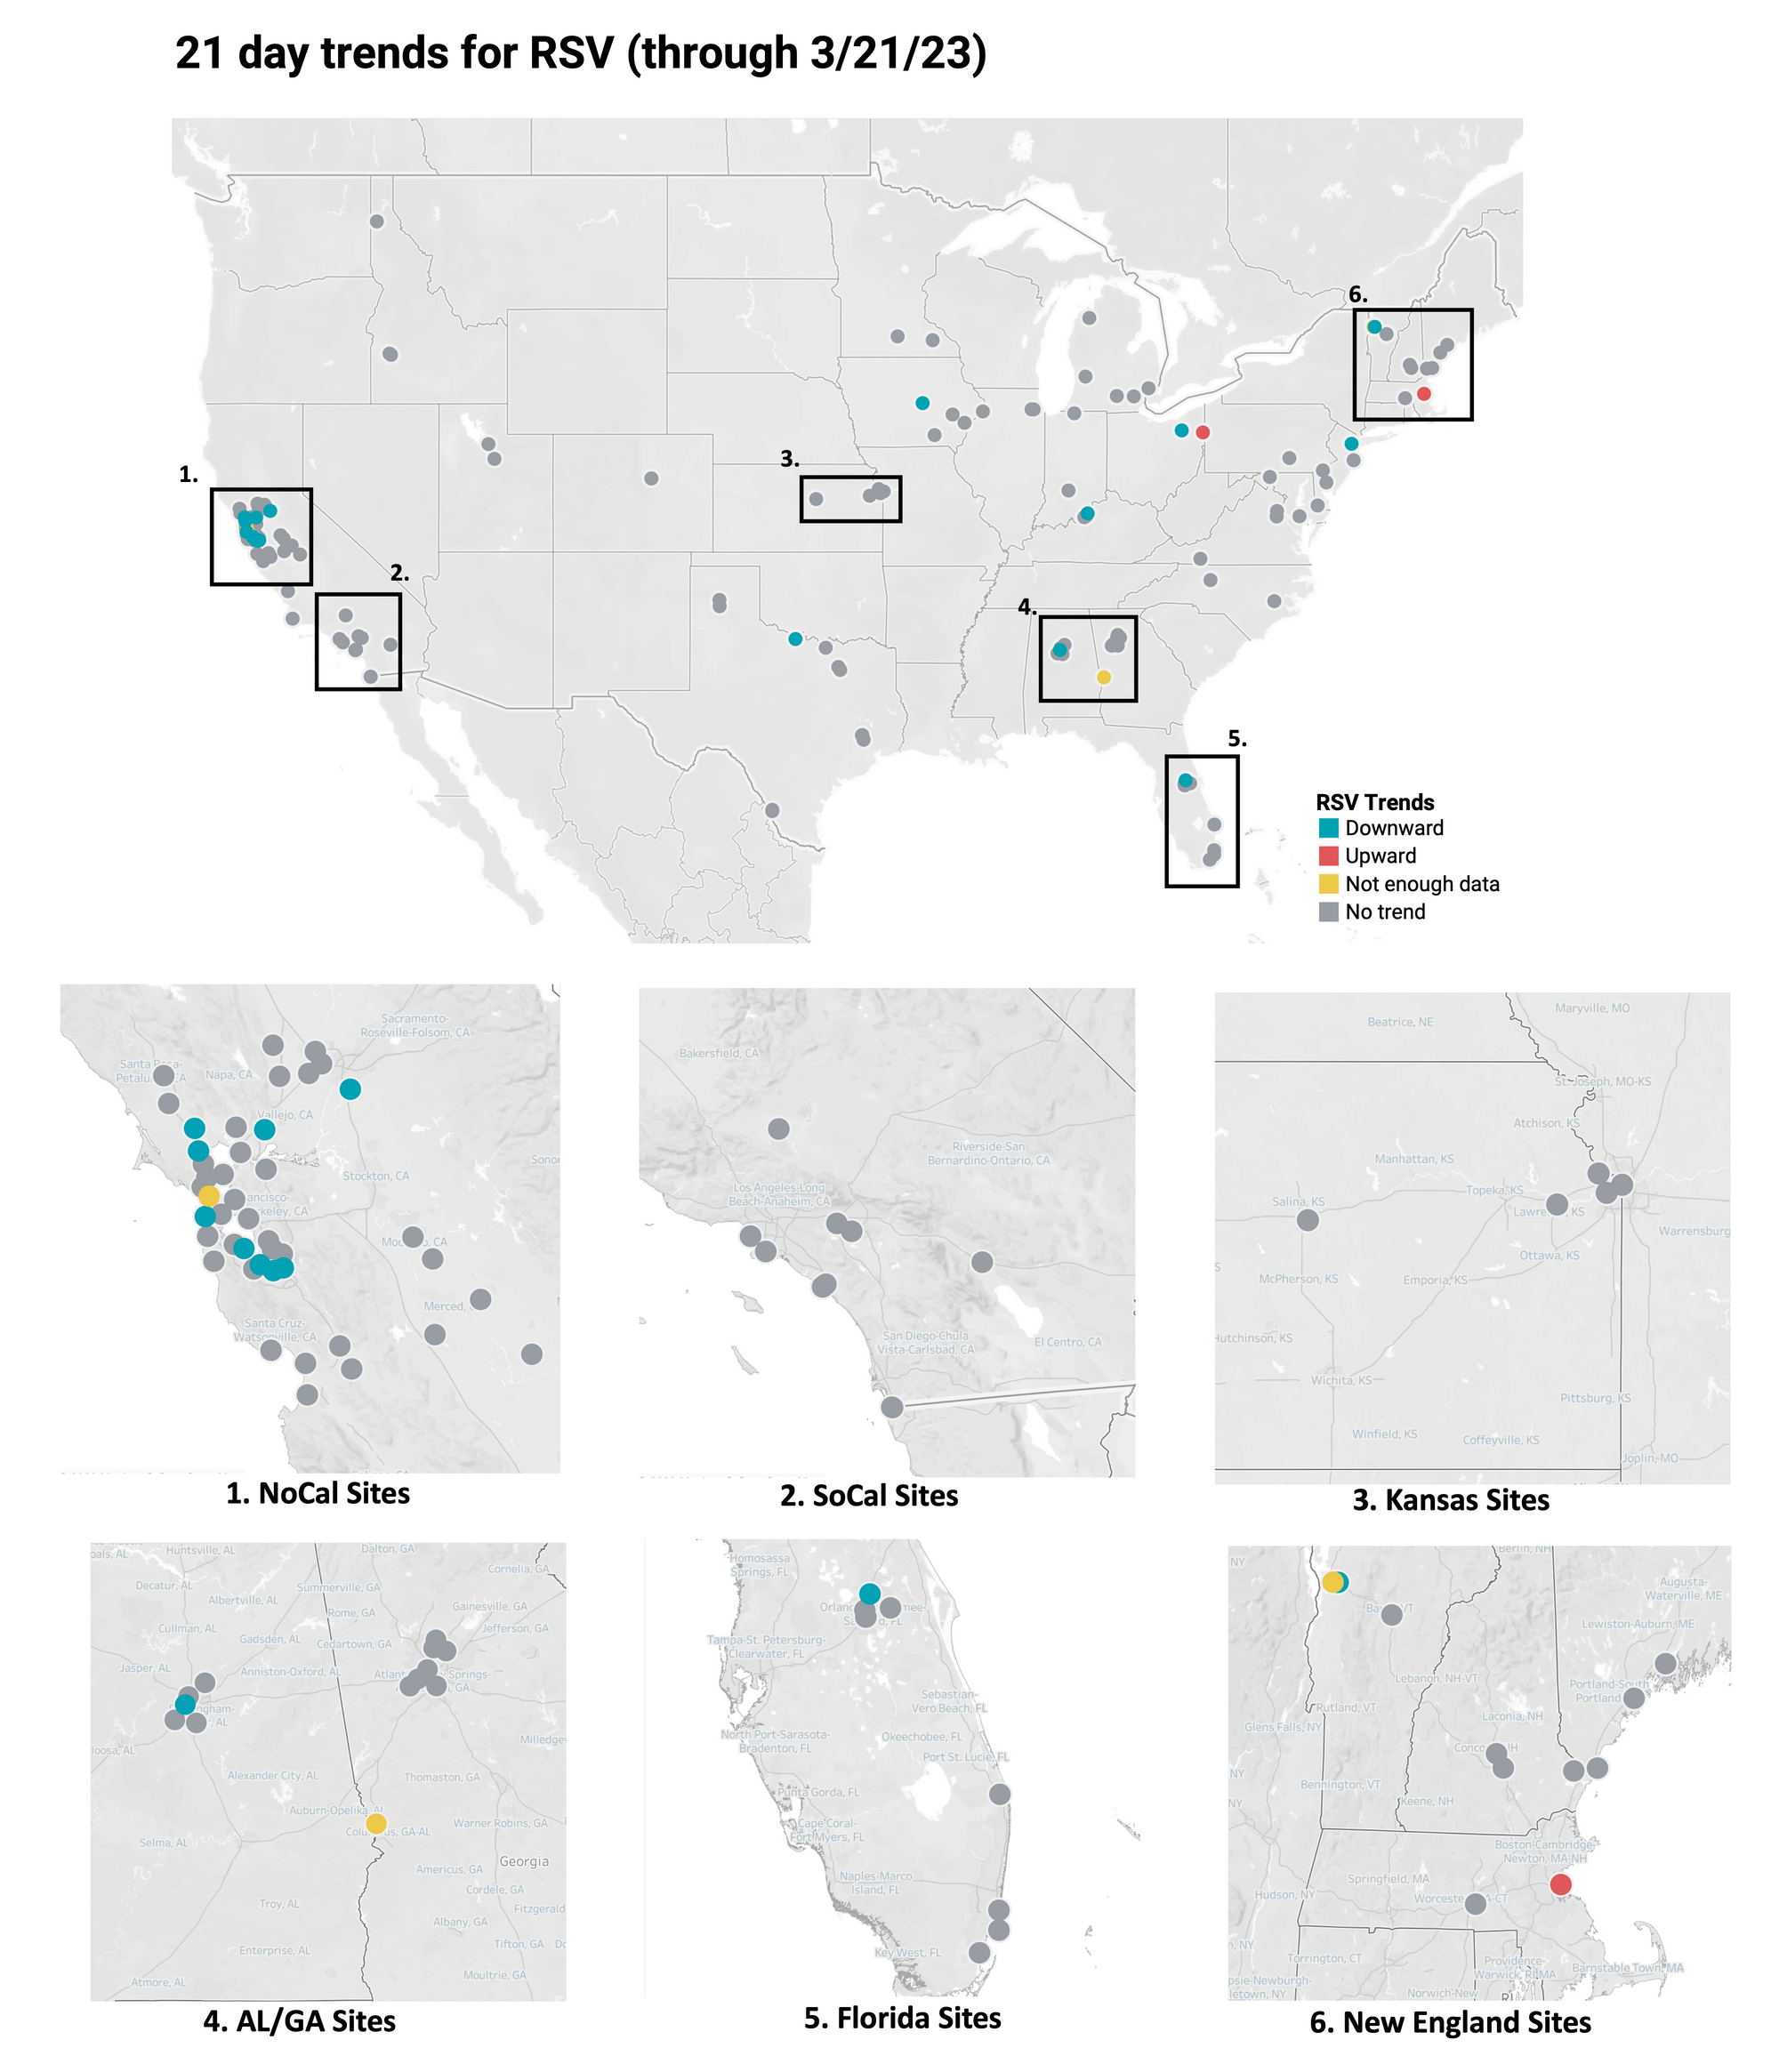
Below is the trend analysis for the RSV RNA concentrations (normalized by PMMoV) in wastewater solids at all participating plants. Red indicates a significant upward trend, blue is a significant downward trend, and dark grey is no trend. Yellow indicates that there were not enough data points to calculate a trend. Of the 148 sites, 2 show an upward trend, 126 show no trend, and 17 show a decreasing trend. The remaining 3 do not have enough data to calculate a trend.
HMPV Trends
21-day nationwide wastewater trends
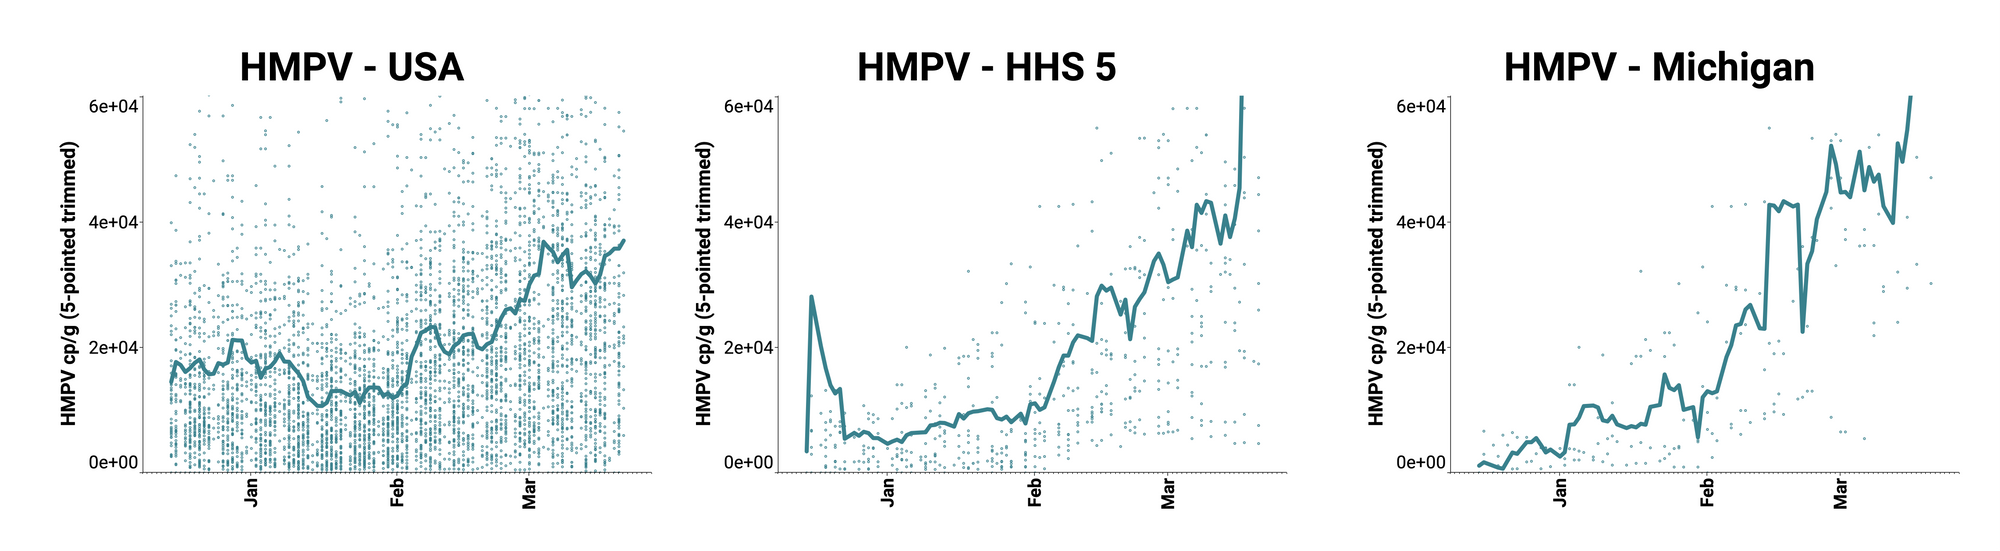
Human metapneumovirus (HMPV) RNA is consistently detected at WWSCAN sites. The median concentration across all sites over the last 21 days is 20,239 copies/gram. Examples below show HMPV RNA at participating sites across the country (left panel), HHS Region 5 representing the Midwest (middle panel), and Michigan (right panel). In these charts, we show the raw data (HMPV RNA copies/gram) with a population-weighted average line. As opposed to RSV and IAV RNA, which show declining trends and / or low levels, here the weighted average lines in these plots is increasing and levels are relatively high. (Note we are planning to add population weighted average lines like these to our website plots soon!)
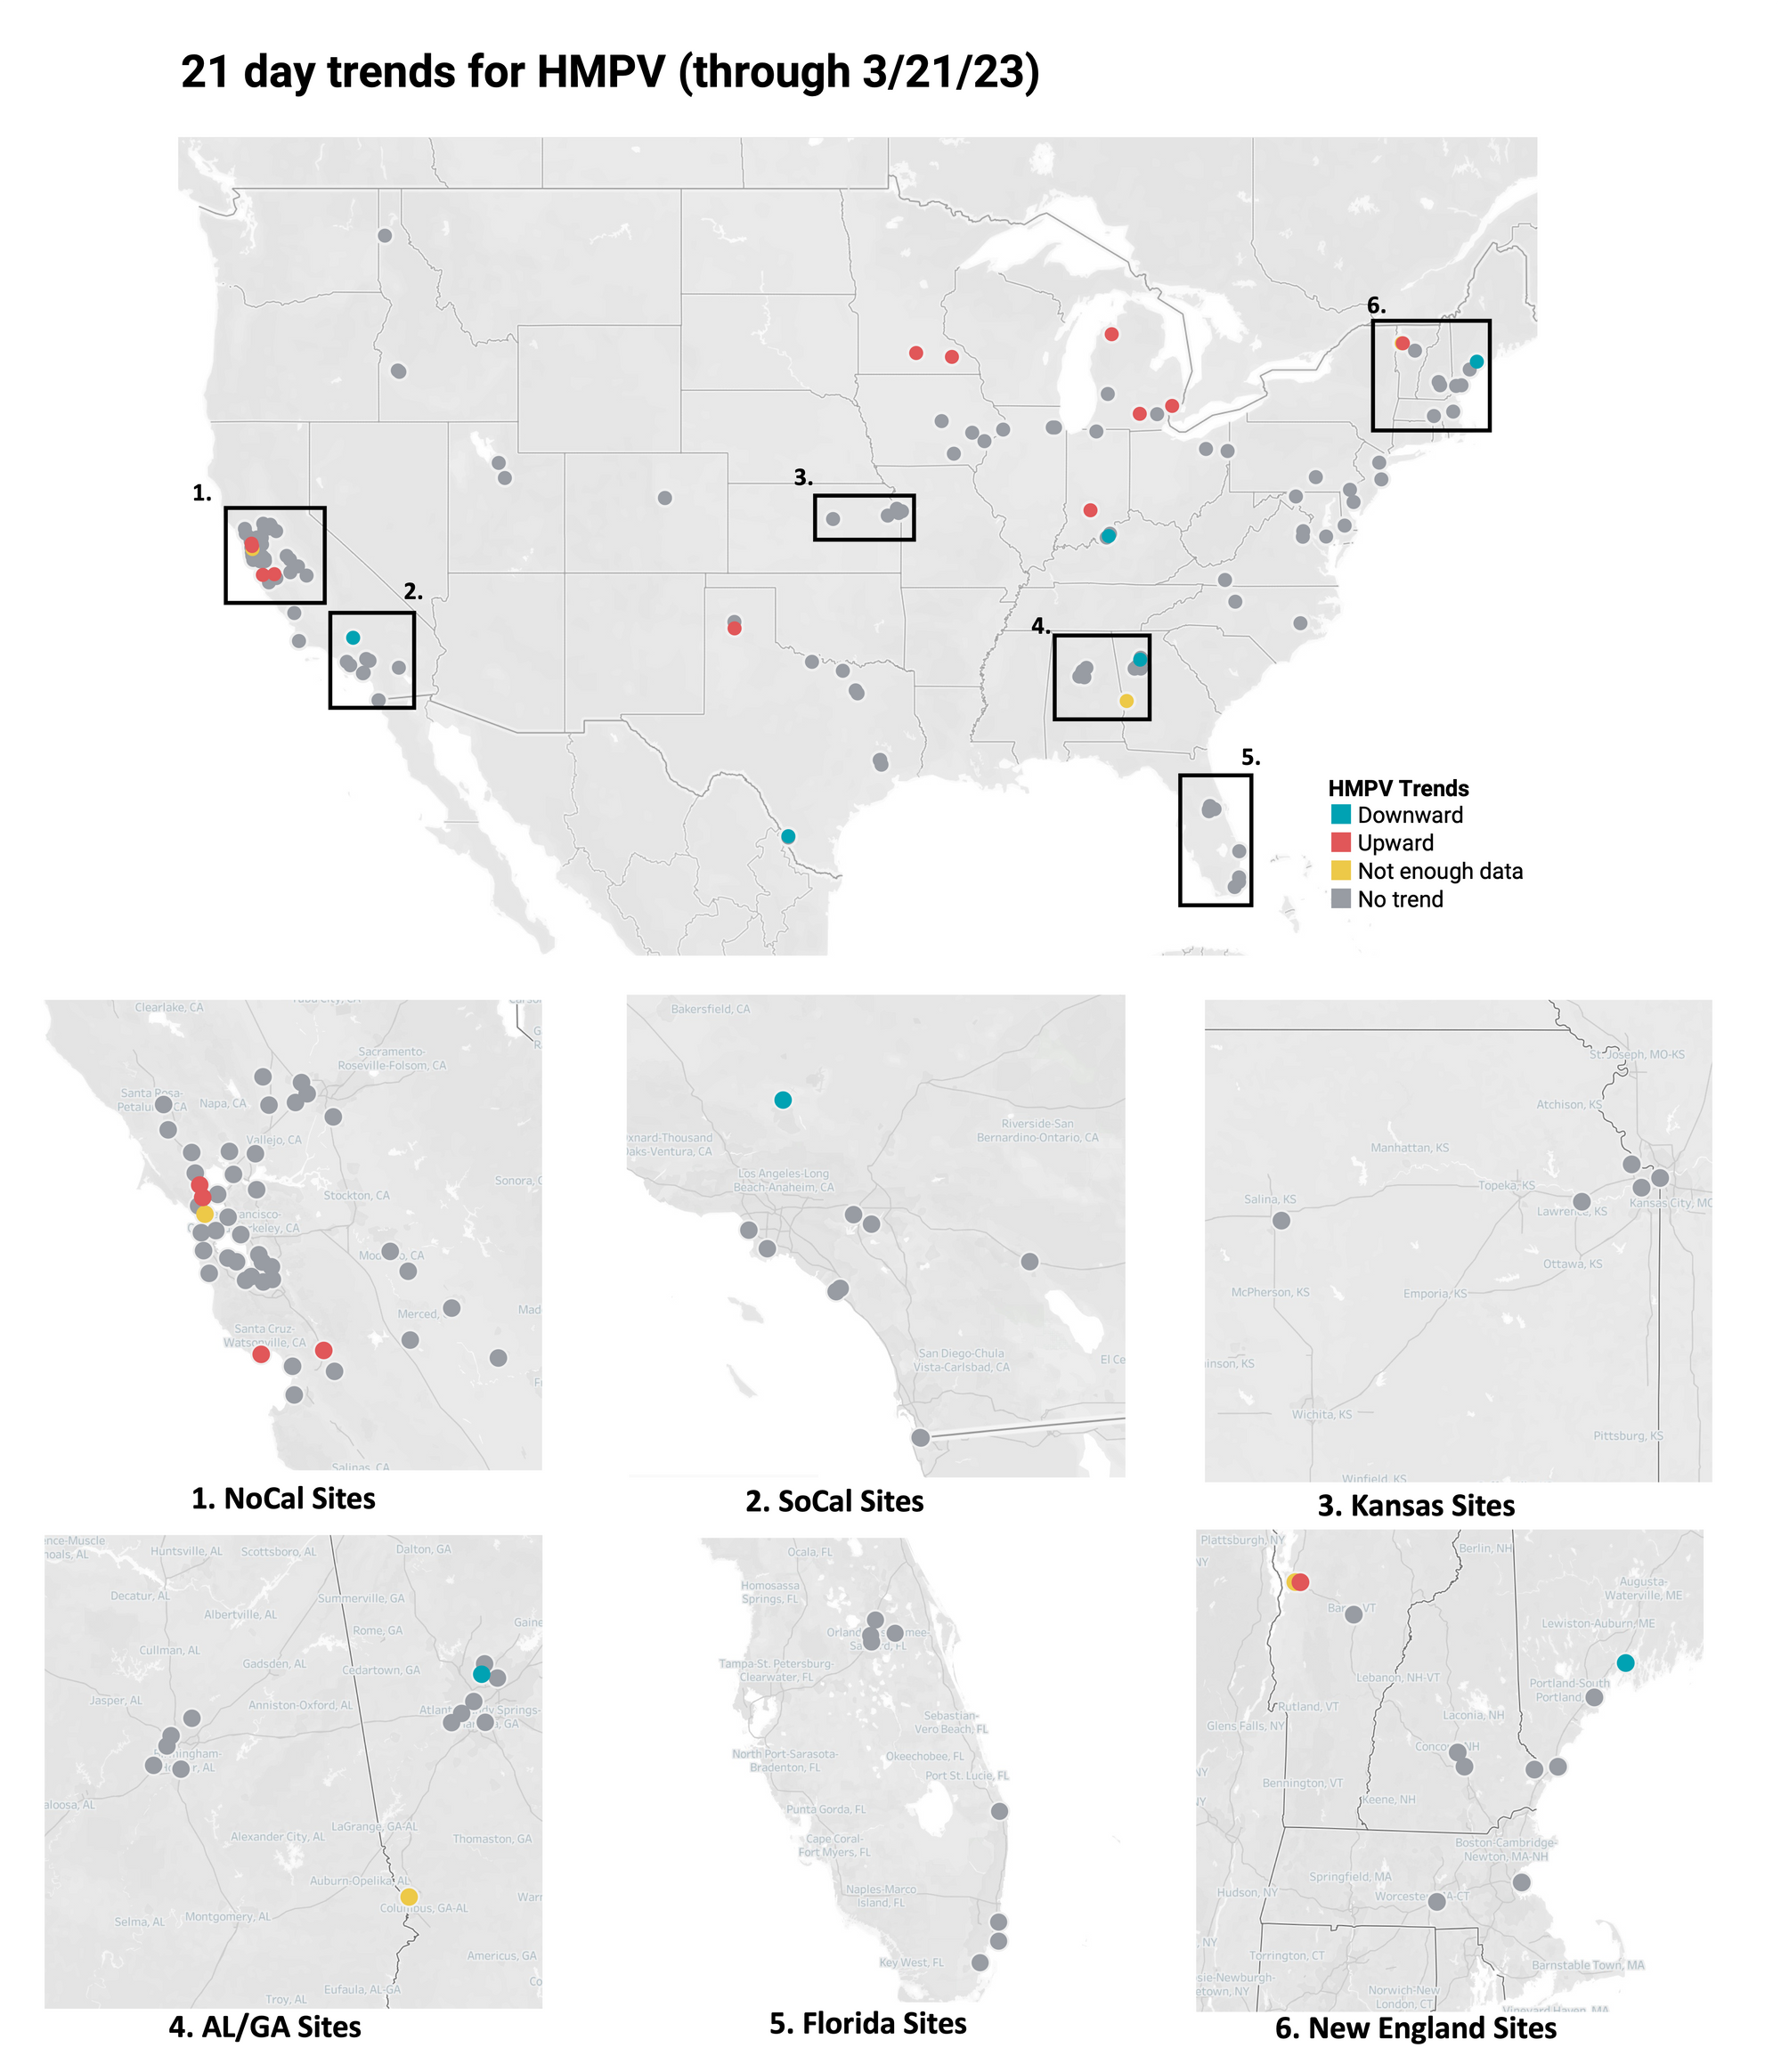
Below is the trend analysis for the HMPV RNA concentrations (normalized by PMMoV) in wastewater solids at all participating plants. Red indicates a significant upward trend, blue is a significant downward trend, and dark grey is no trend. Yellow indicates that there were not enough data points to calculate a trend. Of the 148 sites, 12 show an upward trend, 128 show no trend, and 5 show a decreasing trend. The remaining 3 do not have enough data to calculate a trend.
HuNoV GII Trends
21-day nationwide wastewater trends
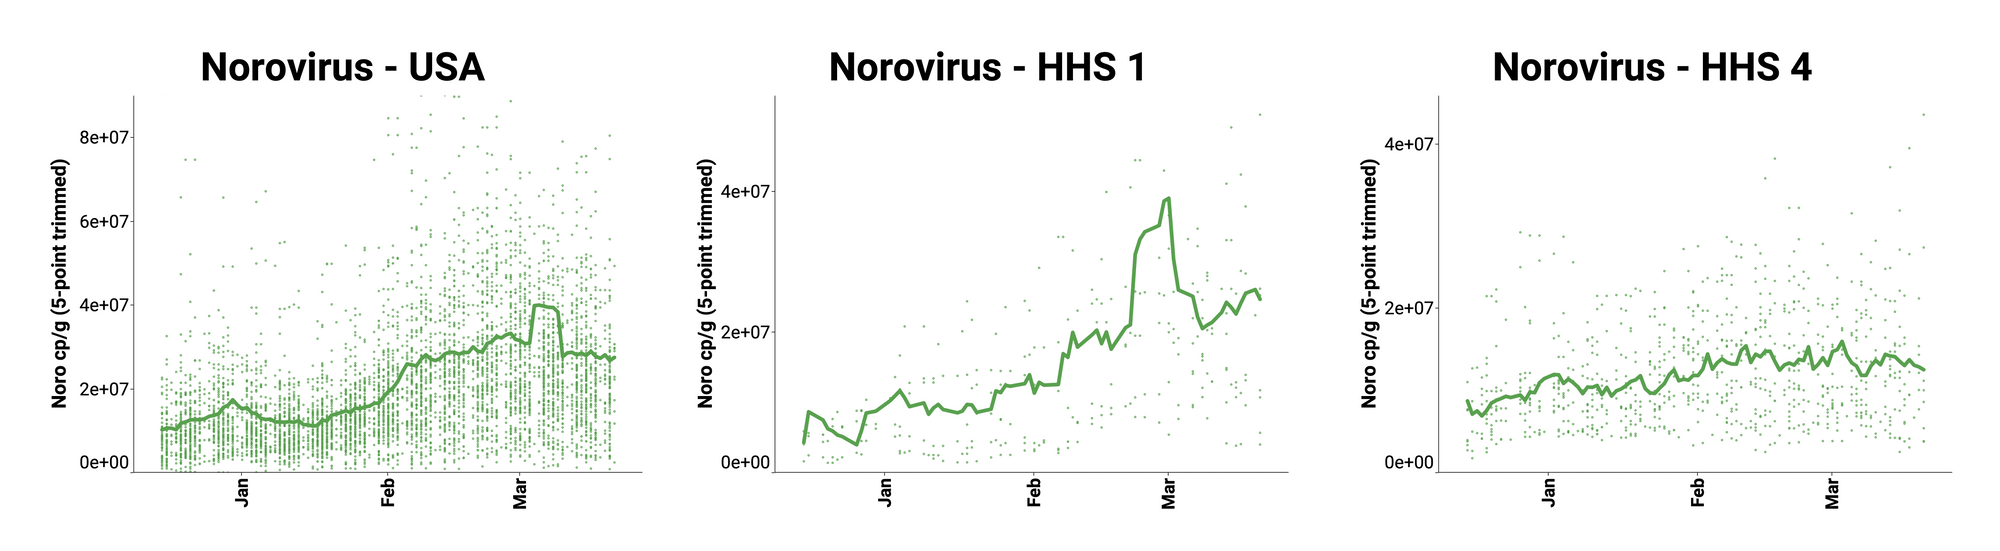
Norovirus GII (HuNoV GII) RNA has been consistently detected at the sites. The median concentration across all sites over the last 21 days is 21,740,868 copies/gram. Example charts showing concentrations (normalized by PMMoV) in wastewater solids below are from all participating sites across the country (left panel), HHS Region 1 representing the Northeast (middle panel), and HHS Region 4 representing the Southeast (right panel). In these charts, we show the raw data (HuNoV RNA copies/gram) with a population-weighted average line.
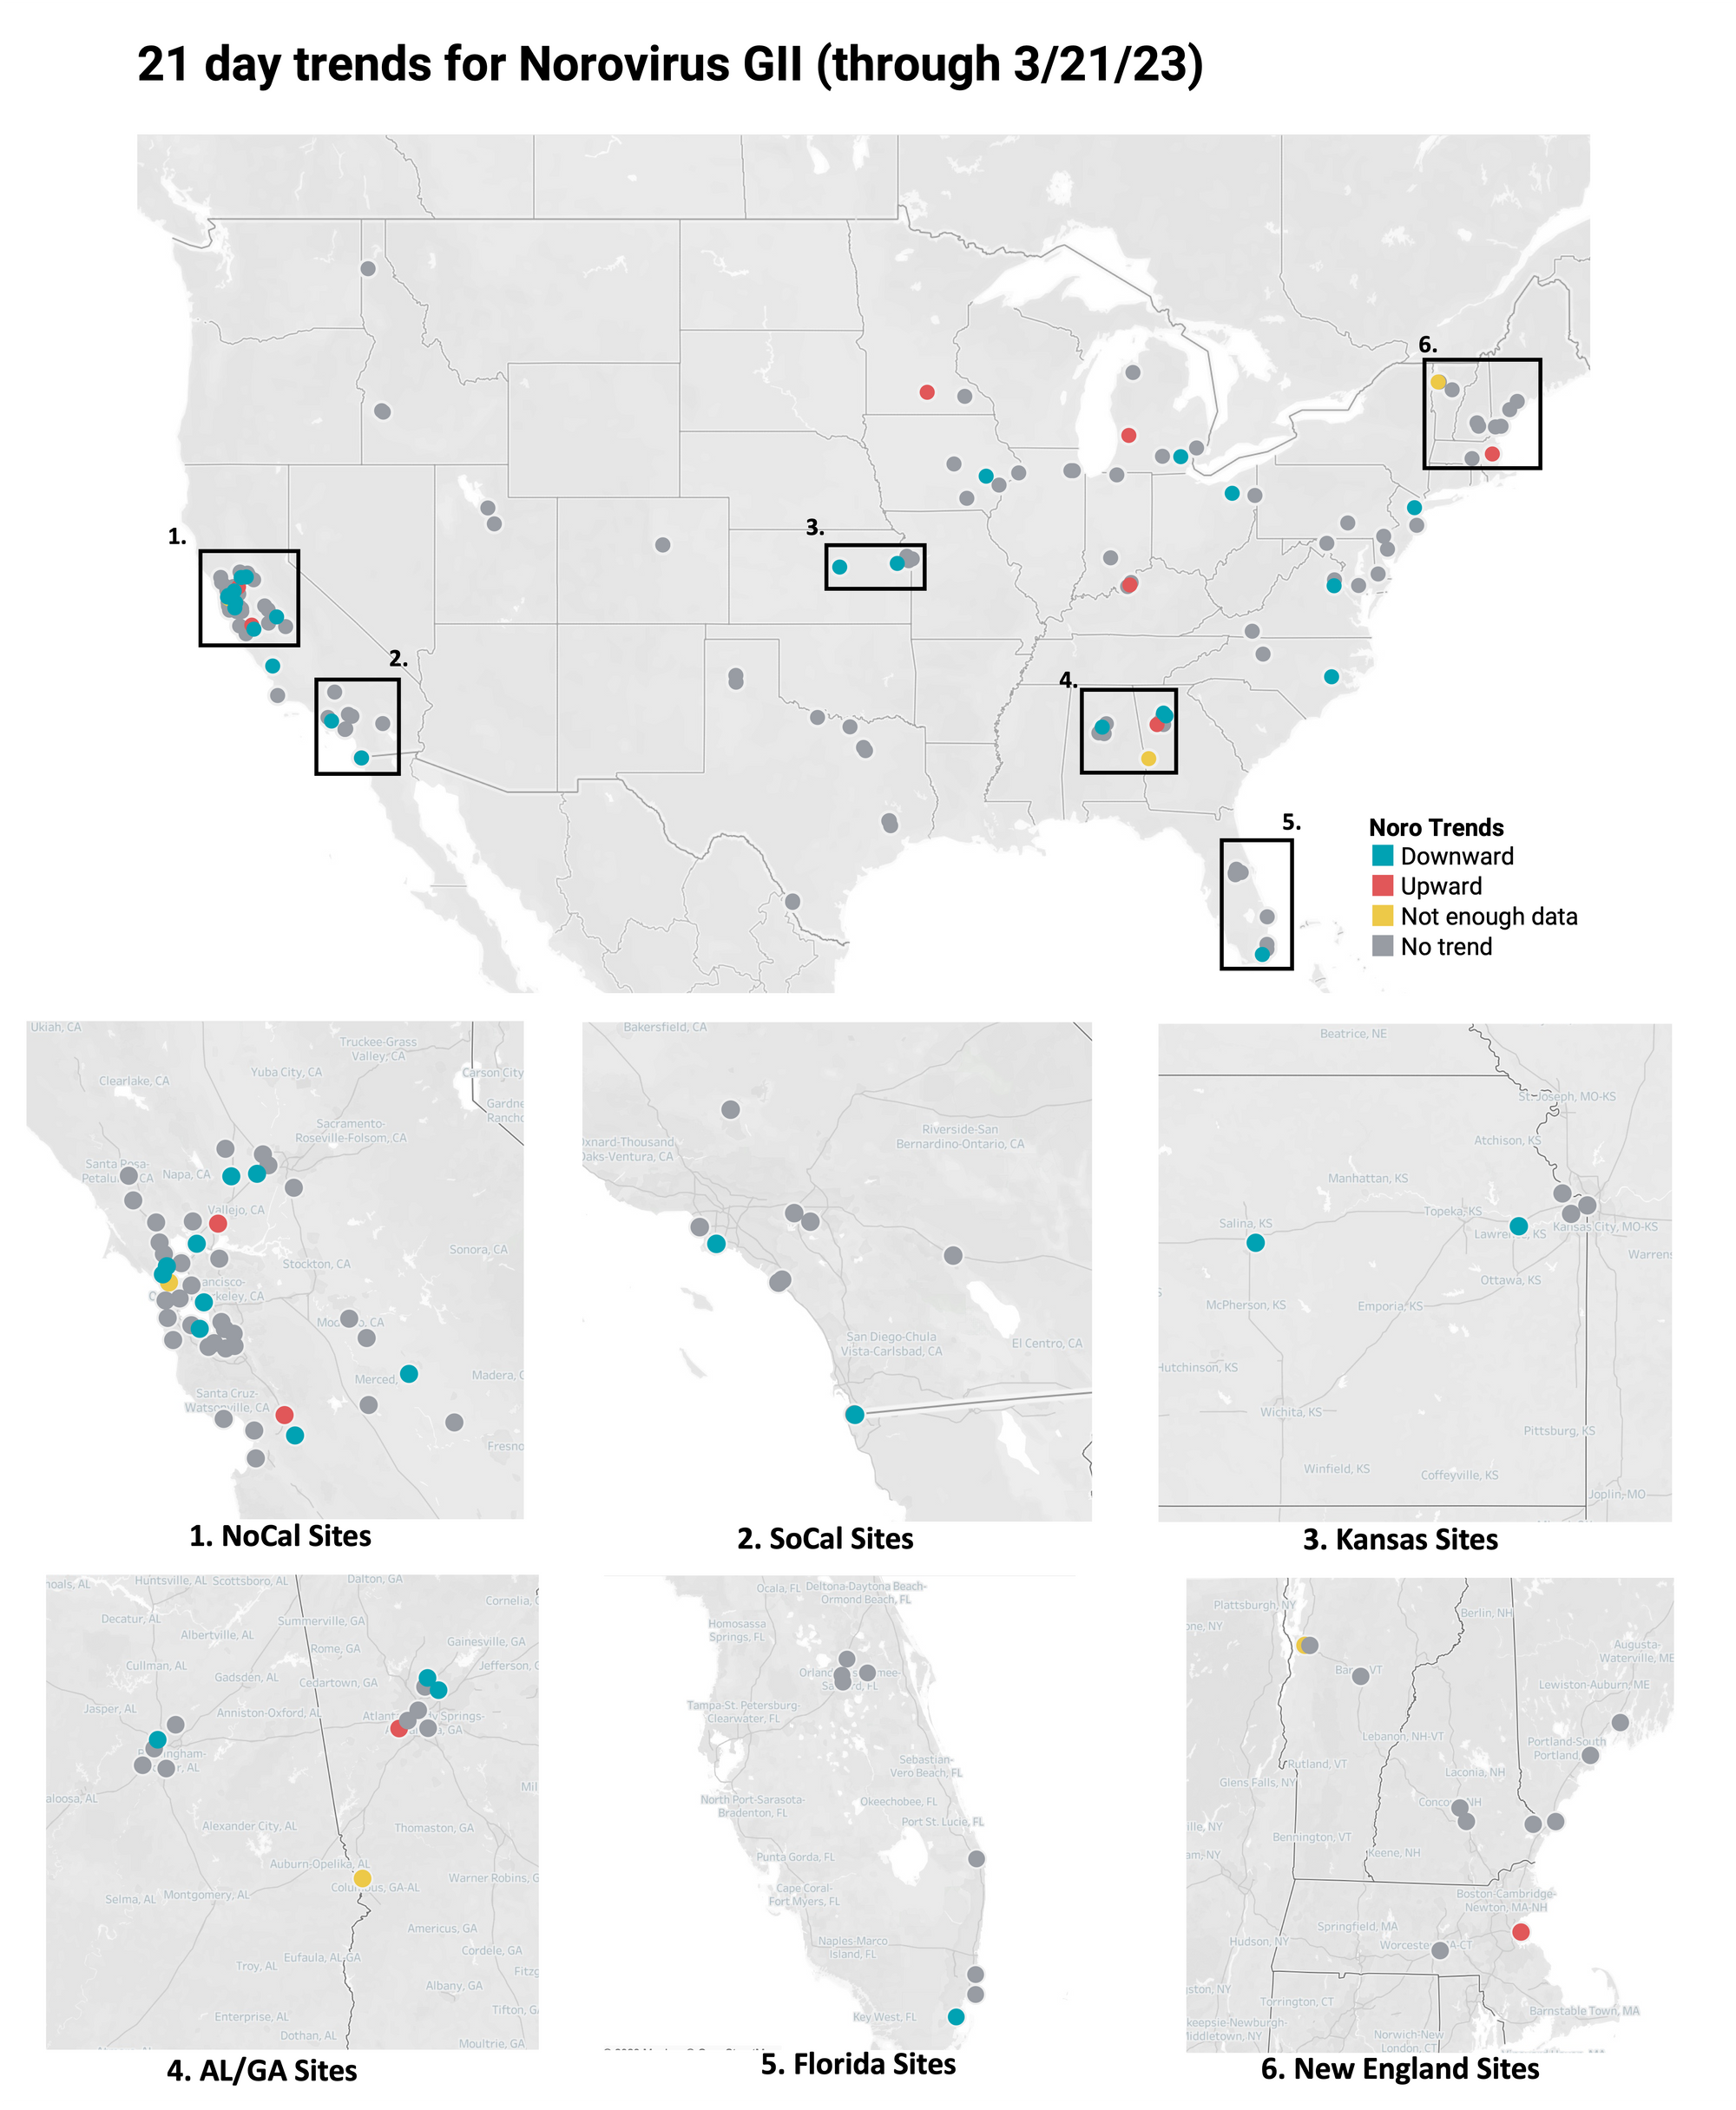
Below is the trend analysis for the Norovirus GII RNA concentrations (normalized by PMMoV) in wastewater solids at the plants. Red indicates a significant upward trend, blue is a significant downward trend, and dark grey is no trend. Yellow indicates that there were not enough data points to calculate a trend. Of the 148 sites, 7 show an upward trend, 114 show no trend, and 24 show a decreasing trend. The remaining 3 do not have enough data to calculate a trend.
Mpox virus Trends
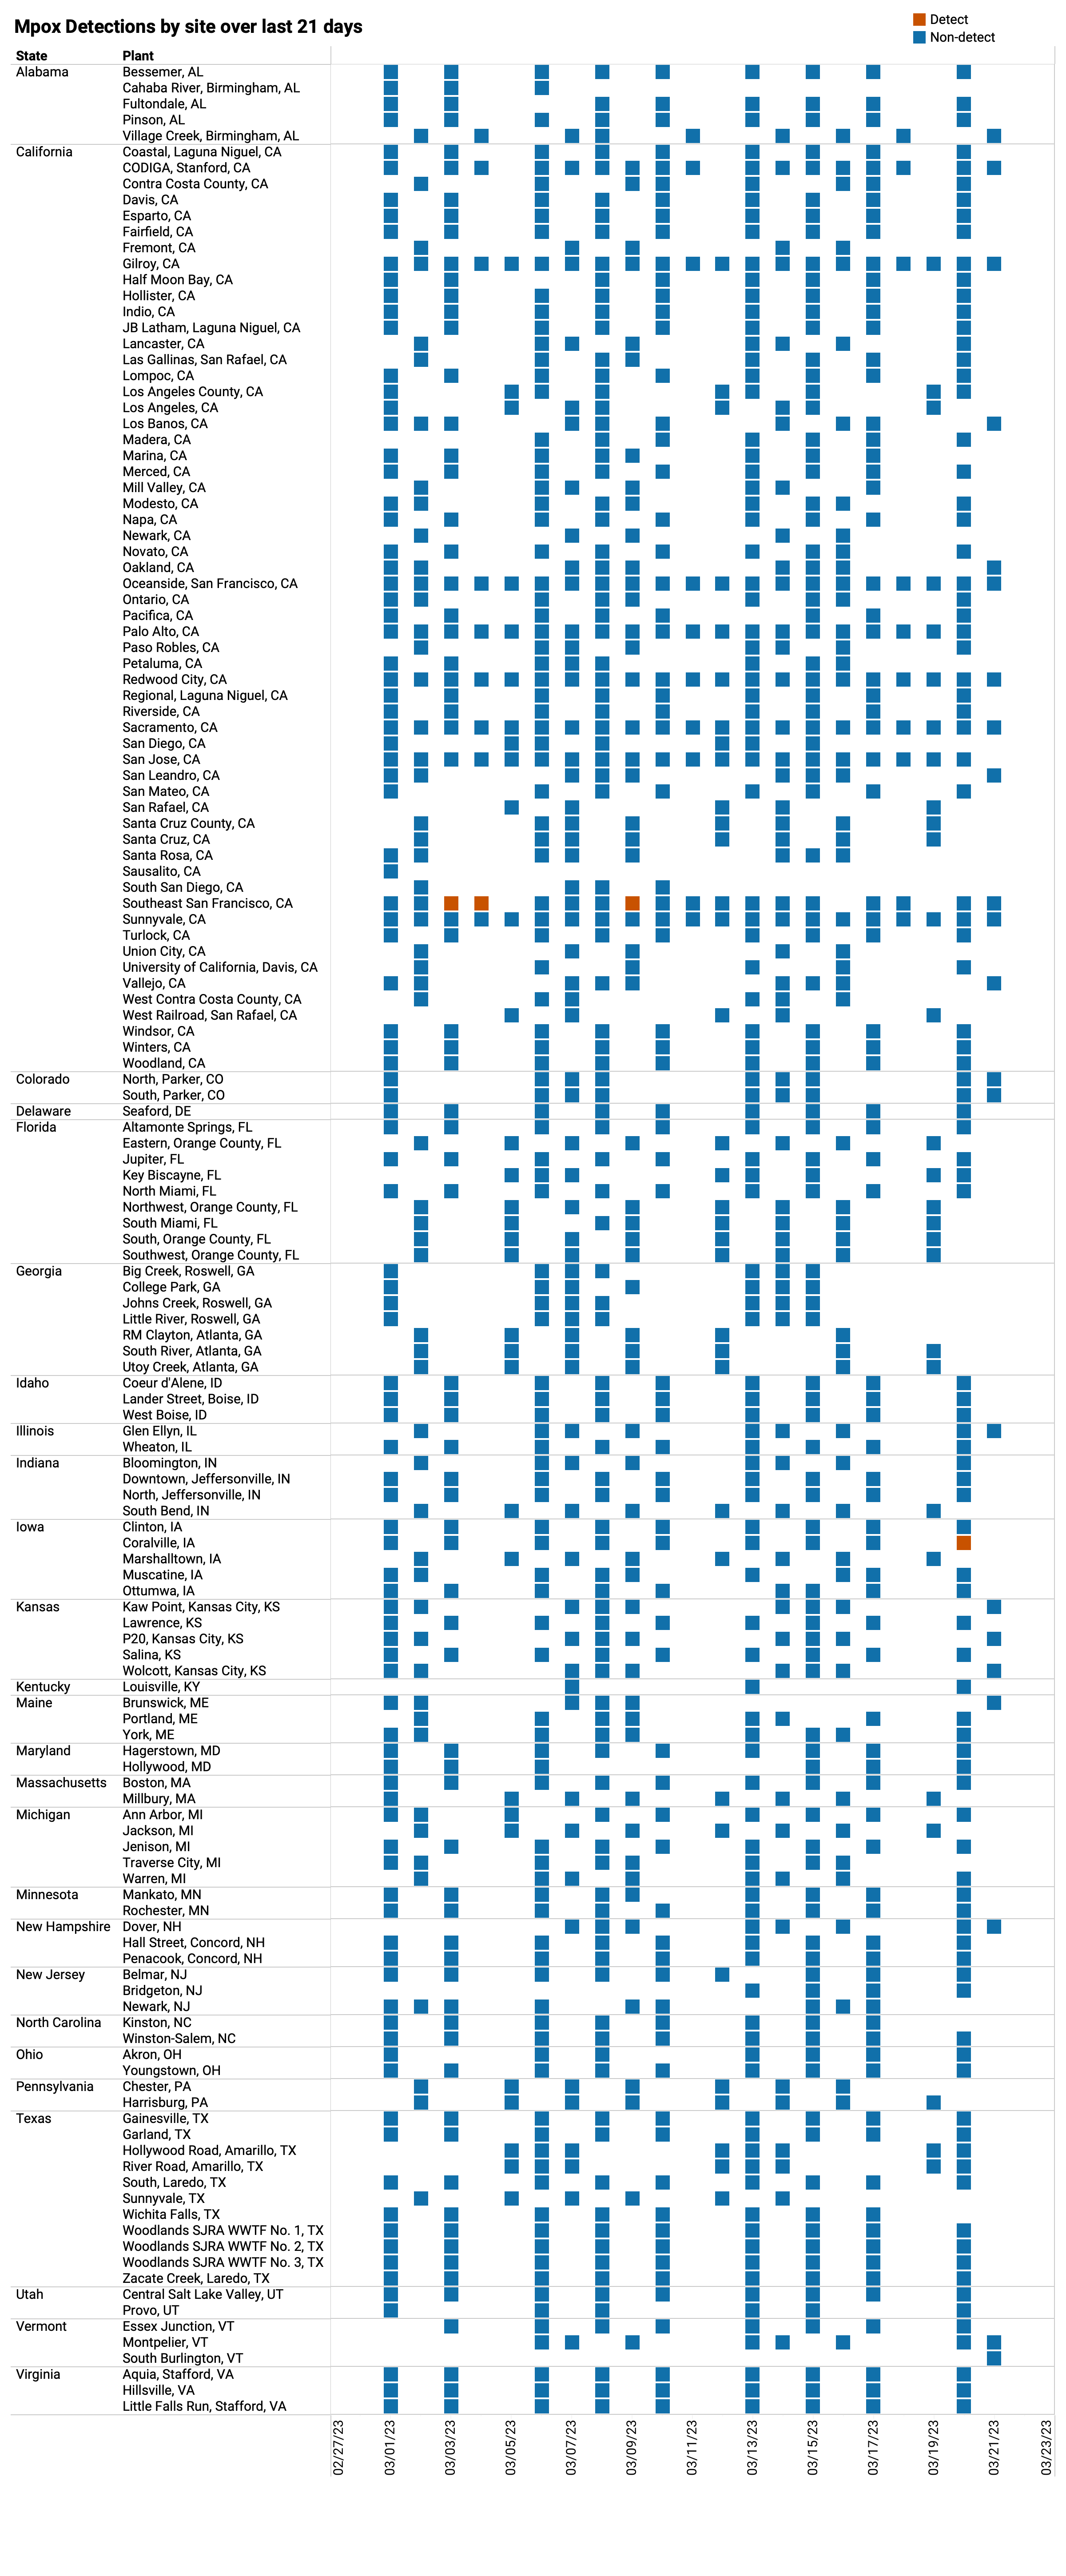
Detection of Mpox DNA in wastewater solids over past 21-days is rare
We rarely detected mpox DNA in samples from any site over the past three-weeks. Below you can see, in red, there have only been 4 positive samples out of 1,286 samples during the past 21 days. Outbreaks seem to be under control, but we will continue to monitor so that public health departments can respond if we see consistent detections and increases in concentrations in any sites. The chart below shows every plant in WWSCAN (approximately 150) as rows, and the last 21 days as columns (labeled at the bottom axis). White indicates no samples, blue is non-detect for mpox DNA and red is detect for MPOX DNA.